0001496099FALSE2023FY00014960992023-01-012023-12-310001496099us-gaap:CommonStockMember2023-01-012023-12-310001496099nmfc:EightPointTwoFivePercentageNotesDueTwoThousandTwentyEightMember2023-01-012023-12-3100014960992023-06-30iso4217:USD00014960992024-02-26xbrli:shares0001496099nmfc:CapitalMarketsDisruptionAndEconomicUncertaintyRiskMember2023-01-012023-12-310001496099nmfc:CreditMarketsRiskMember2023-01-012023-12-310001496099nmfc:GlobalEconomicPoliticalAndMarketConditionsRiskMember2023-01-012023-12-310001496099nmfc:WorldwideEconomicPoliticalRegulatoryAndFinancialMarketRIskMember2023-01-012023-12-310001496099nmfc:GeopoliticalUnrestTerroristAttacksOrActsOfWarRiskMember2023-01-012023-12-310001496099nmfc:InflationRiskMember2023-01-012023-12-310001496099nmfc:LegalRegulatoryAndPolicyUncertaintyInGovernmentRiskMember2023-01-012023-12-310001496099nmfc:CreditLossesRiskMember2023-01-012023-12-310001496099nmfc:TariffAndImportAndExportRegulationsRiskMember2023-01-012023-12-310001496099nmfc:PortfolioValueRiskMember2023-01-012023-12-310001496099nmfc:InvestmentObjectivesRiskMember2023-01-012023-12-310001496099nmfc:ConstraintOnOperationsByRegulationRiskMember2023-01-012023-12-310001496099nmfc:CompetitiveMarketRiskMember2023-01-012023-12-310001496099nmfc:FutureGrowthRiskMember2023-01-012023-12-310001496099nmfc:ManagementFeeAndIncentiveFeeRiskMember2023-01-012023-12-310001496099nmfc:InvestmentAdvisorIncentiveCompensationRiskMember2023-01-012023-12-310001496099nmfc:CapitalGainsIncentiveFeeRiskMember2023-01-012023-12-310001496099nmfc:SharedEmployeesRiskMember2023-01-012023-12-310001496099nmfc:AdditionalConsultingFeesRiskMember2023-01-012023-12-310001496099nmfc:LeverageRiskMember2023-01-012023-12-310001496099nmfc:HoldingsCreditFacilityMember2023-01-012023-12-31xbrli:pure0001496099nmfc:UnsecuredNotesMember2023-01-012023-12-310001496099nmfc:SBAGuaranteedDebenturesMember2023-01-012023-12-310001496099nmfc:DBCreditFacilityMember2023-01-012023-12-310001496099nmfc:NMFCCreditFacilityMember2023-01-012023-12-310001496099nmfc:NMNLCCreditFacilityIIMember2023-01-012023-12-310001496099nmfc:A2022ConvertibleNotesMember2023-01-012023-12-310001496099nmfc:CovenentRiskMember2023-01-012023-12-310001496099nmfc:CreditFacilityTermsRiskMember2023-01-012023-12-310001496099nmfc:ReverseRepurchaseAgreementRiskMember2023-01-012023-12-310001496099nmfc:DebtFundingRiskMember2023-01-012023-12-310001496099nmfc:AbilityToRaiseCapitalRiskMember2023-01-012023-12-310001496099nmfc:CapitalAndCreditMarketsVolatilityRiskMember2023-01-012023-12-310001496099nmfc:InterestRateVolatilityRiskMember2023-01-012023-12-310001496099nmfc:SmallBusinessAssociationRegulationsRiskMember2023-01-012023-12-310001496099nmfc:CapitalFundingRiskMember2023-01-012023-12-310001496099nmfc:RegulatedInvestmentCompanyTaxTreatmentRiskMember2023-01-012023-12-310001496099nmfc:AffiliateTransactionRestrictionsRiskMember2023-01-012023-12-310001496099nmfc:InvestmentAdvisorConflictOfInterestRiskMember2023-01-012023-12-310001496099nmfc:InvestmentCommitteeTheInvestmentAdvisorOrItsAffiliatesWithNonPublicInformationRiskMember2023-01-012023-12-310001496099nmfc:PortfolioValuationAndConflictOfInterestRiskMember2023-01-012023-12-310001496099nmfc:ConflictsOfInterestWithInvestmentAdvisorOrItsAffiliatesRiskMember2023-01-012023-12-310001496099nmfc:InvestmentManagementAgreementAndAdministrationAgreementRelatedPartyRiskMember2023-01-012023-12-310001496099nmfc:InvestmentAdvisorIndemnificationRiskMember2023-01-012023-12-310001496099nmfc:InvestmentAdvisorResignationRiskMember2023-01-012023-12-310001496099nmfc:AdministratorResignationRiskMember2023-01-012023-12-310001496099nmfc:BusinessDevelopmentCompanyRegulationImpactOnOperatingFlexibilityRiskMember2023-01-012023-12-310001496099nmfc:InvestmentsInQualifyingAssetsRiskMember2023-01-012023-12-310001496099nmfc:LimitationOnInvestmentInPublicCompaniesRiskMember2023-01-012023-12-310001496099nmfc:BusinessDevelopmentCompanyRegulationImpactOnInvestmentObjectivesAndStrategiesRiskMember2023-01-012023-12-310001496099nmfc:ReferralRelationshipRiskMember2023-01-012023-12-310001496099nmfc:FluctuationOfResultsDueToNatureOfTheBusinessRiskMember2023-01-012023-12-310001496099nmfc:ChangesImplementedByTheBoardOfDirectorsRiskMember2023-01-012023-12-310001496099nmfc:FederalIncomeTaxRiskMember2023-01-012023-12-310001496099nmfc:CurrentTaxLiabilityOnDistributionsReinvestedRiskMember2023-01-012023-12-310001496099nmfc:InabilityToPayDistributionsOrDecreasedDistributionsAndDistributionsMayBeReturnOfCapitalRiskMember2023-01-012023-12-310001496099nmfc:InabilityToPayDistributionsIfRecognizingTaxableIncomeWithoutReceivingCashRepresentingSuchIncomeRiskMember2023-01-012023-12-310001496099nmfc:TaxIssuesRiskRegardingBelowInvestmentGradeSecuritiesRiskMember2023-01-012023-12-310001496099nmfc:ChangesInLawsOrRegulationsRiskMember2023-01-012023-12-310001496099nmfc:TaxReformLegislationRiskMember2023-01-012023-12-310001496099nmfc:SecuritiesLitigationOrShareholderActivismRiskMember2023-01-012023-12-310001496099nmfc:GlobalClimateChangeRiskMember2023-01-012023-12-310001496099nmfc:SmallBusinessCreditAvailabilityActLeverageRiskMember2023-01-012023-12-310001496099nmfc:PublicTradedCompanyRiskMember2023-01-012023-12-310001496099nmfc:SarbanesOxleyActComplianceRiskMember2023-01-012023-12-310001496099nmfc:InformationSystemsFailuresRiskMember2023-01-012023-12-310001496099nmfc:InternalAndExternalCyberThreatsRiskMember2023-01-012023-12-310001496099nmfc:CyberAttacksRiskMember2023-01-012023-12-310001496099nmfc:RiskyInvestmentsPortfolioRiskMember2023-01-012023-12-310001496099nmfc:InvestmentStrategyRiskMember2023-01-012023-12-310001496099nmfc:InvestmentsInInvestmentsRelatedBelowInvestmentGradeRiskMember2023-01-012023-12-310001496099nmfc:LimitedIndustryPortfolioConcentrationRiskMember2023-01-012023-12-310001496099nmfc:UnsecuredInvestmentsRiskMember2023-01-012023-12-310001496099nmfc:InvestmentsInSecuritiesAndObligationsOfDistressedAndBankruptIssuersRiskMember2023-01-012023-12-310001496099nmfc:PortfolioCompanyDefaultRiskMember2023-01-012023-12-310001496099nmfc:InvestmentLiquidityRiskMember2023-01-012023-12-310001496099nmfc:PriceDeclinesAndIlliquidityInDebtMarketsRiskMember2023-01-012023-12-310001496099nmfc:FollowOnInvestmentRiskMember2023-01-012023-12-310001496099nmfc:PortfolioCompanyDebtSeniorityRiskMember2023-01-012023-12-310001496099nmfc:DispositionOfInvestmentsRiskMember2023-01-012023-12-310001496099nmfc:DebtInvestmentsSubordinatedToClaimsOfOthersRiskMember2023-01-012023-12-310001496099nmfc:SecondPriorityLiensOnCollateralRisksMember2023-01-012023-12-310001496099nmfc:LackOfControlOverPortfolioCompaniesRiskMember2023-01-012023-12-310001496099nmfc:LackOfInfluenceOverPortfolioCompanyDayToDayManagementAndPersonnelRetentionRiskMember2023-01-012023-12-310001496099nmfc:ImpactOnPortfolioCompaniesOfEconomicRecessionDownturnOrGovernmentSpendingRiskMember2023-01-012023-12-310001496099nmfc:ImpactOnPortfolioCompaniesOfChangesInGovernmentPrioritiesSpendingOrDelaysOrReductionsInAppropriationsRiskMember2023-01-012023-12-310001496099nmfc:ImpactOfDebtInvestmentPrepaymentsByPortfolioCompaniesRiskMember2023-01-012023-12-310001496099nmfc:GainOnEquityInvestmentsRiskMember2023-01-012023-12-310001496099nmfc:DueDiligenceAndConductOfPortfolioCompaniesRiskMember2023-01-012023-12-310001496099nmfc:ActualComparedToHistoricalPerformanceRiskMember2023-01-012023-12-310001496099nmfc:InvestmentInForeignSecuritiesAndHedgingRiskMember2023-01-012023-12-310001496099nmfc:LimitedAbilityToEnterIntoDerivativeAndFinancialCommitmentTransactionsRiskMember2023-01-012023-12-310001496099nmfc:FloatingRateDebtSecuritiesRiskMember2023-01-012023-12-310001496099nmfc:MarketPriceOfCommonStockRiskMember2023-01-012023-12-310001496099nmfc:InvestmentInEntityCommonStockRiskMember2023-01-012023-12-310001496099nmfc:CommonStockPriceRelatedToSubstantialSalesRiskMember2023-01-012023-12-310001496099nmfc:CommonStockPriceRelatedToLimitationsOnTakeoverAttemptRiskMember2023-01-012023-12-310001496099nmfc:CommonStockTradingAtADiscountToNetAssetValueRiskMember2023-01-012023-12-310001496099nmfc:InabilityToPayDistributionsOrDecreasedDistributionsRiskMember2023-01-012023-12-310001496099nmfc:DiscretionOverUseOfProceedsFromOfferingRiskMember2023-01-012023-12-310001496099nmfc:DilutedShareholderInterestRiskMember2023-01-012023-12-310001496099nmfc:VolatilityOfCommonStockIfPreferredStockIsIssuedRiskMember2023-01-012023-12-310001496099nmfc:AbilityToElectBoardOfDirectorsMembersForPreferredStockHoldersRiskMember2023-01-012023-12-3100014960992023-12-31iso4217:USDxbrli:shares00014960992023-10-012023-12-3100014960992023-09-3000014960992023-07-012023-09-3000014960992023-04-012023-06-3000014960992023-03-3100014960992023-01-012023-03-3100014960992022-12-3100014960992022-10-012022-12-3100014960992022-09-3000014960992022-07-012022-09-3000014960992022-06-3000014960992022-04-012022-06-3000014960992022-03-3100014960992022-01-012022-03-3100014960992022-02-232022-02-230001496099us-gaap:InvestmentUnaffiliatedIssuerMember2023-12-310001496099us-gaap:InvestmentUnaffiliatedIssuerMember2022-12-310001496099us-gaap:InvestmentAffiliatedIssuerNoncontrolledMember2023-12-310001496099us-gaap:InvestmentAffiliatedIssuerNoncontrolledMember2022-12-310001496099us-gaap:InvestmentAffiliatedIssuerControlledMember2023-12-310001496099us-gaap:InvestmentAffiliatedIssuerControlledMember2022-12-310001496099srt:AffiliatedEntityMember2023-12-310001496099srt:AffiliatedEntityMember2022-12-310001496099nmfc:HoldingsCreditFacilityMember2023-12-310001496099nmfc:HoldingsCreditFacilityMember2022-12-310001496099nmfc:DBCreditFacilityMember2023-12-310001496099nmfc:DBCreditFacilityMember2022-12-310001496099nmfc:NMFCCreditFacilityMember2023-12-310001496099nmfc:NMFCCreditFacilityMember2022-12-310001496099nmfc:NMNLCCreditFacilityIIMember2023-12-310001496099nmfc:NMNLCCreditFacilityIIMember2022-12-310001496099us-gaap:NonrelatedPartyMember2023-12-310001496099us-gaap:NonrelatedPartyMember2022-12-310001496099us-gaap:InvestmentUnaffiliatedIssuerMember2023-01-012023-12-310001496099us-gaap:InvestmentUnaffiliatedIssuerMember2022-01-012022-12-310001496099us-gaap:InvestmentUnaffiliatedIssuerMember2021-01-012021-12-310001496099us-gaap:InvestmentAffiliatedIssuerNoncontrolledMember2023-01-012023-12-310001496099us-gaap:InvestmentAffiliatedIssuerNoncontrolledMember2022-01-012022-12-310001496099us-gaap:InvestmentAffiliatedIssuerNoncontrolledMember2021-01-012021-12-310001496099us-gaap:InvestmentAffiliatedIssuerControlledMember2023-01-012023-12-310001496099us-gaap:InvestmentAffiliatedIssuerControlledMember2022-01-012022-12-310001496099us-gaap:InvestmentAffiliatedIssuerControlledMember2021-01-012021-12-3100014960992022-01-012022-12-3100014960992021-01-012021-12-310001496099us-gaap:NoncontrollingInterestMember2023-01-012023-12-310001496099us-gaap:NoncontrollingInterestMember2022-01-012022-12-310001496099us-gaap:NoncontrollingInterestMember2021-01-012021-12-310001496099us-gaap:ParentMember2023-01-012023-12-310001496099us-gaap:ParentMember2022-01-012022-12-310001496099us-gaap:ParentMember2021-01-012021-12-310001496099us-gaap:ParentMember2022-12-310001496099us-gaap:ParentMember2021-12-310001496099us-gaap:ParentMember2020-12-310001496099us-gaap:ParentMember2023-12-310001496099us-gaap:NoncontrollingInterestMember2023-12-310001496099us-gaap:NoncontrollingInterestMember2022-12-310001496099us-gaap:NoncontrollingInterestMember2021-12-3100014960992021-12-310001496099nmfc:InvestmentsIncludingDelayedDrawFacilitiesMember2023-01-012023-12-310001496099nmfc:InvestmentsIncludingDelayedDrawFacilitiesMember2022-01-012022-12-310001496099nmfc:InvestmentsIncludingDelayedDrawFacilitiesMember2021-01-012021-12-310001496099nmfc:InvestmentsExcludingDrawnRevolversMember2023-01-012023-12-310001496099nmfc:InvestmentsExcludingDrawnRevolversMember2022-01-012022-12-310001496099nmfc:InvestmentsExcludingDrawnRevolversMember2021-01-012021-12-310001496099nmfc:DrawnRevolvingCreditFacilitiesMember2023-01-012023-12-310001496099nmfc:DrawnRevolvingCreditFacilitiesMember2022-01-012022-12-310001496099nmfc:DrawnRevolvingCreditFacilitiesMember2021-01-012021-12-310001496099nmfc:DrawnRevolversMember2023-01-012023-12-310001496099nmfc:DrawnRevolversMember2022-01-012022-12-310001496099nmfc:DrawnRevolversMember2021-01-012021-12-310001496099nmfc:HoldingsCreditFacilityMember2022-01-012022-12-310001496099nmfc:HoldingsCreditFacilityMember2021-01-012021-12-310001496099nmfc:NMFCCreditFacilityMember2022-01-012022-12-310001496099nmfc:NMFCCreditFacilityMember2021-01-012021-12-310001496099nmfc:DBCreditFacilityMember2022-01-012022-12-310001496099nmfc:DBCreditFacilityMember2021-01-012021-12-310001496099nmfc:NMNLCCreditFacilityIIMember2022-01-012022-12-310001496099nmfc:NMNLCCreditFacilityIIMember2021-01-012021-12-3100014960992020-12-310001496099AAH Topco, LLC, First Lien - Drawn 12023-12-310001496099AAH Topco, LLC, First Lien 12023-12-310001496099AAH Topco, LLC, First Lien 22023-12-310001496099AAH Topco, LLC, First Lien - Drawn 22023-12-310001496099AAH Topco, LLC, Subordinated 12023-12-310001496099AAH Topco, LLC, Subordinated 22023-12-310001496099nmfc:AAHTopcoLLCMembernmfc:FundedDebtSecuritiesMember2023-12-310001496099Associations, Inc. First Lien 12023-12-310001496099Associations, Inc. First Lien 22023-12-310001496099Associations, Inc. First Lien 32023-12-310001496099Associations, Inc. First Lien 42023-12-310001496099Associations, Inc. First Lien 52023-12-310001496099Associations, Inc. First Lien 62023-12-310001496099Associations, Inc. First Lien - Drawn2023-12-310001496099nmfc:FundedDebtSecuritiesMembernmfc:AssociationsIncMember2023-12-310001496099Kaseya Inc. First Lien 2023-12-310001496099Kaseya Inc. First Lien - Drawn 12023-12-310001496099Kaseya Inc. First Lien - Drawn 22023-12-310001496099nmfc:FundedDebtSecuritiesMembernmfc:KaseyaIncMember2023-12-310001496099GC Waves Holdings, Inc. First Lien 12023-12-310001496099GC Waves Holdings, Inc. First Lien 22023-12-310001496099GC Waves Holdings, Inc. First Lien - Drawn2023-12-310001496099nmfc:FundedDebtSecuritiesMembernmfc:GCWavesHoldingsIncMember2023-12-310001496099GS Acquisitionco, Inc. First Lien 12023-12-310001496099GS Acquisitionco, Inc. First Lien 22023-12-310001496099nmfc:FundedDebtSecuritiesMembernmfc:GSAcquisitioncoIncMember2023-12-310001496099CentralSquare Technologies, LLC, Second Lien 12023-12-310001496099CentralSquare Technologies, LLC, Second Lien 22023-12-310001496099nmfc:FundedDebtSecuritiesMembernmfc:CentralSquareTechnologiesLLCMember2023-12-310001496099Infogain Corporation, First Lien 12023-12-310001496099Infogain Corporation, First Lien 22023-12-310001496099Infogain Corporation, Subordinated2023-12-310001496099nmfc:InfogainCorporationMembernmfc:FundedDebtSecuritiesMember2023-12-310001496099iCIMS, Inc. First Lien 12023-12-310001496099iCIMS, Inc. First Lien 22023-12-310001496099iCIMS, Inc. First Lien 32023-12-310001496099iCIMS, Inc. First Lien - Drawn2023-12-310001496099nmfc:FundedDebtSecuritiesMembernmfc:ICIMSIncMember2023-12-310001496099Deca Dental Holdings LLC, First Lien 12023-12-310001496099Deca Dental Holdings LLC, First Lien 22023-12-310001496099Deca Dental Holdings LLC, First Lien - Drawn2023-12-310001496099nmfc:FundedDebtSecuritiesMembernmfc:DecaDentalHoldingsLLCMember2023-12-310001496099MRI Software LLC, First Lien 12023-12-310001496099MRI Software LLC, First Lien 22023-12-310001496099MRI Software LLC, First Lien 32023-12-310001496099MRI Software LLC, First Lien 42023-12-310001496099MRI Software LLC, First Lien 52023-12-310001496099nmfc:FundedDebtSecuritiesMembernmfc:MRISoftwareLLCMember2023-12-310001496099Wealth Enhancement Group, LLC, First Lien 12023-12-310001496099Wealth Enhancement Group, LLC, First Lien - Drawn2023-12-310001496099Wealth Enhancement Group, LLC, First Lien 22023-12-310001496099Wealth Enhancement Group, LLC, First Lien 32023-12-310001496099Wealth Enhancement Group, LLC, Subrdinated2023-12-310001496099nmfc:FundedDebtSecuritiesMembernmfc:WealthEnhancementGroupLLCMember2023-12-310001496099Recorded Future, Inc. First Lien 12023-12-310001496099Recorded Future, Inc. First Lien 22023-12-310001496099nmfc:RecordedFutureIncMembernmfc:FundedDebtSecuritiesMember2023-12-310001496099Auctane Inc. (fka Stamps.com Inc.) First Lien 12023-12-310001496099Auctane Inc. (fka Stamps.com Inc.) First Lien 22023-12-310001496099nmfc:AuctaneIncFkaStampscomIncMembernmfc:FundedDebtSecuritiesMember2023-12-310001496099OEConnection LLC, Second Lien 12023-12-310001496099OEConnection LLC, Second Lien 22023-12-310001496099nmfc:FundedDebtSecuritiesMembernmfc:OEConnectionLLCMember2023-12-310001496099Foreside Financial Group, LLC, First Lien 12023-12-310001496099Foreside Financial Group, LLC, First Lien - Drawn2023-12-310001496099Foreside Financial Group, LLC, First Lien 22023-12-310001496099nmfc:FundedDebtSecuritiesMembernmfc:ForesideFinancialGroupLLCMember2023-12-310001496099KAMC Holdings, Inc, Second Lien 12023-12-310001496099KAMC Holdings, Inc, Second Lien 22023-12-310001496099nmfc:KAMCHoldingsIncMembernmfc:FundedDebtSecuritiesMember2023-12-310001496099IG Investments Holdings, LLC, First Lien 12023-12-310001496099IG Investments Holdings, LLC, First Lien 22023-12-310001496099nmfc:IGInvestmentsHoldingsLLCMembernmfc:FundedDebtSecuritiesMember2023-12-310001496099Granicus, Inc. First Lien 12023-12-310001496099Granicus, Inc. First Lien 22023-12-310001496099Granicus, Inc. First Lien 32023-12-310001496099Granicus, Inc. First Lien 42023-12-310001496099Granicus, Inc. First Lien - Drawn2023-12-310001496099nmfc:FundedDebtSecuritiesMembernmfc:GranicusIncMember2023-12-310001496099TigerConnect, Inc. First Lien 2023-12-310001496099TigerConnect, Inc. First Lien - Drawn2023-12-310001496099nmfc:TigerConnectIncMembernmfc:FundedDebtSecuritiesMember2023-12-310001496099Diligent Corporation, First Lien 12023-12-310001496099Diligent Corporation, First Lien 22023-12-310001496099Diligent Corporation, First Lien 32023-12-310001496099Diligent Corporation, First Lien - Drawn2023-12-310001496099nmfc:DiligentCorporationMembernmfc:FundedDebtSecuritiesMember2023-12-310001496099OA Buyer, Inc. First Lien 12023-12-310001496099OA Buyer, Inc. First Lien 22023-12-310001496099nmfc:OABuyerIncMembernmfc:FundedDebtSecuritiesMember2023-12-310001496099NMC Crimson Holdings, Inc. First Lien 12023-12-310001496099NMC Crimson Holdings, Inc. First Lien - Drawn2023-12-310001496099NMC Crimson Holdings, Inc. First Lien 22023-12-310001496099nmfc:NMCCrimsonHoldingsIncMembernmfc:FundedDebtSecuritiesMember2023-12-310001496099Foundational Education Group, Inc. Second Lien 12023-12-310001496099Foundational Education Group, Inc. Second Lien 22023-12-310001496099nmfc:FundedDebtSecuritiesMembernmfc:FoundationalEducationGroupIncMember2023-12-310001496099Fortis Solutions Group, LLC, First Lien 12023-12-310001496099Fortis Solutions Group, LLC, First Lien 22023-12-310001496099Fortis Solutions Group, LLC, First Lien 32023-12-310001496099Fortis Solutions Group, LLC, First Lien - Drawn 12023-12-310001496099Fortis Solutions Group, LLC, First Lien - Drawn 22023-12-310001496099Fortis Solutions Group, LLC, First Lien 42023-12-310001496099nmfc:FortisSolutionsGroupLLCMembernmfc:FundedDebtSecuritiesMember2023-12-310001496099PetVet Care Centers, LLC, First Lien2023-12-310001496099Syndigo LLC, Second Lien 12023-12-310001496099Syndigo LLC, Second Lien 22023-12-310001496099nmfc:SyndigoLLCMembernmfc:FundedDebtSecuritiesMember2023-12-310001496099ACI Group Holdings, Inc. First Lien 1 2023-12-310001496099ACI Group Holdings, Inc. First Lien 22023-12-310001496099ACI Group Holdings, Inc. First Lien - Drawn 1 2023-12-310001496099ACI Group Holdings, Inc. First Lien - Drawn 22023-12-310001496099nmfc:ACIGroupHoldingsIncMembernmfc:FundedDebtSecuritiesMember2023-12-310001496099CRCI Longhorn Holdings, Inc. Second Lien 12023-12-310001496099CRCI Longhorn Holdings, Inc. Second Lien 22023-12-310001496099nmfc:FundedDebtSecuritiesMembernmfc:CRCILonghornHoldingsIncMember2023-12-310001496099Idera, Inc. Secnd Lien 12023-12-310001496099Idera, Inc. Secnd Lien 22023-12-310001496099nmfc:IderaIncMembernmfc:FundedDebtSecuritiesMember2023-12-310001496099AmeriVet Partners Management, Inc. First Lien 12023-12-310001496099AmeriVet Partners Management, Inc. First Lien 22023-12-310001496099AmeriVet Partners Management, Inc. First Lien - Drawn2023-12-310001496099nmfc:AmeriVetPartnersManagementIncMembernmfc:FundedDebtSecuritiesMember2023-12-310001496099DOCS, MSO, LLC, First Lien 12023-12-310001496099DOCS, MSO, LLC, First Lien 22023-12-310001496099nmfc:FundedDebtSecuritiesMembernmfc:DOCSMSOLLCMember2023-12-310001496099HS Purchaser, LLC / Help/Systems Holdings, Inc. Second Lien 12023-12-310001496099HS Purchaser, LLC / Help/Systems Holdings, Inc. Second Lien 22023-12-310001496099nmfc:FundedDebtSecuritiesMembernmfc:HSPurchaserLLCHelpSystemsHoldingsIncMember2023-12-310001496099Xactly Corporation, First Lien2023-12-310001496099Sierra Enterprises, LLC, First Lien2023-12-310001496099FS WhiteWater Borrower, LLC, First Lien 12023-12-310001496099FS WhiteWater Borrower, LLC, First Lien - Drawn 12023-12-310001496099FS WhiteWater Borrower, LLC, First Lien 22023-12-310001496099FS WhiteWater Borrower, LLC, First Lien 32023-12-310001496099FS WhiteWater Borrower, LLC, First Lien - Drawn 22023-12-310001496099nmfc:FSWhiteWaterBorrowerLLCMembernmfc:FundedDebtSecuritiesMember2023-12-310001496099Bullhorn, Inc. First Lien 12023-12-310001496099Bullhorn, Inc. First Lien 22023-12-310001496099Bullhorn, Inc. First Lien 32023-12-310001496099Bullhorn, Inc. First Lien 42023-12-310001496099Bullhorn, Inc. First Lien 52023-12-310001496099nmfc:BullhornIncMembernmfc:FundedDebtSecuritiesMember2023-12-310001496099YLG Holdings, Inc. First Lien 12023-12-310001496099YLG Holdings, Inc. First Lien 22023-12-310001496099YLG Holdings, Inc. First Lien - Drawn 12023-12-310001496099YLG Holdings, Inc. First Lien - Drawn 22023-12-310001496099nmfc:FundedDebtSecuritiesMembernmfc:YLGHoldingsIncMember2023-12-310001496099TMK Hawk Parent, Corp, First Lien 12023-12-310001496099TMK Hawk Parent, Corp, First Lien 22023-12-310001496099TMK Hawk Parent, Corp, First Lien 32023-12-310001496099TMK Hawk Parent, Corp, First Lien 42023-12-310001496099nmfc:TMKHawkParentCorpMembernmfc:FundedDebtSecuritiesMember2023-12-310001496099American Achievement Corporation (aka AAC Holding Corp.) First Lien 12023-12-310001496099American Achievement Corporation (aka AAC Holding Corp.) First Lien 22023-12-310001496099American Achievement Corporation (aka AAC Holding Corp.) Subordinated2023-12-310001496099nmfc:FundedDebtSecuritiesMembernmfc:AmericanAchievementCorporationAkaAACHoldingCorpMember2023-12-310001496099MED Parentco, LP, Second Lien 2023-12-310001496099Brave Parent Holdings, Inc. First Lien2023-12-310001496099Cardinal Parent, Inc. First Lien 2023-12-310001496099Cardinal Parent, Inc. Second Lien2023-12-310001496099nmfc:FundedDebtSecuritiesMembernmfc:CardinalParentIncMember2023-12-310001496099Convey Health Solutions, Inc. First Lien 12023-12-310001496099Convey Health Solutions, Inc. First Lien 22023-12-310001496099nmfc:FundedDebtSecuritiesMembernmfc:ConveyHealthSolutionsIncMember2023-12-310001496099Trinity Air Consultants Holdings Corporation, First Lien 12023-12-310001496099Trinity Air Consultants Holdings Corporation, First Lien - Drawn 2023-12-310001496099nmfc:FundedDebtSecuritiesMembernmfc:TrinityAirConsultantsHoldingsCorporationMember2023-12-310001496099Groundworks, LLC, First Lien2023-12-310001496099Notorious Topco, LLC First Lien 12023-12-310001496099Notorious Topco, LLC First Lien 22023-12-310001496099Notorious Topco, LLC First Lien - Drawn 12023-12-310001496099Notorious Topco, LLC First Lien - Drawn 22023-12-310001496099nmfc:FundedDebtSecuritiesMembernmfc:NotoriousTopcoLLCMember2023-12-310001496099Pioneer Buyer I, LLC, First Lien 12023-12-310001496099Pioneer Buyer I, LLC, First Lien 22023-12-310001496099nmfc:PioneerBuyerILLCMembernmfc:FundedDebtSecuritiesMember2023-12-310001496099DG Investment Intermediate Holdings 2, Inc. Second Lien 2023-12-310001496099Power Grid Holdings, Inc. First Lien 2023-12-310001496099Power Grid Holdings, Inc. First Lien - Drawn2023-12-310001496099nmfc:PowerGridHoldingsInc.Membernmfc:FundedDebtSecuritiesMember2023-12-310001496099Avalara, Inc First Lien 2023-12-310001496099Coyote Buyer, LLC First Lien 12023-12-310001496099Coyote Buyer, LLC First Lien 22023-12-310001496099nmfc:CoyoteBuyerLLCMembernmfc:FundedDebtSecuritiesMember2023-12-310001496099Oranje Holdco, Inc. First Lien 12023-12-310001496099Oranje Holdco, Inc. First Lien 22023-12-310001496099nmfc:OranjeHoldcoInc.Membernmfc:FundedDebtSecuritiesMember2023-12-310001496099EAB Global, Inc. Second Lien 2023-12-310001496099Kele Holdco, Inc. First Lien 2023-12-310001496099Coupa Holdings, LLC First Lien 12023-12-310001496099Coupa Holdings, LLC First Lien 22023-12-310001496099nmfc:FundedDebtSecuritiesMembernmfc:CoupaHoldingsLLCMember2023-12-310001496099Daxko Acquisition Corporation, First Lien 12023-12-310001496099Daxko Acquisition Corporation, First Lien 22023-12-310001496099Daxko Acquisition Corporation, First Lien - Drawn 12023-12-310001496099Daxko Acquisition Corporation, First Lien - Drawn 22023-12-310001496099nmfc:DaxkoAcquisitionCorporationMembernmfc:FundedDebtSecuritiesMember2023-12-310001496099IMO Investor Holdings, Inc. First Lien 2023-12-310001496099IMO Investor Holdings, Inc. First Lien - Drawn 12023-12-310001496099IMO Investor Holdings, Inc. First Lien - Drawn 22023-12-310001496099nmfc:IMOInvestorHoldingsIncMembernmfc:FundedDebtSecuritiesMember2023-12-310001496099Alegeus Technologies Holdings Corp. First Lien2023-12-310001496099Calabrio, Inc. First Lien 2023-12-310001496099Calabrio, Inc. First Lien - Drawn2023-12-310001496099nmfc:FundedDebtSecuritiesMembernmfc:CalabrioIncMember2023-12-310001496099USRP Holdings, Inc. First Lien 12023-12-310001496099USRP Holdings, Inc. First Lien 22023-12-310001496099nmfc:USRPHoldingsIncMembernmfc:FundedDebtSecuritiesMember2023-12-310001496099CFS Management, LLC, First Lien 12023-12-310001496099CFS Management, LLC, First Lien 22023-12-310001496099nmfc:CFSManagementLLCMembernmfc:FundedDebtSecuritiesMember2023-12-310001496099CHA Holdings, Inc. Second Lien 12023-12-310001496099CHA Holdings, Inc. Second Lien 22023-12-310001496099nmfc:FundedDebtSecuritiesMembernmfc:CHAHoldingsIncMember2023-12-310001496099Anaplan, Inc. First Lien2023-12-310001496099Specialtycare, Inc. First Lien 12023-12-310001496099Specialtycare, Inc. First Lien - Drawn 2023-12-310001496099Specialtycare, Inc. First Lien 22023-12-310001496099nmfc:FundedDebtSecuritiesMembernmfc:SpecialtycareIncMember2023-12-310001496099Quartz Holding Company, Second Lien2023-12-310001496099CG Group Holdings, LLC,First Lien 2023-12-310001496099CG Group Holdings, LLC,First Lien - Drawn2023-12-310001496099nmfc:CGGroupHoldingsLLCMembernmfc:FundedDebtSecuritiesMember2023-12-310001496099KPSKY Acquisition Inc. First Lien 12023-12-310001496099KPSKY Acquisition Inc. First Lien - Drawn 12023-12-310001496099KPSKY Acquisition Inc. First Lien 22023-12-310001496099KPSKY Acquisition Inc. First Lien - Drawn 22023-12-310001496099nmfc:FundedDebtSecuritiesMembernmfc:KPSKYAcquisitionIncMember2023-12-310001496099Ncontracts, LLC, First Lien 2023-12-310001496099Virtusa Corporation, Subordinated 2023-12-310001496099PPVA Black Elk (Equity) LLC, Subordinated 2023-12-310001496099TRC Companies L.L.C. (fka Energize Holdco LLC) Second Lien2023-12-310001496099DS Admiral Bidco, LLC, First Lien 2023-12-310001496099PPV Intermediate Holdings, LLC First Lien 2023-12-310001496099Safety Borrower Holdings LLC, First Lien 2023-12-310001496099Safety Borrower Holdings LLC, First Lien - Drawn2023-12-310001496099nmfc:FundedDebtSecuritiesMembernmfc:SafetyBorrowerHoldingsLLCMember2023-12-310001496099Transcendia Holdings, Inc. Second Lien 2023-12-310001496099Community Brands ParentCo, LLC, First Lien 2023-12-310001496099Sun Acquirer Corp. First Lien 12023-12-310001496099Sun Acquirer Corp. First Lien 22023-12-310001496099Sun Acquirer Corp. First Lien - Drawn2023-12-310001496099nmfc:SunAcquirerCorpMembernmfc:FundedDebtSecuritiesMember2023-12-310001496099Houghton Mifflin Harcourt Company, First Lien2023-12-310001496099Greenway Health, LLC, First Lien2023-12-310001496099Appriss Health, LLC, First Lien2023-12-310001496099Pye-Barker Fire & Safety, LLC, First Lien2023-12-310001496099Healthspan Buyer, LLC, First Lien2023-12-310001496099Cube Industrials Buyer, Inc. First Lien2023-12-310001496099CommerceHub, Inc. First Lien2023-12-310001496099Project Power Buyer, LLC, First Lien2023-12-310001496099Next Holdco, LLC, First Lien 2023-12-310001496099DCA Investment Holding, LLC, First Lien 2023-12-310001496099DCA Investment Holding, LLC, First Lien - Drawn2023-12-310001496099nmfc:DCAInvestmentHoldingLLCMembernmfc:FundedDebtSecuritiesMember2023-12-310001496099New Trojan Parent, Inc. Second Lien 2023-12-310001496099PPVA Fund, L.P., Collateralized Financing2023-12-310001496099country:USnmfc:FundedDebtSecuritiesMemberus-gaap:InvestmentUnaffiliatedIssuerMember2023-12-310001496099Aston FinCo S.a r.l. / Aston US Finco, LLC, Second lien2023-12-310001496099Integro Parent Inc., First lien 12023-12-310001496099Integro Parent Inc., First lien 22023-12-310001496099Integro Parent Inc., Second lien2023-12-310001496099nmfc:IntegroParentIncMembernmfc:FundedDebtSecuritiesMember2023-12-310001496099nmfc:FundedDebtSecuritiesMembercountry:GBus-gaap:InvestmentUnaffiliatedIssuerMember2023-12-310001496099Tennessee Bidco Limited, First lien 12023-12-31iso4217:GBP0001496099Tennessee Bidco Limited, First lien 22023-12-310001496099Tennessee Bidco Limited, First lien 32023-12-310001496099Tennessee Bidco Limited, First lien 42023-12-310001496099Tennessee Bidco Limited, First lien 52023-12-31iso4217:EUR0001496099nmfc:FundedDebtSecuritiesMembernmfc:TennesseeBidcoLimitedMember2023-12-310001496099nmfc:FundedDebtSecuritiesMembercountry:JEus-gaap:InvestmentUnaffiliatedIssuerMember2023-12-310001496099Atlas AU Bidco Pty Ltd, First Lien 12023-12-310001496099Atlas AU Bidco Pty Ltd, First Lien 22023-12-310001496099nmfc:FundedDebtSecuritiesMembernmfc:AtlasAUBidcoPtyLtdMember2023-12-310001496099nmfc:FundedDebtSecuritiesMembercountry:AUus-gaap:InvestmentUnaffiliatedIssuerMember2023-12-310001496099nmfc:FundedDebtSecuritiesMemberus-gaap:InvestmentUnaffiliatedIssuerMember2023-12-310001496099Dealer Tire Holdings, LLC, Preferred shares2023-12-310001496099Symplr Software Intermediate Holdings, Inc., Preferred shares 12023-12-310001496099Symplr Software Intermediate Holdings, Inc., Preferred shares 22023-12-310001496099nmfc:SymplrSoftwareIntermediateHoldingsIncMemberus-gaap:EquitySecuritiesMember2023-12-310001496099Knockout Intermediate Holdings I Inc., Preferred shares2023-12-310001496099ACI Parent Inc., Preferred shares2023-12-310001496099Project Essential Super Parent, Inc., Preferred shares2023-12-310001496099Diligent Preferred Issuer, Inc., Preferred shares2023-12-310001496099OEC Holdco, LLC, Preferred shares2023-12-310001496099HB Wealth Management, LLC, Preferred shares2023-12-310001496099FS WhiteWater Holdings, LLC, Ordinary shares2023-12-310001496099OA Topco, L.P., Ordinary shares2023-12-310001496099Appriss Health Intermediate Holdings, Inc., Preferred shares2023-12-310001496099Pioneer Topco I, L.P., Ordinary shares2023-12-310001496099GEDC Equity, LLC, Ordinary shares2023-12-310001496099Ancora Acquisition LLC, Preferred shares2023-12-310001496099AAC Lender Holdings, LLC, Ordinary shares2023-12-310001496099country:USus-gaap:EquitySecuritiesMemberus-gaap:InvestmentUnaffiliatedIssuerMember2023-12-310001496099Bach Special Limited (Bach Preference Limited), Preferred shares2023-12-310001496099country:HKus-gaap:EquitySecuritiesMemberus-gaap:InvestmentUnaffiliatedIssuerMember2023-12-310001496099us-gaap:EquitySecuritiesMemberus-gaap:InvestmentUnaffiliatedIssuerMember2023-12-310001496099nmfc:FundedSecuritiesMemberus-gaap:InvestmentUnaffiliatedIssuerMember2023-12-310001496099Coupa Holdings, LLC First lien - Undrawn 12023-12-310001496099Coupa Holdings, LLC First lien - Undrawn 22023-12-310001496099nmfc:UnfundedDebtSecuritiesMembernmfc:CoupaHoldingsLLCMember2023-12-310001496099PetVet Care Centers, LLC, First lien - Undrawn 12023-12-310001496099PetVet Care Centers, LLC, First lien - Undrawn 22023-12-310001496099nmfc:UnfundedDebtSecuritiesMembernmfc:PetVetCareCentersLLCMember2023-12-310001496099American Achievement Corporation (aka AAC Holding Corp.), First lien - Undrawn2023-12-310001496099Safety Borrower Holdings LLC, First lien - Undrawn2023-12-310001496099Project Power Buyer, LLC, First lien - Undrawn2023-12-310001496099Appriss Health, LLC, First lien - Undrawn2023-12-310001496099PPV Intermediate Holdings, LLC, First lien - Undrawn2023-12-310001496099Coyote Buyer, LLC, First lien - Undrawn2023-12-310001496099Bullhorn, Inc., First lien - Undrawn2023-12-310001496099Wealth Enhancement Group, LLC, First lien - Undrawn 12023-12-310001496099Wealth Enhancement Group, LLC, First lien - Undrawn 22023-12-310001496099nmfc:UnfundedDebtSecuritiesMembernmfc:WealthEnhancementGroupLLCMember2023-12-310001496099USRP Holdings, Inc., First lien - Undrawn2023-12-310001496099Daxko Acquisition Corporation, First lien - Undrawn 12023-12-310001496099Daxko Acquisition Corporation, First lien - Undrawn 22023-12-310001496099nmfc:DaxkoAcquisitionCorporationMembernmfc:UnfundedDebtSecuritiesMember2023-12-310001496099Kele Holdco, Inc., First lien - Undrawn2023-12-310001496099Xactly Corporation, First lien - Undrawn2023-12-310001496099AmeriVet Partners Management, Inc., First lien - Undrawn2023-12-310001496099Associations, Inc., First lien - Undrawn2023-12-310001496099Foreside Financial Group, LLC, First lien - Undrawn 12023-12-310001496099Foreside Financial Group, LLC, First lien - Undrawn 22023-12-310001496099nmfc:UnfundedDebtSecuritiesMembernmfc:ForesideFinancialGroupLLCMember2023-12-310001496099Granicus, Inc., First lien - Undrawn 22023-12-310001496099Trinity Air Consultants Holdings Corporation, First lien - Undrawn 12023-12-310001496099Trinity Air Consultants Holdings Corporation, First lien - Undrawn 22023-12-310001496099nmfc:UnfundedDebtSecuritiesMembernmfc:TrinityAirConsultantsHoldingsCorporationMember2023-12-310001496099Pye-Barker Fire & Safety, LLC, First lien - Undrawn2023-12-310001496099Recorded Future, Inc., First lien - Undrawn2023-12-310001496099YLG Holdings, Inc., First lien - Undrawn 12023-12-310001496099YLG Holdings, Inc., First lien - Undrawn 22023-12-310001496099nmfc:UnfundedDebtSecuritiesMembernmfc:YLGHoldingsIncMember2023-12-310001496099Avalara, Inc., First lien - Undrawn2023-12-310001496099iCIMS, Inc., First lien - Undrawn 12023-12-310001496099iCIMS, Inc., First lien - Undrawn 22023-12-310001496099iCIMS, Inc., First lien - Undrawn 32023-12-310001496099nmfc:UnfundedDebtSecuritiesMembernmfc:ICIMSIncMember2023-12-310001496099Kaseya Inc., First lien - Undrawn 12023-12-310001496099Kaseya Inc., First lien - Undrawn 22023-12-310001496099nmfc:UnfundedDebtSecuritiesMembernmfc:KaseyaIncMember2023-12-310001496099Oranje Holdco, Inc., First lien - Undrawn2023-12-310001496099IG Investments Holdings, LLC, First lien - Undrawn2023-12-310001496099GS Acquisitionco, Inc., First lien - Undrawn2023-12-310001496099Pioneer Buyer I, LLC, First lien - Undrawn2023-12-310001496099Infogain Corporation, First lien - Undrawn2023-12-310001496099GC Waves Holdings, Inc., First lien - Undrawn2023-12-310001496099OA Buyer, Inc., First lien - Undrawn2023-12-310001496099AAH Topco, LLC, First lien - Undrawn2023-12-310001496099Next Holdco, LLC, First lien - Undrawn 12023-12-310001496099Next Holdco, LLC, First lien - Undrawn 22023-12-310001496099nmfc:UnfundedDebtSecuritiesMembernmfc:NextHoldcoLLCMember2023-12-310001496099Cube Industrials Buyer, Inc., First lien - Undrawn2023-12-310001496099MRI Software LLC, First lien - Undrawn2023-12-310001496099Calabrio, Inc., First lien - Undrawn2023-12-310001496099Brave Parent Holdings, Inc., First lien - Undrawn 12023-12-310001496099Brave Parent Holdings, Inc.n, First lien - Undrawn 22023-12-310001496099nmfc:UnfundedDebtSecuritiesMembernmfc:BraveParentHoldingsIncMember2023-12-310001496099Deca Dental Holdings LLC, First lien - Undrawn2023-12-310001496099Sun Acquirer Corp., First lien - Undrawn2023-12-310001496099CG Group Holdings, LLC, First lien - Undrawn2023-12-310001496099Ncontracts, LLC, First lien - Undrawn 12023-12-310001496099Ncontracts, LLC, First lien - Undrawn 22023-12-310001496099nmfc:UnfundedDebtSecuritiesMembernmfc:NcontractsLLCMember2023-12-310001496099Healthspan Buyer, LLC, First lien - Undrawn2023-12-310001496099KPSKY Acquisition Inc., First lien - Undrawn2023-12-310001496099Specialtycare, Inc., First lien - Undrawn2023-12-310001496099Groundworks, LLC, First lien - Undrawn 12023-12-310001496099Groundworks, LLC, First lien - Undrawn 22023-12-310001496099nmfc:UnfundedDebtSecuritiesMembernmfc:GroundworksLLCMember2023-12-310001496099FS WhiteWater Borrower, LLC, First lien - Undrawn 12023-12-310001496099FS WhiteWater Borrower, LLC, First lien - Undrawn 22023-12-310001496099nmfc:UnfundedDebtSecuritiesMembernmfc:FSWhiteWaterBorrowerLLCMember2023-12-310001496099IMO Investor Holdings, Inc., First lien - Undrawn 12023-12-310001496099IMO Investor Holdings, Inc., First lien - Undrawn 22023-12-310001496099nmfc:UnfundedDebtSecuritiesMembernmfc:IMOInvestorHoldingsIncMember2023-12-310001496099Diligent Corporation , First lien - Undrawn2023-12-310001496099Community Brands ParentCo, LLC, First lien - Undrawn 12023-12-310001496099Community Brands ParentCo, LLC, First lien - Undrawn 22023-12-310001496099nmfc:UnfundedDebtSecuritiesMembernmfc:CommunityBrandsParentCoLLCMember2023-12-310001496099Power Grid Holdings, Inc., First lien - Undrawn2023-12-310001496099DOCS, MSO, LLC, First lien - Undrawn2023-12-310001496099TigerConnect, Inc., First lien - Undrawn 12023-12-310001496099TigerConnect, Inc., First lien - Undrawn 22023-12-310001496099nmfc:TigerConnectIncMembernmfc:UnfundedDebtSecuritiesMember2023-12-310001496099Fortis Solutions Group, LLC, First lien - Undrawn 12023-12-310001496099Fortis Solutions Group, LLC, First lien - Undrawn 22023-12-310001496099nmfc:UnfundedDebtSecuritiesMembernmfc:FortisSolutionsGroupLLCMember2023-12-310001496099Notorious Topco, LLC, First lien - Undrawn2023-12-310001496099ACI Group Holdings, Inc., First lien - Undrawn 12023-12-310001496099ACI Group Holdings, Inc., First lien - Undrawn 22023-12-310001496099nmfc:UnfundedDebtSecuritiesMembernmfc:ACIGroupHoldingsIncMember2023-12-310001496099nmfc:UnfundedDebtSecuritiesMembercountry:USus-gaap:InvestmentAffiliatedIssuerNoncontrolledMember2023-12-310001496099Atlas AU Bidco Pty Ltd, First lien - Undrawn2023-12-310001496099nmfc:UnfundedDebtSecuritiesMembercountry:AUus-gaap:InvestmentUnaffiliatedIssuerMember2023-12-310001496099nmfc:UnfundedDebtSecuritiesMemberus-gaap:InvestmentAffiliatedIssuerNoncontrolledMember2023-12-310001496099Edmentum Ultimate Holdings, LLC, Subordinated2023-12-310001496099Eagle Infrastructure Services, LLC (fka FR Arsenal Holdings II Corp.), First lien 12023-12-310001496099Eagle Infrastructure Services, LLC (fka FR Arsenal Holdings II Corp.), First lien 22023-12-310001496099nmfc:FundedDebtSecuritiesMembernmfc:EagleInfrastructureServicesLLCFkaFRArsenalHoldingsIICorpMemberMember2023-12-310001496099Permian Trust, First lien 12023-12-310001496099Permian Trust, First lien 22023-12-310001496099nmfc:PermianTrustMembernmfc:FundedDebtSecuritiesMember2023-12-310001496099country:USnmfc:FundedDebtSecuritiesMemberus-gaap:InvestmentAffiliatedIssuerNoncontrolledMember2023-12-310001496099TVG-Edmentum Holdings, LLC, Ordinary shares2023-12-310001496099Eagle Infrastructure Super HoldCo, LLC, Ordinary shares2023-12-310001496099Sierra Hamilton Holdings Corporation, Ordinary shares 12023-12-310001496099Sierra Hamilton Holdings Corporation, Ordinary shares 22023-12-310001496099nmfc:EducationManagementCorporationMemberus-gaap:EquitySecuritiesMember2023-12-310001496099country:USus-gaap:EquitySecuritiesMemberus-gaap:InvestmentAffiliatedIssuerNoncontrolledMember2023-12-310001496099New Benevis Holdco, Inc., First lien 12023-12-310001496099New Benevis Holdco, Inc., First lien 22023-12-310001496099New Benevis Holdco, Inc., First lien 32023-12-310001496099New Benevis Holdco, Inc., Subordinated2023-12-310001496099nmfc:NewBenevisHoldcoIncMembernmfc:FundedDebtSecuritiesMember2023-12-310001496099New Permian Holdco, L.L.C., First lien2023-12-310001496099New Permian Holdco, L.L.C., First lien - Drawn2023-12-310001496099nmfc:NewPermianHoldcoLLCMembernmfc:FundedDebtSecuritiesMember2023-12-310001496099UniTek Global Services, Inc., Second lien 12023-12-310001496099UniTek Global Services, Inc., Second lien 22023-12-310001496099nmfc:FundedDebtSecuritiesMembernmfc:UniTekGlobalServicesIncMember2023-12-310001496099National HME, Inc., Second lien2023-12-310001496099nmfc:NationalHMEIncMembercountry:USus-gaap:InvestmentAffiliatedIssuerControlledMember2023-12-310001496099NMFC Senior Loan Program III LLC, Membership interest2023-12-310001496099NMFC Senior Loan Program IV LLC, Membership interest2023-12-310001496099NM NL Holdings, L.P., Membership interest2023-12-310001496099New Benevis Topco, LLC, Ordinary shares 12023-12-310001496099New Benevis Topco, LLC, Ordinary shares 22023-12-310001496099New Benevis Topco, LLC, Ordinary shares 32023-12-310001496099nmfc:NewBenevisTopcoLLCMemberus-gaap:EquitySecuritiesMember2023-12-310001496099UniTek Global Services, Inc., Preferred shares 12023-12-310001496099UniTek Global Services, Inc., Preferred shares 22023-12-310001496099UniTek Global Services, Inc., Preferred shares 32023-12-310001496099UniTek Global Services, Inc., Preferred shares 42023-12-310001496099UniTek Global Services, Inc., Preferred shares 52023-12-310001496099UniTek Global Services, Inc., Ordinary shares 12023-12-310001496099UniTek Global Services, Inc., Ordinary shares 22023-12-310001496099us-gaap:EquitySecuritiesMembernmfc:UniTekGlobalServicesIncMember2023-12-310001496099New Permian Holdco, Inc., Ordinary shares2023-12-310001496099NM CLFX LP, Membership interest2023-12-310001496099NM YI, LLC, Membership interest2023-12-310001496099Haven Midstream Holdings LLC, Ordinary shares2023-12-310001496099Haven Midstream Holdings LLC, Profit Interest2023-12-310001496099nmfc:HavenMidstreamHoldingsLLCMemberus-gaap:EquitySecuritiesMember2023-12-310001496099NM GP Holdco, LLC, Membership interest2023-12-310001496099NHME Holdings Corp., Ordinary shares2023-12-310001496099country:USus-gaap:InvestmentAffiliatedIssuerControlledMemberus-gaap:EquitySecuritiesMember2023-12-310001496099NM APP Canada Corp., Membership interest2023-12-310001496099country:CAus-gaap:InvestmentAffiliatedIssuerControlledMemberus-gaap:EquitySecuritiesMember2023-12-310001496099us-gaap:InvestmentAffiliatedIssuerControlledMemberus-gaap:EquitySecuritiesMember2023-12-310001496099UniTek Global Services, Inc., Warrants2023-12-310001496099NHME Holdings Corp., Warrants2023-12-310001496099us-gaap:WarrantMembercountry:USus-gaap:InvestmentAffiliatedIssuerControlledMember2023-12-310001496099us-gaap:InvestmentAffiliatedIssuerControlledMembernmfc:FundedSecuritiesMember2023-12-310001496099New Permian Holdco, L.L.C., First lien - Undrawn2023-12-310001496099Haven Midstream LLC, First lien - Undrawn2023-12-310001496099nmfc:UnfundedDebtSecuritiesMembercountry:USus-gaap:InvestmentAffiliatedIssuerControlledMember2023-12-310001496099Tennessee Bidco Limited, First lien 2 and Tennessee Bidco Limited, First lien 52023-12-310001496099nmfc:QIDNGLLLCMemberus-gaap:CommonClassBMember2023-01-012023-12-310001496099nmfc:QIDTRHHoldingsLLCMemberus-gaap:CommonClassBMember2023-01-012023-12-310001496099OEConnection LLC, Second lien2023-12-31nmfc:investment0001496099OEC Holdco, LLC, Preferred shares2023-01-012023-12-310001496099Appriss Health Holdings, Inc, Wholly-owned subsidiaries2023-12-310001496099Appriss Health Intermediate Holdings, Inc., Preferred shares2023-01-012023-12-310001496099TVG-Edmentum Holdings, LLC, Ordinary shares2023-01-012023-12-310001496099National HME, Inc., Second lien, Tranche A Term Loan2023-12-310001496099National HME, Inc., Second lien, Tranche B Term Loan2023-12-310001496099Diamond Parent Holdings Corp, Wholly-owned subsidiaries2023-12-310001496099Diligent Corporation, First lien2023-12-310001496099Diligent Preferred Issuer, Inc., Preferred shares2023-01-012023-12-310001496099ACI Parent Inc., Preferred shares2023-01-012023-12-310001496099Knockout Intermediate Holdings I, Preferred shares2023-01-012023-12-31nmfc:numberOfAgreement0001496099nmfc:PermianHoldco3IncAndPermianTrustMemberus-gaap:InvestmentAffiliatedIssuerNoncontrolledMember2022-12-310001496099nmfc:PermianHoldco3IncAndPermianTrustMemberus-gaap:InvestmentAffiliatedIssuerNoncontrolledMember2023-01-012023-12-310001496099nmfc:PermianHoldco3IncAndPermianTrustMemberus-gaap:InvestmentAffiliatedIssuerNoncontrolledMember2023-12-310001496099us-gaap:InvestmentAffiliatedIssuerNoncontrolledMembernmfc:SierraHamiltonHoldingsCorporationMember2022-12-310001496099us-gaap:InvestmentAffiliatedIssuerNoncontrolledMembernmfc:SierraHamiltonHoldingsCorporationMember2023-01-012023-12-310001496099us-gaap:InvestmentAffiliatedIssuerNoncontrolledMembernmfc:SierraHamiltonHoldingsCorporationMember2023-12-310001496099us-gaap:InvestmentAffiliatedIssuerNoncontrolledMembernmfc:TVGEdmentumHoldingsLLCAndEdmentumUltimateHoldingsLLCMember2022-12-310001496099us-gaap:InvestmentAffiliatedIssuerNoncontrolledMembernmfc:TVGEdmentumHoldingsLLCAndEdmentumUltimateHoldingsLLCMember2023-01-012023-12-310001496099us-gaap:InvestmentAffiliatedIssuerNoncontrolledMembernmfc:TVGEdmentumHoldingsLLCAndEdmentumUltimateHoldingsLLCMember2023-12-310001496099us-gaap:InvestmentAffiliatedIssuerControlledMembernmfc:HavenMidstreamLLCAndHavenMidstreamHoldingsLLCAndQIDTRHHoldingsLLCMember2022-12-310001496099us-gaap:InvestmentAffiliatedIssuerControlledMembernmfc:HavenMidstreamLLCAndHavenMidstreamHoldingsLLCAndQIDTRHHoldingsLLCMember2023-01-012023-12-310001496099us-gaap:InvestmentAffiliatedIssuerControlledMembernmfc:HavenMidstreamLLCAndHavenMidstreamHoldingsLLCAndQIDTRHHoldingsLLCMember2023-12-310001496099us-gaap:InvestmentAffiliatedIssuerControlledMembernmfc:NationalHMEIncAndNHMEHoldingsCorpMember2022-12-310001496099us-gaap:InvestmentAffiliatedIssuerControlledMembernmfc:NationalHMEIncAndNHMEHoldingsCorpMember2023-01-012023-12-310001496099us-gaap:InvestmentAffiliatedIssuerControlledMembernmfc:NationalHMEIncAndNHMEHoldingsCorpMember2023-12-310001496099nmfc:NewBenevisTopcoLLCAndNewBenevisHoldcoIncMemberus-gaap:InvestmentAffiliatedIssuerControlledMember2022-12-310001496099nmfc:NewBenevisTopcoLLCAndNewBenevisHoldcoIncMemberus-gaap:InvestmentAffiliatedIssuerControlledMember2023-01-012023-12-310001496099nmfc:NewBenevisTopcoLLCAndNewBenevisHoldcoIncMemberus-gaap:InvestmentAffiliatedIssuerControlledMember2023-12-310001496099us-gaap:InvestmentAffiliatedIssuerControlledMembernmfc:NewPermianHoldcoIncAndNewPermianHoldcoLLCMember2022-12-310001496099us-gaap:InvestmentAffiliatedIssuerControlledMembernmfc:NewPermianHoldcoIncAndNewPermianHoldcoLLCMember2023-01-012023-12-310001496099us-gaap:InvestmentAffiliatedIssuerControlledMembernmfc:NewPermianHoldcoIncAndNewPermianHoldcoLLCMember2023-12-310001496099us-gaap:InvestmentAffiliatedIssuerControlledMembernmfc:NMAPPCanadaCorpMember2022-12-310001496099us-gaap:InvestmentAffiliatedIssuerControlledMembernmfc:NMAPPCanadaCorpMember2023-01-012023-12-310001496099us-gaap:InvestmentAffiliatedIssuerControlledMembernmfc:NMAPPCanadaCorpMember2023-12-310001496099nmfc:NMCLFXLPMemberus-gaap:InvestmentAffiliatedIssuerControlledMember2022-12-310001496099nmfc:NMCLFXLPMemberus-gaap:InvestmentAffiliatedIssuerControlledMember2023-01-012023-12-310001496099nmfc:NMCLFXLPMemberus-gaap:InvestmentAffiliatedIssuerControlledMember2023-12-310001496099nmfc:NMNLHoldingsLPMemberus-gaap:InvestmentAffiliatedIssuerControlledMember2022-12-310001496099nmfc:NMNLHoldingsLPMemberus-gaap:InvestmentAffiliatedIssuerControlledMember2023-01-012023-12-310001496099nmfc:NMNLHoldingsLPMemberus-gaap:InvestmentAffiliatedIssuerControlledMember2023-12-310001496099us-gaap:InvestmentAffiliatedIssuerControlledMembernmfc:NMGPHoldcoLLCMember2022-12-310001496099us-gaap:InvestmentAffiliatedIssuerControlledMembernmfc:NMGPHoldcoLLCMember2023-01-012023-12-310001496099us-gaap:InvestmentAffiliatedIssuerControlledMembernmfc:NMGPHoldcoLLCMember2023-12-310001496099us-gaap:InvestmentAffiliatedIssuerControlledMembernmfc:NMYILLCMember2022-12-310001496099us-gaap:InvestmentAffiliatedIssuerControlledMembernmfc:NMYILLCMember2023-01-012023-12-310001496099us-gaap:InvestmentAffiliatedIssuerControlledMembernmfc:NMYILLCMember2023-12-310001496099us-gaap:InvestmentAffiliatedIssuerControlledMembernmfc:NMFCSeniorLoanProgramIIILLCMember2022-12-310001496099us-gaap:InvestmentAffiliatedIssuerControlledMembernmfc:NMFCSeniorLoanProgramIIILLCMember2023-01-012023-12-310001496099us-gaap:InvestmentAffiliatedIssuerControlledMembernmfc:NMFCSeniorLoanProgramIIILLCMember2023-12-310001496099us-gaap:InvestmentAffiliatedIssuerControlledMembernmfc:NMFCSeniorLoanProgramIVLLCMember2022-12-310001496099us-gaap:InvestmentAffiliatedIssuerControlledMembernmfc:NMFCSeniorLoanProgramIVLLCMember2023-01-012023-12-310001496099us-gaap:InvestmentAffiliatedIssuerControlledMembernmfc:NMFCSeniorLoanProgramIVLLCMember2023-12-310001496099us-gaap:InvestmentAffiliatedIssuerControlledMembernmfc:UniTekGlobalServicesIncMember2022-12-310001496099us-gaap:InvestmentAffiliatedIssuerControlledMembernmfc:UniTekGlobalServicesIncMember2023-01-012023-12-310001496099us-gaap:InvestmentAffiliatedIssuerControlledMembernmfc:UniTekGlobalServicesIncMember2023-12-310001496099nmfc:InvestmentTypeConcentrationRiskMembernmfc:DebtSecuritiesFirstLienMembernmfc:InvestmentsAtFairValueMember2023-01-012023-12-310001496099nmfc:InvestmentTypeConcentrationRiskMembernmfc:DebtSecuritiesSecondLienMembernmfc:InvestmentsAtFairValueMember2023-01-012023-12-310001496099nmfc:InvestmentTypeConcentrationRiskMemberus-gaap:SubordinatedDebtMembernmfc:InvestmentsAtFairValueMember2023-01-012023-12-310001496099nmfc:InvestmentTypeConcentrationRiskMemberus-gaap:OtherAggregatedInvestmentsMembernmfc:InvestmentsAtFairValueMember2023-01-012023-12-310001496099nmfc:SoftwareSectorMembernmfc:IndustryConcentrationRiskMembernmfc:InvestmentsAtFairValueMember2023-01-012023-12-310001496099nmfc:BusinessServicesSectorMembernmfc:IndustryConcentrationRiskMembernmfc:InvestmentsAtFairValueMember2023-01-012023-12-310001496099nmfc:IndustryConcentrationRiskMemberus-gaap:HealthcareSectorMembernmfc:InvestmentsAtFairValueMember2023-01-012023-12-310001496099nmfc:IndustryConcentrationRiskMembernmfc:InvestmentFundsIncludingInvestmentsInJointVenturesMembernmfc:InvestmentsAtFairValueMember2023-01-012023-12-310001496099nmfc:EducationSectorMembernmfc:IndustryConcentrationRiskMembernmfc:InvestmentsAtFairValueMember2023-01-012023-12-310001496099nmfc:ConsumerServicesSectorMembernmfc:IndustryConcentrationRiskMembernmfc:InvestmentsAtFairValueMember2023-01-012023-12-310001496099us-gaap:RealEstateSectorMembernmfc:IndustryConcentrationRiskMembernmfc:InvestmentsAtFairValueMember2023-01-012023-12-310001496099us-gaap:TransportationSectorMembernmfc:IndustryConcentrationRiskMembernmfc:InvestmentsAtFairValueMember2023-01-012023-12-310001496099us-gaap:FinancialServicesSectorMembernmfc:IndustryConcentrationRiskMembernmfc:InvestmentsAtFairValueMember2023-01-012023-12-310001496099nmfc:IndustryConcentrationRiskMembernmfc:InvestmentsAtFairValueMemberus-gaap:EnergySectorMember2023-01-012023-12-310001496099us-gaap:ChemicalsSectorMembernmfc:IndustryConcentrationRiskMembernmfc:InvestmentsAtFairValueMember2023-01-012023-12-310001496099us-gaap:ContainerAndPackagingSectorMembernmfc:IndustryConcentrationRiskMembernmfc:InvestmentsAtFairValueMember2023-01-012023-12-310001496099nmfc:BusinessProductsSectorMembernmfc:IndustryConcentrationRiskMembernmfc:InvestmentsAtFairValueMember2023-01-012023-12-310001496099us-gaap:FoodAndBeverageSectorMembernmfc:IndustryConcentrationRiskMembernmfc:InvestmentsAtFairValueMember2023-01-012023-12-310001496099nmfc:ConsumerProductsSectorMembernmfc:IndustryConcentrationRiskMembernmfc:InvestmentsAtFairValueMember2023-01-012023-12-310001496099nmfc:InterestRateTypeRiskMembernmfc:DebtSecuritiesFloatingInterestRateMembernmfc:InvestmentsAtFairValueMember2023-01-012023-12-310001496099nmfc:DebtSecuritiesFixedInterestRateMembernmfc:InterestRateTypeRiskMembernmfc:InvestmentsAtFairValueMember2023-01-012023-12-310001496099GS Acquisitionco, Inc., First lien 12022-12-310001496099GS Acquisitionco, Inc., First lien 22022-12-310001496099nmfc:FundedDebtSecuritiesMembernmfc:GSAcquisitioncoIncMember2022-12-310001496099PhyNet Dermatology LLC, First lien 12022-12-310001496099PhyNet Dermatology LLC, First lien 22022-12-310001496099nmfc:FundedDebtSecuritiesMembernmfc:PhyNetDermatologyLLCMember2022-12-310001496099Associations, Inc., First lien 12022-12-310001496099Associations, Inc., First lien 22022-12-310001496099Associations, Inc., First lien 32022-12-310001496099Associations, Inc., First lien 42022-12-310001496099Associations, Inc., First lien 52022-12-310001496099nmfc:FundedDebtSecuritiesMembernmfc:AssociationsIncMember2022-12-310001496099AAH Topco, LLC, First lien 12022-12-310001496099AAH Topco, LLC, First lien - Drawn 12022-12-310001496099AAH Topco, LLC, First lien 22022-12-310001496099AAH Topco, LLC, First lien - Drawn 22022-12-310001496099AAH Topco, LLC, Subordinated 12022-12-310001496099AAH Topco, LLC, Subordinated 22022-12-310001496099nmfc:AAHTopcoLLCMembernmfc:FundedDebtSecuritiesMember2022-12-310001496099GC Waves Holdings, Inc., First lien 12022-12-310001496099GC Waves Holdings, Inc., First lien - Drawn 12022-12-310001496099GC Waves Holdings, Inc., First lien 22022-12-310001496099GC Waves Holdings, Inc., First lien 32022-12-310001496099GC Waves Holdings, Inc., First lien - Drawn 22022-12-310001496099nmfc:FundedDebtSecuritiesMembernmfc:GCWavesHoldingsIncMember2022-12-310001496099Kaseya Inc., First lien2022-12-310001496099iCIMS, Inc., First lien 12022-12-310001496099iCIMS, Inc., First lien 22022-12-310001496099nmfc:FundedDebtSecuritiesMembernmfc:ICIMSIncMember2022-12-310001496099CentralSquare Technologies, LLC, Second lien 12022-12-310001496099CentralSquare Technologies, LLC, Second lien 22022-12-310001496099nmfc:FundedDebtSecuritiesMembernmfc:CentralSquareTechnologiesLLCMember2022-12-310001496099Infogain Corporation, First lien 12022-12-310001496099Infogain Corporation, First lien 22022-12-310001496099Infogain Corporation, First lien - Drawn2022-12-310001496099Infogain Corporation, Subordinated2022-12-310001496099nmfc:InfogainCorporationMembernmfc:FundedDebtSecuritiesMember2022-12-310001496099Brave Parent Holdings, Inc., Second lien 12022-12-310001496099Brave Parent Holdings, Inc., Second lien 22022-12-310001496099Brave Parent Holdings, Inc., Second lien 32022-12-310001496099nmfc:FundedDebtSecuritiesMembernmfc:BraveParentHoldingsIncMember2022-12-310001496099Deca Dental Holdings LLC, First lien2022-12-310001496099Deca Dental Holdings LLC, First lien - Drawn 12022-12-310001496099Deca Dental Holdings LLC, First lien - Drawn 22022-12-310001496099nmfc:FundedDebtSecuritiesMembernmfc:DecaDentalHoldingsLLCMember2022-12-310001496099Recorded Future, Inc., First lien 12022-12-310001496099Recorded Future, Inc., First lien 22022-12-310001496099nmfc:RecordedFutureIncMembernmfc:FundedDebtSecuritiesMember2022-12-310001496099Auctane Inc. (fka Stamps.com Inc.), First lien 12022-12-310001496099Auctane Inc. (fka Stamps.com Inc.), First lien 22022-12-310001496099nmfc:AuctaneIncFkaStampscomIncMembernmfc:FundedDebtSecuritiesMember2022-12-310001496099Avalara, Inc., First lien 12022-12-310001496099Avalara, Inc., First lien 22022-12-310001496099nmfc:FundedDebtSecuritiesMembernmfc:AvalaraIncMember2022-12-310001496099OEConnection LLC, Second lien 12022-12-310001496099OEConnection LLC, Second lien 22022-12-310001496099nmfc:FundedDebtSecuritiesMembernmfc:OEConnectionLLCMember2022-12-310001496099Diligent Corporation, First lien 12022-12-310001496099Diligent Corporation, First lien 22022-12-310001496099Diligent Corporation, First lien 32022-12-310001496099Diligent Corporation, First lien - Drawn2022-12-310001496099nmfc:DiligentCorporationMembernmfc:FundedDebtSecuritiesMember2022-12-310001496099IG Investments Holdings, LLC, First lien 12022-12-310001496099IG Investments Holdings, LLC, First lien 22022-12-310001496099IG Investments Holdings, LLC, First lien - Drawn2022-12-310001496099nmfc:IGInvestmentsHoldingsLLCMembernmfc:FundedDebtSecuritiesMember2022-12-310001496099Foreside Financial Group, LLC, First lien 12022-12-310001496099Foreside Financial Group, LLC, First lien 22022-12-310001496099nmfc:FundedDebtSecuritiesMembernmfc:ForesideFinancialGroupLLCMember2022-12-310001496099MRI Software LLC, First lien 12022-12-310001496099MRI Software LLC, First lien 22022-12-310001496099MRI Software LLC, First lien 32022-12-310001496099MRI Software LLC, First lien 42022-12-310001496099MRI Software LLC, First lien 52022-12-310001496099nmfc:FundedDebtSecuritiesMembernmfc:MRISoftwareLLCMember2022-12-310001496099Anaplan, Inc., First lien2022-12-310001496099Granicus, Inc., First lien 12022-12-310001496099Granicus, Inc., First lien 22022-12-310001496099Granicus, Inc., First lien 32022-12-310001496099Granicus, Inc., First lien 42022-12-310001496099Granicus, Inc., First lien - Drawn2022-12-310001496099nmfc:FundedDebtSecuritiesMembernmfc:GranicusIncMember2022-12-310001496099EAB Global, Inc., Second lien2022-12-310001496099DCA Investment Holding, LLC, First lien 12022-12-310001496099DCA Investment Holding, LLC, First lien 22022-12-310001496099DCA Investment Holding, LLC, First lien 32022-12-310001496099DCA Investment Holding, LLC, First lien - Drawn2022-12-310001496099nmfc:DCAInvestmentHoldingLLCMembernmfc:FundedDebtSecuritiesMember2022-12-310001496099KAMC Holdings, Inc., Second lien 12022-12-310001496099KAMC Holdings, Inc., Second lien 22022-12-310001496099nmfc:KAMCHoldingsIncMembernmfc:FundedDebtSecuritiesMember2022-12-310001496099OA Buyer, Inc., First lien 12022-12-310001496099OA Buyer, Inc., First lien 22022-12-310001496099nmfc:OABuyerIncMembernmfc:FundedDebtSecuritiesMember2022-12-310001496099TigerConnect, Inc., First lien2022-12-310001496099TigerConnect, Inc., First lien - Drawn2022-12-310001496099nmfc:TigerConnectIncMembernmfc:FundedDebtSecuritiesMember2022-12-310001496099Wealth Enhancement Group, LLC, First lien 12022-12-310001496099Wealth Enhancement Group, LLC, First lien 22022-12-310001496099Wealth Enhancement Group, LLC, First lien - Drawn2022-12-310001496099Wealth Enhancement Group, LLC, First lien 32022-12-310001496099nmfc:FundedDebtSecuritiesMembernmfc:WealthEnhancementGroupLLCMember2022-12-310001496099Fortis Solutions Group, LLC, First lien 12022-12-310001496099Fortis Solutions Group, LLC, First lien 22022-12-310001496099Fortis Solutions Group, LLC, First lien 32022-12-310001496099Fortis Solutions Group, LLC, First lien - Drawn2022-12-310001496099nmfc:FortisSolutionsGroupLLCMembernmfc:FundedDebtSecuritiesMember2022-12-310001496099Foundational Education Group, Inc., Second lien 12022-12-310001496099Foundational Education Group, Inc., Second lien 22022-12-310001496099nmfc:FundedDebtSecuritiesMembernmfc:FoundationalEducationGroupIncMember2022-12-310001496099Syndigo LLC, Second lien 12022-12-310001496099Syndigo LLC, Second lien 22022-12-310001496099nmfc:SyndigoLLCMembernmfc:FundedDebtSecuritiesMember2022-12-310001496099AmeriVet Partners Management, Inc., First lien 12022-12-310001496099AmeriVet Partners Management, Inc., First lien 22022-12-310001496099nmfc:AmeriVetPartnersManagementIncMembernmfc:FundedDebtSecuritiesMember2022-12-310001496099NMC Crimson Holdings, Inc., First lien 12022-12-310001496099NMC Crimson Holdings, Inc., First lien 22022-12-310001496099NMC Crimson Holdings, Inc., First lien - Drawn2022-12-310001496099nmfc:NMCCrimsonHoldingsIncMembernmfc:FundedDebtSecuritiesMember2022-12-310001496099VT Topco, Inc., Second lien 12022-12-310001496099VT Topco, Inc., Second lien 22022-12-310001496099nmfc:FundedDebtSecuritiesMembernmfc:VTTopcoIncMember2022-12-310001496099HS Purchaser, LLC / Help/Systems Holdings, Inc., Second lien 12022-12-310001496099HS Purchaser, LLC / Help/Systems Holdings, Inc., Second lien 22022-12-310001496099nmfc:FundedDebtSecuritiesMembernmfc:HSPurchaserLLCHelpSystemsHoldingsIncMember2022-12-310001496099DOCS, MSO, LLC, First lien 12022-12-310001496099DOCS, MSO, LLC, First lien 22022-12-310001496099nmfc:FundedDebtSecuritiesMembernmfc:DOCSMSOLLCMember2022-12-310001496099CRCI Longhorn Holdings, Inc., Second lien 12022-12-310001496099CRCI Longhorn Holdings, Inc., Second lien 22022-12-310001496099nmfc:FundedDebtSecuritiesMembernmfc:CRCILonghornHoldingsIncMember2022-12-310001496099ACI Group Holdings, Inc., First lien2022-12-310001496099ACI Group Holdings, Inc., First lien - Drawn 12022-12-310001496099ACI Group Holdings, Inc., First lien - Drawn 22022-12-310001496099nmfc:ACIGroupHoldingsIncMembernmfc:FundedDebtSecuritiesMember2022-12-310001496099Idera, Inc., Second lien 12022-12-310001496099Idera, Inc., Second lien 22022-12-310001496099nmfc:IderaIncMembernmfc:FundedDebtSecuritiesMember2022-12-310001496099Bullhorn, Inc., First lien 12022-12-310001496099Bullhorn, Inc., First lien 22022-12-310001496099Bullhorn, Inc., First lien 32022-12-310001496099Bullhorn, Inc., First lien - Drawn2022-12-310001496099Bullhorn, Inc., First lien 42022-12-310001496099Bullhorn, Inc., First lien 52022-12-310001496099nmfc:BullhornIncMembernmfc:FundedDebtSecuritiesMember2022-12-310001496099Convey Health Solutions, Inc., First lien 12022-12-310001496099Convey Health Solutions, Inc., First lien 22022-12-310001496099nmfc:FundedDebtSecuritiesMembernmfc:ConveyHealthSolutionsIncMember2022-12-310001496099Spring Education Group, Inc (fka SSH Group Holdings, Inc.), Second lien2022-12-310001496099TMK Hawk Parent, Corp., First lien 12022-12-310001496099TMK Hawk Parent, Corp., First lien 22022-12-310001496099nmfc:TMKHawkParentCorpMembernmfc:FundedDebtSecuritiesMember2022-12-310001496099Cardinal Parent, Inc., First lien2022-12-310001496099Cardinal Parent, Inc., Second lien2022-12-310001496099nmfc:FundedDebtSecuritiesMembernmfc:CardinalParentIncMember2022-12-310001496099Notorious Topco, LLC, First lien 12022-12-310001496099Notorious Topco, LLC, First lien 22022-12-310001496099Notorious Topco, LLC, First lien - Drawn 12022-12-310001496099Notorious Topco, LLC, First lien - Drawn 22022-12-310001496099nmfc:FundedDebtSecuritiesMembernmfc:NotoriousTopcoLLCMember2022-12-310001496099YLG Holdings, Inc., First lien 12022-12-310001496099YLG Holdings, Inc., First lien 22022-12-310001496099YLG Holdings, Inc., First lien - Drawn2022-12-310001496099nmfc:FundedDebtSecuritiesMembernmfc:YLGHoldingsIncMember2022-12-310001496099American Achievement Corporation (aka AAC Holding Corp.), First lien 12022-12-310001496099American Achievement Corporation (aka AAC Holding Corp.), First lien 22022-12-310001496099American Achievement Corporation (aka AAC Holding Corp.), Subordinated2022-12-310001496099nmfc:FundedDebtSecuritiesMembernmfc:AmericanAchievementCorporationAkaAACHoldingCorpMember2022-12-310001496099New Trojan Parent, Inc., Second lien2022-12-310001496099Xactly Corporation, First lien2022-12-310001496099Xactly Corporation, First lien - Drawn2022-12-310001496099nmfc:XactlyCorporationMembernmfc:FundedDebtSecuritiesMember2022-12-310001496099Ansira Holdings, Inc., First lien 12022-12-310001496099Ansira Holdings, Inc., First lien 22022-12-310001496099Ansira Holdings, Inc., First lien - Drawn2022-12-310001496099nmfc:FundedDebtSecuritiesMembernmfc:AnsiraHoldingsIncMember2022-12-310001496099Bluefin Holding, LLC, First lien - Drawn2022-12-310001496099Bluefin Holding, LLC, Second lien2022-12-310001496099nmfc:FundedDebtSecuritiesMembernmfc:BluefinHoldingLLCMember2022-12-310001496099Trinity Air Consultants Holdings Corporation, First lien2022-12-310001496099Trinity Air Consultants Holdings Corporation, First lien - Drawn2022-12-310001496099nmfc:FundedDebtSecuritiesMembernmfc:TrinityAirConsultantsHoldingsCorporationMember2022-12-310001496099DG Investment Intermediate Holdings 2, Inc., Second lien2022-12-310001496099FS WhiteWater Borrower, LLC, First lien 12022-12-310001496099FS WhiteWater Borrower, LLC, First lien 22022-12-310001496099FS WhiteWater Borrower, LLC, First lien 32022-12-310001496099FS WhiteWater Borrower, LLC, First lien - Drawn 12022-12-310001496099FS WhiteWater Borrower, LLC, First lien - Drawn 22022-12-310001496099nmfc:FSWhiteWaterBorrowerLLCMembernmfc:FundedDebtSecuritiesMember2022-12-310001496099Pioneer Buyer I, LLC, First lien 12022-12-310001496099Pioneer Buyer I, LLC, First lien 22022-12-310001496099nmfc:PioneerBuyerILLCMembernmfc:FundedDebtSecuritiesMember2022-12-310001496099Coyote Buyer, LLC, First lien 12022-12-310001496099Coyote Buyer, LLC, First lien 22022-12-310001496099nmfc:CoyoteBuyerLLCMembernmfc:FundedDebtSecuritiesMember2022-12-310001496099The Kleinfelder Group, Inc., First lien2022-12-310001496099Kele Holdco, Inc., First lien2022-12-310001496099MED Parentco, LP, Second lien2022-12-310001496099Daxko Acquisition Corporation, First lien 12022-12-310001496099Daxko Acquisition Corporation, First lien 22022-12-310001496099Daxko Acquisition Corporation, First lien - Drawn2022-12-310001496099nmfc:DaxkoAcquisitionCorporationMembernmfc:FundedDebtSecuritiesMember2022-12-310001496099CFS Management, LLC, First lien 12022-12-310001496099CFS Management, LLC, First lien 22022-12-310001496099nmfc:CFSManagementLLCMembernmfc:FundedDebtSecuritiesMember2022-12-310001496099Castle Management Borrower LLC, First lien2022-12-310001496099Alegeus Technologies Holdings Corp., First lien2022-12-310001496099Calabrio, Inc., First lien2022-12-310001496099Calabrio, Inc., First lien - Drawn2022-12-310001496099nmfc:FundedDebtSecuritiesMembernmfc:CalabrioIncMember2022-12-310001496099IMO Investor Holdings, Inc., First lien2022-12-310001496099IMO Investor Holdings, Inc., First lien - Drawn2022-12-310001496099nmfc:IMOInvestorHoldingsIncMembernmfc:FundedDebtSecuritiesMember2022-12-310001496099FR Arsenal Holdings II Corp., First lien2022-12-310001496099Apptio, Inc., First lien 12022-12-310001496099Apptio, Inc., First lien 22022-12-310001496099Apptio, Inc., First lien - Drawn2022-12-310001496099nmfc:ApptioIncMembernmfc:FundedDebtSecuritiesMember2022-12-310001496099Transcendia Holdings, Inc., Second lien2022-12-310001496099USRP Holdings, Inc., First lien 12022-12-310001496099USRP Holdings, Inc., First lien 22022-12-310001496099nmfc:USRPHoldingsIncMembernmfc:FundedDebtSecuritiesMember2022-12-310001496099CHA Holdings, Inc., Second lien 12022-12-310001496099CHA Holdings, Inc., Second lien 22022-12-310001496099nmfc:FundedDebtSecuritiesMembernmfc:CHAHoldingsIncMember2022-12-310001496099Specialtycare, Inc., First lien2022-12-310001496099Specialtycare, Inc., First lien - Drawn 12022-12-310001496099Specialtycare, Inc., First lien - Drawn 22022-12-310001496099nmfc:FundedDebtSecuritiesMembernmfc:SpecialtycareIncMember2022-12-310001496099Quartz Holding Company, Second lien2022-12-310001496099CG Group Holdings, LLC, First lien2022-12-310001496099CG Group Holdings, LLC, First lien - Drawn2022-12-310001496099nmfc:CGGroupHoldingsLLCMembernmfc:FundedDebtSecuritiesMember2022-12-310001496099PPVA Black Elk (Equity) LLC, Subordinated2022-12-310001496099KPSKY Acquisition Inc., First lien 12022-12-310001496099KPSKY Acquisition Inc., First lien 22022-12-310001496099KPSKY Acquisition Inc., First lien - Drawn2022-12-310001496099nmfc:FundedDebtSecuritiesMembernmfc:KPSKYAcquisitionIncMember2022-12-310001496099TRC Companies L.L.C. (fka Energize Holdco LLC), Second lien2022-12-310001496099DS Admiral Bidco, LLC, First lien2022-12-310001496099Vectra Co., Second lien2022-12-310001496099Community Brands ParentCo, LLC, First lien2022-12-310001496099Safety Borrower Holdings LLC, First lien2022-12-310001496099Sun Acquirer Corp., First lien2022-12-310001496099Sun Acquirer Corp., First lien - Drawn2022-12-310001496099nmfc:SunAcquirerCorpMembernmfc:FundedDebtSecuritiesMember2022-12-310001496099PPV Intermediate Holdings, LLC, First lien2022-12-310001496099PPV Intermediate Holdings, LLC, First lien - Drawn2022-12-310001496099nmfc:PPVIntermediateHoldingsLLCMembernmfc:FundedDebtSecuritiesMember2022-12-310001496099Appriss Health, LLC, First lien2022-12-310001496099Pye-Barker Fire & Safety, LLC, First lien2022-12-310001496099Pye-Barker Fire & Safety, LLC, First lien - Drawn2022-12-310001496099nmfc:FundedDebtSecuritiesMembernmfc:PyeBarkerFireSafetyLLCMember2022-12-310001496099ADG, LLC, Second lien2022-12-310001496099Virtusa Corporation, Subordinated2022-12-310001496099Education Management II LLC, First lien 12022-12-310001496099Education Management II LLC, First lien 22022-12-310001496099Education Management II LLC, First lien 32022-12-310001496099Education Management II LLC, First lien 42022-12-310001496099Education Management II LLC, First lien 52022-12-310001496099Education Management II LLC, First lien 62022-12-310001496099Education Management II LLC, First lien 72022-12-310001496099Education Management II LLC, First lien 82022-12-310001496099nmfc:FundedDebtSecuritiesMembernmfc:EducationManagementIILLCMember2022-12-310001496099PPVA Fund, L.P., Collateralized Financing2022-12-310001496099country:USnmfc:FundedDebtSecuritiesMemberus-gaap:InvestmentUnaffiliatedIssuerMember2022-12-310001496099Tahoe Finco, LLC, First lien 12022-12-310001496099Tahoe Finco, LLC, First lien 22022-12-310001496099nmfc:TahoeFincoLLCMembernmfc:FundedDebtSecuritiesMember2022-12-310001496099country:NLnmfc:FundedDebtSecuritiesMemberus-gaap:InvestmentUnaffiliatedIssuerMember2022-12-310001496099Aston FinCo S.a r.l. / Aston US Finco, LLC, Second lien2022-12-310001496099Integro Parent Inc., First lien 12022-12-310001496099Integro Parent Inc., First lien 22022-12-310001496099Integro Parent Inc., Second lien2022-12-310001496099nmfc:IntegroParentIncMembernmfc:FundedDebtSecuritiesMember2022-12-310001496099nmfc:FundedDebtSecuritiesMembercountry:GBus-gaap:InvestmentUnaffiliatedIssuerMember2022-12-310001496099Tennessee Bidco Limited, First lien 12022-12-310001496099Tennessee Bidco Limited, First lien 22022-12-310001496099Tennessee Bidco Limited, First lien 32022-12-310001496099Tennessee Bidco Limited, First lien 42022-12-310001496099Tennessee Bidco Limited, First lien 52022-12-310001496099nmfc:FundedDebtSecuritiesMembernmfc:TennesseeBidcoLimitedMember2022-12-310001496099nmfc:FundedDebtSecuritiesMembercountry:JEus-gaap:InvestmentUnaffiliatedIssuerMember2022-12-310001496099Atlas AU Bidco Pty Ltd, First lien2022-12-310001496099nmfc:FundedDebtSecuritiesMembercountry:AUus-gaap:InvestmentUnaffiliatedIssuerMember2022-12-310001496099nmfc:FundedDebtSecuritiesMemberus-gaap:InvestmentUnaffiliatedIssuerMember2022-12-310001496099Dealer Tire Holdings, LLC, Preferred shares2022-12-310001496099Symplr Software Intermediate Holdings, Inc., Preferred shares 12022-12-310001496099Symplr Software Intermediate Holdings, Inc., Preferred shares 22022-12-310001496099nmfc:SymplrSoftwareIntermediateHoldingsIncMemberus-gaap:EquitySecuritiesMember2022-12-310001496099Knockout Intermediate Holdings I Inc., Preferred shares2022-12-310001496099ACI Parent Inc., Preferred shares2022-12-310001496099Project Essential Super Parent, Inc., Preferred shares2022-12-310001496099Diligent Preferred Issuer, Inc., Preferred shares2022-12-310001496099OEC Holdco, LLC, Preferred shares2022-12-310001496099HB Wealth Management, LLC, Preferred shares2022-12-310001496099FS WhiteWater Holdings, LLC, Ordinary shares2022-12-310001496099Appriss Health Intermediate Holdings, Inc., Preferred shares2022-12-310001496099OA Topco, L.P., Ordinary shares2022-12-310001496099Pioneer Topco I, L.P., Ordinary shares2022-12-310001496099Ancora Acquisition LLC, Preferred shares2022-12-310001496099Education Management Corporation, Preferred shares 12022-12-310001496099Education Management Corporation, Preferred shares 22022-12-310001496099Education Management Corporation, Ordinary shares 12022-12-310001496099Education Management Corporation, Ordinary shares 22022-12-310001496099nmfc:EducationManagementCorporationMemberus-gaap:EquitySecuritiesMember2022-12-310001496099AAC Lender Holdings, LLC, Ordinary shares2022-12-310001496099country:USus-gaap:EquitySecuritiesMemberus-gaap:InvestmentUnaffiliatedIssuerMember2022-12-310001496099Bach Special Limited (Bach Preference Limited), Preferred shares2022-12-310001496099country:HKus-gaap:EquitySecuritiesMemberus-gaap:InvestmentUnaffiliatedIssuerMember2022-12-310001496099us-gaap:EquitySecuritiesMemberus-gaap:InvestmentUnaffiliatedIssuerMember2022-12-310001496099nmfc:FundedSecuritiesMemberus-gaap:InvestmentUnaffiliatedIssuerMember2022-12-310001496099Ansira Holdings, Inc, First lien - Undrawn2022-12-310001496099American Achievement Corporation (aka AAC Holding Corp.), First lien - Undrawn2022-12-310001496099Bullhorn, Inc., First lien - Undrawn2022-12-310001496099Appriss Health, LLC, First lien - Undrawn2022-12-310001496099Coyote Buyer, LLC, First lien - Undrawn2022-12-310001496099Calabrio, Inc., First lien - Undrawn2022-12-310001496099Kele Holdco, Inc., First lien - Undrawn2022-12-310001496099Granicus, Inc., First lien - Undrawn2022-12-310001496099Diligent Corporation, First lien - Undrawn2022-12-310001496099Apptio, Inc., First lien - Undrawn2022-12-310001496099Associations, Inc., First lien - Undrawn2022-12-310001496099Safety Borrower Holdings LLC, First lien - Undrawn2022-12-310001496099Bluefin Holding, LLC, First lien - Undrawn2022-12-310001496099Sun Acquirer Corp., First lien - Undrawn 12022-12-310001496099Sun Acquirer Corp., First lien - Undrawn 22022-12-310001496099nmfc:UnfundedDebtSecuritiesMembernmfc:SunAcquirerCorpMember2022-12-310001496099Pye-Barker Fire & Safety, LLC, First lien - Undrawn2022-12-310001496099IG Investments Holdings, LLC, First lien - Undrawn2022-12-310001496099Notorious Topco, LLC, First lien - Undrawn 12022-12-310001496099Notorious Topco, LLC, First lien - Undrawn 22022-12-310001496099nmfc:UnfundedDebtSecuritiesMembernmfc:NotoriousTopcoLLCMember2022-12-310001496099PPV Intermediate Holdings, LLC, First lien - Undrawn 12022-12-310001496099PPV Intermediate Holdings, LLC, First lien - Undrawn 22022-12-310001496099nmfc:UnfundedDebtSecuritiesMembernmfc:PPVIntermediateHoldingsLLCMember2022-12-310001496099CG Group Holdings, LLC, First lien - Undrawn2022-12-310001496099Recorded Future, Inc., First lien - Undrawn2022-12-310001496099USRP Holdings, Inc., First lien - Undrawn2022-12-310001496099OA Buyer, Inc., First lien - Undrawn2022-12-310001496099Avalara, Inc., First lien - Undrawn2022-12-310001496099Trinity Air Consultants Holdings Corporation, First lien - Undrawn 12022-12-310001496099Trinity Air Consultants Holdings Corporation, First lien - Undrawn 22022-12-310001496099nmfc:UnfundedDebtSecuritiesMembernmfc:TrinityAirConsultantsHoldingsCorporationMember2022-12-310001496099Pioneer Buyer I, LLC, First lien - Undrawn2022-12-310001496099iCIMS, Inc., First lien - Undrawn 12022-12-310001496099iCIMS, Inc., First lien - Undrawn 22022-12-310001496099nmfc:UnfundedDebtSecuritiesMembernmfc:ICIMSIncMember2022-12-310001496099Daxko Acquisition Corporation, First lien - Undrawn 12022-12-310001496099Daxko Acquisition Corporation, First lien - Undrawn 22022-12-310001496099nmfc:DaxkoAcquisitionCorporationMembernmfc:UnfundedDebtSecuritiesMember2022-12-310001496099Community Brands ParentCo, LLC, First lien - Undrawn 12022-12-310001496099Community Brands ParentCo, LLC, First lien - Undrawn 22022-12-310001496099nmfc:UnfundedDebtSecuritiesMembernmfc:CommunityBrandsParentCoLLCMember2022-12-310001496099IMO Investor Holdings, Inc., First lien - Undrawn 12022-12-310001496099IMO Investor Holdings, Inc., First lien - Undrawn 22022-12-310001496099nmfc:UnfundedDebtSecuritiesMembernmfc:IMOInvestorHoldingsIncMember2022-12-310001496099KPSKY Acquisition Inc., First lien - Undrawn2022-12-310001496099GC Waves Holdings, Inc., First lien - Undrawn 12022-12-310001496099GC Waves Holdings, Inc., First lien - Undrawn 22022-12-310001496099nmfc:UnfundedDebtSecuritiesMembernmfc:GCWavesHoldingsIncMember2022-12-310001496099Specialtycare, Inc., First lien - Undrawn 12022-12-310001496099Specialtycare, Inc., First lien - Undrawn 22022-12-310001496099nmfc:UnfundedDebtSecuritiesMembernmfc:SpecialtycareIncMember2022-12-310001496099Infogain Corporation, First lien - Undrawn2022-12-310001496099GS Acquisitionco, Inc., First lien - Undrawn2022-12-310001496099NMC Crimson Holdings, Inc., First lien - Undrawn2022-12-310001496099Wealth Enhancement Group, LLC, First lien - Undrawn 12022-12-310001496099Wealth Enhancement Group, LLC, First lien - Undrawn 22022-12-310001496099nmfc:UnfundedDebtSecuritiesMembernmfc:WealthEnhancementGroupLLCMember2022-12-310001496099DCA Investment Holding, LLC, First lien - Undrawn 12022-12-310001496099DCA Investment Holding, LLC, First lien - Undrawn 22022-12-310001496099nmfc:UnfundedDebtSecuritiesMembernmfc:DCAInvestmentHoldingLLCMember2022-12-310001496099Foreside Financial Group, LLC, First lien - Undrawn 12022-12-310001496099Foreside Financial Group, LLC, First lien - Undrawn 22022-12-310001496099nmfc:UnfundedDebtSecuritiesMembernmfc:ForesideFinancialGroupLLCMember2022-12-310001496099FS WhiteWater Borrower, LLC, First lien - Undrawn 12022-12-310001496099FS WhiteWater Borrower, LLC, First lien - Undrawn 22022-12-310001496099nmfc:UnfundedDebtSecuritiesMembernmfc:FSWhiteWaterBorrowerLLCMember2022-12-310001496099Kaseya Inc., First lien - Undrawn 12022-12-310001496099Kaseya Inc., First lien - Undrawn 22022-12-310001496099nmfc:UnfundedDebtSecuritiesMembernmfc:KnockoutIntermediateHoldingsIIncMember2022-12-310001496099TigerConnect, Inc., First lien - Undrawn 12022-12-310001496099TigerConnect, Inc., First lien - Undrawn 22022-12-310001496099nmfc:TigerConnectIncMembernmfc:UnfundedDebtSecuritiesMember2022-12-310001496099MRI Software LLC, First lien - Undrawn 12022-12-310001496099MRI Software LLC, First lien - Undrawn 22022-12-310001496099nmfc:UnfundedDebtSecuritiesMembernmfc:MRISoftwareLLCMember2022-12-310001496099YLG Holdings, Inc., First lien - Undrawn2022-12-310001496099YLG Holdings, Inc., First lien) - Undrawn2022-12-310001496099nmfc:UnfundedDebtSecuritiesMembernmfc:YLGHoldingsIncMember2022-12-310001496099Fortis Solutions Group, LLC, First lien - Undrawn 12022-12-310001496099Fortis Solutions Group, LLC, First lien - Undrawn 22022-12-310001496099Fortis Solutions Group, LLC, First lien - Undrawn 32022-12-310001496099nmfc:UnfundedDebtSecuritiesMembernmfc:FortisSolutionsGroupLLCMember2022-12-310001496099ACI Group Holdings, Inc., First lien - Undrawn 12022-12-310001496099ACI Group Holdings, Inc., First lien - Undrawn 22022-12-310001496099nmfc:UnfundedDebtSecuritiesMembernmfc:ACIGroupHoldingsIncMember2022-12-310001496099AAH Topco, LLC, First lien - Undrawn 12022-12-310001496099AAH Topco, LLC, First lien - Undrawn2022-12-310001496099AAH Topco, LLC, First lien - Undrawn 22022-12-310001496099nmfc:UnfundedDebtSecuritiesMembernmfc:AAHTopcoLLCMember2022-12-310001496099AmeriVet Partners Management, Inc., First lien - Undrawn 12022-12-310001496099AmeriVet Partners Management, Inc., First lien - Undrawn 22022-12-310001496099nmfc:UnfundedDebtSecuritiesMembernmfc:AmeriVetPartnersManagementIncMember2022-12-310001496099DOCS, MSO, LLC, First lien - Undrawn 12022-12-310001496099DOCS, MSO, LLC, First lien - Undrawn2022-12-310001496099DOCS, MSO, LLC, First lien - Undrawn 22022-12-310001496099nmfc:UnfundedDebtSecuritiesMembernmfc:DOCSMSOLLCMember2022-12-310001496099Deca Dental Holdings LLC, First lien - Undrawn 12022-12-310001496099Deca Dental Holdings LLC, First lien - Undrawn 22022-12-310001496099nmfc:UnfundedDebtSecuritiesMembernmfc:DecaDentalHoldingsLLCMember2022-12-310001496099nmfc:UnfundedDebtSecuritiesMembercountry:USus-gaap:InvestmentUnaffiliatedIssuerMember2022-12-310001496099Tahoe Finco, LLC, First lien - Undrawn2022-12-310001496099nmfc:UnfundedDebtSecuritiesMembercountry:NLus-gaap:InvestmentUnaffiliatedIssuerMember2022-12-310001496099Atlas AU Bidco Pty Ltd, First lien - Undrawn2022-12-310001496099nmfc:UnfundedDebtSecuritiesMembercountry:AUus-gaap:InvestmentUnaffiliatedIssuerMember2022-12-310001496099nmfc:UnfundedDebtSecuritiesMemberus-gaap:InvestmentUnaffiliatedIssuerMember2022-12-310001496099Edmentum Ultimate Holdings, LLC, Subordinated2022-12-310001496099Sierra Hamilton Holdings Corporation, Second lien2022-12-310001496099Permian Trust, First lien 12022-12-310001496099Permian Trust, First lien 22022-12-310001496099nmfc:PermianTrustMembernmfc:FundedDebtSecuritiesMember2022-12-310001496099country:USnmfc:FundedDebtSecuritiesMemberus-gaap:InvestmentAffiliatedIssuerNoncontrolledMember2022-12-310001496099TVG-Edmentum Holdings, LLC, Ordinary shares2022-12-310001496099Sierra Hamilton Holdings Corporation, Ordinary shares 12022-12-310001496099Sierra Hamilton Holdings Corporation, Ordinary shares 22022-12-310001496099us-gaap:EquitySecuritiesMembernmfc:SierraHamiltonHoldingsCorporationMember2022-12-310001496099country:USus-gaap:EquitySecuritiesMemberus-gaap:InvestmentAffiliatedIssuerNoncontrolledMember2022-12-310001496099New Benevis Holdco, Inc., First lien 12022-12-310001496099New Benevis Holdco, Inc., First lien 22022-12-310001496099New Benevis Holdco, Inc., First lien 32022-12-310001496099New Benevis Holdco, Inc., Subordinated2022-12-310001496099nmfc:NewBenevisHoldcoIncMembernmfc:FundedDebtSecuritiesMember2022-12-310001496099UniTek Global Services, Inc., First lien 12022-12-310001496099UniTek Global Services, Inc., First lien 22022-12-310001496099UniTek Global Services, Inc., Second lien 12022-12-310001496099UniTek Global Services, Inc., Second lien 22022-12-310001496099nmfc:FundedDebtSecuritiesMembernmfc:UniTekGlobalServicesIncMember2022-12-310001496099New Permian Holdco, L.L.C., First lien2022-12-310001496099New Permian Holdco, L.L.C., First lien - Drawn2022-12-310001496099nmfc:NewPermianHoldcoLLCMembernmfc:FundedDebtSecuritiesMember2022-12-310001496099National HME, Inc., Second lien 12022-12-310001496099National HME, Inc., Second lien 22022-12-310001496099nmfc:NationalHMEIncMembernmfc:FundedDebtSecuritiesMember2022-12-310001496099country:USus-gaap:InvestmentAffiliatedIssuerControlledMembernmfc:FundedDebtSecuritiesMember2022-12-310001496099NMFC Senior Loan Program III LLC, Membership interest2022-12-310001496099NMFC Senior Loan Program IV LLC, Membership interest2022-12-310001496099NM NL Holdings, L.P., Membership interest2022-12-310001496099New Benevis Topco, LLC, Ordinary shares 12022-12-310001496099New Benevis Topco, LLC, Ordinary shares 22022-12-310001496099New Benevis Topco, LLC, Ordinary shares 32022-12-310001496099nmfc:NewBenevisTopcoLLCMemberus-gaap:EquitySecuritiesMember2022-12-310001496099Haven Midstream Holdings LLC, Ordinary shares2022-12-310001496099Haven Midstream Holdings LLC, Profit Interest2022-12-310001496099nmfc:HavenMidstreamHoldingsLLCMemberus-gaap:EquitySecuritiesMember2022-12-310001496099New Permian Holdco, Inc., Ordinary shares2022-12-310001496099UniTek Global Services, Inc., Preferred shares 12022-12-310001496099UniTek Global Services, Inc., Preferred shares 22022-12-310001496099UniTek Global Services, Inc., Preferred shares 32022-12-310001496099UniTek Global Services, Inc., Preferred shares 42022-12-310001496099UniTek Global Services, Inc., Preferred shares 52022-12-310001496099UniTek Global Services, Inc., Ordinary shares 12022-12-310001496099UniTek Global Services, Inc., Ordinary shares 22022-12-310001496099us-gaap:EquitySecuritiesMembernmfc:UniTekGlobalServicesIncMember2022-12-310001496099NM CLFX LP, Membership interest2022-12-310001496099NM YI, LLC, Membership interest2022-12-310001496099NM GP Holdco, LLC, Membership interest2022-12-310001496099NHME Holdings Corp., Ordinary shares2022-12-310001496099NM GLCR LP, Membership interest2022-12-310001496099NM APP US LLC, Membership interest2022-12-310001496099NM DRVT LLC, Membership interest2022-12-310001496099NM JRA LLC, Membership interest2022-12-310001496099NM KRLN LLC, Membership interest2022-12-310001496099country:USus-gaap:InvestmentAffiliatedIssuerControlledMemberus-gaap:EquitySecuritiesMember2022-12-310001496099NM APP Canada Corp., Membership interest2022-12-310001496099country:CAus-gaap:InvestmentAffiliatedIssuerControlledMemberus-gaap:EquitySecuritiesMember2022-12-310001496099us-gaap:InvestmentAffiliatedIssuerControlledMemberus-gaap:EquitySecuritiesMember2022-12-310001496099UniTek Global Services, Inc., Warrants2022-12-310001496099NHME Holdings Corp., Warrants2022-12-310001496099us-gaap:WarrantMembercountry:USus-gaap:InvestmentAffiliatedIssuerControlledMember2022-12-310001496099us-gaap:InvestmentAffiliatedIssuerControlledMembernmfc:FundedSecuritiesMember2022-12-310001496099New Permian Holdco, L.L.C., First lien - Undrawn2022-12-310001496099Haven Midstream LLC, First lien - Undrawn2022-12-310001496099nmfc:UnfundedDebtSecuritiesMembercountry:USus-gaap:InvestmentAffiliatedIssuerControlledMember2022-12-310001496099Tennessee Bidco Limited, First lien - Drawn 12022-12-310001496099nmfc:QIDNGLLLCMemberus-gaap:CommonClassBMember2022-01-012022-12-310001496099nmfc:QIDTRHHoldingsLLCMemberus-gaap:CommonClassBMember2022-01-012022-12-310001496099OEC Holdco, LLC, Preferred shares2022-01-012022-12-310001496099Appriss Health Holdings, Inc, Wholly-owned subsidiaries2022-12-310001496099Appriss Health Intermediate Holdings, Inc., Preferred shares2022-01-012022-12-310001496099TVG-Edmentum Holdings, LLC, Ordinary shares2022-01-012022-12-310001496099UniTek Global Services, Inc., Preferred shares 4 and UniTek Global Services, Inc., Preferred shares 52022-01-012022-12-310001496099UniTek Global Services, Inc., Preferred shares 32022-01-012022-12-310001496099UniTek Global Services, Inc., Preferred shares 1 and UniTek Global Services, Inc., Preferred shares 22022-01-012022-12-310001496099Bach Special Limited (Bach Preference Limited), Preferred shares2022-01-012022-12-310001496099Dealer Tire Holdings, LLC, Preferred shares2022-01-012022-12-310001496099Symplr Software Intermediate Holdings, Inc., Preferred shares2022-01-012022-12-310001496099Project Essential Super Parent, Inc., Preferred shares2022-01-012022-12-310001496099Diamond Parent Holdings Corp, Wholly-owned subsidiaries2022-12-310001496099Diligent Preferred Issuer, Inc., Preferred shares2022-01-012022-12-310001496099ACI Parent Inc., Preferred shares2022-01-012022-12-310001496099HB Wealth Management, LLC, Preferred shares2022-01-012022-12-310001496099Knockout Intermediate Holdings I, Preferred shares2022-01-012022-12-310001496099nmfc:PermianHoldco3IncAndPermianTrustMemberus-gaap:InvestmentAffiliatedIssuerNoncontrolledMember2021-12-310001496099nmfc:PermianHoldco3IncAndPermianTrustMemberus-gaap:InvestmentAffiliatedIssuerNoncontrolledMember2022-01-012022-12-310001496099us-gaap:InvestmentAffiliatedIssuerNoncontrolledMembernmfc:SierraHamiltonHoldingsCorporationMember2021-12-310001496099us-gaap:InvestmentAffiliatedIssuerNoncontrolledMembernmfc:SierraHamiltonHoldingsCorporationMember2022-01-012022-12-310001496099us-gaap:InvestmentAffiliatedIssuerNoncontrolledMembernmfc:TVGEdmentumHoldingsLLCAndEdmentumUltimateHoldingsLLCMember2021-12-310001496099us-gaap:InvestmentAffiliatedIssuerNoncontrolledMembernmfc:TVGEdmentumHoldingsLLCAndEdmentumUltimateHoldingsLLCMember2022-01-012022-12-310001496099us-gaap:InvestmentAffiliatedIssuerNoncontrolledMember2021-12-310001496099nmfc:EdmentumIncMemberus-gaap:InvestmentAffiliatedIssuerControlledMember2021-12-310001496099nmfc:EdmentumIncMemberus-gaap:InvestmentAffiliatedIssuerControlledMember2022-01-012022-12-310001496099nmfc:EdmentumIncMemberus-gaap:InvestmentAffiliatedIssuerControlledMember2022-12-310001496099nmfc:NationalHMEInc.AndNMHEHoldingsCorp.IncludingNettingMemberus-gaap:InvestmentAffiliatedIssuerControlledMember2021-12-310001496099nmfc:NationalHMEInc.AndNMHEHoldingsCorp.IncludingNettingMemberus-gaap:InvestmentAffiliatedIssuerControlledMember2022-01-012022-12-310001496099nmfc:NationalHMEInc.AndNMHEHoldingsCorp.IncludingNettingMemberus-gaap:InvestmentAffiliatedIssuerControlledMember2022-12-310001496099nmfc:NewBenevisTopcoLLCAndNewBenevisHoldcoIncMemberus-gaap:InvestmentAffiliatedIssuerControlledMember2021-12-310001496099nmfc:NewBenevisTopcoLLCAndNewBenevisHoldcoIncMemberus-gaap:InvestmentAffiliatedIssuerControlledMember2022-01-012022-12-310001496099us-gaap:InvestmentAffiliatedIssuerControlledMembernmfc:NewPermianHoldcoIncAndNewPermianHoldcoLLCMember2021-12-310001496099us-gaap:InvestmentAffiliatedIssuerControlledMembernmfc:NewPermianHoldcoIncAndNewPermianHoldcoLLCMember2022-01-012022-12-310001496099us-gaap:InvestmentAffiliatedIssuerControlledMembernmfc:NMAPPCanadaCorpMember2021-12-310001496099us-gaap:InvestmentAffiliatedIssuerControlledMembernmfc:NMAPPCanadaCorpMember2022-01-012022-12-310001496099us-gaap:InvestmentAffiliatedIssuerControlledMembernmfc:NMAPPUSLLCMember2021-12-310001496099us-gaap:InvestmentAffiliatedIssuerControlledMembernmfc:NMAPPUSLLCMember2022-01-012022-12-310001496099us-gaap:InvestmentAffiliatedIssuerControlledMembernmfc:NMAPPUSLLCMember2022-12-310001496099nmfc:NMCLFXLPMemberus-gaap:InvestmentAffiliatedIssuerControlledMember2021-12-310001496099nmfc:NMCLFXLPMemberus-gaap:InvestmentAffiliatedIssuerControlledMember2022-01-012022-12-310001496099us-gaap:InvestmentAffiliatedIssuerControlledMembernmfc:NMDRVTLLCMember2021-12-310001496099us-gaap:InvestmentAffiliatedIssuerControlledMembernmfc:NMDRVTLLCMember2022-01-012022-12-310001496099us-gaap:InvestmentAffiliatedIssuerControlledMembernmfc:NMDRVTLLCMember2022-12-310001496099us-gaap:InvestmentAffiliatedIssuerControlledMembernmfc:NMJRALLCMember2021-12-310001496099us-gaap:InvestmentAffiliatedIssuerControlledMembernmfc:NMJRALLCMember2022-01-012022-12-310001496099us-gaap:InvestmentAffiliatedIssuerControlledMembernmfc:NMJRALLCMember2022-12-310001496099nmfc:NMGLCRLPMemberus-gaap:InvestmentAffiliatedIssuerControlledMember2021-12-310001496099nmfc:NMGLCRLPMemberus-gaap:InvestmentAffiliatedIssuerControlledMember2022-01-012022-12-310001496099nmfc:NMGLCRLPMemberus-gaap:InvestmentAffiliatedIssuerControlledMember2022-12-310001496099us-gaap:InvestmentAffiliatedIssuerControlledMembernmfc:NMKRLNLLCMember2021-12-310001496099us-gaap:InvestmentAffiliatedIssuerControlledMembernmfc:NMKRLNLLCMember2022-01-012022-12-310001496099us-gaap:InvestmentAffiliatedIssuerControlledMembernmfc:NMKRLNLLCMember2022-12-310001496099nmfc:NMNLHoldingsLPMemberus-gaap:InvestmentAffiliatedIssuerControlledMember2021-12-310001496099nmfc:NMNLHoldingsLPMemberus-gaap:InvestmentAffiliatedIssuerControlledMember2022-01-012022-12-310001496099us-gaap:InvestmentAffiliatedIssuerControlledMembernmfc:NMGPHoldcoLLCMember2021-12-310001496099us-gaap:InvestmentAffiliatedIssuerControlledMembernmfc:NMGPHoldcoLLCMember2022-01-012022-12-310001496099us-gaap:InvestmentAffiliatedIssuerControlledMembernmfc:NMYILLCMember2021-12-310001496099us-gaap:InvestmentAffiliatedIssuerControlledMembernmfc:NMYILLCMember2022-01-012022-12-310001496099us-gaap:InvestmentAffiliatedIssuerControlledMembernmfc:NMFCSeniorLoanProgramIIILLCMember2021-12-310001496099us-gaap:InvestmentAffiliatedIssuerControlledMembernmfc:NMFCSeniorLoanProgramIIILLCMember2022-01-012022-12-310001496099us-gaap:InvestmentAffiliatedIssuerControlledMembernmfc:NMFCSeniorLoanProgramIVLLCMember2021-12-310001496099us-gaap:InvestmentAffiliatedIssuerControlledMembernmfc:NMFCSeniorLoanProgramIVLLCMember2022-01-012022-12-310001496099us-gaap:InvestmentAffiliatedIssuerControlledMembernmfc:HavenMidstreamLLCAndHavenMidstreamHoldingsLLCAndQIDTRHHoldingsLLCMember2021-12-310001496099us-gaap:InvestmentAffiliatedIssuerControlledMembernmfc:HavenMidstreamLLCAndHavenMidstreamHoldingsLLCAndQIDTRHHoldingsLLCMember2022-01-012022-12-310001496099us-gaap:InvestmentAffiliatedIssuerControlledMembernmfc:UniTekGlobalServicesIncMember2021-12-310001496099us-gaap:InvestmentAffiliatedIssuerControlledMembernmfc:UniTekGlobalServicesIncMember2022-01-012022-12-310001496099us-gaap:InvestmentAffiliatedIssuerControlledMember2021-12-310001496099nmfc:InterestRateTypeRiskMembernmfc:DebtSecuritiesFirstLienMembernmfc:InvestmentsAtFairValueMember2022-01-012022-12-310001496099nmfc:InterestRateTypeRiskMembernmfc:DebtSecuritiesSecondLienMembernmfc:InvestmentsAtFairValueMember2022-01-012022-12-310001496099nmfc:InterestRateTypeRiskMemberus-gaap:SubordinatedDebtMembernmfc:InvestmentsAtFairValueMember2022-01-012022-12-310001496099nmfc:InterestRateTypeRiskMemberus-gaap:OtherAggregatedInvestmentsMembernmfc:InvestmentsAtFairValueMember2022-01-012022-12-310001496099nmfc:InterestRateTypeRiskMembernmfc:SoftwareSectorMembernmfc:InvestmentsAtFairValueMember2022-01-012022-12-310001496099nmfc:InterestRateTypeRiskMembernmfc:BusinessServicesSectorMembernmfc:InvestmentsAtFairValueMember2022-01-012022-12-310001496099nmfc:InterestRateTypeRiskMemberus-gaap:HealthcareSectorMembernmfc:InvestmentsAtFairValueMember2022-01-012022-12-310001496099nmfc:InterestRateTypeRiskMembernmfc:InvestmentFundsIncludingInvestmentsInJointVenturesMembernmfc:InvestmentsAtFairValueMember2022-01-012022-12-310001496099nmfc:InterestRateTypeRiskMembernmfc:EducationSectorMembernmfc:InvestmentsAtFairValueMember2022-01-012022-12-310001496099nmfc:InterestRateTypeRiskMembernmfc:ConsumerServicesSectorMembernmfc:InvestmentsAtFairValueMember2022-01-012022-12-310001496099nmfc:InterestRateTypeRiskMemberus-gaap:RealEstateSectorMembernmfc:InvestmentsAtFairValueMember2022-01-012022-12-310001496099nmfc:InterestRateTypeRiskMemberus-gaap:TransportationSectorMembernmfc:InvestmentsAtFairValueMember2022-01-012022-12-310001496099nmfc:InterestRateTypeRiskMemberus-gaap:FinancialServicesSectorMembernmfc:InvestmentsAtFairValueMember2022-01-012022-12-310001496099nmfc:InterestRateTypeRiskMembernmfc:InvestmentsAtFairValueMemberus-gaap:EnergySectorMember2022-01-012022-12-310001496099nmfc:InterestRateTypeRiskMemberus-gaap:ChemicalsSectorMembernmfc:InvestmentsAtFairValueMember2022-01-012022-12-310001496099nmfc:InterestRateTypeRiskMemberus-gaap:TechnologySectorMembernmfc:InvestmentsAtFairValueMember2022-01-012022-12-310001496099nmfc:InterestRateTypeRiskMemberus-gaap:ContainerAndPackagingSectorMembernmfc:InvestmentsAtFairValueMember2022-01-012022-12-310001496099nmfc:InterestRateTypeRiskMembernmfc:ConsumerProductsSectorMembernmfc:InvestmentsAtFairValueMember2022-01-012022-12-310001496099nmfc:InterestRateTypeRiskMembernmfc:BusinessProductsSectorMembernmfc:InvestmentsAtFairValueMember2022-01-012022-12-310001496099nmfc:InterestRateTypeRiskMembernmfc:DebtSecuritiesFloatingInterestRateMembernmfc:InvestmentsAtFairValueMember2022-01-012022-12-310001496099nmfc:DebtSecuritiesFixedInterestRateMembernmfc:InterestRateTypeRiskMembernmfc:InvestmentsAtFairValueMember2022-01-012022-12-3100014960992011-05-192023-12-310001496099nmfc:NewMountainCapitalMember2023-12-310001496099srt:MinimumMember2023-01-012023-12-310001496099srt:MaximumMember2023-01-012023-12-310001496099nmfc:NewMountainNetLeaseCorporationMemberus-gaap:CommonStockMember2020-03-302020-03-300001496099nmfc:NewMountainNetLeaseCorporationMemberus-gaap:CommonStockMember2020-03-300001496099us-gaap:InvestmentsInMajorityOwnedSubsidiariesMember2020-03-302020-03-300001496099us-gaap:InvestmentsInMajorityOwnedSubsidiariesMember2020-03-300001496099nmfc:NewMountainNetLeaseCorporationMembernmfc:NMNLHoldingsLPNMGPHoldcoLLCMember2023-12-310001496099nmfc:NewMountainNetLeaseCorporationMembernmfc:NMCLFXLPMember2023-12-31utr:sqft0001496099nmfc:NewMountainNetLeaseCorporationMembernmfc:NMYILLCMember2023-12-310001496099nmfc:NewMountainNetLeaseCorporationMember2023-12-310001496099nmfc:NewMountainNetLeaseCorporationMembernmfc:NMAPPCanadaCorpMember2023-12-310001496099us-gaap:CommonStockMember2016-02-040001496099us-gaap:CommonStockMember2022-01-012022-12-310001496099us-gaap:CommonStockMember2023-01-012023-12-310001496099us-gaap:CommonStockMember2016-02-042016-12-310001496099nmfc:DebtSecuritiesFirstLienMember2023-12-310001496099nmfc:DebtSecuritiesSecondLienMember2023-12-310001496099us-gaap:SubordinatedDebtMember2023-12-310001496099us-gaap:OtherAggregatedInvestmentsMember2023-12-310001496099nmfc:SoftwareSectorMember2023-12-310001496099nmfc:BusinessServicesSectorMember2023-12-310001496099us-gaap:HealthcareSectorMember2023-12-310001496099nmfc:InvestmentFundsIncludingInvestmentsInJointVenturesMember2023-12-310001496099nmfc:EducationSectorMember2023-12-310001496099nmfc:ConsumerServicesSectorMember2023-12-310001496099us-gaap:RealEstateSectorMember2023-12-310001496099us-gaap:TransportationSectorMember2023-12-310001496099us-gaap:FinancialServicesSectorMember2023-12-310001496099us-gaap:EnergySectorMember2023-12-310001496099us-gaap:ContainerAndPackagingSectorMember2023-12-310001496099us-gaap:ChemicalsSectorMember2023-12-310001496099nmfc:BusinessProductsSectorMember2023-12-310001496099us-gaap:FoodAndBeverageSectorMember2023-12-310001496099nmfc:ConsumerProductsSectorMember2023-12-310001496099nmfc:DebtSecuritiesFirstLienMember2022-12-310001496099nmfc:DebtSecuritiesSecondLienMember2022-12-310001496099us-gaap:SubordinatedDebtMember2022-12-310001496099us-gaap:OtherAggregatedInvestmentsMember2022-12-310001496099nmfc:SoftwareSectorMember2022-12-310001496099nmfc:BusinessServicesSectorMember2022-12-310001496099us-gaap:HealthcareSectorMember2022-12-310001496099nmfc:InvestmentFundsIncludingInvestmentsInJointVenturesMember2022-12-310001496099nmfc:EducationSectorMember2022-12-310001496099nmfc:ConsumerServicesSectorMember2022-12-310001496099us-gaap:RealEstateSectorMember2022-12-310001496099us-gaap:TransportationSectorMember2022-12-310001496099us-gaap:FinancialServicesSectorMember2022-12-310001496099us-gaap:EnergySectorMember2022-12-310001496099us-gaap:ChemicalsSectorMember2022-12-310001496099us-gaap:TechnologySectorMember2022-12-310001496099us-gaap:ContainerAndPackagingSectorMember2022-12-310001496099nmfc:ConsumerProductsSectorMember2022-12-310001496099nmfc:BusinessProductsSectorMember2022-12-310001496099Integro Parent Inc., Second lien, Non-accrual status2022-06-300001496099Integro Parent Inc., Second lien, Non-accrual status2023-01-012023-12-310001496099National HME, Inc., Second lien2022-10-012022-12-310001496099American Achievement Corporation (aka AAC Holding Corp.), Subordinated2023-12-310001496099American Achievement Corporation (aka AAC Holding Corp.), First lien2023-12-310001496099American Achievement Corporation (aka AAC Holding Corp.), Subordinated, Non-accrual status2021-03-310001496099American Achievement Corporation (aka AAC Holding Corp.), First lien, Non-accrual status2021-09-300001496099American Achievement Corporation (aka AAC Holding Corp.), First lien, Non-accrual status2023-09-300001496099American Achievement Corporation (aka AAC Holding Corp.), Non-accrual status2023-12-310001496099American Achievement Corporation (aka AAC Holding Corp.), Non-accrual status2023-01-012023-12-310001496099UniTek Global Services, Inc., Junior preferred shares, Non-accrual status2023-12-310001496099UniTek Global Services, Inc., Junior preferred shares, Non-accrual status2023-01-012023-12-310001496099UniTek Global Services, Inc., Senior preferred shares, Non-accrual status2021-09-300001496099UniTek Global Services, Inc., Senior preferred shares, Non-accrual status2023-12-310001496099UniTek Global Services, Inc., Senior preferred shares, Non-accrual status2023-01-012023-12-310001496099Transcendia Holdings, Inc. Second lien term loan2023-12-310001496099Transcendia Holdings, Inc. Second lien term loan2023-01-012023-12-310001496099nmfc:UnfundedDebtSecuritiesRevolvingCreditFacilitiesMember2023-12-310001496099nmfc:UnfundedDebtSecuritiesBridgeFacilitiesMember2023-12-310001496099nmfc:UnfundedDebtSecuritiesDelayedDrawsOrOtherFutureFundingCommitmentsMember2023-12-310001496099nmfc:UnfundedDebtSecuritiesRevolvingCreditFacilitiesMember2022-12-310001496099nmfc:UnfundedDebtSecuritiesBridgeFacilitiesMember2022-12-310001496099nmfc:UnfundedDebtSecuritiesDelayedDrawsOrOtherFutureFundingCommitmentsMember2022-12-310001496099PPVA Black Elk (Equity) LLC, Subordinated2013-05-030001496099PPVA Black Elk (Equity) LLC, Subordinated2014-08-012014-08-310001496099nmfc:BlackElkTrusteeMember2017-08-012017-08-310001496099nmfc:BlackElkTrusteeMember2017-12-222017-12-220001496099nmfc:BlackElkTrusteeMember2018-01-012018-12-310001496099PPVA Black Elk (Equity) LLC, Subordinated2023-12-310001496099nmfc:NMFCSeniorLoanProgramIIILLCMember2023-01-012023-12-310001496099nmfc:NMFCSeniorLoanProgramIIILLCMember2023-12-310001496099nmfc:NMFCSeniorLoanProgramIIILLCMembernmfc:SkyKnightIncomeIILLCMember2023-12-310001496099nmfc:SecuredOvernightFinancingRateSOFRMemberus-gaap:LineOfCreditMembernmfc:DuringReinvestmentPeriodMemberus-gaap:RevolvingCreditFacilityMembernmfc:NMFCSeniorLoanProgramIIILLCMember2023-06-232023-06-230001496099nmfc:SecuredOvernightFinancingRateSOFRMemberus-gaap:LineOfCreditMemberus-gaap:RevolvingCreditFacilityMembernmfc:AfterReinvestmentPeriodMembernmfc:NMFCSeniorLoanProgramIIILLCMember2023-06-232023-06-230001496099nmfc:LondonInterbankOfferedRateLIBOR1Memberus-gaap:LineOfCreditMembernmfc:DuringReinvestmentPeriodMemberus-gaap:RevolvingCreditFacilityMembernmfc:NMFCSeniorLoanProgramIIILLCMember2023-06-222023-06-220001496099nmfc:LondonInterbankOfferedRateLIBOR1Memberus-gaap:LineOfCreditMemberus-gaap:RevolvingCreditFacilityMembernmfc:AfterReinvestmentPeriodMembernmfc:NMFCSeniorLoanProgramIIILLCMember2023-06-222023-06-220001496099us-gaap:LineOfCreditMemberus-gaap:RevolvingCreditFacilityMembernmfc:NMFCSeniorLoanProgramIIILLCMember2020-11-230001496099nmfc:NMFCSeniorLoanProgramIIILLCMember2023-12-310001496099nmfc:NMFCSeniorLoanProgramIIILLCMember2022-12-310001496099us-gaap:RevolvingCreditFacilityMembernmfc:NMFCSeniorLoanProgramIIILLCMember2023-12-310001496099us-gaap:RevolvingCreditFacilityMembernmfc:NMFCSeniorLoanProgramIIILLCMember2022-12-310001496099nmfc:UnfundedSecuritiesMembernmfc:NMFCSeniorLoanProgramIIILLCMember2023-12-310001496099nmfc:UnfundedSecuritiesMembernmfc:NMFCSeniorLoanProgramIIILLCMember2022-12-310001496099srt:WeightedAverageMembernmfc:NMFCSeniorLoanProgramIIILLCMember2023-12-310001496099srt:WeightedAverageMembernmfc:NMFCSeniorLoanProgramIIILLCMember2022-12-31nmfc:company0001496099Largest Portfolio Company Investmentnmfc:NMFCSeniorLoanProgramIIILLCMember2023-12-310001496099Largest Portfolio Company Investmentnmfc:NMFCSeniorLoanProgramIIILLCMember2022-12-310001496099Top Five Largest Portfolio Company Investmentsnmfc:NMFCSeniorLoanProgramIIILLCMember2023-12-310001496099Top Five Largest Portfolio Company Investmentsnmfc:NMFCSeniorLoanProgramIIILLCMember2022-12-310001496099ADMI Corp. (aka Aspen Dental), First lien - Fundednmfc:NMFCSeniorLoanProgramIIILLCMember2023-12-310001496099Advisor Group Holdings, Inc., First lien - Fundednmfc:NMFCSeniorLoanProgramIIILLCMember2023-12-310001496099nmfc:NMFCSeniorLoanProgramIIILLCMemberAG Parent Holdings, LLC, First lien - Funded2023-12-310001496099Artera Services, LLC, First lien - Fundednmfc:NMFCSeniorLoanProgramIIILLCMember2023-12-310001496099AssuredPartners, Inc., First lien - Fundednmfc:NMFCSeniorLoanProgramIIILLCMember2023-12-310001496099Aston FinCo S.a.r.l. / Aston US Finco, LLC, First lien - Fundednmfc:NMFCSeniorLoanProgramIIILLCMember2023-12-310001496099nmfc:NMFCSeniorLoanProgramIIILLCMemberathenahealth Group Inc., First lien - Funded2023-12-310001496099BCPE Empire Holdings, Inc., First lien - Funded 1nmfc:NMFCSeniorLoanProgramIIILLCMember2023-12-310001496099BCPE Empire Holdings, Inc., First lien - Funded 2nmfc:NMFCSeniorLoanProgramIIILLCMember2023-12-310001496099Bella Holding Company, LLC, First lien - Fundednmfc:NMFCSeniorLoanProgramIIILLCMember2023-12-310001496099Bluefin Holding, LLC, First lien - Funded 1nmfc:NMFCSeniorLoanProgramIIILLCMember2023-12-310001496099Bluefin Holding, LLC, First lien - Funded 2nmfc:NMFCSeniorLoanProgramIIILLCMember2023-12-310001496099Bracket Intermediate Holding Corp., First lien - Fundednmfc:NMFCSeniorLoanProgramIIILLCMember2023-12-310001496099Brave Parent Holdings, Inc., First lien - Fundednmfc:NMFCSeniorLoanProgramIIILLCMember2023-12-310001496099Brown Group Holding, LLC, First lien - Fundednmfc:NMFCSeniorLoanProgramIIILLCMember2023-12-310001496099Cano Health, LLC, First lien - Fundednmfc:NMFCSeniorLoanProgramIIILLCMember2023-12-310001496099Cardinal Parent, Inc., First lien - Fundednmfc:NMFCSeniorLoanProgramIIILLCMember2023-12-310001496099CE Intermediate I, LLC, First lien - Fundednmfc:NMFCSeniorLoanProgramIIILLCMember2023-12-310001496099CentralSquare Technologies, LLC, First lien - Fundednmfc:NMFCSeniorLoanProgramIIILLCMember2023-12-310001496099nmfc:NMFCSeniorLoanProgramIIILLCMemberCHA Holdings, Inc., First lien - Funded2023-12-310001496099CommerceHub, Inc., First lien - Fundednmfc:NMFCSeniorLoanProgramIIILLCMember2023-12-310001496099Confluent Health, LLC, First lien - Funded 1nmfc:NMFCSeniorLoanProgramIIILLCMember2023-12-310001496099Confluent Health, LLC, First lien - Funded 2nmfc:NMFCSeniorLoanProgramIIILLCMember2023-12-310001496099Confluent Medical Technologies, Inc., First lien - Fundednmfc:NMFCSeniorLoanProgramIIILLCMember2023-12-310001496099Convey Health Solutions, Inc., First lien - Fundednmfc:NMFCSeniorLoanProgramIIILLCMember2023-12-310001496099Cornerstone OnDemand, Inc., First lien - Fundednmfc:NMFCSeniorLoanProgramIIILLCMember2023-12-310001496099Covenant Surgical Partners, Inc., First lien - Funded 1nmfc:NMFCSeniorLoanProgramIIILLCMember2023-12-310001496099Covenant Surgical Partners, Inc., First lien - Funded 2nmfc:NMFCSeniorLoanProgramIIILLCMember2023-12-310001496099nmfc:NMFCSeniorLoanProgramIIILLCMemberCRCI Longhorn Holdings, Inc., First lien - Funded2023-12-310001496099CVET Midco 2, L.P., First lien - Fundednmfc:NMFCSeniorLoanProgramIIILLCMember2023-12-310001496099DG Investment Intermediate Holdings 2, Inc., First lien - Fundednmfc:NMFCSeniorLoanProgramIIILLCMember2023-12-310001496099Dealer Tire Financial, LLC, First lien - Fundednmfc:NMFCSeniorLoanProgramIIILLCMember2023-12-310001496099Discovery Purchaser Corporation, First lien - Fundednmfc:NMFCSeniorLoanProgramIIILLCMember2023-12-310001496099Dispatch Acquisition Holdings, LLC, First lien - Fundednmfc:NMFCSeniorLoanProgramIIILLCMember2023-12-310001496099Drilling Info Holdings, Inc., First lien - Fundednmfc:NMFCSeniorLoanProgramIIILLCMember2023-12-310001496099EAB Global, Inc., First lien - Fundednmfc:NMFCSeniorLoanProgramIIILLCMember2023-12-310001496099Energize Holdco LLC, First lien - Fundednmfc:NMFCSeniorLoanProgramIIILLCMember2023-12-310001496099eResearchTechnology, Inc., First lien - Fundednmfc:NMFCSeniorLoanProgramIIILLCMember2023-12-310001496099EyeCare Partners, LLC, First lien - Fundednmfc:NMFCSeniorLoanProgramIIILLCMember2023-12-310001496099Foundational Education Group, Inc., First lien - Fundednmfc:NMFCSeniorLoanProgramIIILLCMember2023-12-310001496099Greenway Health, LLC, First lien - Fundednmfc:NMFCSeniorLoanProgramIIILLCMember2023-12-310001496099Heartland Dental, LLC, First lien - Fundednmfc:NMFCSeniorLoanProgramIIILLCMember2023-12-310001496099Help/Systems Holdings, Inc., First lien - Fundednmfc:NMFCSeniorLoanProgramIIILLCMember2023-12-310001496099Higginbotham Insurance Agency, Inc., First lien - Fundednmfc:NMFCSeniorLoanProgramIIILLCMember2023-12-310001496099HighTower Holding, LLC, First lien - Fundednmfc:NMFCSeniorLoanProgramIIILLCMember2023-12-310001496099Houghton Mifflin Harcourt Company, First lien - Fundednmfc:NMFCSeniorLoanProgramIIILLCMember2023-12-310001496099Idera, Inc., First lien - Fundednmfc:NMFCSeniorLoanProgramIIILLCMember2023-12-310001496099Kestra Advisor Services Holdings A, Inc., First lien - Fundednmfc:NMFCSeniorLoanProgramIIILLCMember2023-12-310001496099nmfc:NMFCSeniorLoanProgramIIILLCMemberLI Group Holdings, Inc., First lien - Funded2023-12-310001496099LSCS Holdings, Inc., First lien - Fundednmfc:NMFCSeniorLoanProgramIIILLCMember2023-12-310001496099Marcel Bidco LLC (Marcel Bidco GmbH), First lien - Fundednmfc:NMFCSeniorLoanProgramIIILLCMember2023-12-310001496099Maverick Bidco Inc., First lien - Funded 1nmfc:NMFCSeniorLoanProgramIIILLCMember2023-12-310001496099Maverick Bidco Inc, First lien - Funded. 2nmfc:NMFCSeniorLoanProgramIIILLCMember2023-12-310001496099Maverick Bidco Inc., First lien - Funded 3nmfc:NMFCSeniorLoanProgramIIILLCMember2023-12-310001496099Mavis Tire Express Services Topco Corp., First lien - Fundednmfc:NMFCSeniorLoanProgramIIILLCMember2023-12-310001496099MED ParentCo, LP, First lien - Fundednmfc:NMFCSeniorLoanProgramIIILLCMember2023-12-310001496099MH Sub I, LLC (Micro Holding Corp.), First lien - Fundednmfc:NMFCSeniorLoanProgramIIILLCMember2023-12-310001496099Netsmart, Inc., First lien - Fundednmfc:NMFCSeniorLoanProgramIIILLCMember2023-12-310001496099Nielsen Consumer Inc., First lien - Fundednmfc:NMFCSeniorLoanProgramIIILLCMember2023-12-310001496099OMNIA Partners, LLC, First lien - Fundednmfc:NMFCSeniorLoanProgramIIILLCMember2023-12-310001496099Optiv Parent Inc., First lien - Fundednmfc:NMFCSeniorLoanProgramIIILLCMember2023-12-310001496099Osaic Holdings, Inc., First lien - Fundednmfc:NMFCSeniorLoanProgramIIILLCMember2023-12-310001496099Osmosis Buyer Limited, First lien - Funded 1nmfc:NMFCSeniorLoanProgramIIILLCMember2023-12-310001496099Osmosis Buyer Limited, First lien - Funded 2nmfc:NMFCSeniorLoanProgramIIILLCMember2023-12-310001496099Pearls (Netherlands) Bidco B.V., First lien - Fundednmfc:NMFCSeniorLoanProgramIIILLCMember2023-12-310001496099Peraton Corp., First lien - Fundednmfc:NMFCSeniorLoanProgramIIILLCMember2023-12-310001496099Physician Partners, LLC, First lien - Fundednmfc:NMFCSeniorLoanProgramIIILLCMember2023-12-310001496099Planview Parent, Inc., First lien - Fundednmfc:NMFCSeniorLoanProgramIIILLCMember2023-12-310001496099nmfc:NMFCSeniorLoanProgramIIILLCMemberPremise Health Holding Corp., First lien - Funded2023-12-310001496099Project Alpha Intermediate Holding, Inc., First lien - Fundednmfc:NMFCSeniorLoanProgramIIILLCMember2023-12-310001496099nmfc:NMFCSeniorLoanProgramIIILLCMemberProject Ruby Ultimate Parent Corp., First lien - Funded 12023-12-310001496099Project Ruby Ultimate Parent Corp., First lien - Funded 2nmfc:NMFCSeniorLoanProgramIIILLCMember2023-12-310001496099RealPage, Inc., First lien - Fundednmfc:NMFCSeniorLoanProgramIIILLCMember2023-12-310001496099Renaissance Holding Corp., First lien - Fundednmfc:NMFCSeniorLoanProgramIIILLCMember2023-12-310001496099RLG Holdings, LLC, First lien - Fundednmfc:NMFCSeniorLoanProgramIIILLCMember2023-12-310001496099RxB Holdings, Inc., First lien - Funded 1nmfc:NMFCSeniorLoanProgramIIILLCMember2023-12-310001496099nmfc:NMFCSeniorLoanProgramIIILLCMemberRxB Holdings, Inc., First lien - Funded 22023-12-310001496099Sierra Enterprises, LLC, First lien - Fundednmfc:NMFCSeniorLoanProgramIIILLCMember2023-12-310001496099Snap One Holdings Corp., First lien - Fundednmfc:NMFCSeniorLoanProgramIIILLCMember2023-12-310001496099Spring Education Group, Inc., First lien - Fundednmfc:NMFCSeniorLoanProgramIIILLCMember2023-12-310001496099Storable, Inc., First lien - Fundednmfc:NMFCSeniorLoanProgramIIILLCMember2023-12-310001496099Symplr Software, Inc., First lien - Fundednmfc:NMFCSeniorLoanProgramIIILLCMember2023-12-310001496099Syndigo LLC, First lien - Fundednmfc:NMFCSeniorLoanProgramIIILLCMember2023-12-310001496099Therapy Brands Holdings LLC, First lien - Fundednmfc:NMFCSeniorLoanProgramIIILLCMember2023-12-310001496099Thermostat Purchaser III, Inc., First lien - Fundednmfc:NMFCSeniorLoanProgramIIILLCMember2023-12-310001496099TMF Sapphire Bidco B.V., First lien - Fundednmfc:NMFCSeniorLoanProgramIIILLCMember2023-12-310001496099TRC Companies LLC, First lien - Fundednmfc:NMFCSeniorLoanProgramIIILLCMember2023-12-310001496099UKG Inc., First lien - Fundednmfc:NMFCSeniorLoanProgramIIILLCMember2023-12-310001496099USI, Inc., First lien - Fundednmfc:NMFCSeniorLoanProgramIIILLCMember2023-12-310001496099Valcour Packaging, LLC, First lien - Fundednmfc:NMFCSeniorLoanProgramIIILLCMember2023-12-310001496099WatchGuard Technologies, Inc., First lien - Fundednmfc:NMFCSeniorLoanProgramIIILLCMember2023-12-310001496099Waystar Technologies, Inc., First lien - Fundednmfc:NMFCSeniorLoanProgramIIILLCMember2023-12-310001496099Wrench Group LLC, First lien - Funded 1nmfc:NMFCSeniorLoanProgramIIILLCMember2023-12-310001496099nmfc:NMFCSeniorLoanProgramIIILLCMemberWrench Group LLC, First lien - Funded 22023-12-310001496099Zest Acquisition Corp., First lien - Fundednmfc:NMFCSeniorLoanProgramIIILLCMember2023-12-310001496099nmfc:FundedSecuritiesMembernmfc:NMFCSeniorLoanProgramIIILLCMember2023-12-310001496099Groundworks, LLC , First lien - Unfundednmfc:NMFCSeniorLoanProgramIIILLCMember2023-12-310001496099OMNIA Partners, LLC , First lien - Unfundednmfc:NMFCSeniorLoanProgramIIILLCMember2023-12-310001496099Osmosis Buyer Limited , First lien - Unfundednmfc:NMFCSeniorLoanProgramIIILLCMember2023-12-310001496099ADMI Corp. (aka Aspen Dental), First lien - Fundednmfc:NMFCSeniorLoanProgramIIILLCMember2022-12-310001496099Advisor Group Holdings, Inc., First lien - Fundednmfc:NMFCSeniorLoanProgramIIILLCMember2022-12-310001496099nmfc:NMFCSeniorLoanProgramIIILLCMemberAG Parent Holdings, LLC, First lien - Funded2022-12-310001496099Artera Services, LLC, First lien - Fundednmfc:NMFCSeniorLoanProgramIIILLCMember2022-12-310001496099AssuredPartners, Inc., First lien - Fundednmfc:NMFCSeniorLoanProgramIIILLCMember2022-12-310001496099Aston FinCo S.a.r.l. / Aston US Finco, LLC, First lien - Fundednmfc:NMFCSeniorLoanProgramIIILLCMember2022-12-310001496099nmfc:NMFCSeniorLoanProgramIIILLCMemberathenahealth Group Inc., First lien - Funded2022-12-310001496099BCPE Empire Holdings, Inc., First lien - Funded 1nmfc:NMFCSeniorLoanProgramIIILLCMember2022-12-310001496099BCPE Empire Holdings, Inc., First lien - Funded 2nmfc:NMFCSeniorLoanProgramIIILLCMember2022-12-310001496099Bella Holding Company, LLC, First lien - Fundednmfc:NMFCSeniorLoanProgramIIILLCMember2022-12-310001496099Bluefin Holding, LLC, First lien - Funded 1nmfc:NMFCSeniorLoanProgramIIILLCMember2022-12-310001496099Bluefin Holding, LLC, First lien - Funded 2nmfc:NMFCSeniorLoanProgramIIILLCMember2022-12-310001496099Bracket Intermediate Holding Corp., First lien - Fundednmfc:NMFCSeniorLoanProgramIIILLCMember2022-12-310001496099Brave Parent Holdings, Inc., First lien - Fundednmfc:NMFCSeniorLoanProgramIIILLCMember2022-12-310001496099Brown Group Holding, LLC, First lien - Fundednmfc:NMFCSeniorLoanProgramIIILLCMember2022-12-310001496099Cano Health, LLC, First lien - Fundednmfc:NMFCSeniorLoanProgramIIILLCMember2022-12-310001496099Cardinal Parent, Inc., First lien - Fundednmfc:NMFCSeniorLoanProgramIIILLCMember2022-12-310001496099CE Intermediate I, LLC, First lien - Fundednmfc:NMFCSeniorLoanProgramIIILLCMember2022-12-310001496099CentralSquare Technologies, LLC, First lien - Fundednmfc:NMFCSeniorLoanProgramIIILLCMember2022-12-310001496099nmfc:NMFCSeniorLoanProgramIIILLCMemberCHA Holdings, Inc., First lien - Funded2022-12-310001496099CommerceHub, Inc., First lien - Fundednmfc:NMFCSeniorLoanProgramIIILLCMember2022-12-310001496099Confluent Health, LLC, First lien - Funded 1nmfc:NMFCSeniorLoanProgramIIILLCMember2022-12-310001496099Confluent Health, LLC, First lien - Funded 2nmfc:NMFCSeniorLoanProgramIIILLCMember2022-12-310001496099Confluent Medical Technologies, Inc., First lien - Fundednmfc:NMFCSeniorLoanProgramIIILLCMember2022-12-310001496099Convey Health Solutions, Inc., First lien - Fundednmfc:NMFCSeniorLoanProgramIIILLCMember2022-12-310001496099Cornerstone OnDemand, Inc., First lien - Fundednmfc:NMFCSeniorLoanProgramIIILLCMember2022-12-310001496099Covenant Surgical Partners, Inc., First lien - Funded 1nmfc:NMFCSeniorLoanProgramIIILLCMember2022-12-310001496099Covenant Surgical Partners, Inc., First lien - Funded 2nmfc:NMFCSeniorLoanProgramIIILLCMember2022-12-310001496099nmfc:NMFCSeniorLoanProgramIIILLCMemberCRCI Longhorn Holdings, Inc., First lien - Funded2022-12-310001496099CVET Midco 2, L.P., First lien - Fundednmfc:NMFCSeniorLoanProgramIIILLCMember2022-12-310001496099DG Investment Intermediate Holdings 2, Inc., First lien - Fundednmfc:NMFCSeniorLoanProgramIIILLCMember2022-12-310001496099Dealer Tire Financial, LLC, First lien - Fundednmfc:NMFCSeniorLoanProgramIIILLCMember2022-12-310001496099Discovery Purchaser Corporation, First lien - Fundednmfc:NMFCSeniorLoanProgramIIILLCMember2022-12-310001496099Dispatch Acquisition Holdings, LLC, First lien - Fundednmfc:NMFCSeniorLoanProgramIIILLCMember2022-12-310001496099Drilling Info Holdings, Inc., First lien - Fundednmfc:NMFCSeniorLoanProgramIIILLCMember2022-12-310001496099EAB Global, Inc., First lien - Fundednmfc:NMFCSeniorLoanProgramIIILLCMember2022-12-310001496099Energize Holdco LLC, First lien - Fundednmfc:NMFCSeniorLoanProgramIIILLCMember2022-12-310001496099eResearchTechnology, Inc., First lien - Fundednmfc:NMFCSeniorLoanProgramIIILLCMember2022-12-310001496099EyeCare Partners, LLC, First lien - Fundednmfc:NMFCSeniorLoanProgramIIILLCMember2022-12-310001496099Foundational Education Group, Inc., First lien - Fundednmfc:NMFCSeniorLoanProgramIIILLCMember2022-12-310001496099Greenway Health, LLC, First lien - Fundednmfc:NMFCSeniorLoanProgramIIILLCMember2022-12-310001496099Heartland Dental, LLC, First lien - Fundednmfc:NMFCSeniorLoanProgramIIILLCMember2022-12-310001496099Help/Systems Holdings, Inc., First lien - Fundednmfc:NMFCSeniorLoanProgramIIILLCMember2022-12-310001496099Higginbotham Insurance Agency, Inc., First lien - Fundednmfc:NMFCSeniorLoanProgramIIILLCMember2022-12-310001496099HighTower Holding, LLC, First lien - Fundednmfc:NMFCSeniorLoanProgramIIILLCMember2022-12-310001496099Houghton Mifflin Harcourt Company, First lien - Fundednmfc:NMFCSeniorLoanProgramIIILLCMember2022-12-310001496099Idera, Inc., First lien - Fundednmfc:NMFCSeniorLoanProgramIIILLCMember2022-12-310001496099Kestra Advisor Services Holdings A, Inc., First lien - Fundednmfc:NMFCSeniorLoanProgramIIILLCMember2022-12-310001496099nmfc:NMFCSeniorLoanProgramIIILLCMemberLI Group Holdings, Inc., First lien - Funded2022-12-310001496099LSCS Holdings, Inc., First lien - Fundednmfc:NMFCSeniorLoanProgramIIILLCMember2022-12-310001496099nmfc:NMFCSeniorLoanProgramIIILLCMemberMamba Purchaser, Inc., First lien - Funded2022-12-310001496099Maverick Bidco Inc., First lien - Funded 1nmfc:NMFCSeniorLoanProgramIIILLCMember2022-12-310001496099Maverick Bidco Inc., First lien - Funded 2nmfc:NMFCSeniorLoanProgramIIILLCMember2022-12-310001496099Mavis Tire Express Services Topco Corp., First lien - Fundednmfc:NMFCSeniorLoanProgramIIILLCMember2022-12-310001496099MED ParentCo, LP, First lien - Fundednmfc:NMFCSeniorLoanProgramIIILLCMember2022-12-310001496099Mercury Borrower, Inc., First lien - Fundednmfc:NMFCSeniorLoanProgramIIILLCMember2022-12-310001496099MH Sub I, LLC (Micro Holding Corp.), First lien - Fundednmfc:NMFCSeniorLoanProgramIIILLCMember2022-12-310001496099Mitnick Corporate Purchaser, Inc., First lien - Fundednmfc:NMFCSeniorLoanProgramIIILLCMember2022-12-310001496099National Intergovernmental Purchasing Alliance Company, First lien - Fundednmfc:NMFCSeniorLoanProgramIIILLCMember2022-12-310001496099Navex Topco, Inc., First lien - Fundednmfc:NMFCSeniorLoanProgramIIILLCMember2022-12-310001496099Netsmart, Inc., First lien - Fundednmfc:NMFCSeniorLoanProgramIIILLCMember2022-12-310001496099Outcomes Group Holdings, Inc., First lien - Fundednmfc:NMFCSeniorLoanProgramIIILLCMember2022-12-310001496099Pearls (Netherlands) Bidco B.V., First lien - Fundednmfc:NMFCSeniorLoanProgramIIILLCMember2022-12-310001496099Peraton Corp., First lien - Fundednmfc:NMFCSeniorLoanProgramIIILLCMember2022-12-310001496099PetVet Care Centers, LLC (fka Pearl Intermediate Parent LLC), First lien - Fundednmfc:NMFCSeniorLoanProgramIIILLCMember2022-12-310001496099Physician Partners, LLC, First lien - Fundednmfc:NMFCSeniorLoanProgramIIILLCMember2022-12-310001496099Planview Parent, Inc., First lien - Fundednmfc:NMFCSeniorLoanProgramIIILLCMember2022-12-310001496099nmfc:NMFCSeniorLoanProgramIIILLCMemberPremise Health Holding Corp., First lien - Funded2022-12-310001496099nmfc:NMFCSeniorLoanProgramIIILLCMemberProject Ruby Ultimate Parent Corp., First lien - Funded 12022-12-310001496099Project Ruby Ultimate Parent Corp., First lien - Funded 2nmfc:NMFCSeniorLoanProgramIIILLCMember2022-12-310001496099RealPage, Inc., First lien - Fundednmfc:NMFCSeniorLoanProgramIIILLCMember2022-12-310001496099RLG Holdings, LLC, First lien - Fundednmfc:NMFCSeniorLoanProgramIIILLCMember2022-12-310001496099Sierra Enterprises, LLC, First lien - Fundednmfc:NMFCSeniorLoanProgramIIILLCMember2022-12-310001496099Snap One Holdings Corp., First lien - Fundednmfc:NMFCSeniorLoanProgramIIILLCMember2022-12-310001496099Sovos Brands Intermediate, Inc., First lien - Fundednmfc:NMFCSeniorLoanProgramIIILLCMember2022-12-310001496099Spring Education Group, Inc. (fka SSH Group Holdings, Inc.), First lien - Fundednmfc:NMFCSeniorLoanProgramIIILLCMember2022-12-310001496099Storable, Inc., First lien - Fundednmfc:NMFCSeniorLoanProgramIIILLCMember2022-12-310001496099Symplr Software, Inc., First lien - Fundednmfc:NMFCSeniorLoanProgramIIILLCMember2022-12-310001496099Syndigo LLC, First lien - Fundednmfc:NMFCSeniorLoanProgramIIILLCMember2022-12-310001496099Therapy Brands Holdings LLC, First lien - Fundednmfc:NMFCSeniorLoanProgramIIILLCMember2022-12-310001496099Thermostat Purchaser III, Inc., First lien - Fundednmfc:NMFCSeniorLoanProgramIIILLCMember2022-12-310001496099USI, Inc. (fka Compass Investors Inc.), First lien - Fundednmfc:NMFCSeniorLoanProgramIIILLCMember2022-12-310001496099Valcour Packaging, LLC, First lien - Fundednmfc:NMFCSeniorLoanProgramIIILLCMember2022-12-310001496099nmfc:NMFCSeniorLoanProgramIIILLCMemberVT Topco, Inc., First lien - Funded 12022-12-310001496099VT Topco, Inc., First lien - Funded 2nmfc:NMFCSeniorLoanProgramIIILLCMember2022-12-310001496099VT Topco, Inc., First lien - Funded 3nmfc:NMFCSeniorLoanProgramIIILLCMember2022-12-310001496099WatchGuard Technologies, Inc., First lien - Fundednmfc:NMFCSeniorLoanProgramIIILLCMember2022-12-310001496099Waystar Technologies, Inc., First lien - Fundednmfc:NMFCSeniorLoanProgramIIILLCMember2022-12-310001496099WP CityMD Bidco LLC, First lien - Fundednmfc:NMFCSeniorLoanProgramIIILLCMember2022-12-310001496099Wrench Group LLC, First lien - Fundednmfc:NMFCSeniorLoanProgramIIILLCMember2022-12-310001496099YI, LLC, First lien - Fundednmfc:NMFCSeniorLoanProgramIIILLCMember2022-12-310001496099nmfc:FundedSecuritiesMembernmfc:NMFCSeniorLoanProgramIIILLCMember2022-12-310001496099athenahealth Group Inc., First lien - Unfundednmfc:NMFCSeniorLoanProgramIIILLCMember2022-12-310001496099Confluent Health, LLC, First lien - Unfundednmfc:NMFCSeniorLoanProgramIIILLCMember2022-12-310001496099Thermostat Purchaser III, Inc., First lien - Unfundednmfc:NMFCSeniorLoanProgramIIILLCMember2022-12-310001496099VT Topco, Inc., First lien - Unfundednmfc:NMFCSeniorLoanProgramIIILLCMember2022-12-310001496099nmfc:NMFCSeniorLoanProgramIIILLCMember2022-01-012022-12-310001496099nmfc:NMFCSeniorLoanProgramIIILLCMember2021-01-012021-12-310001496099nmfc:NMFCSeniorLoanProgramIIILLCMember2023-01-012023-12-310001496099nmfc:NMFCSeniorLoanProgramIIILLCMember2022-01-012022-12-310001496099nmfc:NMFCSeniorLoanProgramIIILLCMember2021-01-012021-12-310001496099nmfc:NMFCSeniorLoanProgramIIILLCMember2022-12-310001496099nmfc:NMFCSeniorLoanProgramIVLLCMember2023-01-012023-12-310001496099nmfc:NMFCSeniorLoanProgramIVLLCMember2023-12-310001496099nmfc:SkyKnightIncomeAlphaLLCMembernmfc:NMFCSeniorLoanProgramIVLLCMember2023-12-310001496099us-gaap:LineOfCreditMemberus-gaap:RevolvingCreditFacilityMembernmfc:NMFCSeniorLoanProgramIVLLCMember2021-05-050001496099nmfc:SecuredOvernightFinancingRateSOFRMemberus-gaap:LineOfCreditMemberus-gaap:RevolvingCreditFacilityMembernmfc:NMFCSeniorLoanProgramIVLLCMember2023-04-282023-04-280001496099nmfc:LondonInterbankOfferedRateLIBOR1Memberus-gaap:LineOfCreditMemberus-gaap:RevolvingCreditFacilityMembernmfc:NMFCSeniorLoanProgramIVLLCMember2021-05-052021-05-050001496099nmfc:NMFCSeniorLoanProgramIVLLCMember2023-12-310001496099nmfc:NMFCSeniorLoanProgramIVLLCMember2022-12-310001496099us-gaap:RevolvingCreditFacilityMembernmfc:NMFCSeniorLoanProgramIVLLCMember2023-12-310001496099us-gaap:RevolvingCreditFacilityMembernmfc:NMFCSeniorLoanProgramIVLLCMember2022-12-310001496099nmfc:NMFCSeniorLoanProgramIVLLCMembernmfc:UnfundedSecuritiesMember2023-12-310001496099nmfc:NMFCSeniorLoanProgramIVLLCMembernmfc:UnfundedSecuritiesMember2022-12-310001496099srt:WeightedAverageMembernmfc:NMFCSeniorLoanProgramIVLLCMember2023-12-310001496099srt:WeightedAverageMembernmfc:NMFCSeniorLoanProgramIVLLCMember2022-12-310001496099Largest Portfolio Company Investmentnmfc:NMFCSeniorLoanProgramIVLLCMember2023-12-310001496099Largest Portfolio Company Investmentnmfc:NMFCSeniorLoanProgramIVLLCMember2022-12-310001496099Top Five Largest Portfolio Company Investmentsnmfc:NMFCSeniorLoanProgramIVLLCMember2023-12-310001496099Top Five Largest Portfolio Company Investmentsnmfc:NMFCSeniorLoanProgramIVLLCMember2022-12-310001496099ADG, LLC, First lien - Fundednmfc:NMFCSeniorLoanProgramIVLLCMember2023-12-310001496099ADMI Corp. (aka Aspen Dental), First lien - Fundednmfc:NMFCSeniorLoanProgramIVLLCMember2023-12-310001496099Aretec Group, Inc. (fka RCS Capital Corporation), First lien - Fundednmfc:NMFCSeniorLoanProgramIVLLCMember2023-12-310001496099Artera Services, LLC, First lien - Fundednmfc:NMFCSeniorLoanProgramIVLLCMember2023-12-310001496099Ascensus Group Holdings, Inc., First lien - Fundednmfc:NMFCSeniorLoanProgramIVLLCMember2023-12-310001496099nmfc:NMFCSeniorLoanProgramIVLLCMemberathenahealth Group Inc., First lien - Funded2023-12-310001496099Barracuda Parent, LLC, First lien - Fundednmfc:NMFCSeniorLoanProgramIVLLCMember2023-12-310001496099nmfc:NMFCSeniorLoanProgramIVLLCMemberBayou Intermediate II, LLC, First lien - Funded2023-12-310001496099BCPE Empire Holdings, Inc., First lien - Fundednmfc:NMFCSeniorLoanProgramIVLLCMember2023-12-310001496099Bella Holding Company, LLC., First lien - Fundednmfc:NMFCSeniorLoanProgramIVLLCMember2023-12-310001496099Bleriot US Bidco Inc., First lien - Fundednmfc:NMFCSeniorLoanProgramIVLLCMember2023-12-310001496099Boxer Parent Company Inc., First lien - Fundednmfc:NMFCSeniorLoanProgramIVLLCMember2023-12-310001496099Bracket Intermediate Holding Corp., First lien - Fundednmfc:NMFCSeniorLoanProgramIVLLCMember2023-12-310001496099Brown Group Holding, LLC, First lien - Fundednmfc:NMFCSeniorLoanProgramIVLLCMember2023-12-310001496099CE Intermediate I, LLC, First lien - Fundednmfc:NMFCSeniorLoanProgramIVLLCMember2023-12-310001496099CentralSquare Technologies, LLC, First lien - Fundednmfc:NMFCSeniorLoanProgramIVLLCMember2023-12-310001496099nmfc:NMFCSeniorLoanProgramIVLLCMemberCHA Holdings, Inc., First lien - Funded 12023-12-310001496099nmfc:NMFCSeniorLoanProgramIVLLCMemberCHA Holdings, Inc., First lien - Funded 22023-12-310001496099Cloudera, Inc., First lien - Fundednmfc:NMFCSeniorLoanProgramIVLLCMember2023-12-310001496099Confluent Health, LLC, First lien - Fundednmfc:NMFCSeniorLoanProgramIVLLCMember2023-12-310001496099nmfc:NMFCSeniorLoanProgramIVLLCMemberConfluent Medical Technologies, Inc., First lien - Funded2023-12-310001496099Convey Health Solutions, Inc., First lien - Fundednmfc:NMFCSeniorLoanProgramIVLLCMember2023-12-310001496099Cornerstone OnDemand, Inc., First lien - Fundednmfc:NMFCSeniorLoanProgramIVLLCMember2023-12-310001496099CVET Midco 2, L.P., First lien - Fundednmfc:NMFCSeniorLoanProgramIVLLCMember2023-12-310001496099nmfc:NMFCSeniorLoanProgramIVLLCMemberDealer Tire Financial, LLC, First lien - Funded2023-12-310001496099Discovery Purchaser Corporation, First lien - Fundednmfc:NMFCSeniorLoanProgramIVLLCMember2023-12-310001496099Dispatch Acquisition Holdings, LLC, First lien - Fundednmfc:NMFCSeniorLoanProgramIVLLCMember2023-12-310001496099EAB Global, Inc., First lien - Fundednmfc:NMFCSeniorLoanProgramIVLLCMember2023-12-310001496099Eagle Parent Corp., First lien - Fundednmfc:NMFCSeniorLoanProgramIVLLCMember2023-12-310001496099Eisner Advisory Group LLC, First lien - Fundednmfc:NMFCSeniorLoanProgramIVLLCMember2023-12-310001496099eResearchTechnology, Inc., First lien - Fundednmfc:NMFCSeniorLoanProgramIVLLCMember2023-12-310001496099nmfc:NMFCSeniorLoanProgramIVLLCMemberEyeCare Partners, LLC, First lien - Funded2023-12-310001496099Foundational Education Group, Inc., First lien - Fundednmfc:NMFCSeniorLoanProgramIVLLCMember2023-12-310001496099Geo Parent Corporation, First lien - Fundednmfc:NMFCSeniorLoanProgramIVLLCMember2023-12-310001496099Heartland Dental, LLC, First lien - Fundednmfc:NMFCSeniorLoanProgramIVLLCMember2023-12-310001496099nmfc:NMFCSeniorLoanProgramIVLLCMemberHelp/Systems Holdings, Inc., First lien - Funded2023-12-310001496099Houghton Mifflin Harcourt Company, First lien - Fundednmfc:NMFCSeniorLoanProgramIVLLCMember2023-12-310001496099Hub International Limited, First lien - Fundednmfc:NMFCSeniorLoanProgramIVLLCMember2023-12-310001496099Hunter Holdco 3 Limited, First lien - Fundednmfc:NMFCSeniorLoanProgramIVLLCMember2023-12-310001496099Idera, Inc., First lien - Fundednmfc:NMFCSeniorLoanProgramIVLLCMember2023-12-310001496099Kestra Advisor Services Holdings A, Inc., First lien - Fundednmfc:NMFCSeniorLoanProgramIVLLCMember2023-12-310001496099LSCS Holdings, Inc., First lien - Fundednmfc:NMFCSeniorLoanProgramIVLLCMember2023-12-310001496099Mandolin Technology Intermediate Holdings, Inc., First lien - Fundednmfc:NMFCSeniorLoanProgramIVLLCMember2023-12-310001496099Marcel Bidco LLC (Marcel Bidco GmbH), First lien - Fundednmfc:NMFCSeniorLoanProgramIVLLCMember2023-12-310001496099Maverick Bidco Inc., First lien - Funded 1nmfc:NMFCSeniorLoanProgramIVLLCMember2023-12-310001496099Maverick Bidco Inc., First lien - Funded 2nmfc:NMFCSeniorLoanProgramIVLLCMember2023-12-310001496099Mavis Tire Express Services Topco Corp., First lien - Fundednmfc:NMFCSeniorLoanProgramIVLLCMember2023-12-310001496099MH Sub I, LLC (Micro Holding Corp.), First lien - Fundednmfc:NMFCSeniorLoanProgramIVLLCMember2023-12-310001496099Netsmart, Inc., First lien - Fundednmfc:NMFCSeniorLoanProgramIVLLCMember2023-12-310001496099nmfc:NMFCSeniorLoanProgramIVLLCMemberNielsen Consumer Inc., First lien - Funded2023-12-310001496099OEConnection LLC, First lien - Fundednmfc:NMFCSeniorLoanProgramIVLLCMember2023-12-310001496099OMNIA Partners, LLC, First lien - Fundednmfc:NMFCSeniorLoanProgramIVLLCMember2023-12-310001496099Optiv Parent Inc., First lien - Fundednmfc:NMFCSeniorLoanProgramIVLLCMember2023-12-310001496099Osaic Holdings, Inc.nmfc:NMFCSeniorLoanProgramIVLLCMember2023-12-310001496099Osmosis Buyer Limited, First lien - Funded 1nmfc:NMFCSeniorLoanProgramIVLLCMember2023-12-310001496099Osmosis Buyer Limited, First lien - Funded 2nmfc:NMFCSeniorLoanProgramIVLLCMember2023-12-310001496099Pearls (Netherlands) Bidco B.V., First lien - Fundednmfc:NMFCSeniorLoanProgramIVLLCMember2023-12-310001496099Physician Partners, LLC, First lien - Fundednmfc:NMFCSeniorLoanProgramIVLLCMember2023-12-310001496099nmfc:NMFCSeniorLoanProgramIVLLCMemberPremise Health Holding Corp., First lien - Funded2023-12-310001496099Project Alpha Intermediate Holding, Inc., First lien - Fundednmfc:NMFCSeniorLoanProgramIVLLCMember2023-12-310001496099nmfc:NMFCSeniorLoanProgramIVLLCMemberRealPage, Inc., First lien - Funded2023-12-310001496099nmfc:NMFCSeniorLoanProgramIVLLCMemberRenaissance Holding Corp., First lien - Funded2023-12-310001496099RxB Holdings, Inc., First lien - Fundednmfc:NMFCSeniorLoanProgramIVLLCMember2023-12-310001496099Sierra Enterprises, LLC, First lien - Fundednmfc:NMFCSeniorLoanProgramIVLLCMember2023-12-310001496099Snap One Holdings Corp., First lien - Fundednmfc:NMFCSeniorLoanProgramIVLLCMember2023-12-310001496099Spring Education Group, Inc., First lien - Fundednmfc:NMFCSeniorLoanProgramIVLLCMember2023-12-310001496099nmfc:NMFCSeniorLoanProgramIVLLCMemberSTATS Intermediate Holdings, LLC, First lien - Funded2023-12-310001496099Storable, Inc., First lien - Fundednmfc:NMFCSeniorLoanProgramIVLLCMember2023-12-310001496099Symplr Software, Inc., First lien - Fundednmfc:NMFCSeniorLoanProgramIVLLCMember2023-12-310001496099nmfc:NMFCSeniorLoanProgramIVLLCMemberSyndigo LLC, First lien - Funded2023-12-310001496099Therapy Brands Holdings LLC, First lien - Fundednmfc:NMFCSeniorLoanProgramIVLLCMember2023-12-310001496099Thermostat Purchaser III, Inc., First lien - Fundednmfc:NMFCSeniorLoanProgramIVLLCMember2023-12-310001496099TRC Companies LLC, First lien - Fundednmfc:NMFCSeniorLoanProgramIVLLCMember2023-12-310001496099USIC Holdings, Inc., First lien - Fundednmfc:NMFCSeniorLoanProgramIVLLCMember2023-12-310001496099Valcour Packaging, LLC, First lien - Fundednmfc:NMFCSeniorLoanProgramIVLLCMember2023-12-310001496099nmfc:NMFCSeniorLoanProgramIVLLCMemberVT Topco, Inc., First lien - Funded2023-12-310001496099WatchGuard Technologies, Inc., First lien - Fundednmfc:NMFCSeniorLoanProgramIVLLCMember2023-12-310001496099Wrench Group LLC, First lien - Fundednmfc:NMFCSeniorLoanProgramIVLLCMember2023-12-310001496099Zest Acquisition Corp., First lien - Fundednmfc:NMFCSeniorLoanProgramIVLLCMember2023-12-310001496099Zone Climate Services, Inc., First lien - Funded 1nmfc:NMFCSeniorLoanProgramIVLLCMember2023-12-310001496099nmfc:NMFCSeniorLoanProgramIVLLCMemberZone Climate Services, Inc., First lien - Funded 22023-12-310001496099nmfc:FundedSecuritiesMembernmfc:NMFCSeniorLoanProgramIVLLCMember2023-12-310001496099OMNIA Partners, LLC, First lien - Unfundednmfc:NMFCSeniorLoanProgramIVLLCMember2023-12-310001496099Osmosis Buyer Limited, First lien - Unfundednmfc:NMFCSeniorLoanProgramIVLLCMember2023-12-310001496099ADG, LLC, First lien - Fundednmfc:NMFCSeniorLoanProgramIVLLCMember2022-12-310001496099ADMI Corp. (aka Aspen Dental), First lien - Fundednmfc:NMFCSeniorLoanProgramIVLLCMember2022-12-310001496099Advisor Group Holdings, Inc., First lien - Fundednmfc:NMFCSeniorLoanProgramIVLLCMember2022-12-310001496099Artera Services, LLC, First lien - Fundednmfc:NMFCSeniorLoanProgramIVLLCMember2022-12-310001496099nmfc:NMFCSeniorLoanProgramIVLLCMemberathenahealth Group Inc., First lien - Funded2022-12-310001496099Barracuda Parent, LLC, First lien - Fundednmfc:NMFCSeniorLoanProgramIVLLCMember2022-12-310001496099nmfc:NMFCSeniorLoanProgramIVLLCMemberBayou Intermediate II, LLC, First lien - Funded2022-12-310001496099Bella Holding Company, LLC, First lien - Fundednmfc:NMFCSeniorLoanProgramIVLLCMember2022-12-310001496099Bleriot US Bidco Inc., First lien - Fundednmfc:NMFCSeniorLoanProgramIVLLCMember2022-12-310001496099Bracket Intermediate Holding Corp., First lien - Fundednmfc:NMFCSeniorLoanProgramIVLLCMember2022-12-310001496099Brave Parent Holdings, Inc., First lien - Fundednmfc:NMFCSeniorLoanProgramIVLLCMember2022-12-310001496099Brown Group Holding, LLC, First lien - Fundednmfc:NMFCSeniorLoanProgramIVLLCMember2022-12-310001496099Cano Health, LLC, First lien - Fundednmfc:NMFCSeniorLoanProgramIVLLCMember2022-12-310001496099CE Intermediate I, LLC, First lien - Fundednmfc:NMFCSeniorLoanProgramIVLLCMember2022-12-310001496099CentralSquare Technologies, LLC, First lien - Fundednmfc:NMFCSeniorLoanProgramIVLLCMember2022-12-310001496099nmfc:NMFCSeniorLoanProgramIVLLCMemberCertara Holdco, Inc., First lien - Funded2022-12-310001496099nmfc:NMFCSeniorLoanProgramIVLLCMemberCHA Holdings, Inc., First lien - Funded 12022-12-310001496099nmfc:NMFCSeniorLoanProgramIVLLCMemberCHA Holdings, Inc., First lien - Funded 22022-12-310001496099nmfc:NMFCSeniorLoanProgramIVLLCMemberConfluent Health, LLC, First lien - Funded 12022-12-310001496099Confluent Health, LLC, First lien - Funded 2nmfc:NMFCSeniorLoanProgramIVLLCMember2022-12-310001496099nmfc:NMFCSeniorLoanProgramIVLLCMemberConfluent Medical Technologies, Inc., First lien - Funded2022-12-310001496099Convey Health Solutions, Inc., First lien - Fundednmfc:NMFCSeniorLoanProgramIVLLCMember2022-12-310001496099Cornerstone OnDemand, Inc., First lien - Fundednmfc:NMFCSeniorLoanProgramIVLLCMember2022-12-310001496099CVET Midco 2, L.P., First lien - Fundednmfc:NMFCSeniorLoanProgramIVLLCMember2022-12-310001496099nmfc:NMFCSeniorLoanProgramIVLLCMemberDealer Tire Financial, LLC, First lien - Funded2022-12-310001496099Discovery Purchaser Corporation, First lien - Fundednmfc:NMFCSeniorLoanProgramIVLLCMember2022-12-310001496099Dispatch Acquisition Holdings, LLC, First lien - Fundednmfc:NMFCSeniorLoanProgramIVLLCMember2022-12-310001496099Drilling Info Holdings, Inc., First lien - Fundednmfc:NMFCSeniorLoanProgramIVLLCMember2022-12-310001496099EAB Global, Inc., First lien - Fundednmfc:NMFCSeniorLoanProgramIVLLCMember2022-12-310001496099Emerald 2 Limited, First lien - Fundednmfc:NMFCSeniorLoanProgramIVLLCMember2022-12-310001496099Energize Holdco LLC, First lien - Fundednmfc:NMFCSeniorLoanProgramIVLLCMember2022-12-310001496099eResearchTechnology, Inc., First lien - Fundednmfc:NMFCSeniorLoanProgramIVLLCMember2022-12-310001496099nmfc:NMFCSeniorLoanProgramIVLLCMemberEyeCare Partners, LLC, First lien - Funded2022-12-310001496099Foundational Education Group, Inc., First lien - Fundednmfc:NMFCSeniorLoanProgramIVLLCMember2022-12-310001496099Geo Parent Corporation, First lien - Fundednmfc:NMFCSeniorLoanProgramIVLLCMember2022-12-310001496099Greenway Health, LLC, First lien - Fundednmfc:NMFCSeniorLoanProgramIVLLCMember2022-12-310001496099Heartland Dental, LLC, First lien - Funded 1nmfc:NMFCSeniorLoanProgramIVLLCMember2022-12-310001496099Heartland Dental, LLC, First lien - Funded 2nmfc:NMFCSeniorLoanProgramIVLLCMember2022-12-310001496099nmfc:NMFCSeniorLoanProgramIVLLCMemberHelp/Systems Holdings, Inc., First lien - Funded2022-12-310001496099Houghton Mifflin Harcourt Company, First lien - Fundednmfc:NMFCSeniorLoanProgramIVLLCMember2022-12-310001496099Hunter Holdco 3 Limited, First lien - Fundednmfc:NMFCSeniorLoanProgramIVLLCMember2022-12-310001496099Idera, Inc., First lien - Fundednmfc:NMFCSeniorLoanProgramIVLLCMember2022-12-310001496099Kestra Advisor Services Holdings A, Inc., First lien - Fundednmfc:NMFCSeniorLoanProgramIVLLCMember2022-12-310001496099LSCS Holdings, Inc., First lien - Fundednmfc:NMFCSeniorLoanProgramIVLLCMember2022-12-310001496099nmfc:NMFCSeniorLoanProgramIVLLCMemberMamba Purchaser, Inc., First lien - Funded2022-12-310001496099Mandolin Technology Intermediate Holdings, Inc., First lien - Fundednmfc:NMFCSeniorLoanProgramIVLLCMember2022-12-310001496099Maverick Bidco Inc., First lien - Funded 1nmfc:NMFCSeniorLoanProgramIVLLCMember2022-12-310001496099Maverick Bidco Inc., First lien - Funded 2nmfc:NMFCSeniorLoanProgramIVLLCMember2022-12-310001496099Mavis Tire Express Services Topco Corp., First lien - Fundednmfc:NMFCSeniorLoanProgramIVLLCMember2022-12-310001496099Mercury Borrower, Inc., First lien - Fundednmfc:NMFCSeniorLoanProgramIVLLCMember2022-12-310001496099MH Sub I, LLC (Micro Holding Corp.), First lien - Fundednmfc:NMFCSeniorLoanProgramIVLLCMember2022-12-310001496099National Intergovernmental Purchasing Alliance Company, First lien - Fundednmfc:NMFCSeniorLoanProgramIVLLCMember2022-12-310001496099Netsmart, Inc., First lien - Fundednmfc:NMFCSeniorLoanProgramIVLLCMember2022-12-310001496099OEConnection LLC, First lien - Fundednmfc:NMFCSeniorLoanProgramIVLLCMember2022-12-310001496099Pearls (Netherlands) Bidco B.V., First lien - Fundednmfc:NMFCSeniorLoanProgramIVLLCMember2022-12-310001496099PetVet Care Centers, LLC (fka Pearl Intermediate Parent LLC), First lien - Fundednmfc:NMFCSeniorLoanProgramIVLLCMember2022-12-310001496099Physician Partners, LLC, First lien - Fundednmfc:NMFCSeniorLoanProgramIVLLCMember2022-12-310001496099nmfc:NMFCSeniorLoanProgramIVLLCMemberPremise Health Holding Corp., First lien - Funded2022-12-310001496099Project Boost Purchaser, LLC, First lien - Fundednmfc:NMFCSeniorLoanProgramIVLLCMember2022-12-310001496099nmfc:NMFCSeniorLoanProgramIVLLCMemberRealPage, Inc., First lien - Funded2022-12-310001496099RLG Holdings, LLC, First lien - Fundednmfc:NMFCSeniorLoanProgramIVLLCMember2022-12-310001496099Sierra Enterprises, LLC, First lien - Fundednmfc:NMFCSeniorLoanProgramIVLLCMember2022-12-310001496099Snap One Holdings Corp., First lien - Fundednmfc:NMFCSeniorLoanProgramIVLLCMember2022-12-310001496099Sovos Brands Intermediate, Inc., First lien - Fundednmfc:NMFCSeniorLoanProgramIVLLCMember2022-12-310001496099nmfc:NMFCSeniorLoanProgramIVLLCMemberSTATS Intermediate Holdings, LLC, First lien - Funded2022-12-310001496099Storable, Inc., First lien - Fundednmfc:NMFCSeniorLoanProgramIVLLCMember2022-12-310001496099Symplr Software, Inc., First lien - Fundednmfc:NMFCSeniorLoanProgramIVLLCMember2022-12-310001496099nmfc:NMFCSeniorLoanProgramIVLLCMemberSyndigo LLC, First lien - Funded2022-12-310001496099Therapy Brands Holdings LLC, First lien - Fundednmfc:NMFCSeniorLoanProgramIVLLCMember2022-12-310001496099Thermostat Purchaser III, Inc., First lien - Fundednmfc:NMFCSeniorLoanProgramIVLLCMember2022-12-310001496099USIC Holdings, Inc., First lien - Fundednmfc:NMFCSeniorLoanProgramIVLLCMember2022-12-310001496099Valcour Packaging, LLC, First lien - Fundednmfc:NMFCSeniorLoanProgramIVLLCMember2022-12-310001496099Virtusa Corporation, First lien - Fundednmfc:NMFCSeniorLoanProgramIVLLCMember2022-12-310001496099nmfc:NMFCSeniorLoanProgramIVLLCMemberVT Topco, Inc., First lien - Funded 12022-12-310001496099nmfc:NMFCSeniorLoanProgramIVLLCMemberVT Topco, Inc., First lien - Funded 22022-12-310001496099WatchGuard Technologies, Inc., First lien - Fundednmfc:NMFCSeniorLoanProgramIVLLCMember2022-12-310001496099Wrench Group LLC, First lien - Fundednmfc:NMFCSeniorLoanProgramIVLLCMember2022-12-310001496099YI, LLC, First lien - Fundednmfc:NMFCSeniorLoanProgramIVLLCMember2022-12-310001496099Zone Climate Services, Inc., First lien - Funded 1nmfc:NMFCSeniorLoanProgramIVLLCMember2022-12-310001496099nmfc:NMFCSeniorLoanProgramIVLLCMemberZone Climate Services, Inc., First lien - Funded 22022-12-310001496099nmfc:FundedSecuritiesMembernmfc:NMFCSeniorLoanProgramIVLLCMember2022-12-310001496099nmfc:NMFCSeniorLoanProgramIVLLCMemberathenahealth Group Inc., First lien - Unfunded2022-12-310001496099Confluent Health, LLC, First lien - Unfundednmfc:NMFCSeniorLoanProgramIVLLCMember2022-12-310001496099Thermostat Purchaser III, Inc., First lien - Unfundednmfc:NMFCSeniorLoanProgramIVLLCMember2022-12-310001496099VT Topco, Inc., First lien - Unfundednmfc:NMFCSeniorLoanProgramIVLLCMember2022-12-310001496099nmfc:NMFCSeniorLoanProgramIVLLCMember2022-01-012022-12-310001496099nmfc:NMFCSeniorLoanProgramIVLLCMember2021-05-052021-12-310001496099nmfc:NMFCSeniorLoanProgramIVLLCMember2023-01-012023-12-310001496099nmfc:NMFCSeniorLoanProgramIVLLCMember2022-01-012022-12-310001496099nmfc:NMFCSeniorLoanProgramIVLLCMember2021-05-052021-12-310001496099nmfc:NMFCSeniorLoanProgramIVLLCMember2022-12-310001496099nmfc:DebtSecuritiesFirstLienMember2023-12-310001496099us-gaap:FairValueInputsLevel1Membernmfc:DebtSecuritiesFirstLienMember2023-12-310001496099us-gaap:FairValueInputsLevel2Membernmfc:DebtSecuritiesFirstLienMember2023-12-310001496099us-gaap:FairValueInputsLevel3Membernmfc:DebtSecuritiesFirstLienMember2023-12-310001496099nmfc:DebtSecuritiesSecondLienMember2023-12-310001496099us-gaap:FairValueInputsLevel1Membernmfc:DebtSecuritiesSecondLienMember2023-12-310001496099us-gaap:FairValueInputsLevel2Membernmfc:DebtSecuritiesSecondLienMember2023-12-310001496099us-gaap:FairValueInputsLevel3Membernmfc:DebtSecuritiesSecondLienMember2023-12-310001496099us-gaap:SubordinatedDebtMember2023-12-310001496099us-gaap:FairValueInputsLevel1Memberus-gaap:SubordinatedDebtMember2023-12-310001496099us-gaap:FairValueInputsLevel2Memberus-gaap:SubordinatedDebtMember2023-12-310001496099us-gaap:FairValueInputsLevel3Memberus-gaap:SubordinatedDebtMember2023-12-310001496099us-gaap:OtherAggregatedInvestmentsMember2023-12-310001496099us-gaap:FairValueInputsLevel1Memberus-gaap:OtherAggregatedInvestmentsMember2023-12-310001496099us-gaap:OtherAggregatedInvestmentsMemberus-gaap:FairValueInputsLevel2Member2023-12-310001496099us-gaap:OtherAggregatedInvestmentsMemberus-gaap:FairValueInputsLevel3Member2023-12-310001496099us-gaap:FairValueInputsLevel1Member2023-12-310001496099us-gaap:FairValueInputsLevel2Member2023-12-310001496099us-gaap:FairValueInputsLevel3Member2023-12-310001496099nmfc:DebtSecuritiesFirstLienMember2022-12-310001496099us-gaap:FairValueInputsLevel1Membernmfc:DebtSecuritiesFirstLienMember2022-12-310001496099us-gaap:FairValueInputsLevel2Membernmfc:DebtSecuritiesFirstLienMember2022-12-310001496099us-gaap:FairValueInputsLevel3Membernmfc:DebtSecuritiesFirstLienMember2022-12-310001496099nmfc:DebtSecuritiesSecondLienMember2022-12-310001496099us-gaap:FairValueInputsLevel1Membernmfc:DebtSecuritiesSecondLienMember2022-12-310001496099us-gaap:FairValueInputsLevel2Membernmfc:DebtSecuritiesSecondLienMember2022-12-310001496099us-gaap:FairValueInputsLevel3Membernmfc:DebtSecuritiesSecondLienMember2022-12-310001496099us-gaap:SubordinatedDebtMember2022-12-310001496099us-gaap:FairValueInputsLevel1Memberus-gaap:SubordinatedDebtMember2022-12-310001496099us-gaap:FairValueInputsLevel2Memberus-gaap:SubordinatedDebtMember2022-12-310001496099us-gaap:FairValueInputsLevel3Memberus-gaap:SubordinatedDebtMember2022-12-310001496099us-gaap:OtherAggregatedInvestmentsMember2022-12-310001496099us-gaap:FairValueInputsLevel1Memberus-gaap:OtherAggregatedInvestmentsMember2022-12-310001496099us-gaap:OtherAggregatedInvestmentsMemberus-gaap:FairValueInputsLevel2Member2022-12-310001496099us-gaap:OtherAggregatedInvestmentsMemberus-gaap:FairValueInputsLevel3Member2022-12-310001496099us-gaap:FairValueInputsLevel1Member2022-12-310001496099us-gaap:FairValueInputsLevel2Member2022-12-310001496099us-gaap:FairValueInputsLevel3Member2022-12-310001496099us-gaap:InvestmentsMember2022-12-310001496099nmfc:DebtSecuritiesFirstLienMember2022-12-310001496099nmfc:DebtSecuritiesSecondLienMember2022-12-310001496099us-gaap:SubordinatedDebtMember2022-12-310001496099us-gaap:OtherAggregatedInvestmentsMember2022-12-310001496099us-gaap:InvestmentsMembernmfc:DebtAndEquitySecuritiesRealizedGainLossMember2023-01-012023-12-310001496099nmfc:DebtSecuritiesFirstLienMembernmfc:DebtAndEquitySecuritiesRealizedGainLossMember2023-01-012023-12-310001496099nmfc:DebtAndEquitySecuritiesRealizedGainLossMembernmfc:DebtSecuritiesSecondLienMember2023-01-012023-12-310001496099us-gaap:SubordinatedDebtMembernmfc:DebtAndEquitySecuritiesRealizedGainLossMember2023-01-012023-12-310001496099nmfc:DebtAndEquitySecuritiesRealizedGainLossMemberus-gaap:OtherAggregatedInvestmentsMember2023-01-012023-12-310001496099us-gaap:InvestmentsMembernmfc:DebtAndEquitySecuritiesUnrealizedGainLossMember2023-01-012023-12-310001496099nmfc:DebtSecuritiesFirstLienMembernmfc:DebtAndEquitySecuritiesUnrealizedGainLossMember2023-01-012023-12-310001496099nmfc:DebtSecuritiesSecondLienMembernmfc:DebtAndEquitySecuritiesUnrealizedGainLossMember2023-01-012023-12-310001496099us-gaap:SubordinatedDebtMembernmfc:DebtAndEquitySecuritiesUnrealizedGainLossMember2023-01-012023-12-310001496099nmfc:DebtAndEquitySecuritiesUnrealizedGainLossMemberus-gaap:OtherAggregatedInvestmentsMember2023-01-012023-12-310001496099us-gaap:InvestmentsMember2023-01-012023-12-310001496099nmfc:DebtSecuritiesFirstLienMember2023-01-012023-12-310001496099nmfc:DebtSecuritiesSecondLienMember2023-01-012023-12-310001496099us-gaap:SubordinatedDebtMember2023-01-012023-12-310001496099us-gaap:OtherAggregatedInvestmentsMember2023-01-012023-12-310001496099us-gaap:InvestmentsMember2023-12-310001496099nmfc:DebtSecuritiesFirstLienMember2023-12-310001496099nmfc:DebtSecuritiesSecondLienMember2023-12-310001496099us-gaap:SubordinatedDebtMember2023-12-310001496099us-gaap:OtherAggregatedInvestmentsMember2023-12-310001496099us-gaap:InvestmentsMember2021-12-310001496099nmfc:DebtSecuritiesFirstLienMember2021-12-310001496099nmfc:DebtSecuritiesSecondLienMember2021-12-310001496099us-gaap:SubordinatedDebtMember2021-12-310001496099us-gaap:OtherAggregatedInvestmentsMember2021-12-310001496099us-gaap:InvestmentsMembernmfc:DebtAndEquitySecuritiesRealizedGainLossMember2022-01-012022-12-310001496099nmfc:DebtSecuritiesFirstLienMembernmfc:DebtAndEquitySecuritiesRealizedGainLossMember2022-01-012022-12-310001496099nmfc:DebtAndEquitySecuritiesRealizedGainLossMembernmfc:DebtSecuritiesSecondLienMember2022-01-012022-12-310001496099us-gaap:SubordinatedDebtMembernmfc:DebtAndEquitySecuritiesRealizedGainLossMember2022-01-012022-12-310001496099nmfc:DebtAndEquitySecuritiesRealizedGainLossMemberus-gaap:OtherAggregatedInvestmentsMember2022-01-012022-12-310001496099us-gaap:InvestmentsMembernmfc:DebtAndEquitySecuritiesUnrealizedGainLossMember2022-01-012022-12-310001496099nmfc:DebtSecuritiesFirstLienMembernmfc:DebtAndEquitySecuritiesUnrealizedGainLossMember2022-01-012022-12-310001496099nmfc:DebtSecuritiesSecondLienMembernmfc:DebtAndEquitySecuritiesUnrealizedGainLossMember2022-01-012022-12-310001496099us-gaap:SubordinatedDebtMembernmfc:DebtAndEquitySecuritiesUnrealizedGainLossMember2022-01-012022-12-310001496099nmfc:DebtAndEquitySecuritiesUnrealizedGainLossMemberus-gaap:OtherAggregatedInvestmentsMember2022-01-012022-12-310001496099us-gaap:InvestmentsMember2022-01-012022-12-310001496099nmfc:DebtSecuritiesFirstLienMember2022-01-012022-12-310001496099nmfc:DebtSecuritiesSecondLienMember2022-01-012022-12-310001496099us-gaap:SubordinatedDebtMember2022-01-012022-12-310001496099us-gaap:OtherAggregatedInvestmentsMember2022-01-012022-12-310001496099nmfc:ValuationMarketAndIncomeApproachMemberus-gaap:FairValueInputsLevel3Membernmfc:DebtSecuritiesFirstLienMember2023-12-310001496099srt:MinimumMemberus-gaap:MeasurementInputEbitdaMultipleMembernmfc:ValuationMarketAndIncomeApproachMembernmfc:DebtSecuritiesFirstLienMemberus-gaap:FairValueInputsLevel3Member2023-12-310001496099us-gaap:MeasurementInputEbitdaMultipleMembernmfc:ValuationMarketAndIncomeApproachMembersrt:MaximumMembernmfc:DebtSecuritiesFirstLienMemberus-gaap:FairValueInputsLevel3Member2023-12-310001496099srt:WeightedAverageMemberus-gaap:MeasurementInputEbitdaMultipleMembernmfc:ValuationMarketAndIncomeApproachMembernmfc:DebtSecuritiesFirstLienMemberus-gaap:FairValueInputsLevel3Member2023-12-310001496099srt:MinimumMemberus-gaap:MeasurementInputRevenueMultipleMembernmfc:ValuationMarketAndIncomeApproachMembernmfc:DebtSecuritiesFirstLienMemberus-gaap:FairValueInputsLevel3Member2023-12-310001496099us-gaap:MeasurementInputRevenueMultipleMembernmfc:ValuationMarketAndIncomeApproachMembersrt:MaximumMembernmfc:DebtSecuritiesFirstLienMemberus-gaap:FairValueInputsLevel3Member2023-12-310001496099srt:WeightedAverageMemberus-gaap:MeasurementInputRevenueMultipleMembernmfc:ValuationMarketAndIncomeApproachMembernmfc:DebtSecuritiesFirstLienMemberus-gaap:FairValueInputsLevel3Member2023-12-310001496099srt:MinimumMemberus-gaap:MeasurementInputDiscountRateMembernmfc:ValuationMarketAndIncomeApproachMembernmfc:DebtSecuritiesFirstLienMemberus-gaap:FairValueInputsLevel3Member2023-12-310001496099us-gaap:MeasurementInputDiscountRateMembernmfc:ValuationMarketAndIncomeApproachMembersrt:MaximumMembernmfc:DebtSecuritiesFirstLienMemberus-gaap:FairValueInputsLevel3Member2023-12-310001496099srt:WeightedAverageMemberus-gaap:MeasurementInputDiscountRateMembernmfc:ValuationMarketAndIncomeApproachMembernmfc:DebtSecuritiesFirstLienMemberus-gaap:FairValueInputsLevel3Member2023-12-310001496099nmfc:OtherValuationTechniqueMemberus-gaap:FairValueInputsLevel3Membernmfc:DebtSecuritiesFirstLienMember2023-12-310001496099nmfc:ValuationMarketAndIncomeApproachMemberus-gaap:FairValueInputsLevel3Membernmfc:DebtSecuritiesSecondLienMember2023-12-310001496099srt:MinimumMemberus-gaap:MeasurementInputEbitdaMultipleMembernmfc:ValuationMarketAndIncomeApproachMemberus-gaap:FairValueInputsLevel3Membernmfc:DebtSecuritiesSecondLienMember2023-12-310001496099us-gaap:MeasurementInputEbitdaMultipleMembernmfc:ValuationMarketAndIncomeApproachMembersrt:MaximumMemberus-gaap:FairValueInputsLevel3Membernmfc:DebtSecuritiesSecondLienMember2023-12-310001496099srt:WeightedAverageMemberus-gaap:MeasurementInputEbitdaMultipleMembernmfc:ValuationMarketAndIncomeApproachMemberus-gaap:FairValueInputsLevel3Membernmfc:DebtSecuritiesSecondLienMember2023-12-310001496099srt:MinimumMemberus-gaap:MeasurementInputDiscountRateMembernmfc:ValuationMarketAndIncomeApproachMemberus-gaap:FairValueInputsLevel3Membernmfc:DebtSecuritiesSecondLienMember2023-12-310001496099us-gaap:MeasurementInputDiscountRateMembernmfc:ValuationMarketAndIncomeApproachMembersrt:MaximumMemberus-gaap:FairValueInputsLevel3Membernmfc:DebtSecuritiesSecondLienMember2023-12-310001496099srt:WeightedAverageMemberus-gaap:MeasurementInputDiscountRateMembernmfc:ValuationMarketAndIncomeApproachMemberus-gaap:FairValueInputsLevel3Membernmfc:DebtSecuritiesSecondLienMember2023-12-310001496099nmfc:OtherValuationTechniqueMemberus-gaap:FairValueInputsLevel3Membernmfc:DebtSecuritiesSecondLienMember2023-12-310001496099nmfc:ValuationMarketAndIncomeApproachMemberus-gaap:FairValueInputsLevel3Memberus-gaap:SubordinatedDebtMember2023-12-310001496099srt:MinimumMemberus-gaap:MeasurementInputEbitdaMultipleMembernmfc:ValuationMarketAndIncomeApproachMemberus-gaap:SubordinatedDebtMemberus-gaap:FairValueInputsLevel3Member2023-12-310001496099us-gaap:MeasurementInputEbitdaMultipleMembernmfc:ValuationMarketAndIncomeApproachMembersrt:MaximumMemberus-gaap:SubordinatedDebtMemberus-gaap:FairValueInputsLevel3Member2023-12-310001496099srt:WeightedAverageMemberus-gaap:MeasurementInputEbitdaMultipleMembernmfc:ValuationMarketAndIncomeApproachMemberus-gaap:SubordinatedDebtMemberus-gaap:FairValueInputsLevel3Member2023-12-310001496099srt:MinimumMemberus-gaap:MeasurementInputDiscountRateMembernmfc:ValuationMarketAndIncomeApproachMemberus-gaap:SubordinatedDebtMemberus-gaap:FairValueInputsLevel3Member2023-12-310001496099us-gaap:MeasurementInputDiscountRateMembernmfc:ValuationMarketAndIncomeApproachMembersrt:MaximumMemberus-gaap:SubordinatedDebtMemberus-gaap:FairValueInputsLevel3Member2023-12-310001496099srt:WeightedAverageMemberus-gaap:MeasurementInputDiscountRateMembernmfc:ValuationMarketAndIncomeApproachMemberus-gaap:SubordinatedDebtMemberus-gaap:FairValueInputsLevel3Member2023-12-310001496099us-gaap:OtherAggregatedInvestmentsMembernmfc:ValuationMarketAndIncomeApproachMemberus-gaap:FairValueInputsLevel3Member2023-12-310001496099srt:MinimumMemberus-gaap:OtherAggregatedInvestmentsMemberus-gaap:MeasurementInputEbitdaMultipleMembernmfc:ValuationMarketAndIncomeApproachMemberus-gaap:FairValueInputsLevel3Member2023-12-310001496099us-gaap:OtherAggregatedInvestmentsMemberus-gaap:MeasurementInputEbitdaMultipleMembernmfc:ValuationMarketAndIncomeApproachMembersrt:MaximumMemberus-gaap:FairValueInputsLevel3Member2023-12-310001496099srt:WeightedAverageMemberus-gaap:OtherAggregatedInvestmentsMemberus-gaap:MeasurementInputEbitdaMultipleMembernmfc:ValuationMarketAndIncomeApproachMemberus-gaap:FairValueInputsLevel3Member2023-12-310001496099srt:MinimumMemberus-gaap:OtherAggregatedInvestmentsMemberus-gaap:MeasurementInputRevenueMultipleMembernmfc:ValuationMarketAndIncomeApproachMemberus-gaap:FairValueInputsLevel3Member2023-12-310001496099us-gaap:OtherAggregatedInvestmentsMemberus-gaap:MeasurementInputRevenueMultipleMembernmfc:ValuationMarketAndIncomeApproachMembersrt:MaximumMemberus-gaap:FairValueInputsLevel3Member2023-12-310001496099srt:WeightedAverageMemberus-gaap:OtherAggregatedInvestmentsMemberus-gaap:MeasurementInputRevenueMultipleMembernmfc:ValuationMarketAndIncomeApproachMemberus-gaap:FairValueInputsLevel3Member2023-12-310001496099srt:MinimumMemberus-gaap:OtherAggregatedInvestmentsMemberus-gaap:MeasurementInputDiscountRateMembernmfc:ValuationMarketAndIncomeApproachMemberus-gaap:FairValueInputsLevel3Member2023-12-310001496099us-gaap:OtherAggregatedInvestmentsMemberus-gaap:MeasurementInputDiscountRateMembernmfc:ValuationMarketAndIncomeApproachMembersrt:MaximumMemberus-gaap:FairValueInputsLevel3Member2023-12-310001496099srt:WeightedAverageMemberus-gaap:OtherAggregatedInvestmentsMemberus-gaap:MeasurementInputDiscountRateMembernmfc:ValuationMarketAndIncomeApproachMemberus-gaap:FairValueInputsLevel3Member2023-12-310001496099us-gaap:OtherAggregatedInvestmentsMemberus-gaap:IncomeApproachValuationTechniqueMemberus-gaap:FairValueInputsLevel3Member2023-12-310001496099srt:MinimumMemberus-gaap:OtherAggregatedInvestmentsMemberus-gaap:MeasurementInputDiscountRateMemberus-gaap:IncomeApproachValuationTechniqueMemberus-gaap:FairValueInputsLevel3Member2023-12-310001496099us-gaap:OtherAggregatedInvestmentsMemberus-gaap:MeasurementInputDiscountRateMemberus-gaap:IncomeApproachValuationTechniqueMembersrt:MaximumMemberus-gaap:FairValueInputsLevel3Member2023-12-310001496099srt:WeightedAverageMemberus-gaap:OtherAggregatedInvestmentsMemberus-gaap:MeasurementInputDiscountRateMemberus-gaap:IncomeApproachValuationTechniqueMemberus-gaap:FairValueInputsLevel3Member2023-12-310001496099us-gaap:OtherAggregatedInvestmentsMembernmfc:OtherValuationTechniqueMemberus-gaap:FairValueInputsLevel3Member2023-12-310001496099nmfc:ValuationMarketAndIncomeApproachMemberus-gaap:FairValueInputsLevel3Membernmfc:DebtSecuritiesFirstLienMember2022-12-310001496099srt:MinimumMemberus-gaap:MeasurementInputEbitdaMultipleMembernmfc:ValuationMarketAndIncomeApproachMembernmfc:DebtSecuritiesFirstLienMemberus-gaap:FairValueInputsLevel3Member2022-12-310001496099us-gaap:MeasurementInputEbitdaMultipleMembernmfc:ValuationMarketAndIncomeApproachMembersrt:MaximumMembernmfc:DebtSecuritiesFirstLienMemberus-gaap:FairValueInputsLevel3Member2022-12-310001496099srt:WeightedAverageMemberus-gaap:MeasurementInputEbitdaMultipleMembernmfc:ValuationMarketAndIncomeApproachMembernmfc:DebtSecuritiesFirstLienMemberus-gaap:FairValueInputsLevel3Member2022-12-310001496099srt:MinimumMemberus-gaap:MeasurementInputRevenueMultipleMembernmfc:ValuationMarketAndIncomeApproachMembernmfc:DebtSecuritiesFirstLienMemberus-gaap:FairValueInputsLevel3Member2022-12-310001496099us-gaap:MeasurementInputRevenueMultipleMembernmfc:ValuationMarketAndIncomeApproachMembersrt:MaximumMembernmfc:DebtSecuritiesFirstLienMemberus-gaap:FairValueInputsLevel3Member2022-12-310001496099srt:WeightedAverageMemberus-gaap:MeasurementInputRevenueMultipleMembernmfc:ValuationMarketAndIncomeApproachMembernmfc:DebtSecuritiesFirstLienMemberus-gaap:FairValueInputsLevel3Member2022-12-310001496099srt:MinimumMemberus-gaap:MeasurementInputDiscountRateMembernmfc:ValuationMarketAndIncomeApproachMembernmfc:DebtSecuritiesFirstLienMemberus-gaap:FairValueInputsLevel3Member2022-12-310001496099us-gaap:MeasurementInputDiscountRateMembernmfc:ValuationMarketAndIncomeApproachMembersrt:MaximumMembernmfc:DebtSecuritiesFirstLienMemberus-gaap:FairValueInputsLevel3Member2022-12-310001496099srt:WeightedAverageMemberus-gaap:MeasurementInputDiscountRateMembernmfc:ValuationMarketAndIncomeApproachMembernmfc:DebtSecuritiesFirstLienMemberus-gaap:FairValueInputsLevel3Member2022-12-310001496099nmfc:OtherValuationTechniqueMemberus-gaap:FairValueInputsLevel3Membernmfc:DebtSecuritiesFirstLienMember2022-12-310001496099nmfc:ValuationMarketAndIncomeApproachMemberus-gaap:FairValueInputsLevel3Membernmfc:DebtSecuritiesSecondLienMember2022-12-310001496099srt:MinimumMemberus-gaap:MeasurementInputEbitdaMultipleMembernmfc:ValuationMarketAndIncomeApproachMemberus-gaap:FairValueInputsLevel3Membernmfc:DebtSecuritiesSecondLienMember2022-12-310001496099us-gaap:MeasurementInputEbitdaMultipleMembernmfc:ValuationMarketAndIncomeApproachMembersrt:MaximumMemberus-gaap:FairValueInputsLevel3Membernmfc:DebtSecuritiesSecondLienMember2022-12-310001496099srt:WeightedAverageMemberus-gaap:MeasurementInputEbitdaMultipleMembernmfc:ValuationMarketAndIncomeApproachMemberus-gaap:FairValueInputsLevel3Membernmfc:DebtSecuritiesSecondLienMember2022-12-310001496099srt:MinimumMemberus-gaap:MeasurementInputDiscountRateMembernmfc:ValuationMarketAndIncomeApproachMemberus-gaap:FairValueInputsLevel3Membernmfc:DebtSecuritiesSecondLienMember2022-12-310001496099us-gaap:MeasurementInputDiscountRateMembernmfc:ValuationMarketAndIncomeApproachMembersrt:MaximumMemberus-gaap:FairValueInputsLevel3Membernmfc:DebtSecuritiesSecondLienMember2022-12-310001496099srt:WeightedAverageMemberus-gaap:MeasurementInputDiscountRateMembernmfc:ValuationMarketAndIncomeApproachMemberus-gaap:FairValueInputsLevel3Membernmfc:DebtSecuritiesSecondLienMember2022-12-310001496099nmfc:OtherValuationTechniqueMemberus-gaap:FairValueInputsLevel3Membernmfc:DebtSecuritiesSecondLienMember2022-12-310001496099nmfc:ValuationMarketAndIncomeApproachMemberus-gaap:FairValueInputsLevel3Memberus-gaap:SubordinatedDebtMember2022-12-310001496099srt:MinimumMemberus-gaap:MeasurementInputEbitdaMultipleMembernmfc:ValuationMarketAndIncomeApproachMemberus-gaap:SubordinatedDebtMemberus-gaap:FairValueInputsLevel3Member2022-12-310001496099us-gaap:MeasurementInputEbitdaMultipleMembernmfc:ValuationMarketAndIncomeApproachMembersrt:MaximumMemberus-gaap:SubordinatedDebtMemberus-gaap:FairValueInputsLevel3Member2022-12-310001496099srt:WeightedAverageMemberus-gaap:MeasurementInputEbitdaMultipleMembernmfc:ValuationMarketAndIncomeApproachMemberus-gaap:SubordinatedDebtMemberus-gaap:FairValueInputsLevel3Member2022-12-310001496099srt:MinimumMemberus-gaap:MeasurementInputDiscountRateMembernmfc:ValuationMarketAndIncomeApproachMemberus-gaap:SubordinatedDebtMemberus-gaap:FairValueInputsLevel3Member2022-12-310001496099us-gaap:MeasurementInputDiscountRateMembernmfc:ValuationMarketAndIncomeApproachMembersrt:MaximumMemberus-gaap:SubordinatedDebtMemberus-gaap:FairValueInputsLevel3Member2022-12-310001496099srt:WeightedAverageMemberus-gaap:MeasurementInputDiscountRateMembernmfc:ValuationMarketAndIncomeApproachMemberus-gaap:SubordinatedDebtMemberus-gaap:FairValueInputsLevel3Member2022-12-310001496099us-gaap:OtherAggregatedInvestmentsMembernmfc:ValuationMarketAndIncomeApproachMemberus-gaap:FairValueInputsLevel3Member2022-12-310001496099srt:MinimumMemberus-gaap:OtherAggregatedInvestmentsMemberus-gaap:MeasurementInputEbitdaMultipleMembernmfc:ValuationMarketAndIncomeApproachMemberus-gaap:FairValueInputsLevel3Member2022-12-310001496099us-gaap:OtherAggregatedInvestmentsMemberus-gaap:MeasurementInputEbitdaMultipleMembernmfc:ValuationMarketAndIncomeApproachMembersrt:MaximumMemberus-gaap:FairValueInputsLevel3Member2022-12-310001496099srt:WeightedAverageMemberus-gaap:OtherAggregatedInvestmentsMemberus-gaap:MeasurementInputEbitdaMultipleMembernmfc:ValuationMarketAndIncomeApproachMemberus-gaap:FairValueInputsLevel3Member2022-12-310001496099srt:MinimumMemberus-gaap:OtherAggregatedInvestmentsMemberus-gaap:MeasurementInputRevenueMultipleMembernmfc:ValuationMarketAndIncomeApproachMemberus-gaap:FairValueInputsLevel3Member2022-12-310001496099us-gaap:OtherAggregatedInvestmentsMemberus-gaap:MeasurementInputRevenueMultipleMembernmfc:ValuationMarketAndIncomeApproachMembersrt:MaximumMemberus-gaap:FairValueInputsLevel3Member2022-12-310001496099srt:WeightedAverageMemberus-gaap:OtherAggregatedInvestmentsMemberus-gaap:MeasurementInputRevenueMultipleMembernmfc:ValuationMarketAndIncomeApproachMemberus-gaap:FairValueInputsLevel3Member2022-12-310001496099srt:MinimumMemberus-gaap:OtherAggregatedInvestmentsMemberus-gaap:MeasurementInputDiscountRateMembernmfc:ValuationMarketAndIncomeApproachMemberus-gaap:FairValueInputsLevel3Member2022-12-310001496099us-gaap:OtherAggregatedInvestmentsMemberus-gaap:MeasurementInputDiscountRateMembernmfc:ValuationMarketAndIncomeApproachMembersrt:MaximumMemberus-gaap:FairValueInputsLevel3Member2022-12-310001496099srt:WeightedAverageMemberus-gaap:OtherAggregatedInvestmentsMemberus-gaap:MeasurementInputDiscountRateMembernmfc:ValuationMarketAndIncomeApproachMemberus-gaap:FairValueInputsLevel3Member2022-12-310001496099us-gaap:OtherAggregatedInvestmentsMembernmfc:OtherValuationTechniqueMemberus-gaap:FairValueInputsLevel3Member2022-12-310001496099us-gaap:UnsecuredDebtMembernmfc:EightPointTwoFivePercentageNotesDueTwoThousandTwentyEightMember2018-09-250001496099us-gaap:CarryingReportedAmountFairValueDisclosureMemberus-gaap:LineOfCreditMemberus-gaap:RevolvingCreditFacilityMembernmfc:HoldingsCreditFacilityMember2023-12-310001496099us-gaap:LineOfCreditMemberus-gaap:EstimateOfFairValueFairValueDisclosureMemberus-gaap:RevolvingCreditFacilityMembernmfc:HoldingsCreditFacilityMember2023-12-310001496099us-gaap:CarryingReportedAmountFairValueDisclosureMemberus-gaap:LineOfCreditMemberus-gaap:RevolvingCreditFacilityMembernmfc:HoldingsCreditFacilityMember2022-12-310001496099us-gaap:LineOfCreditMemberus-gaap:EstimateOfFairValueFairValueDisclosureMemberus-gaap:RevolvingCreditFacilityMembernmfc:HoldingsCreditFacilityMember2022-12-310001496099us-gaap:UnsecuredDebtMemberus-gaap:CarryingReportedAmountFairValueDisclosureMember2023-12-310001496099us-gaap:UnsecuredDebtMemberus-gaap:EstimateOfFairValueFairValueDisclosureMember2023-12-310001496099us-gaap:UnsecuredDebtMemberus-gaap:CarryingReportedAmountFairValueDisclosureMember2022-12-310001496099us-gaap:UnsecuredDebtMemberus-gaap:EstimateOfFairValueFairValueDisclosureMember2022-12-310001496099us-gaap:CarryingReportedAmountFairValueDisclosureMembernmfc:GuaranteedDebtMember2023-12-310001496099nmfc:GuaranteedDebtMemberus-gaap:EstimateOfFairValueFairValueDisclosureMember2023-12-310001496099us-gaap:CarryingReportedAmountFairValueDisclosureMembernmfc:GuaranteedDebtMember2022-12-310001496099nmfc:GuaranteedDebtMemberus-gaap:EstimateOfFairValueFairValueDisclosureMember2022-12-310001496099us-gaap:ConvertibleDebtMemberus-gaap:CarryingReportedAmountFairValueDisclosureMember2023-12-310001496099us-gaap:ConvertibleDebtMemberus-gaap:EstimateOfFairValueFairValueDisclosureMember2023-12-310001496099us-gaap:ConvertibleDebtMemberus-gaap:CarryingReportedAmountFairValueDisclosureMember2022-12-310001496099us-gaap:ConvertibleDebtMemberus-gaap:EstimateOfFairValueFairValueDisclosureMember2022-12-310001496099us-gaap:CarryingReportedAmountFairValueDisclosureMemberus-gaap:LineOfCreditMemberus-gaap:RevolvingCreditFacilityMembernmfc:DBCreditFacilityMember2023-12-310001496099us-gaap:LineOfCreditMemberus-gaap:EstimateOfFairValueFairValueDisclosureMemberus-gaap:RevolvingCreditFacilityMembernmfc:DBCreditFacilityMember2023-12-310001496099us-gaap:CarryingReportedAmountFairValueDisclosureMemberus-gaap:LineOfCreditMemberus-gaap:RevolvingCreditFacilityMembernmfc:DBCreditFacilityMember2022-12-310001496099us-gaap:LineOfCreditMemberus-gaap:EstimateOfFairValueFairValueDisclosureMemberus-gaap:RevolvingCreditFacilityMembernmfc:DBCreditFacilityMember2022-12-310001496099us-gaap:CarryingReportedAmountFairValueDisclosureMemberus-gaap:LineOfCreditMembernmfc:NMFCCreditFacilityMemberus-gaap:RevolvingCreditFacilityMember2023-12-310001496099us-gaap:LineOfCreditMembernmfc:NMFCCreditFacilityMemberus-gaap:EstimateOfFairValueFairValueDisclosureMemberus-gaap:RevolvingCreditFacilityMember2023-12-310001496099us-gaap:CarryingReportedAmountFairValueDisclosureMemberus-gaap:LineOfCreditMembernmfc:NMFCCreditFacilityMemberus-gaap:RevolvingCreditFacilityMember2022-12-310001496099us-gaap:LineOfCreditMembernmfc:NMFCCreditFacilityMemberus-gaap:EstimateOfFairValueFairValueDisclosureMemberus-gaap:RevolvingCreditFacilityMember2022-12-310001496099nmfc:NMNLCCreditFacilityIIMemberus-gaap:CarryingReportedAmountFairValueDisclosureMemberus-gaap:LineOfCreditMemberus-gaap:RevolvingCreditFacilityMember2023-12-310001496099nmfc:NMNLCCreditFacilityIIMemberus-gaap:LineOfCreditMemberus-gaap:EstimateOfFairValueFairValueDisclosureMemberus-gaap:RevolvingCreditFacilityMember2023-12-310001496099nmfc:NMNLCCreditFacilityIIMemberus-gaap:CarryingReportedAmountFairValueDisclosureMemberus-gaap:LineOfCreditMemberus-gaap:RevolvingCreditFacilityMember2022-12-310001496099nmfc:NMNLCCreditFacilityIIMemberus-gaap:LineOfCreditMemberus-gaap:EstimateOfFairValueFairValueDisclosureMemberus-gaap:RevolvingCreditFacilityMember2022-12-310001496099us-gaap:CarryingReportedAmountFairValueDisclosureMember2023-12-310001496099us-gaap:EstimateOfFairValueFairValueDisclosureMember2023-12-310001496099us-gaap:CarryingReportedAmountFairValueDisclosureMember2022-12-310001496099us-gaap:EstimateOfFairValueFairValueDisclosureMember2022-12-310001496099nmfc:InvestmentManagementAgreementMembersrt:AffiliatedEntityMember2023-01-242023-01-240001496099nmfc:InvestmentManagementAgreementMembersrt:AffiliatedEntityMember2023-12-31nmfc:component0001496099nmfc:InvestmentManagementAgreementManagementFeeMembersrt:AffiliatedEntityMember2021-10-312021-10-310001496099nmfc:InvestmentManagementAgreementManagementFeeMembersrt:AffiliatedEntityMember2021-11-012021-11-010001496099nmfc:InvestmentManagementAgreementManagementFeeMembersrt:AffiliatedEntityMember2023-01-012023-12-310001496099nmfc:InvestmentManagementAgreementManagementFeeMember2023-01-012023-12-310001496099nmfc:InvestmentManagementAgreementManagementFeeMember2022-01-012022-12-310001496099nmfc:InvestmentManagementAgreementManagementFeeMember2021-01-012021-12-310001496099nmfc:InvestmentManagementAgreementIncentiveRateMembersrt:AffiliatedEntityMember2023-12-310001496099nmfc:InvestmentManagementAgreementIncentiveRatePreIncentiveFeeNetInvestmentIncomeMembersrt:AffiliatedEntityMember2021-11-012021-11-010001496099srt:AffiliatedEntityMembernmfc:InvestmentManagementAgreementIncentiveRateQuarterlyHurdleRateMember2021-11-012021-11-010001496099nmfc:InvestmentManagementAgreementIncentiveRateAnnualizedHurdleRateMembersrt:AffiliatedEntityMember2021-11-012021-11-010001496099nmfc:InvestmentManagementAgreementIncentiveRatePreIncentiveFeeNetInvestmentIncomeBelowCatchUpThresholdMembersrt:AffiliatedEntityMember2021-11-012021-11-010001496099nmfc:InvestmentManagementAgreementIncentiveRateQuarterlyCatchUpThresholdMembersrt:AffiliatedEntityMember2021-11-012021-11-010001496099nmfc:InvestmentManagementAgreementIncentiveRateAnnualizedCatchUpThresholdMembersrt:AffiliatedEntityMember2021-11-012021-11-010001496099srt:AffiliatedEntityMembernmfc:InvestmentManagementAgreementIncentiveRatePreIncentiveFeeNetInvestmentIncomeExceedsCatchUpThresholdMember2021-11-012021-11-010001496099nmfc:InvestmentManagementAgreementIncentiveRateRealizedCapitalGainsMembersrt:AffiliatedEntityMember2021-11-012021-11-010001496099nmfc:InvestmentManagementAgreementIncentiveRatePreIncentiveFeeNetInvestmentIncomeMember2023-01-012023-12-310001496099nmfc:InvestmentManagementAgreementIncentiveRatePreIncentiveFeeNetInvestmentIncomeMember2022-01-012022-12-310001496099nmfc:InvestmentManagementAgreementIncentiveRatePreIncentiveFeeNetInvestmentIncomeMember2021-01-012021-12-310001496099nmfc:InvestmentManagementAgreementIncentiveRateRealizedCapitalGainsMember2023-01-012023-12-310001496099nmfc:InvestmentManagementAgreementIncentiveRateRealizedCapitalGainsMember2022-01-012022-12-310001496099nmfc:InvestmentManagementAgreementIncentiveRateRealizedCapitalGainsMember2021-01-012021-12-310001496099nmfc:InvestmentManagementAgreementIncentiveRateRealizedCapitalGainsMember2022-12-310001496099nmfc:InvestmentManagementAgreementIncentiveRateRealizedCapitalGainsMember2023-12-310001496099nmfc:InvestmentManagementAgreementIncentiveRateRealizedCapitalGainsMember2021-12-310001496099nmfc:AdministrationAgreementMembersrt:AffiliatedEntityMember2023-01-242023-01-240001496099nmfc:AdministrationAgreementMember2023-01-012023-12-310001496099nmfc:AdministrationAgreementMember2022-01-012022-12-310001496099nmfc:AdministrationAgreementMember2021-01-012021-12-310001496099nmfc:AdministrationAgreementMembersrt:AffiliatedEntityMember2023-12-310001496099nmfc:AdministrationAgreementMembersrt:AffiliatedEntityMember2022-12-310001496099nmfc:UnsecuredManagementCompanyRevolverMemberus-gaap:LineOfCreditMembersrt:AffiliatedEntityMemberus-gaap:RevolvingCreditFacilityMember2020-03-300001496099nmfc:UnsecuredManagementCompanyRevolverMemberus-gaap:LineOfCreditMembersrt:AffiliatedEntityMemberus-gaap:RevolvingCreditFacilityMember2020-05-030001496099nmfc:UnsecuredManagementCompanyRevolverMemberus-gaap:LineOfCreditMembersrt:AffiliatedEntityMemberus-gaap:RevolvingCreditFacilityMember2020-05-040001496099nmfc:UnsecuredManagementCompanyRevolverMemberus-gaap:LineOfCreditMembersrt:AffiliatedEntityMemberus-gaap:RevolvingCreditFacilityMember2023-10-300001496099nmfc:UnsecuredManagementCompanyRevolverMemberus-gaap:LineOfCreditMembersrt:AffiliatedEntityMemberus-gaap:RevolvingCreditFacilityMember2023-10-3100014960992018-06-0800014960992018-06-0900014960992014-11-050001496099us-gaap:LineOfCreditMemberus-gaap:RevolvingCreditFacilityMembernmfc:HoldingsCreditFacilityMember2023-10-260001496099us-gaap:LineOfCreditMemberus-gaap:RevolvingCreditFacilityMembernmfc:HoldingsCreditFacilityMember2023-12-310001496099nmfc:HoldingsCreditFacilityExcludingBroadlySyndicatedLoansMembernmfc:SecuredOvernightFinancingRateSOFRMemberus-gaap:LineOfCreditMemberus-gaap:RevolvingCreditFacilityMember2021-04-202023-04-270001496099nmfc:SecuredOvernightFinancingRateSOFRMemberus-gaap:LineOfCreditMemberus-gaap:RevolvingCreditFacilityMembernmfc:HoldingsCreditFacilityBroadlySyndicatedLoansMember2023-04-282023-04-280001496099nmfc:HoldingsCreditFacilityExcludingBroadlySyndicatedLoansMembernmfc:SecuredOvernightFinancingRateSOFRMemberus-gaap:LineOfCreditMemberus-gaap:RevolvingCreditFacilityMember2023-04-282023-04-280001496099nmfc:LondonInterbankOfferedRateLIBOR1Memberus-gaap:LineOfCreditMemberus-gaap:RevolvingCreditFacilityMembernmfc:HoldingsCreditFacilityBroadlySyndicatedLoansMember2021-04-202023-04-270001496099nmfc:LondonInterbankOfferedRateLIBOR1Membernmfc:HoldingsCreditFacilityExcludingBroadlySyndicatedLoansMemberus-gaap:LineOfCreditMemberus-gaap:RevolvingCreditFacilityMember2021-04-202023-04-270001496099nmfc:LondonInterbankOfferedRateLIBOR1Memberus-gaap:LineOfCreditMemberus-gaap:RevolvingCreditFacilityMembernmfc:HoldingsCreditFacilityBroadlySyndicatedLoansMember2020-09-302021-04-190001496099nmfc:LondonInterbankOfferedRateLIBOR1Membernmfc:HoldingsCreditFacilityExcludingBroadlySyndicatedLoansMemberus-gaap:LineOfCreditMemberus-gaap:RevolvingCreditFacilityMember2020-09-302021-04-190001496099us-gaap:LineOfCreditMemberus-gaap:RevolvingCreditFacilityMembernmfc:HoldingsCreditFacilityMember2023-01-012023-12-310001496099us-gaap:LineOfCreditMemberus-gaap:RevolvingCreditFacilityMembernmfc:HoldingsCreditFacilityMember2022-01-012022-12-310001496099us-gaap:LineOfCreditMemberus-gaap:RevolvingCreditFacilityMembernmfc:HoldingsCreditFacilityMember2021-01-012021-12-310001496099nmfc:HoldingsCreditFacilityMember2021-12-310001496099us-gaap:LineOfCreditMembernmfc:NMFCCreditFacilityMemberus-gaap:RevolvingCreditFacilityMember2023-12-310001496099nmfc:SecuredOvernightFinancingRateSOFROrSterlingOvernightInterbankAverageRateSONIAOrEuroInterbankOfferedRateEURIBORMemberus-gaap:LineOfCreditMembernmfc:NMFCCreditFacilityMemberus-gaap:RevolvingCreditFacilityMember2023-06-292023-06-290001496099us-gaap:PrimeRateMemberus-gaap:LineOfCreditMembernmfc:NMFCCreditFacilityMemberus-gaap:RevolvingCreditFacilityMember2023-06-292023-06-290001496099us-gaap:LineOfCreditMembernmfc:NMFCCreditFacilityMemberus-gaap:RevolvingCreditFacilityMember2023-06-292023-06-290001496099us-gaap:LineOfCreditMembernmfc:NMFCCreditFacilityMemberus-gaap:RevolvingCreditFacilityMembernmfc:LondonInterbankOfferedRateLIBOROrSterlingOvernightInterbankAverageRateSONIAOrEuroInterbankOfferedRateEURIBORMember2023-06-282023-06-280001496099us-gaap:PrimeRateMemberus-gaap:LineOfCreditMembernmfc:NMFCCreditFacilityMemberus-gaap:RevolvingCreditFacilityMember2023-06-282023-06-280001496099us-gaap:LineOfCreditMembernmfc:NMFCCreditFacilityMemberus-gaap:RevolvingCreditFacilityMember2023-06-282023-06-280001496099us-gaap:LineOfCreditMembernmfc:NMFCCreditFacilityMemberus-gaap:RevolvingCreditFacilityMembernmfc:LondonInterbankOfferedRateLIBOROrSterlingOvernightInterbankAverageRateSONIAOrEuroInterbankOfferedRateEURIBORMember2021-06-032021-06-030001496099us-gaap:PrimeRateMemberus-gaap:LineOfCreditMembernmfc:NMFCCreditFacilityMemberus-gaap:RevolvingCreditFacilityMember2021-06-032021-06-030001496099us-gaap:LineOfCreditMembernmfc:NMFCCreditFacilityMemberus-gaap:RevolvingCreditFacilityMember2021-06-032021-06-030001496099us-gaap:LineOfCreditMembernmfc:NMFCCreditFacilityMemberus-gaap:RevolvingCreditFacilityMember2023-01-012023-12-310001496099us-gaap:LineOfCreditMembernmfc:NMFCCreditFacilityMemberus-gaap:RevolvingCreditFacilityMember2022-01-012022-12-310001496099us-gaap:LineOfCreditMembernmfc:NMFCCreditFacilityMemberus-gaap:RevolvingCreditFacilityMember2021-01-012021-12-310001496099nmfc:NMFCCreditFacilityMemberus-gaap:RevolvingCreditFacilityMember2023-12-310001496099nmfc:NMFCCreditFacilityMemberus-gaap:RevolvingCreditFacilityMember2022-12-310001496099nmfc:NMFCCreditFacilityMemberus-gaap:RevolvingCreditFacilityMember2021-12-310001496099nmfc:UnsecuredManagementCompanyRevolverMemberus-gaap:LineOfCreditMembersrt:AffiliatedEntityMemberus-gaap:RevolvingCreditFacilityMember2021-12-172021-12-170001496099nmfc:UnsecuredManagementCompanyRevolverMemberus-gaap:LineOfCreditMembersrt:AffiliatedEntityMemberus-gaap:RevolvingCreditFacilityMember2021-12-162021-12-160001496099nmfc:UnsecuredManagementCompanyRevolverMemberus-gaap:LineOfCreditMembersrt:AffiliatedEntityMemberus-gaap:RevolvingCreditFacilityMember2023-12-310001496099nmfc:UnsecuredManagementCompanyRevolverMemberus-gaap:LineOfCreditMemberus-gaap:RevolvingCreditFacilityMember2023-01-012023-12-310001496099nmfc:UnsecuredManagementCompanyRevolverMemberus-gaap:LineOfCreditMemberus-gaap:RevolvingCreditFacilityMember2022-01-012022-12-310001496099nmfc:UnsecuredManagementCompanyRevolverMemberus-gaap:LineOfCreditMemberus-gaap:RevolvingCreditFacilityMember2021-01-012021-12-310001496099us-gaap:LineOfCreditMemberus-gaap:RevolvingCreditFacilityMembernmfc:DBCreditFacilityMember2023-12-310001496099us-gaap:LineOfCreditMemberus-gaap:RevolvingCreditFacilityMembernmfc:DBCreditFacilityMembernmfc:LenderCostOfFundsRateMember2021-03-242021-03-240001496099us-gaap:LineOfCreditMemberus-gaap:RevolvingCreditFacilityMembernmfc:DBCreditFacilityMembernmfc:LenderCostOfFundsRateMember2021-03-252021-03-250001496099us-gaap:LineOfCreditMemberus-gaap:RevolvingCreditFacilityMembernmfc:DBCreditFacilityMembernmfc:LenderCostOfFundsRateMember2021-03-252023-06-290001496099us-gaap:LineOfCreditMemberus-gaap:RevolvingCreditFacilityMembernmfc:DBCreditFacilityMembernmfc:LenderCostOfFundsRateMember2023-06-292023-06-290001496099us-gaap:LineOfCreditMemberus-gaap:RevolvingCreditFacilityMembernmfc:DBCreditFacilityMembernmfc:LenderCostOfFundsRateMember2023-10-312023-10-310001496099us-gaap:BaseRateMemberus-gaap:LineOfCreditMemberus-gaap:RevolvingCreditFacilityMembernmfc:DBCreditFacilityMembernmfc:LenderCostOfFundsRateMember2023-06-292023-06-290001496099us-gaap:LineOfCreditMemberus-gaap:RevolvingCreditFacilityMembernmfc:DBCreditFacilityMember2023-06-292023-06-290001496099us-gaap:LineOfCreditMemberus-gaap:RevolvingCreditFacilityMembernmfc:DBCreditFacilityMember2023-10-312023-10-310001496099us-gaap:LineOfCreditMemberus-gaap:RevolvingCreditFacilityMembernmfc:DBCreditFacilityMember2023-01-012023-12-310001496099us-gaap:LineOfCreditMemberus-gaap:RevolvingCreditFacilityMembernmfc:DBCreditFacilityMember2022-01-012022-12-310001496099us-gaap:LineOfCreditMemberus-gaap:RevolvingCreditFacilityMembernmfc:DBCreditFacilityMember2021-01-012021-12-310001496099us-gaap:RevolvingCreditFacilityMembernmfc:DBCreditFacilityMember2021-12-310001496099nmfc:NewMountainNetLeaseCorporationMembernmfc:LondonInterbankOfferedRateLIBOR1Membernmfc:NMNLCCreditFacilityIIMemberus-gaap:LineOfCreditMemberus-gaap:RevolvingCreditFacilityMember2021-12-062021-12-060001496099nmfc:NewMountainNetLeaseCorporationMembersrt:MinimumMembernmfc:NMNLCCreditFacilityIIMemberus-gaap:LineOfCreditMemberus-gaap:RevolvingCreditFacilityMemberus-gaap:SecuredOvernightFinancingRateSofrOvernightIndexSwapRateMember2021-12-072022-10-310001496099nmfc:NewMountainNetLeaseCorporationMembernmfc:NMNLCCreditFacilityIIMemberus-gaap:LineOfCreditMemberus-gaap:RevolvingCreditFacilityMember2021-12-072022-10-310001496099nmfc:NMNLCCreditFacilityIIMemberus-gaap:LineOfCreditMembernmfc:NewMountainNetLeaseCorporationAndNMCLFXLPMemberus-gaap:RevolvingCreditFacilityMemberus-gaap:SecuredOvernightFinancingRateSofrOvernightIndexSwapRateMember2022-11-012022-11-010001496099nmfc:NewMountainNetLeaseCorporationMembernmfc:NMNLCCreditFacilityIIMemberus-gaap:LineOfCreditMemberus-gaap:RevolvingCreditFacilityMember2022-04-300001496099nmfc:NewMountainNetLeaseCorporationMembernmfc:NMNLCCreditFacilityIIMemberus-gaap:LineOfCreditMemberus-gaap:RevolvingCreditFacilityMember2022-05-010001496099nmfc:NMNLCCreditFacilityIIMemberus-gaap:LineOfCreditMembernmfc:NewMountainNetLeaseCorporationAndNMCLFXLPMemberus-gaap:RevolvingCreditFacilityMember2022-11-010001496099nmfc:NMNLCCreditFacilityIIMemberus-gaap:LineOfCreditMembernmfc:NewMountainNetLeaseCorporationAndNMCLFXLPMemberus-gaap:RevolvingCreditFacilityMember2023-12-310001496099nmfc:NMNLCCreditFacilityIIMemberus-gaap:LineOfCreditMemberus-gaap:RevolvingCreditFacilityMember2023-01-012023-12-310001496099nmfc:NMNLCCreditFacilityIIMemberus-gaap:LineOfCreditMemberus-gaap:RevolvingCreditFacilityMember2022-01-012022-12-310001496099nmfc:NMNLCCreditFacilityIIMemberus-gaap:LineOfCreditMemberus-gaap:RevolvingCreditFacilityMember2021-01-012021-12-310001496099nmfc:NMNLCCreditFacilityIIMemberus-gaap:RevolvingCreditFacilityMember2023-12-310001496099nmfc:NMNLCCreditFacilityIIMemberus-gaap:RevolvingCreditFacilityMember2022-12-310001496099nmfc:NMNLCCreditFacilityIIMemberus-gaap:RevolvingCreditFacilityMember2021-12-310001496099us-gaap:ConvertibleDebtMembernmfc:A2018ConvertibleNotesMember2018-08-200001496099us-gaap:ConvertibleDebtMembernmfc:A2018ConvertibleNotesMember2018-08-300001496099us-gaap:ConvertibleDebtMembernmfc:A2018ConvertibleNotesMember2019-06-070001496099us-gaap:ConvertibleDebtMembernmfc:A2018ConvertibleNotesMember2018-08-310001496099us-gaap:ConvertibleDebtMembernmfc:A2018ConvertibleNotesMember2023-12-310001496099us-gaap:ConvertibleDebtMembernmfc:A2018ConvertibleNotesMember2022-11-040001496099us-gaap:ConvertibleDebtMembernmfc:A2018ConvertibleNotesMember2022-12-060001496099us-gaap:ConvertibleDebtMembernmfc:A2018ConvertibleNotesMember2022-12-090001496099nmfc:A2022ConvertibleNotesMemberus-gaap:ConvertibleDebtMember2022-11-020001496099nmfc:A2022ConvertibleNotesMemberus-gaap:ConvertibleDebtMember2023-03-140001496099nmfc:A2022ConvertibleNotesMemberus-gaap:ConvertibleDebtMember2023-12-310001496099nmfc:A2022ConvertibleNotesMemberus-gaap:ConvertibleDebtMember2023-01-012023-12-310001496099nmfc:A2022ConvertibleNotesMember2022-11-022022-11-020001496099nmfc:A2022ConvertibleNotesMember2022-11-020001496099nmfc:A2022ConvertibleNotesMember2023-12-312023-12-310001496099nmfc:A2022ConvertibleNotesMember2023-12-310001496099nmfc:A2022ConvertibleNotesMembersrt:MinimumMember2023-12-310001496099nmfc:A2022ConvertibleNotesMembersrt:MaximumMember2023-01-012023-12-310001496099us-gaap:ConvertibleDebtMember2023-01-012023-12-310001496099us-gaap:ConvertibleDebtMember2022-01-012022-12-310001496099us-gaap:ConvertibleDebtMember2021-01-012021-12-310001496099nmfc:A2022ConvertibleNotesMemberus-gaap:ConvertibleDebtMember2022-12-310001496099nmfc:A2022ConvertibleNotesMemberus-gaap:ConvertibleDebtMember2021-12-310001496099us-gaap:ConvertibleDebtMembernmfc:A2018ConvertibleNotesMember2022-12-310001496099us-gaap:ConvertibleDebtMembernmfc:A2018ConvertibleNotesMember2021-12-310001496099us-gaap:UnsecuredDebtMembernmfc:UnsecuredNotesEffectiveMay2016Member2016-05-060001496099us-gaap:UnsecuredDebtMembernmfc:UnsecuredNotesEffectiveJanuary2018Member2018-01-302018-01-300001496099us-gaap:UnsecuredDebtMembernmfc:UnsecuredNotesEffectiveMay2016Member2016-09-300001496099nmfc:UnsecuredNotesEffectiveMay2016Member2021-02-162021-02-160001496099nmfc:UnsecuredNotesEffectiveJune2017Memberus-gaap:UnsecuredDebtMember2017-06-300001496099nmfc:UnsecuredNotesEffectiveJune2017Memberus-gaap:UnsecuredDebtMember2017-06-302017-06-300001496099nmfc:UnsecuredNotesEffectiveJune2017Member2022-07-142022-07-140001496099us-gaap:UnsecuredDebtMembernmfc:UnsecuredNotesEffectiveJanuary2018Member2018-01-300001496099nmfc:UnsecuredNotesEffectiveJuly2018Memberus-gaap:UnsecuredDebtMember2018-07-050001496099nmfc:UnsecuredNotesEffectiveJuly2018Memberus-gaap:UnsecuredDebtMember2018-07-052018-07-050001496099us-gaap:UnsecuredDebtMembernmfc:UnsecuredNotesEffectiveApril2019Member2019-04-300001496099us-gaap:UnsecuredDebtMembernmfc:UnsecuredNotesEffectiveApril2019Member2019-04-302019-04-300001496099us-gaap:UnsecuredDebtMembernmfc:UnsecuredNotesEffectiveJanuary2021Member2021-01-290001496099us-gaap:UnsecuredDebtMembernmfc:UnsecuredNotesEffectiveJanuary2021Member2021-01-292021-01-290001496099us-gaap:UnsecuredDebtMembernmfc:UnsecuredNotesEffectiveJune2022Member2022-06-150001496099us-gaap:UnsecuredDebtMembernmfc:UnsecuredNotesEffectiveJune2022Member2022-06-152022-06-150001496099us-gaap:UnsecuredDebtMembernmfc:UnsecuredNotesEffectiveMay2016Member2017-06-300001496099srt:MinimumMemberus-gaap:UnsecuredDebtMember2023-12-310001496099us-gaap:UnsecuredDebtMembernmfc:EightPointTwoFivePercentageNotesDueTwoThousandTwentyEightMember2023-11-130001496099us-gaap:UnsecuredDebtMember2023-01-012023-12-310001496099us-gaap:UnsecuredDebtMember2022-01-012022-12-310001496099us-gaap:UnsecuredDebtMember2021-01-012021-12-310001496099nmfc:GuaranteedDebtMember2023-01-012023-12-310001496099nmfc:NewMountainFinanceSBICLPMember2023-12-310001496099nmfc:NewMountainFinanceSBICLPMember2022-12-310001496099nmfc:NewMountainFinanceSBICIILPMember2023-12-310001496099nmfc:NewMountainFinanceSBICIILPMember2022-12-310001496099nmfc:USD37500SBAGuaranteedDebenturesIssuedMarch2015Membernmfc:NewMountainFinanceSBICLPMember2023-12-310001496099nmfc:USD37500SBAGuaranteedDebenturesIssuedMarch2015Membernmfc:GuaranteedDebtMembernmfc:NewMountainFinanceSBICLPMember2023-12-310001496099nmfc:NewMountainFinanceSBICLPMembernmfc:USD3750SBAGuaranteedDebenturesIssuedSeptember2015Member2023-12-310001496099nmfc:GuaranteedDebtMembernmfc:NewMountainFinanceSBICLPMembernmfc:USD3750SBAGuaranteedDebenturesIssuedSeptember2015Member2023-12-310001496099nmfc:USD28795SBAGuaranteedDebenturesIssuedSeptember2015Membernmfc:NewMountainFinanceSBICLPMember2023-12-310001496099nmfc:USD28795SBAGuaranteedDebenturesIssuedSeptember2015Membernmfc:GuaranteedDebtMembernmfc:NewMountainFinanceSBICLPMember2023-12-310001496099nmfc:NewMountainFinanceSBICLPMembernmfc:USD13950SBAGuaranteedDebenturesIssuedMarch2016Member2023-12-310001496099nmfc:GuaranteedDebtMembernmfc:NewMountainFinanceSBICLPMembernmfc:USD13950SBAGuaranteedDebenturesIssuedMarch2016Member2023-12-310001496099nmfc:NewMountainFinanceSBICLPMembernmfc:USD4000SBAGuaranteedDebenturesIssuedSeptember2016Member2023-12-310001496099nmfc:GuaranteedDebtMembernmfc:NewMountainFinanceSBICLPMembernmfc:USD4000SBAGuaranteedDebenturesIssuedSeptember2016Member2023-12-310001496099nmfc:USD13000SBAGuaranteedDebenturesIssuedSeptember2017Membernmfc:NewMountainFinanceSBICLPMember2023-12-310001496099nmfc:USD13000SBAGuaranteedDebenturesIssuedSeptember2017Membernmfc:GuaranteedDebtMembernmfc:NewMountainFinanceSBICLPMember2023-12-310001496099nmfc:USD15255SBAGuaranteedDebenturesIssuedMarch2018Membernmfc:NewMountainFinanceSBICLPMember2023-12-310001496099nmfc:USD15255SBAGuaranteedDebenturesIssuedMarch2018Membernmfc:GuaranteedDebtMembernmfc:NewMountainFinanceSBICLPMember2023-12-310001496099nmfc:NewMountainFinanceSBICIILPMembernmfc:USD15000SBAGuaranteedDebenturesIssuedSeptember2018Member2023-12-310001496099nmfc:NewMountainFinanceSBICIILPMembernmfc:GuaranteedDebtMembernmfc:USD15000SBAGuaranteedDebenturesIssuedSeptember2018Member2023-12-310001496099nmfc:NewMountainFinanceSBICIILPMembernmfc:USD19000SBAGuaranteedDebenturesIssuedSeptember2019Member2023-12-310001496099nmfc:NewMountainFinanceSBICIILPMembernmfc:GuaranteedDebtMembernmfc:USD19000SBAGuaranteedDebenturesIssuedSeptember2019Member2023-12-310001496099nmfc:NewMountainFinanceSBICIILPMembernmfc:USD41000SBAGuaranteedDebenturesIssuedMarch2020Member2023-12-310001496099nmfc:NewMountainFinanceSBICIILPMembernmfc:GuaranteedDebtMembernmfc:USD41000SBAGuaranteedDebenturesIssuedMarch2020Member2023-12-310001496099nmfc:NewMountainFinanceSBICIILPMembernmfc:USD24000SBAGuaranteedDebenturesIssuedMarch2020Member2023-12-310001496099nmfc:NewMountainFinanceSBICIILPMembernmfc:USD24000SBAGuaranteedDebenturesIssuedMarch2020Membernmfc:GuaranteedDebtMember2023-12-310001496099nmfc:NewMountainFinanceSBICIILPMembernmfc:USD51000SBAGuaranteedDebenturesIssuedSeptember2020Member2023-12-310001496099nmfc:NewMountainFinanceSBICIILPMembernmfc:GuaranteedDebtMembernmfc:USD51000SBAGuaranteedDebenturesIssuedSeptember2020Member2023-12-310001496099nmfc:GuaranteedDebtMember2022-01-012022-12-310001496099nmfc:GuaranteedDebtMember2021-01-012021-12-310001496099nmfc:FinancingCommitmentLetterToPurchaseInvestmentsMember2023-12-310001496099nmfc:FinancingCommitmentLetterToPurchaseInvestmentsMember2022-12-310001496099nmfc:RetainedEarningsAccumulatedNetInvestmentIncomeLossMember2023-01-012023-12-310001496099nmfc:RetainedEarningsAccumulatedNetInvestmentIncomeLossMember2022-01-012022-12-310001496099nmfc:RetainedEarningsAccumulatedNetInvestmentIncomeLossMember2021-01-012021-12-310001496099nmfc:RetainedEarningsAccumulatedNetRealizedGainLossMember2023-01-012023-12-310001496099nmfc:RetainedEarningsAccumulatedNetRealizedGainLossMember2022-01-012022-12-310001496099nmfc:RetainedEarningsAccumulatedNetRealizedGainLossMember2021-01-012021-12-310001496099us-gaap:AdditionalPaidInCapitalMember2023-01-012023-12-310001496099us-gaap:AdditionalPaidInCapitalMember2022-01-012022-12-310001496099us-gaap:AdditionalPaidInCapitalMember2021-01-012021-12-310001496099us-gaap:CommonStockMember2020-12-310001496099us-gaap:AdditionalPaidInCapitalMember2020-12-310001496099nmfc:RetainedEarningsAccumulatedNetInvestmentIncomeLossMember2020-12-310001496099nmfc:RetainedEarningsAccumulatedNetRealizedGainLossMember2020-12-310001496099nmfc:RetainedEarningsNetUnrealizedAppreciationDepreciationMember2020-12-310001496099us-gaap:NoncontrollingInterestMember2020-12-310001496099us-gaap:CommonStockMember2021-01-012021-12-310001496099nmfc:RetainedEarningsNetUnrealizedAppreciationDepreciationMember2021-01-012021-12-310001496099us-gaap:CommonStockMember2021-12-310001496099us-gaap:AdditionalPaidInCapitalMember2021-12-310001496099nmfc:RetainedEarningsAccumulatedNetInvestmentIncomeLossMember2021-12-310001496099nmfc:RetainedEarningsAccumulatedNetRealizedGainLossMember2021-12-310001496099nmfc:RetainedEarningsNetUnrealizedAppreciationDepreciationMember2021-12-310001496099nmfc:RetainedEarningsNetUnrealizedAppreciationDepreciationMember2022-01-012022-12-310001496099us-gaap:CommonStockMember2022-12-310001496099us-gaap:AdditionalPaidInCapitalMember2022-12-310001496099nmfc:RetainedEarningsAccumulatedNetInvestmentIncomeLossMember2022-12-310001496099nmfc:RetainedEarningsAccumulatedNetRealizedGainLossMember2022-12-310001496099nmfc:RetainedEarningsNetUnrealizedAppreciationDepreciationMember2022-12-310001496099nmfc:RetainedEarningsNetUnrealizedAppreciationDepreciationMember2023-01-012023-12-310001496099us-gaap:CommonStockMember2023-12-310001496099us-gaap:AdditionalPaidInCapitalMember2023-12-310001496099nmfc:RetainedEarningsAccumulatedNetInvestmentIncomeLossMember2023-12-310001496099nmfc:RetainedEarningsAccumulatedNetRealizedGainLossMember2023-12-310001496099nmfc:RetainedEarningsNetUnrealizedAppreciationDepreciationMember2023-12-310001496099nmfc:AtTheMarketOfferingMember2023-05-182023-05-180001496099nmfc:AtTheMarketOfferingMember2023-01-012023-12-310001496099nmfc:AtTheMarketOfferingMember2022-01-012022-12-310001496099nmfc:AtTheMarketOfferingMember2021-01-012021-12-3100014960992019-12-3100014960992018-12-3100014960992020-01-012020-12-3100014960992019-01-012019-12-310001496099us-gaap:LineOfCreditMemberus-gaap:RevolvingCreditFacilityMembernmfc:HoldingsCreditFacilityMember2020-01-012020-12-310001496099us-gaap:LineOfCreditMemberus-gaap:RevolvingCreditFacilityMembernmfc:HoldingsCreditFacilityMember2019-01-012019-12-310001496099us-gaap:UnsecuredDebtMember2020-01-012020-12-310001496099us-gaap:UnsecuredDebtMember2019-01-012019-12-310001496099us-gaap:ConvertibleDebtMember2020-01-012020-12-310001496099us-gaap:ConvertibleDebtMember2019-01-012019-12-310001496099nmfc:GuaranteedDebtMember2020-01-012020-12-310001496099nmfc:GuaranteedDebtMember2019-01-012019-12-310001496099us-gaap:LineOfCreditMemberus-gaap:RevolvingCreditFacilityMembernmfc:DBCreditFacilityMember2020-01-012020-12-310001496099us-gaap:LineOfCreditMemberus-gaap:RevolvingCreditFacilityMembernmfc:DBCreditFacilityMember2019-01-012019-12-310001496099us-gaap:LineOfCreditMembernmfc:NMFCCreditFacilityMemberus-gaap:RevolvingCreditFacilityMember2020-01-012020-12-310001496099us-gaap:LineOfCreditMembernmfc:NMFCCreditFacilityMemberus-gaap:RevolvingCreditFacilityMember2019-01-012019-12-310001496099nmfc:NMNLCCreditFacilityIIMemberus-gaap:LineOfCreditMemberus-gaap:RevolvingCreditFacilityMember2020-01-012020-12-310001496099nmfc:NMNLCCreditFacilityIIMemberus-gaap:LineOfCreditMemberus-gaap:RevolvingCreditFacilityMember2019-01-012019-12-310001496099nmfc:NMNLCCreditFacilityMemberus-gaap:LineOfCreditMemberus-gaap:RevolvingCreditFacilityMember2023-01-012023-12-310001496099nmfc:NMNLCCreditFacilityMemberus-gaap:LineOfCreditMemberus-gaap:RevolvingCreditFacilityMember2022-01-012022-12-310001496099nmfc:NMNLCCreditFacilityMemberus-gaap:LineOfCreditMemberus-gaap:RevolvingCreditFacilityMember2021-01-012021-12-310001496099nmfc:NMNLCCreditFacilityMemberus-gaap:LineOfCreditMemberus-gaap:RevolvingCreditFacilityMember2020-01-012020-12-310001496099nmfc:NMNLCCreditFacilityMemberus-gaap:LineOfCreditMemberus-gaap:RevolvingCreditFacilityMember2019-01-012019-12-310001496099nmfc:UnsecuredNotesExcluding575UnsecuredNotesMember2023-12-310001496099nmfc:EightPointTwoFivePercentageNotesDueTwoThousandTwentyEightMember2023-12-310001496099nmfc:EightPointTwoFivePercentageNotesDueTwoThousandTwentyEightMember2023-01-012023-12-310001496099nmfc:A2018ConvertibleNotesMember2022-12-310001496099nmfc:A2022ConvertibleNotesMember2022-12-310001496099nmfc:UnsecuredNotesExcluding575UnsecuredNotesMember2022-12-310001496099nmfc:A2018ConvertibleNotesMember2021-12-310001496099nmfc:UnsecuredNotesExcluding575UnsecuredNotesMember2021-12-310001496099nmfc:NMFCCreditFacilityMember2021-12-310001496099nmfc:DBCreditFacilityMember2021-12-310001496099nmfc:NMNLCCreditFacilityIIMember2021-12-310001496099nmfc:HoldingsCreditFacilityMember2020-12-310001496099nmfc:A2018ConvertibleNotesMember2020-12-310001496099nmfc:A575UnsecuredNotesEffectiveSeptember2018Memberus-gaap:UnsecuredDebtMember2018-09-250001496099nmfc:UnsecuredNotesExcluding575UnsecuredNotesMember2020-12-310001496099nmfc:A575UnsecuredNotesMember2020-12-310001496099nmfc:A575UnsecuredNotesMember2020-01-012020-12-310001496099nmfc:NMFCCreditFacilityMember2020-12-310001496099nmfc:DBCreditFacilityMember2020-12-310001496099nmfc:HoldingsCreditFacilityMember2019-12-310001496099nmfc:A2018ConvertibleNotesMember2019-12-310001496099nmfc:UnsecuredNotesExcluding575UnsecuredNotesMember2019-12-310001496099nmfc:A575UnsecuredNotesMember2019-12-310001496099nmfc:A575UnsecuredNotesMember2019-01-012019-12-310001496099nmfc:NMFCCreditFacilityMember2019-12-310001496099nmfc:DBCreditFacilityMember2019-12-310001496099nmfc:HoldingsCreditFacilityMember2018-12-310001496099nmfc:A2014ConvertibleNotesMember2018-12-310001496099nmfc:A2018ConvertibleNotesMember2018-12-310001496099nmfc:UnsecuredNotesExcluding575UnsecuredNotesMember2018-12-310001496099nmfc:A575UnsecuredNotesMember2018-12-310001496099nmfc:A575UnsecuredNotesMember2018-01-012018-12-310001496099nmfc:NMFCCreditFacilityMember2018-12-310001496099nmfc:DBCreditFacilityMember2018-12-310001496099nmfc:HoldingsCreditFacilityMember2017-12-310001496099nmfc:A2014ConvertibleNotesMember2017-12-310001496099nmfc:UnsecuredNotesExcluding575UnsecuredNotesMember2017-12-310001496099nmfc:NMFCCreditFacilityMember2017-12-310001496099nmfc:HoldingsCreditFacilityMember2016-12-310001496099nmfc:A2014ConvertibleNotesMember2016-12-310001496099nmfc:UnsecuredNotesExcluding575UnsecuredNotesMember2016-12-310001496099nmfc:NMFCCreditFacilityMember2016-12-310001496099nmfc:HoldingsCreditFacilityMember2015-12-310001496099nmfc:A2014ConvertibleNotesMember2015-12-310001496099nmfc:NMFCCreditFacilityMember2015-12-310001496099nmfc:HoldingsCreditFacilityMember2014-12-310001496099nmfc:A2014ConvertibleNotesMember2014-12-310001496099nmfc:NMFCCreditFacilityMember2014-12-3100014960992017-12-3100014960992016-12-3100014960992015-12-3100014960992014-12-3100014960992018-01-012018-12-3100014960992017-01-012017-12-3100014960992016-01-012016-12-3100014960992015-01-012015-12-3100014960992014-01-012014-12-310001496099us-gaap:SubsequentEventMemberus-gaap:UnsecuredDebtMembernmfc:UnsecuredNotesEffectiveApril2019Member2024-01-250001496099us-gaap:SubsequentEventMembernmfc:RegularDistributionMember2024-01-302024-01-300001496099us-gaap:SubsequentEventMembernmfc:SupplementalDistributionMember2024-01-302024-01-300001496099us-gaap:SubsequentEventMembernmfc:SixPointEightSevenFivePercentageNotesDueTwoThousandTwentyNineMember2024-02-010001496099us-gaap:SubsequentEventMembernmfc:SixPointEightSevenFivePercentageNotesDueTwoThousandTwentyNineMember2024-02-012024-02-01
UNITED STATES
SECURITIES AND EXCHANGE COMMISSION
Washington, D.C. 20549
_________________________________________________________________________________
FORM 10-K
_________________________________________________________________________________ | | | | | |
| ý | Annual Report Pursuant to Section 13 or 15(d) of the Securities Exchange Act of 1934 |
For the fiscal year ended December 31, 2023 | | | | | |
| o | Transition Report Pursuant to Section 13 or 15(d) of the Securities Exchange Act of 1934 |
_________________________________________________________________________________ | | | | | | | | | | | | | | |
| Commission File Number | | Exact name of registrant as specified in its charter, addresses of principal executive offices, telephone numbers and states or other jurisdictions of incorporation or organization | | I.R.S. Employer
Identification Number |
| 814-00832 | | New Mountain Finance Corporation 1633 Broadway, 48th Floor New York, New York 10019 Telephone: (212) 720-0300 State of Incorporation: Delaware | | 27-2978010 |
_________________________________________________________________________________
Securities registered pursuant to Section 12(b) of the Act: | | | | | | | | | | | | | | |
| Title of each class | Trading Symbol(s) | Name of each exchange on which registered | |
| Common stock, par value $0.01 per share | NMFC | The NASDAQ Global Select Market | |
| 8.250% Notes due 2028 | NMFCZ | The NASDAQ Global Select Market | |
Securities registered pursuant to Section 12(g) of the Act: _________________________________________________________________________________
Indicate by check mark if the registrant is a well-known seasoned issuer, as defined in Rule 405 of the Securities Act. Yes ý No o
Indicate by check mark if the registrant is not required to file reports pursuant to Section 13 or Section 15(d) of the Act. Yes o No ý
Indicate by check mark whether the registrant (1) has filed all reports required to be filed by Section 13 or 15(d) of the Securities Exchange Act of 1934 during the preceding 12 months (or for such shorter period that the registrant was required to file such reports), and (2) has been subject to such filing requirements for the past 90 days. Yes ý No o
Indicate by check mark whether the registrant has submitted electronically every Interactive Data File required to be submitted pursuant to Rule 405 of Regulation S-T (§ 232.405 of this chapter) during the preceding 12 months (or for such shorter period that the registrant was required to submit such files). Yes ý No o
Indicate by check mark whether the registrant is a large accelerated filer, an accelerated filer, a non-accelerated filer, a smaller reporting company or an emerging growth company. See definitions of "large accelerated filer", "accelerated filer", "smaller reporting company" and "emerging growth company" in Rule 12b-2 of the Exchange Act: | | | | | | | | | | | |
| Large accelerated filer ý | Accelerated filer o | |
| Non-accelerated filer o | Smaller reporting company ☐ | |
| Emerging growth company ☐ | | |
If an emerging growth company, indicate by check mark if the registrant has elected not to use the extended transition period for complying with any new or revised financial accounting standards provided pursuant to Section 13(a) of the Exchange Act. o
Indicate by check mark whether the registrant has filed a report on and attestation to its management’s assessment of the effectiveness of its internal control over financial reporting under Section 404(b) of the Sarbanes-Oxley Act (15 U.S.C. 7262(b)) by the registered public accounting firm that prepared or issued its audit report. Yes ý No o
If securities are registered pursuant to Section 12(b) of the Act, indicate by check mark whether the financial statements of the registrant included in the filing reflect the correction of an error to previously issued financial statements.o
Indicate by check mark whether any of those error corrections are restatements that required a recovery analysis of incentive-based compensation received by any of the registrant's executive officers during the relevant recovery period pursuant to §240.10D-1(b). o
Indicate by check mark whether the registrant is a shell company (as defined in Rule 12b-2 of the Exchange Act). Yes o No ý
The aggregate market value of common stock held by non-affiliates of New Mountain Finance Corporation on June 30, 2023, based on the closing price on that date of $12.44, on the NASDAQ Global Select Market ("NASDAQ") was $1,120.1 million. For the purposes of calculating this amount only, all directors and executive officers of the registrant have been treated as affiliates. | | | | | | | | | | | | | | |
| Description | | Shares as of February 26, 2024 | |
| Common stock, par value $0.01 per share | | 102,877,604 | |
Documents Incorporated by Reference
Portions of the Registrant's Proxy Statement for its 2024 Annual Meeting of Stockholders to be filed not later than 120 days after the end of the fiscal year covered by this Annual Report on this Form 10-K are incorporated by reference into Part III on this Form 10-K.
FORM 10-K FOR THE YEAR ENDED DECEMBER 31, 2023
PART I
Item 1. Business
New Mountain Finance Corporation ("NMFC", the "Company", "we", "us" or "our") is a Delaware corporation that was originally incorporated on June 29, 2010 and completed its initial public offering ("IPO") on May 19, 2011. We are a closed-end, non-diversified management investment company that has elected to be regulated as a business development company ("BDC") under the Investment Company Act of 1940, as amended (the "1940 Act"). We have elected to be treated, and intend to comply with the requirements to continue to qualify annually, as a regulated investment company ("RIC") under Subchapter M of the Internal Revenue Code of 1986, as amended (the "Code"). Since our IPO, and through December 31, 2023, we have raised approximately $966.9 million in net proceeds from additional offerings of common stock.
New Mountain Finance Advisers BDC, L.L.C. (the "Investment Adviser") is a wholly-owned subsidiary of New Mountain Capital Group, L.P. (together with New Mountain Capital L.L.C. and its affiliates, "New Mountain Capital") whose ultimate owners include Steven B. Klinsky, other current and former New Mountain Capital professionals and related vehicles and a minority investor. New Mountain Capital is a global investment firm with approximately $50 billion of assets under management and a track record of investing in the middle market. New Mountain Capital focuses on investing in defensive growth companies across its private equity, credit and net lease investment strategies. The Investment Adviser manages our day-to-day operations and provides us with investment advisory and management services. The Investment Adviser also manages other funds that may have investment mandates that are similar, in whole or in part, to ours. New Mountain Finance Administration, L.L.C. (the "Administrator”), a wholly-owned subsidiary of New Mountain Capital, provides the administrative services necessary to conduct our day-to-day operations.
We have established the following wholly-owned direct and indirect subsidiaries:
•New Mountain Finance Holdings, L.L.C. ("NMF Holdings" or the "Predecessor Operating Company") and New Mountain Finance DB, L.L.C. ("NMFDB"), whose assets are used to secure NMF Holdings’ credit facility and NMFDB’s credit facility, respectively;
•New Mountain Finance SBIC, L.P. ("SBIC I") and New Mountain Finance SBIC II, L.P. ("SBIC II"), who have received licenses from the U.S. Small Business Administration ("SBA") to operate as small business investment companies ("SBICs") under Section 301(c) of the Small Business Investment Act of 1958, as amended (the "1958 Act") and their general partners, New Mountain Finance SBIC G.P., L.L.C. ("SBIC I GP") and New Mountain Finance SBIC II G.P., L.L.C. ("SBIC II GP"), respectively;
•NMF Ancora Holdings, Inc. ("NMF Ancora"), NMF QID NGL Holdings, Inc. ("NMF QID"), NMF YP Holdings, Inc. ("NMF YP"), NMF Permian Holdings, LLC ("NMF Permian"), NMF HB, Inc. ("NMF HB"), NMF TRM, LLC ("NMF TRM"), NMF Pioneer, Inc. ("NMF Pioneer") and NMF OEC, Inc. ("NMF OEC"), which are treated as corporations for U.S. federal income tax purposes and are intended to facilitate our compliance with the requirements to be treated as a RIC under the Code by holding equity or equity related investments in portfolio companies organized as limited liability companies (or other forms of pass-through entities); we consolidate these corporations for accounting purposes but the corporations are not consolidated for U.S. federal income tax purposes and may incur U.S. federal income tax expense as a result of their ownership of the portfolio companies; and
•New Mountain Finance Servicing, L.L.C. ("NMF Servicing"), which serves as the administrative agent on certain investment transactions.
New Mountain Net Lease Corporation ("NMNLC"), a majority-owned consolidated subsidiary of ours, which acquires commercial real estate properties that are subject to "triple net" leases, has elected to be treated, and intends to comply with the requirements to continue to qualify annually, as a real estate investment trust, or REIT, within the meaning of Section 856(a) of the Code.
New Mountain Finance Advisers BDC, L.L.C.
The Investment Adviser is a wholly-owned subsidiary of New Mountain Capital whose ultimate owners include Steven B. Klinsky, other current and former New Mountain Capital professionals and related vehicles and a minority investor. New Mountain Capital is a global investment firm with approximately $50 billion of assets under management and a track record of investing in the middle market. New Mountain Capital focuses on investing in defensive growth companies across its private equity, credit and net lease investment strategies. The Investment Adviser manages our day-to-day operations and provides us with investment advisory and management services. In particular, the Investment Adviser is responsible for identifying attractive investment opportunities, conducting research and due diligence on prospective investments, structuring our investments and monitoring and servicing our investments. The Investment Adviser is managed by a six member investment committee (the "Investment Committee"), which is responsible for approving purchases and sales of our
investments above $10.0 million in the aggregate by a single issuer. For additional information on the Investment Committee, see "Investment Committee".
New Mountain Finance Administration, L.L.C.
The Administrator, a wholly-owned subsidiary of New Mountain Capital, provides the administrative services necessary to conduct our day-to-day operations. The Administrator also maintains, or oversees the maintenance of, our consolidated financial records, our reports to stockholders and reports filed with the U.S. Securities and Exchange Commission ("SEC"). The Administrator performs the calculation and publication of our net asset values, the payment of our expenses and oversees the performance of various third-party service providers and the preparation and filing of our tax returns. The Administrator may also provide, on our behalf, managerial assistance to our portfolio companies.
Competition
We compete for investments with a number of BDCs and investment funds (including private equity and hedge funds), as well as traditional financial services companies such as commercial banks and other sources of financing. Many of these entities have greater financial and managerial resources than we do. We believe we are able to be competitive with these entities primarily on the basis of the experience and contacts of our management team, our responsive and efficient investment analysis and decision-making processes, the investment terms we offer, the model that we employ to perform our due diligence with the broader New Mountain Capital team and our model of investing in companies and industries we know well.
We believe that some of our competitors may make investments with interest rates and returns that are comparable to or lower than the rates and returns that we target. Therefore, we do not seek to compete solely on the interest rates and returns that we offer to potential portfolio companies. For additional information concerning the competitive risks we face, see Item 1A.—Risk Factors in this Annual Report on Form 10-K.
Investment Objective and Portfolio
We are a leading BDC focused on providing direct lending solutions to U.S. upper middle market companies backed by top private equity sponsors. Our investment objective is to generate current income and capital appreciation through the sourcing and origination of senior secured loans and select junior capital positions, to growing businesses in defensive industries that offer attractive risk-adjusted returns. Our differentiated investment approach leverages the deep sector knowledge and operating resources of New Mountain Capital.
Senior secured loans may include traditional first lien loans or unitranche loans. We invest a significant portion of our portfolio in unitranche loans, which are loans that combine both senior and subordinated debt, generally in a first lien position. Because unitranche loans combine characteristics of senior and subordinated debt, they have risks similar to the risks associated with secured debt and subordinated debt. Certain unitranche loan investments may include “last-out” positions, which generally heighten the risk of loss. In some cases, our investments may also include equity interests.
We make investments through both primary originations and open-market secondary purchases. We primarily target loans to, and invest in, U.S. middle market businesses, a market segment we believe continues to be underserved by other lenders. We define middle market businesses as those businesses with annual earnings before interest, taxes, depreciation, and amortization (“EBITDA”) between $10.0 million and $200.0 million. Our primary focus is in the debt of defensive growth companies, which are defined as generally exhibiting the following characteristics: (i) acyclicality, (ii) sustainable secular growth drivers, (iii) niche market dominance and high barriers to competitive entry, (iv) recurring revenue and strong free cash flow, (v) flexible cost structures and (vi) seasoned management teams.
Similar to us, the investment objective of SBIC I and SBIC II is to generate current income and capital appreciation under our investment criteria. However, SBIC I’s and SBIC II's investments must be in SBA eligible small businesses. For additional information on SBA regulations, see "SBA Regulation". Our portfolio may be concentrated in a limited number of industries. As of December 31, 2023, our top five industry concentrations were software, business services, healthcare, investment funds (which includes our investments in our joint ventures) and education. Our targeted investments typically have maturities of between five and ten years and generally range in size between $10.0 million and $125.0 million. This investment size may vary proportionately as the size of our capital base changes. At December 31, 2023, our portfolio consisted of 110 portfolio companies and was invested 55.9% in first lien loans, 14.1% in second lien loans, 3.0% in subordinated debt and 27.0% in equity and other, as measured at fair value versus 107 portfolio companies invested 54.5% in first lien loans, 17.4% in second lien loans, 2.4% in subordinated debt and 25.7% in equity and other, as measured at fair value at December 31, 2022.
The fair value of our investments, as determined in good faith by our board of directors, was approximately $3,011.3 million in 110 portfolio companies at December 31, 2023 and approximately $3,221.2 million in 107 portfolio companies at December 31, 2022.
The following table shows our portfolio and investment activity for the years ended December 31, 2023 and December 31, 2022: | | | | | | | | | | | | | | | | | |
| | | Year Ended December 31, |
| (in millions) | | 2023 | | 2022 | |
| New investments in 46 and 50 portfolio companies, respectively | | $ | 283.4 | | | $ | 620.7 | | |
| Debt repayments in existing portfolio companies | | 358.3 | | | 395.1 | | |
| Sales of securities in 10 and 9 portfolio companies, respectively | | 182.1 | | | 188.8 | | |
| Change in unrealized appreciation on 78 and 21 portfolio companies, respectively | | 108.6 | | | 81.3 | | |
| Change in unrealized depreciation on 39 and 92 portfolio companies, respectively | | (98.3) | | | (165.4) | | |
At December 31, 2023 and December 31, 2022, our weighted average yield to maturity at cost ("YTM at Cost") was approximately 10.9% and 11.3%, respectively. This YTM at Cost calculation assumes that all investments, including secured collateralized agreements, not on non-accrual are purchased at cost on the quarter end date and held until their respective maturities with no prepayments or losses and exited at par at maturity. At December 31, 2023 and December 31, 2022, our weighted average yield to maturity at cost for investments ("YTM at Cost for Investments") was approximately 9.7% and 10.0%, respectively. This YTM at Cost for Investments calculation assumes that all investments, including secured collateralized agreements, are purchased at cost on the quarter end date and held until their respective maturities with no prepayments or losses and exited at par at maturity. YTM at Cost and YTM at Cost for Investments calculations exclude the impact of existing leverage. YTM at Cost and YTM at Cost for Investments use the London Interbank Offered Rate ("LIBOR"), Sterling Overnight Interbank Average Rate ("SONIA"), Secured Overnight Financing Rate ("SOFR") and Euro Interbank Offered Rate ("EURIBOR") curves at each quarter's end date. The actual yield to maturity may be higher or lower due to the future selection of the SONIA, SOFR and EURIBOR contracts by the individual companies in our portfolio or other factors.
The following summarizes our ten largest portfolio company investments and the top ten industries in which we were invested as of December 31, 2023, calculated as a percentage of total assets as of December 31, 2023: | | | | | | | | |
| Portfolio Company | | Percent of Total Assets |
| NMFC Senior Loan Program III LLC | | 4.4 | % |
| New Benevis Topco, LLC/New Benevis Holdco, Inc. | | 4.3 | % |
| TVG-Edmentum Holdings, LLC/Edmentum Ultimate Holdings, LLC | | 3.6 | % |
| NMFC Senior Loan Program IV LLC | | 3.6 | % |
| NM NL Holdings LP/NM GP Holdco LLC | | 3.1 | % |
| UniTek Global Services, Inc. | | 2.9 | % |
| Knockout Intermediate Holdings I Inc./Kaseya Inc. | | 2.6 | % |
| Paw Midco, Inc./AAH Topco, LLC | | 2.5 | % |
| Dealer Tire Holdings, LLC | | 2.4 | % |
| Associations, Inc. | | 2.1 | % |
| Total | | 31.5 | % |
| | | | | | | | |
| Industry Type | | Percent of Total Assets |
| Software | | 25.6 | % |
| Business Services | | 17.1 | % |
| Healthcare | | 15.1 | % |
| Investment Funds (includes investments in joint ventures) | | 8.0 | % |
| Education | | 6.7 | % |
| Consumer Services | | 6.1 | % |
| Net Lease | | 3.8 | % |
| Distribution & Logistics | | 3.5 | % |
| Financial Services | | 3.3 | % |
| Energy | | 2.1 | % |
| Total | | 91.3 | % |
Investment Criteria
The Investment Adviser has identified the following investment criteria and guidelines for use in evaluating prospective portfolio companies. However, not all of these criteria and guidelines were, or will be, met in connection with each of our investments.
•Defensive growth industries. We seek to invest in industries that can succeed in both robust and weak economic environments but which are also sufficiently large and growing to achieve high valuations providing enterprise value cushion for our targeted debt securities.
•High barriers to competitive entry. We target industries and companies that have well defined industries and well established, understandable barriers to competitive entry.
•Recurring revenue. Where possible, we focus on companies that have a high degree of predictability in future revenue.
•Flexible cost structure. We seek to invest in businesses that have limited fixed costs and therefore modest operating leverage.
•Strong free cash flow and high return on assets. We focus on businesses with a demonstrated ability to produce meaningful free cash flow from operations. We typically target companies that are not asset intensive and that have minimal capital expenditure and minimal working capital growth needs.
•Sustainable business and niche market dominance. We seek to invest in businesses that exert niche market dominance in their industry and that have a demonstrated history of sustaining market leadership over time.
•Established companies. We seek to invest in established companies with sound historical financial performance. We do not intend to invest in start-up companies or companies with speculative business plans.
•Private equity sponsorship. We generally seek to invest in companies in conjunction with private equity sponsors who we know and trust and who have proven capabilities in building value.
•Seasoned management team. We generally require that portfolio companies have a seasoned management team with strong corporate governance. Oftentimes we have a historical relationship with or direct knowledge of key managers from previous investment experience.
Investment Selection and Process
The Investment Adviser believes it has developed a proven, consistent and replicable investment process to execute our investment strategy. The Investment Adviser seeks to identify the most attractive investment sectors from the top down and then works to become the most advantaged investor in these sectors. The steps in the Investment Adviser's process include:
•Identifying attractive investment sectors from the top down;
•Creating competitive advantages in the selected industry sectors; and
•Targeting companies with leading market share and attractive business models in its chosen sectors.
Investment Committee
The Investment Adviser is managed by a six member Investment Committee, which is responsible for approving purchases and sales of our investments above $10.0 million in aggregate by issuer. The Investment Committee currently consists of Steven B. Klinsky, Robert A. Hamwee, John R. Kline, Adam B. Weinstein and Laura C. Holson. The sixth and final member of the Investment Committee will consist of a New Mountain Capital Managing Director who will hold the position on the Investment Committee on an annual rotating basis. A. Joe Delgado served on the Investment Committee from August 2022 to July 2023. Beginning in August 2023, Andre V. Moura was appointed to the Investment Committee for a one year term. Effective January 1, 2023, Laura C. Holson joined the Investment Committee as a new permanent member. In addition, our executive officers and certain investment professionals of the Investment Adviser are invited to all Investment Committee meetings. Purchases and dispositions below $10.0 million may be approved by our chief executive officer. These approval thresholds are subject to change over time. We expect to benefit from the extensive and varied relevant experience of the investment professionals serving on the Investment Committee, which includes expertise in private equity, primary and secondary leveraged credit, private mezzanine finance and distressed debt.
The purpose of the Investment Committee is to evaluate and approve, as deemed appropriate, all investments by the Investment Adviser, subject to certain thresholds. The Investment Committee's process is intended to bring the diverse
experience and perspectives of the Investment Committee's members to the analysis and consideration of every investment. The Investment Committee also serves to provide investment consistency and adherence to the Investment Adviser's investment philosophies and policies. The Investment Committee also determines appropriate investment sizing and suggests ongoing monitoring requirements.
In addition to reviewing investments, the Investment Committee meetings serve as a forum to discuss credit views and outlooks. Potential transactions and investment opportunities are also reviewed on a regular basis. Members of our investment team are encouraged to share information and views on credit with the Investment Committee early in their analysis. This process improves the quality of the analysis and allows the deal team members to work more efficiently.
Investment Structure
We target debt investments that will yield current income and occasionally provide the opportunity for capital appreciation through equity securities. Our debt investments are typically structured with the maximum seniority and collateral that we can reasonably obtain while seeking to achieve our total return target.
Debt Investments
The terms of our debt investments are tailored to the facts and circumstances of the transaction and prospective portfolio company and are structured to protect such portfolio company's rights and manage its risk while creating incentives for the portfolio company to achieve its business plan. A substantial source of return is the cash interest that we collect on our debt investments.
•First Lien Loans and Bonds. First lien loans and bonds generally have terms of four to seven years, provide for a variable or fixed interest rate, may contain prepayment penalties and are secured by a first priority security interest in all existing and future assets of the borrower. Our first lien loans may also include unitranche loans. We invest a significant portion of our portfolio in unitranche loans, which are loans that combine both senior and subordinated debt, generally in a first-lien position. Because unitranche loans combine characteristics of senior and subordinated debt, they have risks similar to the risks associated with secured debt and subordinated debt. Certain unitranche loan investments may include “last-out” positions, which generally heighten the risk of loss. These first lien loans and bonds may include payment-in-kind ("PIK") interest, which represents contractual interest accrued and added to the principal that generally becomes due at maturity.
•Second Lien Loans and Bonds. Second lien loans and bonds generally have terms of five to eight years, provide for a variable or fixed interest rate, may contain prepayment penalties and are secured by a second priority security interest in all existing and future assets of the borrower. These second lien loans and bonds may include PIK interest.
•Unsecured Senior, Subordinated and "Mezzanine" Loans and Bonds. Any unsecured investments are generally expected to have terms of five to ten years and provide for a fixed interest rate. Unsecured investments may include PIK interest and may have an equity component, such as warrants to purchase common stock in the portfolio company.
In addition, from time to time we may also enter into revolving credit facilities, bridge financing commitments, delayed draw commitments or other commitments which can result in providing future financing to a portfolio company.
Equity Investments
When we make a debt investment, we may be granted equity in the portfolio company in the same class of security as the sponsor receives upon funding. In addition, we may from time to time make non-control, passive equity co-investments in conjunction with private equity sponsors. We generally seek to structure our passive equity investments, such as direct equity co-investments, to provide us with minority rights provisions and event-driven put rights. We also seek to obtain limited registration rights in connection with these investments, which may include “piggyback” registration rights.
Portfolio Company Monitoring
We monitor the performance and financial trends of our portfolio companies on at least a quarterly basis. We attempt to identify any developments within the portfolio company, the industry or the macroeconomic environment that may alter any material element of our original investment strategy. Our portfolio monitoring procedures are designed to provide a simple yet comprehensive analysis of our portfolio companies based on their operating performance and underlying business characteristics, which in turn forms the basis of its Risk Rating (as defined below).
We use an investment risk rating system to characterize and monitor the credit profile and expected level of returns on each investment in the portfolio. As such, we assign each investment a composite score (“Risk Rating”) based on two metrics – 1) Operating Performance and 2) Business Characteristics:
•Operating Performance assesses the health of the investment in context of its financial performance and the market environment it faces. The metric is expressed in Tiers of “1” to “4”, with “1” being the worst and “4” being the best:
◦Tier 1 – Severe business underperformance and/or severe market headwinds
◦Tier 2 – Significant business underperformance and/or significant market headwinds
◦Tier 3 – Moderate business underperformance and/or moderate market headwinds
◦Tier 4 – Business performance is in-line with or above expectations
•Business Characteristics assesses the health of the investment in context of the underlying portfolio company’s business and credit quality, the underlying portfolio company’s current balance sheet, and the level of support from the equity sponsor. The metric is expressed as on a qualitative scale of “A” to “C”, with “A” being the best and “C” being the worst.
The Risk Rating for each investment is a composite of these two metrics. The Risk Rating is expressed in categories of Red, Orange, Yellow and Green, with Red reflecting an investment performing materially below expectations and Green reflecting an investment that is in-line with or above expectations. The mapping of the composite scores to these categories are below:
•Red – 1C (e.g., Tier 1 for Operating Performance and C for Business Characteristics)
•Orange – 2C and 1B
•Yellow – 3C, 2B, and 1A
•Green – 4C, 3B, 2A, 4B, 3A, and 4A
The following table shows the Risk Rating of our portfolio companies as of December 31, 2023:
| | | | | | | | | | | | | | | | | | | | | | | | | | |
| (in millions) | As of December 31, 2023 |
| Risk Rating | | Cost | | Percent | | Fair Value | | Percent |
| Red | | $ | 39.7 | | | 1.3 | % | | $ | 4.6 | | | 0.2 | % |
| Orange | | 73.1 | | | 2.4 | % | | 42.5 | | | 1.4 | % |
| Yellow | | 157.6 | | | 5.1 | % | | 118.5 | | | 3.9 | % |
| Green | | 2,797.8 | | | 91.2 | % | | 2,862.2 | | | 94.5 | % |
| Total | | $ | 3,068.2 | | | 100.0 | % | | $ | 3,027.8 | | | 100.0 | % |
As of December 31, 2023, all investments in our portfolio had a Green Risk Rating with the exception of six portfolio companies that had a Yellow Risk Rating, four portfolio companies that had an Orange Risk Rating and three portfolio companies that had a Red Risk Rating.
Exit Strategies/Refinancing
We exit our investments typically through one of four scenarios: (i) the sale of the portfolio company itself, resulting in repayment of all outstanding debt, (ii) the recapitalization of the portfolio company in which our loan is replaced with debt or equity from a third party or parties (in some cases, we may choose to participate in the newly issued loan(s)), (iii) the repayment of the initial or remaining principal amount of our loan then outstanding at maturity, or (iv) the sale of the debt investment by
us. In some investments, there may be scheduled amortization of some portion of our loan which would result in a partial exit of our investment prior to the maturity of the loan.
Valuation
At all times, consistent with accounting principles generally accepted in the United States of America ("GAAP") and the 1940 Act, we conduct a valuation of our assets, which impacts our net asset value.
We value our assets on a quarterly basis, or more frequently if required under the 1940 Act. In all cases, our board of directors is ultimately and solely responsible for determining the fair value of our portfolio investments on a quarterly basis in good faith, including investments that are not publicly traded, those whose market prices are not readily available and any other situation where our portfolio investments require a fair value determination. Security transactions are accounted for on a trade date basis. Our quarterly valuation procedures are set forth in more detail below:
(1)Investments for which market quotations are readily available on an exchange are valued at such market quotations based on the closing price indicated from independent pricing services.
(2)Investments for which indicative prices are obtained from various pricing services and/or brokers or dealers are valued through a multi-step valuation process, as described below, to determine whether the quote(s) obtained is representative of fair value in accordance with GAAP.
a.Bond quotes are obtained through independent pricing services. Internal reviews are performed by the investment professionals of the Investment Adviser to ensure that the quote obtained is representative of fair value in accordance with GAAP and, if so, the quote is used. If the Investment Adviser is unable to sufficiently validate the quote(s) internally and if the investment's par value or its fair value exceeds the materiality threshold, the investment is valued similarly to those assets with no readily available quotes (see (3) below); and
b.For investments other than bonds, the investment professionals of the Investment Adviser look at the number of quotes readily available and perform the following:
i.Investments for which two or more quotes are received from a pricing service are valued using the mean of the mean of the bid and ask of the quotes obtained. We will evaluate the reasonableness of the quote, and if the quote is determined to not be representative of fair value, we will use one or more of the methodologies outlined below to determine fair value;
ii.Investments for which one quote is received from a pricing service are validated internally. The investment professionals of the Investment Adviser analyze the market quotes obtained using an array of valuation methods (further described below) to validate the fair value. If the Investment Adviser is unable to sufficiently validate the quote internally and if the investment's par value or its fair value exceeds the materiality threshold, the investment is valued similarly to those assets with no readily available quotes (see (3) below).
(3)Investments for which quotations are not readily available through exchanges, pricing services, brokers, or dealers are valued through a multi-step valuation process:
a.Each portfolio company or investment is initially valued by the investment professionals of the Investment Adviser responsible for the credit monitoring;
b.Preliminary valuation conclusions will then be documented and discussed with our senior management;
c.If an investment falls into (3) above for four consecutive quarters and if the investment's par value or its fair value exceeds the materiality threshold, then at least once each fiscal year, the valuation for each portfolio investment for which the investment professionals of the Investment Adviser do not have a readily available market quotation will be reviewed by an independent valuation firm engaged by our board of directors; and
d.When deemed appropriate by our management, an independent valuation firm may be engaged to review and value investment(s) of a portfolio company, without any preliminary valuation being performed by the Investment Adviser. The investment professionals of the Investment Adviser will review and validate the value provided.
For investments in revolving credit facilities and delayed draw commitments, the cost basis of the funded investments purchased is offset by any costs/netbacks received for any unfunded portion on the total balance committed. The fair value is
also adjusted for the price appreciation or depreciation on the unfunded portion. As a result, the purchase of commitments not completely funded may result in a negative fair value until it is called and funded.
The values assigned to investments are based upon available information and do not necessarily represent amounts which might ultimately be realized, since such amounts depend on future circumstances and cannot be reasonably determined until the individual positions are liquidated. Due to the inherent uncertainty of determining the fair value of investments that do not have a readily available market value, the fair value of our investments may fluctuate from period to period and the fluctuations could be material.
Operating and Regulatory Environment
As with other companies regulated by the 1940 Act, a BDC must adhere to certain regulatory requirements. The 1940 Act contains prohibitions and restrictions relating to investments by a BDC in another investment company, as well as transactions between BDCs and their affiliates, principal underwriters and affiliates of those affiliates or underwriters. A BDC must be organized and have its principal place of business in the United States, it must be operated for the purpose of investing in or lending to primarily private or thinly traded companies and it must make significant managerial assistance available to those companies whose securities are considered Qualifying Assets (as defined below) for the BDC. A BDC may use capital provided by public stockholders and from other sources to make long-term, private investments in businesses. A BDC provides stockholders the ability to retain the liquidity of a publicly traded stock while sharing in the possible benefits, if any, of investing in primarily privately owned companies.
We have a board of directors. A majority of our board of directors must be persons who are not "interested persons" of the Company, as that term is defined in Section 2(a)(19) of the 1940 Act (the "independent directors"). As a BDC, we are prohibited from indemnifying any director or officer against any liability to us or our stockholders arising from willful misfeasance, bad faith, gross negligence or reckless disregard of the duties involved in the conduct of such person's office. Additionally, to provide additional shareholder protection we are required to provide and maintain a bond issued by a reputable fidelity insurance company to protect the BDC.
As a BDC, we are required to meet a coverage ratio of the value of total assets to total senior securities, which include all of our borrowings, excluding SBA-guaranteed debentures, and any preferred stock we may issue in the future, of at least 150.0% (which means we can borrow $2 for every $1 of our equity). We monitor our compliance with this coverage ratio on a regular basis.
We may, to the extent permitted under the 1940 Act, issue additional equity or debt capital. We will generally not be able to issue and sell our common stock at a price below net asset value per share without shareholder approval. We may, however, sell our common stock, or warrants, options or rights to acquire our common stock, at a price below the then-current net asset value of our common stock if our board of directors determines that such sale is in our best interests and the best interests of our stockholders, and our stockholders approve such sale. In addition, we may generally issue new shares of our common stock at a price below net asset value in rights offerings to existing stockholders, in payment of dividends and in certain other limited circumstances.
As a BDC, we will not generally be permitted to invest in any portfolio company in which the Investment Adviser or any of its affiliates currently have an investment or to make any co-investments with the Investment Adviser or its affiliates without an exemptive order from the SEC. On October 8, 2019, the SEC issued an exemptive order (the “Exemptive Order”), which superseded a prior order issued on December 18, 2017, which permits us to co-invest in portfolio companies with certain funds or entities managed by the Investment Adviser or its affiliates in certain negotiated transactions where co-investing would otherwise be prohibited under the 1940 Act, subject to the conditions of the Exemptive Order. Pursuant to the Exemptive Order, we are permitted to co-invest with our affiliates if a “required majority” (as defined in Section 57(o) of the 1940 Act) of our independent directors make certain conclusions in connection with a co-investment transaction, including, but not limited to, that (1) the terms of the potential co-investment transaction, including the consideration to be paid, are reasonable and fair to us and our stockholders and do not involve overreaching of us or our stockholders on the part of any person concerned, and (2) the potential co-investment transaction is consistent with the interests of our stockholders and is consistent with our then-current investment objective and strategies. The Exemptive Order was amended on August 30, 2022 to permit us to complete follow-on investments in our existing portfolio companies with certain affiliates that are private funds if such private funds do not hold an investment in such existing portfolio company, subject to certain conditions.
We may not change the nature of our business so as to cease to be, or withdraw our election as, a BDC unless authorized by vote of a majority of the outstanding voting securities, as required by the 1940 Act. A majority of the outstanding voting securities of a company is defined under the 1940 Act as the lesser of: (a) 67.0% or more of such company's voting securities present at a meeting if more than 50.0% of the outstanding voting securities of such company are present or
represented by proxy, or (b) more than 50.0% of the outstanding voting securities of such company. We do not anticipate any substantial change in the nature of our business.
In addition, as a BDC, we are not permitted to issue stock in consideration for services.
Taxation as a Regulated Investment Company
We have elected to be treated, and intend to comply with the requirements to continue to qualify annually, as a RIC under Subchapter M of the Code. As a RIC, we generally will not be subject to U.S. federal income taxes on any net ordinary income or capital gains that we timely distribute to our stockholders as distributions. Rather, distributions paid by us generally will be taxable to our stockholders, and any net operating losses, foreign tax credits and other tax attributes of ours generally will not pass through to our stockholders, subject to special rules for certain items such as net capital gains and qualified dividend income recognized by us.
To qualify as a RIC, we must, among other things, meet certain source-of-income and asset diversification requirements. In addition, to qualify for tax treatment as a RIC, we must timely distribute to our stockholders, for each taxable year, at least 90.0% of our "investment company taxable income", which is generally our net ordinary income plus the excess of realized net short-term capital gains over realized net long-term capital losses (the "Annual Distribution Requirement").
We will be subject to a 4.0% nondeductible U.S. federal excise tax on certain undistributed income unless we distribute in a timely manner an amount at least equal to the sum of (1) 98.0% of our net ordinary income for each calendar year, (2) 98.2% of our capital gain net income for the one-year period ending October 31 in that calendar year and (3) any ordinary income and capital gain net income that we recognized for the preceding years, but were not distributed during such years, and on which we did not pay U.S. federal income tax (the "Excise Tax Avoidance Requirement"). While we intend to make distributions to our stockholders in each taxable year that will be sufficient to avoid any U.S. federal excise tax on our earnings, there can be no assurance that we will be successful in entirely avoiding this tax.
In order to qualify as a RIC for U.S. federal income tax purposes, we must, among other things:
•continue to qualify as a BDC under the 1940 Act at all times during each taxable year;
•derive in each taxable year at least 90.0% of our gross income from dividends, interest, payments with respect to loans of certain securities, gains from the sale of stock or other securities or foreign currencies, net income from certain "qualified publicly traded partnerships", or other income derived with respect to our business of investing in such stock or securities (the "90.0% Income Test"); and
•diversify our holdings so that at the end of each quarter of the taxable year:
•at least 50.0% of the value of our assets consists of cash, cash equivalents, U.S. government securities, securities of other RICs, and other securities if such other securities of any one issuer do not represent more than 5.0% of the value of our assets or more than 10.0% of the outstanding voting securities of the issuer; and
•no more than 25.0% of the value of our assets is invested in (1) the securities, other than U.S. government securities or securities of other RICs, of one issuer, (2) the securities, other than securities of other RICs, of two or more issuers that are controlled, as determined under applicable Code rules, by us and that are engaged in the same or similar or related trades, or (3) the securities of certain "qualified publicly traded partnerships" (the "Diversification Tests").
A RIC is limited in its ability to deduct expenses in excess of its "investment company taxable income" (which is, generally, ordinary income plus the excess of realized net short-term capital gains over realized net long-term capital losses). If our expenses in a given year exceed our investment company taxable income, we would experience a net operating loss for that year. However, a RIC is not permitted to carry forward net operating losses to subsequent years and such net operating losses do not pass through to its stockholders. In addition, expenses can be used only to offset investment company taxable income, not net capital gain. A RIC may not use any net capital losses (that is, realized capital losses in excess of realized capital gains) to offset the RIC's investment company taxable income, but may carry forward such losses, and use them to offset capital gains, indefinitely. Due to these limits on the deductibility of expenses and net capital losses, we may for U.S. federal income tax purposes have aggregate taxable income for several years that we are required to distribute and that is taxable to our stockholders even if such income is greater than the aggregate net income we actually earned during those years.
Failure to Qualify as a Regulated Investment Company
If we fail to satisfy the 90.0% Income Test or the Diversification Tests for any taxable year or quarter of such taxable year, we may nevertheless continue to qualify as a RIC for such year if certain relief provisions of the Code apply (which may,
among other things, require us to pay certain U.S. federal income tax at corporate rates or to dispose of certain assets). If we fail to qualify for treatment as a RIC and such relief provisions do not apply to us, we will be subject to U.S. federal income tax on all of our taxable income at regular corporate rates (and also will be subject to any applicable state and local taxes), regardless of whether we make any distributions to our stockholders. Distributions would not be required. However, if distributions were made, any such distributions would be taxable to our stockholders as ordinary dividend income and, subject to certain limitations under the Code, may qualify as "qualified dividends" that are subject to U.S. federal income tax at a rate of 20.0%. Subject to certain limitations under the Code, corporate distributees may be eligible for the dividends-received deduction. Distributions in excess of our current and accumulated earnings and profits would be treated first as a return of capital to the extent of the stockholder's adjusted tax basis, and any remaining distributions would be treated as a capital gain.
Subject to a limited exception applicable to RICs that qualified as such under Subchapter M of the Code for at least one year prior to disqualification and that requalify as a RIC no later than the second year following the non-qualifying year, we could be subject to tax on any unrealized net built-in gains in the assets held by us during the period in which we failed to qualify as a RIC that are recognized during the five-year period after our requalification as a RIC, unless we made a special election to pay U.S. federal income tax at corporate rates on such built-in gain at the time of our requalification as a RIC. We may decide to be taxed as a regular corporation even if we would otherwise qualify as a RIC if we determine that treatment as a corporation for a particular year would be in our best interests.
SBA Regulation
On August 1, 2014 and August 25, 2017, SBIC I and SBIC II, our wholly owned subsidiaries, received licenses from the SBA to operate as SBICs under Section 301(c) of the 1958 Act, respectively. SBIC I and SBIC II have an investment strategy and philosophy substantially similar to ours and make similar types of investments in accordance with SBA regulations.
These SBIC licenses allow each of SBIC I and SBIC II to incur leverage by issuing SBA-guaranteed debentures, subject to the issuance of a capital commitment and other customary procedures. SBA-guaranteed debentures carry long-term fixed rates that are generally lower than rates on comparable bank and other debt. In June 2018, the limit of SBA leverage available to an individual SBIC eligible for two tiers of leverage was increased from $150.0 million with at least $75.0 million in regulatory capital to $175.0 million with at least $87.5 million in regulatory capital, subject to SBA approval. The maximum leverage available to a group of SBICs under common control is $350.0 million. Currently, SBIC I and SBIC II operate under the prior $150.0 million leverage limit. SBA-guaranteed debentures are non-recourse, have a maturity of ten years, require semi-annual payments of interest and do not require any principal payments prior to maturity. SBIC I and SBIC II are subject to regulation and oversight by the SBA, including requirements with respect to reporting financial information, such as the extent of capital impairment, if applicable, on a regular basis. The SBA, as a creditor, will have a superior claim to SBIC I's and SBIC II's assets over our stockholders in the event that SBIC I and SBIC II are liquidated or the SBA exercises its remedies under the SBA-guaranteed debentures issued by SBIC I and SBIC II upon an event of default.
On November 5, 2014, we received exemptive relief from the SEC to permit us to exclude the SBA-guaranteed debentures of SBIC I, SBIC II and any other future SBIC subsidiaries from our 150.0% asset coverage test under the 1940 Act. As such, our ratio of total consolidated assets to outstanding indebtedness may be less than 150.0%. This provides us with increased investment flexibility but also increases our risks related to leverage.
SBICs are designed to stimulate the flow of private investor capital to eligible "small businesses" as defined by the SBA. Under SBA regulations, SBICs may make loans to eligible small businesses, invest in the equity securities of such businesses and provide them with consulting and advisory services. Under present SBA regulations, eligible small businesses generally include businesses that (together with their affiliates) have a tangible net worth not exceeding $24.0 million and have average annual net income after U.S. federal income taxes not exceeding $8.0 million (average net income to be computed without benefit of any carryover loss) for the two most recent fiscal years. In addition, an SBIC must invest 25.0% of its investment capital to "smaller enterprises" as defined by the SBA. Smaller enterprises generally include businesses that (together with their affiliates) have a tangible net worth not exceeding $6.0 million for the most recent fiscal year and have average net income after U.S. federal income taxes not exceeding $2.0 million (average net income to be computed without benefit of any net carryover loss) for the two most recent fiscal years. SBA regulations also provide alternative industry size standard criteria to determine eligibility for designation as an eligible small business or smaller enterprise, which criteria depend on the primary industry in which the business is engaged and is based on the number of employees or gross revenue of the business and its affiliates. However, once an SBIC has invested in an eligible small business, it may continue to make follow-on investments in the company, regardless of the size of the company at the time of the follow-on investment, up to the time of the company's initial public offering, if any.
The SBA generally prohibits an SBIC from providing financing to small businesses with certain characteristics, such as relending businesses or businesses with the majority of their employees located outside the United States, and businesses
engaged in certain prohibited industries, such as project finance, real estate, farmland, financial intermediaries or "passive" (i.e. non-operating) businesses. Without prior SBA approval, an SBIC may not provide financing or a commitment to a small business in an amount equal to more than approximately 30.0% of the SBIC's regulatory capital in any one company and its affiliates.
The SBA places certain limitations on the financing terms of investments by SBICs in portfolio companies (such as limiting the permissible interest rate on debt securities held by an SBIC in a portfolio company). An SBIC may exercise control over a small business for a period of up to seven years from the date on which the SBIC initially acquires its control position. This control period may be extended for an additional period of time with the SBA's prior written approval.
The SBA restricts the ability of an SBIC to provide financing to an "associate" as defined in the SBA regulations, without prior written approval from the SBA. The SBA also prohibits, without prior SBA approval, a "change of control" of an SBIC or transfers that would result in any person (or a group of persons acting in concert) owning 10.0% or more of a class of capital stock of a licensed SBIC. A "change of control" is any event which would result in the transfer of the power, direct or indirect, to direct the management and policies of an SBIC, whether through ownership, contractual arrangements or otherwise.
The SBA regulations require, among other things, a periodic examination of a licensed SBIC by an SBA examiner to determine the SBIC's compliance with the relevant SBA regulations, and the performance of a financial audit by an independent auditor.
Summary Risk Factors
The risk factors described below are a summary of the principal risk factors associated with an investment in us. These are not the only risks we face. You should carefully consider these risk factors, together with the risk factors set forth in Item 1A in this Annual Report on Form 10-K and the other reports and documents filed by us with the SEC.
Risks Relating to Our Business and Structure
•We are currently operating in a period of capital markets disruption and economic uncertainty.
•Adverse developments in the credit markets may impair our ability to secure debt financing.
•We may suffer credit losses.
•There is uncertainty as to the value of our portfolio investments because most of our investments are, and may continue to be in private companies and recorded at fair value. In addition, the fair values of our investments are determined by our board of directors in accordance with our valuation policy.
•Our ability to achieve our investment objective depends on key investment personnel of the Investment Adviser. If the Investment Adviser were to lose any of its key investment personnel, our ability to achieve our investment objective could be significantly harmed.
•The 1940 Act and the Code impose numerous constraints on the operations of BDCs and RICs, which could adversely affect our business.
•We operate in a highly competitive market for investment opportunities and may not be able to compete effectively.
•Our business, results of operations and financial condition depend on our ability to manage future growth effectively.
•The management fee and incentive fee may induce the Investment Adviser to make speculative investments.
•We may be obligated to pay the Investment Adviser incentive compensation even if we incur a loss.
•The incentive fee we pay to the Investment Adviser with respect to capital gains may be effectively greater than 20.0%.
•We borrow money, which could magnify the potential for gain or loss on amounts invested in us and increase the risk of investing in us.
•If we are unable to comply with the covenants or restrictions in our borrowings, our business could be materially adversely affected.
•The terms of our credit facilities may contractually limit our ability to incur additional indebtedness.
•If we are unable to obtain additional debt financing, or if our borrowing capacity is materially reduced, our business could be materially adversely affected.
•A renewed disruption in the capital markets and the credit markets could adversely affect our business.
•SBIC I and SBIC II are licensed by the SBA and are subject to SBA regulations.
Risks Related to Our Operations
•Because we intend to distribute substantially all of our income to our stockholders to maintain our status as a RIC, we will continue to need additional capital to finance our growth. If additional funds are unavailable or not available on favorable terms, our ability to grow may be impaired.
•SBIC I and SBIC II may be unable to make distributions to us that will enable us to meet or maintain our RIC tax treatment.
•Our ability to enter into transactions with our affiliates is restricted.
•The Investment Adviser has significant potential conflicts of interest with us and, consequently, your interests as stockholders which could adversely impact our investment returns.
•The valuation process for certain of our portfolio holdings creates a conflict of interest.
•Conflicts of interest may exist related to other arrangements with the Investment Adviser or its affiliates.
•The Investment Management Agreement with the Investment Adviser and the Administration Agreement with the Administrator were not negotiated on an arm’s length basis.
•The Investment Adviser’s liability is limited under the Investment Management Agreement, and we have agreed to indemnify the Investment Adviser against certain liabilities, which may lead the Investment Adviser to act in a riskier manner than it would when acting for its own account.
•If we fail to maintain our status as a BDC, our business and operating flexibility could be significantly reduced.
•If we do not invest a sufficient portion of our assets in qualifying assets, we could be precluded from investing in certain assets or could be required to dispose of certain assets, which could have a material adverse effect on our business, financial condition and results of operations.
•Regulations governing the operations of BDCs will affect our ability to raise additional equity capital as well as our ability to issue senior securities or borrow for investment purposes, any or all of which could have a negative effect on our investment objectives and strategies.
•Our business model in the future may depend to an extent upon our referral relationships with private equity sponsors, and the inability of the investment professionals of the Investment Adviser to maintain or develop these relationships, or the failure of these relationships to generate investment opportunities, could adversely affect our business strategy.
•Our board of directors may change our investment objective, operating policies and strategies without prior notice or stockholder approval, the effects of which may be adverse to your interests as stockholders.
•We will be subject to U.S. federal income tax at corporate rates on all of our income if we are unable to maintain tax treatment as a RIC under Subchapter M of the Code, which would have a material adverse effect on our financial performance.
•You may have current tax liabilities on distributions you reinvest in our common stock.
•We may not be able to pay you distributions on our common stock, our distributions to you may not grow over time and a portion of our distributions to you may be a return of capital for U.S. federal income tax purposes.
•We may have difficulty paying our required distributions if we recognize taxable income before or without receiving cash representing such income.
•The Small Business Credit Availability Act allows us to incur additional leverage, which could increase the risk of investing in our securities.
•Internal and external cyber threats, as well as other disasters, could impair our ability to conduct business effectively.
Risks Relating to Our Investments
•Our investments in portfolio companies may be risky, and we could lose all or part of any of our investments.
•Our investment strategy, which is focused primarily on privately held companies, presents certain challenges, including the lack of available information about these companies.
•Our investments in securities rated below investment grade are speculative in nature and are subject to additional risk factors such as increased possibility of default, illiquidity of the security, and changes in value based on changes in interest rates.
•Our portfolio may be concentrated in a limited number of industries, which may subject us to a risk of significant loss if there is a downturn in a particular industry in which a number of our investments are concentrated.
•Defaults by our portfolio companies may harm our operating results.
•The lack of liquidity in our investments may adversely affect our business.
•If we are unable to make follow-on investments in our portfolio companies, the value of our investment portfolio could be adversely affected.
•Second priority liens on collateral securing loans that we make to our portfolio companies may be subject to control by senior creditors with first priority liens. If there is a default, the value of the collateral may not be sufficient to repay in full both the first priority creditors and us.
•A number of our portfolio companies provide services to the U.S. government. Changes in the U.S. government’s priorities and spending, or significant delays or reductions in appropriations of the U.S. government’s funds, could have a material adverse effect on the financial position, results of operations and cash flows of such portfolio companies.
•Prepayments of our debt investments by our portfolio companies could adversely impact our results of operations and reduce our return on equity.
•We may not realize gains from our equity investments.
•Our performance may differ from our historical performance as our current investment strategy includes significantly more primary originations in addition to secondary market purchases.
•The alternative reference rates that have replaced LIBOR in our credit agreements and other financial instruments may not yield the same or similar economic results as LIBOR over the life of such transactions.
Risks Relating to Our Securities
•Investing in our common stock may involve an above average degree of risk.
•Sales of substantial amounts of our common stock in the public market may have an adverse effect on the market price of our common stock.
•Shares of our common stock have traded at a discount from net asset value and may do so in the future.
•You may not receive distributions or our distributions may decline or may not grow over time.
Investment Management Agreement
We are a closed-end, non-diversified management investment company that has elected to be regulated as a BDC under the 1940 Act. We are externally managed by our Investment Adviser and pay our Investment Adviser a fee for its services. The following summarizes our arrangements with the Investment Adviser pursuant to an investment advisory and management agreement (the "Investment Management Agreement").
Management Services
The Investment Adviser is registered as an investment adviser under the Investment Advisers Act of 1940, as amended (the "Advisers Act"). The Investment Adviser serves as our investment adviser pursuant to the Investment Management Agreement in accordance with the 1940 Act. Subject to the overall supervision of our board of directors, the Investment Adviser manages our day-to-day operations and provides us with investment advisory and management services. Under the terms of the Investment Management Agreement, the Investment Adviser:
•determines the composition of our portfolio, the nature and timing of the changes to our portfolio and the manner of implementing such changes;
•determines the securities and other assets that we will purchase, retain or sell;
•identifies, evaluates and negotiates the structure of our investments that we make;
•executes, monitors and services the investments that we make;
•performs due diligence on prospective portfolio companies;
•votes, exercises consents and exercises all other rights appertaining to such securities and other assets on our behalf; and
•provides us with such other investment advisory, research and related services as we may, from time to time, reasonably require.
The Investment Adviser's services under the Investment Management Agreement are not exclusive, and the Investment Adviser (so long as its services to us are not impaired) and/or other entities affiliated with New Mountain Capital are permitted to furnish similar services to other entities. The Investment Adviser also manages other funds that may have investment mandates that are similar, in whole or in part, to ours.
Management Fees
Pursuant to the Investment Management Agreement, we have agreed to pay the Investment Adviser a fee for investment advisory and management services consisting of two components—a base management fee and an incentive fee. The cost of both the base management fee payable to the Investment Adviser and any incentive fees paid in cash to the Investment Adviser are borne by us and, as a result, are indirectly borne by our common stockholders.
Base Management Fees
Pursuant to Amendment No. 1 to the Investment Management Agreement dated November 1, 2021 ("Amendment No. 1"), the base management fee is calculated at an annual rate of 1.4% of our gross assets, which equals our total assets on the Consolidated Statements of Assets and Liabilities, less cash and cash equivalents. Prior to Amendment No. 1, pursuant to the Investment Management Agreement, the base management fee was calculated at an annual rate of 1.75% of our gross assets, which equaled our total assets on the Consolidated Statements of Assets and Liabilities, less (i) the borrowings under the New Mountain Finance SPV Funding, L.L.C. Loan and Security Agreement, as amended and restated, dated October 27, 2010 (the "SLF Credit Facility") and (ii) cash and cash equivalents. The base management fee is payable quarterly in arrears, and is calculated based on the average value of our gross assets, which equals our total assets, as determined in accordance with GAAP, less cash and cash equivalents at the end of each of the two most recently completed calendar quarters, and appropriately adjusted on a pro rata basis for any equity capital raises or repurchases during the current calendar quarter. We have not invested, and currently are not invested, in derivatives. To the extent we invest in derivatives in the future, we will use the actual value of the derivatives, as reported on the Consolidated Statements of Assets and Liabilities, for purposes of calculating the base management fee.
Effective as of and for the quarter ended March 31, 2021 through the quarter ending December 31, 2024, the Investment Adviser has entered into a fee waiver agreement (the "Fee Waiver Agreement"), amended on August 7, 2023, pursuant to which the Investment Adviser will waive base management fees in order to reach a target base management fee of 1.25% on gross assets (the “Reduced Base Management Fee”). The Fee Waiver Agreement was most recently extended for a period of one year through the quarter ending December 31, 2024 by the Investment Adviser on August 7, 2023. The Investment Adviser cannot recoup management fees that the Investment Adviser has previously waived. For the year ended December 31, 2023, total management fees waived were approximately $4.1 million.
Incentive Fees
The incentive fee consists of two parts. The first part is calculated and payable quarterly in arrears and equals 20.0% of our "Pre-Incentive Fee Net Investment Income" for the immediately preceding quarter, subject to a "preferred return", or "hurdle", and a "catch-up" feature. "Pre-Incentive Fee Net Investment Income" means interest income, dividend income and any other income (including any other fees (other than fees for providing managerial assistance), such as commitment, origination, structuring, upfront, diligence and consulting fees or other fees that we receive from portfolio companies) accrued during the calendar quarter, minus our operating expenses for the quarter (including the base management fee, expenses payable under the administration agreement, as amended and restated (the "Administration Agreement"), with the Administrator, and any interest expense and distributions paid on any issued and outstanding preferred stock (of which there is none as of December 31, 2023), but excluding the incentive fee). Pre-Incentive Fee Net Investment Income includes, in the case of investments with a deferred interest feature (such as original issue discount, debt instruments with PIK interest and zero coupon securities), accrued income that we have not yet received in cash. Pre-Incentive Fee Net Investment Income does not include any realized capital gains, realized capital losses or unrealized capital appreciation or depreciation.
Pre-Incentive Fee Net Investment Income, expressed as a rate of return on the value of our net assets at the end of the immediately preceding calendar quarter, will be compared to a "hurdle rate" of 2.0% per quarter (8.0% annualized), subject to a "catch-up" provision measured as of the end of each calendar quarter. The hurdle rate is appropriately pro-rated for any partial periods. The calculation of our incentive fee with respect to the Pre-Incentive Fee Net Investment Income for each quarter is as follows:
•No incentive fee is payable to the Investment Adviser in any calendar quarter in which our Pre-Incentive Fee Net Investment Income does not exceed the hurdle rate of 2.0% (the "preferred return" or "hurdle").
•100.0% of our Pre-Incentive Fee Net Investment Income with respect to that portion of such Pre-Incentive Fee Net Investment Income, if any, that exceeds the hurdle rate but is less than or equal to 2.5% in any calendar quarter (10.0% annualized) is payable to the Investment Adviser. This portion of our Pre-Incentive Fee Net Investment Income (which exceeds the hurdle rate but is less than or equal to 2.5%) is referred to as the "catch-up". The catch-up provision is intended to provide the Investment Adviser with an incentive fee of 20.0% on all of our Pre-Incentive Fee Net Investment Income as if a hurdle rate did not apply when our Pre-Incentive Fee Net Investment Income exceeds 2.5% in any calendar quarter.
•20.0% of the amount of our Pre-Incentive Fee Net Investment Income, if any, that exceeds 2.5% in any calendar quarter (10.0% annualized) is payable to the Investment Adviser once the hurdle is reached and the catch-up is achieved.
For the year ended December 31, 2023, no incentive fees were waived. The Investment Adviser cannot recoup incentive fees that the Investment Adviser has previously waived.
The second part of the incentive fee will be determined and payable in arrears as of the end of each calendar year (or upon termination of the Investment Management Agreement) and will equal 20.0% of our realized capital gains, if any, on a cumulative basis from inception through the end of each calendar year, computed net of all realized capital losses and unrealized capital depreciation on a cumulative basis, less the aggregate amount of any previously paid capital gain incentive fee.
In accordance with GAAP, we accrue a hypothetical capital gains incentive fee based upon the cumulative net realized capital gains and realized capital losses and the cumulative net unrealized capital appreciation and unrealized capital depreciation on investments held at the end of each period. Actual amounts paid to the Investment Adviser are consistent with the Investment Management Agreement and are based only on actual realized capital gains computed net of all realized capital losses and unrealized capital depreciation on a cumulative basis from inception through the end of each calendar year as if the entire portfolio was sold at fair value.
Example 1: Income Related Portion of Incentive Fee for Each Calendar Quarter:
Alternative 1
Assumptions
Investment income (including interest, dividends, fees, etc.) = 1.25%
Hurdle rate(1) = 2.00%
Management fee(2) = 0.35%
Other expenses (legal, accounting, safekeeping agent, transfer agent, etc.)(3) = 0.20%
Pre-Incentive Fee Net Investment Income
(investment income – (management fee + other expenses)) = 0.70%
Pre-Incentive Fee Net Investment Income does not exceed the hurdle rate, therefore there is no income related incentive fee.
Alternative 2
Assumptions
Investment income (including interest, dividends, fees, etc.) = 2.90%
Hurdle rate(1) = 2.00%
Management fee(2) = 0.35%
Other expenses (legal, accounting, safekeeping agent, transfer agent, etc.)(3) = 0.20%
Pre-Incentive Fee Net Investment Income
(investment income – (management fee + other expenses)) = 2.35%
Incentive fee = 100.00% × Pre-Incentive Fee Net Investment Income (subject to "catch-up")(4)
= 100.00% × (2.35% – 2.00%)
= 0.35%
Pre-Incentive Fee Net Investment Income exceeds the hurdle rate, but does not fully satisfy the "catch-up" provision, therefore the income related portion of the incentive fee is 0.35%.
Alternative 3
Assumptions
Investment income (including interest, dividends, fees, etc.) = 3.50%
Hurdle rate(1) = 2.00%
Management fee(2) = 0.35%
Other expenses (legal, accounting, safekeeping agent, transfer agent, etc.)(3) = 0.20%
Pre-Incentive Fee Net Investment Income
(investment income – (management fee + other expenses)) = 2.95%
Incentive fee = 100.00% × Pre-Incentive Fee Net Investment Income (subject to "catch-up")(4)
Incentive fee = 100.00% × "catch-up" + (20.00% × (Pre-Incentive Fee Net Investment Income 2.50%))
Catch-up = 2.50% – 2.00%
= 0.50%
Incentive fee = (100.00% × 0.50%) + (20.00% × (2.95% – 2.50%))
= 0.50% + (20.00% × 0.45%)
= 0.50% + 0.09%
= 0.59%
Pre-Incentive Fee Net Investment Income exceeds the hurdle rate, and fully satisfies the "catch-up" provision, therefore the income related portion of the incentive fee is 0.59%
(1)Represents 8.00% annualized hurdle rate.
(2)Assumes 1.4% annualized base management fee.
(3)Excludes organizational and offering expenses.
(4)The "catch-up" provision is intended to provide the Investment Adviser with an incentive fee of 20.00% on all Pre-Incentive Fee Net Investment Income as if a hurdle rate did not apply when our net investment income exceeds 2.50% in any calendar quarter.
Example 2: Capital Gains Portion of Incentive Fee:
Alternative 1:
Assumptions
Year 1: $20.0 million investment made in Company A ("Investment A"), and $30.0 million investment made in Company B ("Investment B")
Year 2: Investment A sold for $50.0 million and fair market value ("FMV") of Investment B determined to be $32.0 million
Year 3: FMV of Investment B determined to be $25.0 million
Year 4: Investment B sold for $31.0 million
The capital gains portion of the incentive fee would be:
Year 1: None
Year 2: Capital gains incentive fee of $6.0 million—($30.0 million realized capital gains on sale of Investment A multiplied by 20.0%)
Year 3: None—$5.0 million (20.0% multiplied by ($30.0 million cumulative capital gains less $5.0 million cumulative capital depreciation)) less $6.0 million (previous capital gains fee paid in Year 2)
Year 4: Capital gains incentive fee of $0.2 million—$6.2 million ($31.0 million cumulative realized capital gains multiplied by 20.0%) less $6.0 million (capital gains incentive fee taken in Year 2)
Alternative 2
Assumptions
Year 1: $20.0 million investment made in Company A ("Investment A"), $30.0 million investment made in Company B ("Investment B") and $25.0 million investment made in Company C ("Investment C")
Year 2: Investment A sold for $50.0 million, FMV of Investment B determined to be $25.0 million and FMV of Investment C determined to be $25.0 million
Year 3: FMV of Investment B determined to be $27.0 million and Investment C sold for $30.0 million
Year 4: FMV of Investment B determined to be $35.0 million
Year 5: Investment B sold for $20.0 million
The capital gains incentive fee, if any, would be:
Year 1: None
Year 2: $5.0 million capital gains incentive fee—20.0% multiplied by $25.0 million ($30.0 million realized capital gains on Investment A less $5.0 million unrealized capital depreciation on Investment B)
Year 3: $1.4 million capital gains incentive fee—$6.4 million (20.0% multiplied by $32.0 million ($35.0 million cumulative realized capital gains less $3.0 million unrealized capital depreciation)) less $5.0 million capital gains incentive fee received in Year 2
Year 4: $0.6 million capital gains incentive fee—$7.0 million (20.0% multiplied by $35.0 million cumulative realized capital gains) less cumulative $6.4 million capital gains incentive fee received in Year 2 and Year 3
Year 5: None—$5.0 million (20.0% multiplied by $25.0 million (cumulative realized capital gains of $35.0 million less realized capital losses of $10.0 million)) less $7.0 million cumulative capital gains incentive fee paid in Year 2, Year 3 and Year 4(1)
(1)As noted above, it is possible that the cumulative aggregate capital gains fee received by the Investment Adviser ($7.0 million) is effectively greater than $5.0 million (20.0% of cumulative aggregate realized capital gains less net realized capital losses or net unrealized depreciation ($25.0 million)).
Payment of Expenses
Our primary operating expenses are interest payable on our debt, the payment of a base management fee and any incentive fees under the Investment Management Agreement and the allocable portion of overhead and other expenses incurred by the Administrator in performing its obligations to us under the Administration Agreement. We bear all other expenses of our operations and transactions, including (without limitation) fees and expenses relating to:
•organizational and offering expenses;
•the investigation and monitoring of our investments;
•the cost of calculating net asset value;
•interest payable on debt, if any, to finance our investments;
•the cost of effecting sales and repurchases of shares of our common stock and other securities;
•management and incentive fees payable pursuant to the Investment Management Agreement;
•fees payable to third parties relating to, or associated with, making investments and valuing investments (including third-party valuation firms);
•transfer agent and custodial fees;
•fees and expenses associated with marketing efforts (including attendance at investment conferences and similar events);
•federal and state registration fees;
•any exchange listing fees;
•federal, state, local and foreign taxes;
•independent directors' fees and expenses;
•brokerage commissions;
•costs of proxy statements, stockholders' reports and notices;
•costs of preparing government filings, including periodic and current reports with the SEC;
•fees and expenses associated with independent audits and outside legal costs;
•costs associated with reporting and compliance obligations under the 1940 Act and applicable federal and state securities laws;
•fidelity bond, liability insurance and other insurance premiums; and
•printing, mailing and all other direct expenses incurred by either the Investment Adviser or us in connection with administering our business, including payments under the Administration Agreement that are based upon our allocable portion of overhead and other expenses incurred by the Administrator in performing its obligations to us under the Administration Agreement, including the allocable portion of the compensation of our chief financial officer and chief compliance officer and their respective staffs.
Board Consideration of the Investment Management Agreement
Our board of directors initially approved our Investment Management Agreement between the Company and the Adviser on March 25, 2014. Thereafter, our stockholders approved the Investment Management Agreement on May 6, 2014. The Investment Management Agreement first became effective on May 8, 2014. Our board of directors determined at a virtual meeting held on November 1, 2021 to approve Amendment No. 1 to the Investment Management Agreement, the sole purpose of which was to reduce the base management fee. On January 30, 2024, our board of directors held a board meeting to consider the re-approval of our Investment Management Agreement. In its consideration of the re-approval of the Investment Management Agreement, our board of directors focused on information they had received relating to, among other things:
•the nature, extent and quality of advisory and other services provided by the Investment Adviser, including information about our investment performance relative to our stated objectives and in comparison to our performance peer group and relevant market indices, and concluded that such advisory and other services are satisfactory and our investment performance is reasonable;
•the experience and qualifications of the personnel providing such advisory and other services, including information about the backgrounds of the investment personnel, the allocation of responsibilities among such personnel and the process by which investment decisions are made, and concluded that the investment personnel of the Investment Adviser have extensive experience and are well qualified to provide advisory and other services to us;
•the current fee structure, the existence of any fee waivers, and our anticipated expense ratios in relation to those of other investment companies having comparable investment policies and limitations, and concluded that the current fee structure is reasonable;
•the advisory fees charged to us by the Investment Adviser and comparative data regarding the advisory fees charged by other investment advisers to BDCs with similar investment objectives, and concluded that the advisory fees charged to us by the Investment Adviser are reasonable;
•the direct and indirect costs, including for personnel and office facilities, that are incurred by the Investment Adviser and its affiliates in performing services for us and the basis of determining and allocating these costs, and concluded that the direct and indirect costs, including the allocation of such costs, are reasonable;
•the total of all assets managed by the Adviser, as well as total number of investment companies and other clients serviced by the Adviser and possible economies of scale arising from our size and/or anticipated growth, and the extent to which such economies of scale are reflected in the advisory fees charged to us by the Investment Adviser, and concluded that some economies of scale may be possible in the future;
•other possible benefits to the Investment Adviser and its affiliates arising from their relationships with us, and concluded that any such other benefits were not material to the Investment Adviser and its affiliates; and
•possible alternative fee structures or bases for determining fees and the possibility of obtaining similar services from other third party service providers, and concluded that our current fee structure and bases for determining fees are satisfactory.
Based on the information reviewed and the discussions detailed above, our board of directors, including a majority of the independent directors, concluded that the fees payable to the Investment Adviser pursuant to the Investment Management Agreement were reasonable, and comparable to the fees paid by other management investment companies with similar investment objectives, in relation to the services to be provided. As a result, our board of directors re-approved the Investment Management Agreement for a period of 12 months commencing on March 1, 2024. Our board of directors did not assign relative weights to the above factors or the other factors considered by it. Individual members of our board of directors may have given different weights to different factors.
Qualifying Assets
Under the 1940 Act, a BDC may not acquire any asset other than assets of the type listed in Section 55(a) of the 1940 Act, which are referred to as "qualifying assets", unless, at the time the acquisition is made, qualifying assets represent at least 70.0% of the BDC's total assets. The principal categories of qualifying assets relevant to our business are any of the following:
1)Securities purchased in transactions not involving any public offering from the issuer of such securities, which issuer (subject to certain limited exceptions) is an "eligible portfolio company", or from any person who is, or has been during the preceding 13 months, an affiliated person of an eligible portfolio company, or from any other person, subject to such rules as may be prescribed by the SEC. An eligible portfolio company is defined in the 1940 Act as any issuer which:
(a)is organized under the laws of, and has its principal place of business in, the United States;
(b)is not an investment company (other than an SBIC wholly-owned by the BDC) or a company that would be an investment company but for certain exclusions under the 1940 Act; and
(c)satisfies any of the following:
(i)does not have any class of securities that is traded on a national securities exchange;
(ii)has a class of securities listed on a national securities exchange, but has an aggregate market value of outstanding voting and non-voting common equity of less than $250.0 million;
(iii)is controlled by a BDC or a group of companies including a BDC and the BDC has an affiliated person who is a director of the eligible portfolio company; or
(iv)is a small and solvent company having total assets of not more than $4.0 million and capital and surplus of not less than $2.0 million.
2)Securities of any eligible portfolio company that the BDC controls.
3)Securities purchased in a private transaction from a U.S. issuer that is not an investment company or from an affiliated person of the issuer, or in transactions incident thereto, if the issuer is in bankruptcy and subject to reorganization or if the issuer, immediately prior to the purchase of its securities was unable to meet its obligations as they came prior to the purchase of its securities was unable to meet its obligations as they came due without material assistance other than conventional lending or financing arrangements.
4)Securities of an eligible portfolio company purchased from any person in a private transaction if there is no ready market for such securities and the BDC already owns 60.0% of the outstanding equity of the eligible portfolio company.
5)Securities received in exchange for or distributed on or with respect to securities described in (1) through (4) above, or pursuant to the exercise of warrants or rights relating to such securities.
6)Cash, cash equivalents, U.S. government securities or high-quality debt securities maturing in one year or less from the time of investment.
In addition, a BDC must have been organized and have its principal place of business in the United States and must be operated for the purpose of making investments in the types of securities described in (1), (2) or (3) above.
As of December 31, 2023, 14.8% of our total assets were non-qualifying assets.
Significant Managerial Assistance to Portfolio Companies
BDCs generally must offer to make available to the eligible issuers of its securities significant managerial assistance, except in circumstances where either (i) the BDC controls such issuer of securities or (ii) the BDC purchases such securities in conjunction with one or more other persons acting together and one of the other persons in the group makes available such managerial assistance. Making available managerial assistance means, among other things, any arrangement whereby the BDC offers to provide, and, if accepted, does so provide, significant guidance and counsel concerning the management, operations or business objectives and policies of a portfolio company. The Administrator or its affiliate provides such managerial assistance on our behalf to portfolio companies that accept our offer of managerial assistance.
Temporary Investments
Pending investments in other types of qualifying assets, our investments may consist of cash, cash equivalents, U.S. government securities or high-quality debt securities maturing in one year or less from the time of investment (collectively, as “temporary investments”), so that 70.0% of our assets are qualifying assets. Typically, we will invest in U.S. Treasury bills or in repurchase agreements, provided that such agreements are fully collateralized by cash or securities issued by the U.S. government or its agencies. We had no temporary investments as of December 31, 2023.
Repurchase Agreements
A repurchase agreement involves the purchase by an investor, such as us, of a specified security and the simultaneous agreement by the seller to repurchase it at an agreed-upon future date and at a price that is greater than the purchase price by an amount that reflects an agreed-upon interest rate. There is no percentage restriction on the proportion of our assets that may be invested in such repurchase agreements. However, if more than 25.0% of our total assets constitute repurchase agreements from a single counterparty, we would not meet the Diversification Tests in order to qualify as a RIC for U.S. federal income tax purposes. Thus, we do not intend to enter into repurchase agreements with a single counterparty in excess of this limit. The Investment Adviser will monitor the creditworthiness of the counterparties with which we enter into repurchase agreement transactions. We had no repurchase agreements as of December 31, 2023.
Senior Securities
We are permitted, under specified conditions, to issue multiple classes of debt if our asset coverage, as defined in the 1940 Act, is at least equal to 150.0% immediately after each such issuance (which means we can borrow $2 for every $1 of our equity). If our asset ratio coverage is not at least 150.0%, we would be unable to issue additional senior securities, and certain provisions of our senior securities may preclude us from making distributions to our stockholders. However, at December 31, 2023, none of our senior securities have provisions that may preclude us from making distributions to stockholders. We may also borrow amounts up to 5.0% of the value of our total assets for temporary or emergency purposes without regard to our asset coverage. We will include our assets and liabilities and all of our wholly-owned direct and indirect subsidiaries for purposes of calculating the asset coverage ratio. We received exemptive relief from the SEC on November 5, 2014, allowing us to modify the asset coverage requirement to exclude SBA-guaranteed debentures from this calculation. For a discussion of the risks associated with leverage, see Item 1A.—Risk Factors in this Annual Report on Form 10-K.
Code of Ethics
We have adopted a code of ethics pursuant to Rule 17j-1 under the 1940 Act that establishes procedures for personal investments and restricts certain personal securities transactions. Personnel subject to the code may invest in securities for their personal investment accounts, including securities that may be purchased or held by us, so long as such investments are made in accordance with the code’s requirements.
The code of ethics is available on our website at http://www.newmountainfinance.com.
Compliance Policies and Procedures
We and the Investment Adviser have adopted and implemented written policies and procedures reasonably designed to prevent violation of the federal securities laws and we are required to review these compliance policies and procedures annually for the adequacy and the effectiveness of their implementation. Our chief compliance officer is responsible for administering these policies and procedures.
Proxy Voting Policies and Procedures
We have delegated our proxy voting responsibility to the Investment Adviser. The proxy voting policies and procedures of the Investment Adviser are set forth below. The guidelines will be reviewed periodically by the Investment Adviser and our independent directors, and, accordingly, are subject to change.
Introduction
As an investment adviser registered under the Advisers Act, the Investment Adviser has a fiduciary duty to act solely in the best interests of its clients. As part of this duty, it recognizes that it must vote proxies relating to our securities in a timely manner free of conflicts of interest and in our best interests.
The policies and procedures for voting proxies for the investment advisory clients of the Investment Adviser are intended to comply with Section 206 of, and Rule 206(4)-6 under, the Advisers Act.
Proxy policies
The Investment Adviser will vote proxies relating to our securities in our best interest. It will review on a case-by-case basis each proposal submitted for a stockholder vote to determine its impact on the portfolio securities held by us. Although the Investment Adviser will generally vote against proposals that may have a negative impact on its clients’ portfolio securities, it may vote for such a proposal if there exists compelling long-term reasons to do so.
The proxy voting decisions of the Investment Adviser are made by the senior officers who are responsible for monitoring each of its clients’ investments. To ensure that its vote is not the product of a conflict of interest, it will require that: (a) anyone involved in the decision making process disclose to its chief compliance officer any potential conflict that he or she is aware of and any contact that he or she has had with any interested party regarding a proxy vote; and (b) employees involved in the decision making process or vote administration are prohibited from revealing how the Investment Adviser intends to vote on a proposal in order to reduce any attempted influence from interested parties.
Proxy voting records
You may obtain, without charge, information regarding how we voted proxies with respect to our portfolio securities by making a written request for proxy voting information to: Chief Compliance Officer, 1633 Broadway, 48th Floor, New York, New York 10019.
Staffing
We do not have any employees. Our day-to-day investment operations are managed by the Investment Adviser. See “—Investment Management Agreement”. We reimburse the Administrator for the allocable portion of overhead and other expenses incurred by it in performing its obligations to us under the Administration Agreement, including the compensation of our chief financial officer and chief compliance officer, and their respective staffs. For a more detailed discussion of the Administration Agreement, see Item 8.—Financial Statements and Supplementary Data—Note 5. Agreements in this Annual Report on Form 10-K.
Sarbanes-Oxley Act of 2002
The Sarbanes-Oxley Act of 2002 imposes a variety of regulatory requirements on publicly-held companies and their insiders. Many of these requirements affect us. For example:
•pursuant to Rule 13a-14 of the Exchange Act, our Chief Executive Officer and Chief Financial Officer are required to certify the accuracy of the financial statements contained in our periodic reports;
•pursuant to Item 307 of Regulation S-K, our periodic reports are required to disclose our conclusions about the effectiveness of our disclosure controls and procedures;
•pursuant to Rule 13a-15 of the Exchange Act, our management is required to prepare a report regarding their assessment of their internal control over financial reporting and is required to obtain an audit of the effectiveness of internal control over financial reporting performed by our independent registered public accounting firm; and
•pursuant to Item 308 of Regulation S-K and Rule 13a-15 of the Exchange Act, our periodic reports are required to disclose whether there were significant changes in our internal controls over financial reporting or in other factors that could significantly affect these controls subsequent to the date of the evaluation, including any corrective actions with regard to significant deficiencies and material weaknesses.
The Sarbanes-Oxley Act of 2002 requires us to review our current policies and procedures to determine whether we comply with the Sarbanes-Oxley Act of 2002 and the regulations promulgated thereunder. We intend to monitor our compliance with all regulations that are adopted under the Sarbanes-Oxley Act of 2002 and will take actions necessary to ensure that we are in compliance therewith.
Available Information
We file or submit to the SEC annual, quarterly and current periodic reports, proxy statements and other information as required by the 1940 Act. The SEC maintains a website that contains reports, proxy and information statements and other information filed electronically by us with the SEC at http://www.sec.gov.
We make available free of charge on our website, http://www.newmountainfinance.com, our reports, proxies and information statements and other information as soon as reasonably practicable after we electronically file such materials with,
or furnish to, the SEC. Information contained on our website or on the SEC's website about us is not incorporated into this annual report and should not be considered to be a part of this annual report.
Privacy Notice
Your privacy is very important to us. This Privacy Notice sets forth our policies with respect to non-public personal information about our stockholders and prospective and former stockholders. These policies apply to our stockholders and may be changed at any time, provided a notice of such change is given to you. This notice supersedes any other privacy notice you may have received from us.
We will safeguard, according to strict standards of security and confidentiality, all information we receive about you. The only information we collect from you is your name, address, number of shares you hold and your social security number. This information is used only so that we can send you annual reports and other information about us, and send you proxy statements or other information required by law.
We do not share this information with any non-affiliated third party except as described below.
•Authorized Employees of our Investment Adviser. It is our policy that only authorized employees of our investment adviser who need to know your personal information will have access to it.
•Service Providers. We may disclose your personal information to companies that provide services on our behalf, such as recordkeeping, processing your trades, and mailing you information. These companies are required to protect your information and use it solely for the purpose for which they received it.
•Courts and Government Officials. If required by law, we may disclose your personal information in accordance with a court order or at the request of government regulators. Only that information required by law, subpoena, or court order will be disclosed.
We seek to carefully safeguard your private information and, to that end, restrict access to non-public personal information about you to those employees and other persons who need to know the information to enable us to provide services to you. We maintain physical, electronic and procedural safeguards to protect your non-public personal information.
If you have any questions regarding this policy or the treatment of your non-public personal information, please contact our Chief Compliance Officer at (212) 655-0291.
Item 1A. Risk Factors
You should carefully consider the significant risks described below, together with all of the other information included in this Annual Report on Form 10-K, including our consolidated financial statements and the related notes, before making an investment decision in us. The risks set forth below are not the only risks that we face. Additional risks and uncertainties not currently known to us or that we currently deem to be immaterial may materially affect our business, our structure, our financial condition, our investments and/or operating results. If any of the following events occur, our business, financial condition and results of operations could be materially and adversely affected. In such case, our net asset value and the trading price of our common stock could decline. There can be no assurance that we will achieve our investment objective and you may lose all or part of your investment.
RISKS RELATED TO OUR BUSINESS AND STRUCTURE
We are currently operating in a period of capital markets disruption and economic uncertainty
Disruptions in the capital markets have increased the spread between the yields realized on risk-free and higher risk securities, resulting in illiquidity in parts of the capital markets. These and future market disruptions and/or illiquidity would be expected to have an adverse effect on our business, financial condition, results of operations and cash flows. Unfavorable economic conditions also would be expected to increase our funding costs, limit our access to the capital markets or result in a decision by lenders not to extend credit to us. These events have limited, and could continue to limit, our investment originations and/or our ability to grow, and they could have a material negative impact on our operating results and the fair values of our debt and equity investments.
Further, current market conditions may make it difficult for us to obtain debt capital on favorable terms and any failure to do so could have a material adverse effect on our business. The debt capital that will be available to us in the future, if at all, may be at a higher cost and on less favorable terms and conditions than what we would otherwise expect, including being at a higher cost in rising rate environments. If we are unable to raise debt, then our equity investors may not benefit from the potential for increased returns on equity resulting from leverage and we may be limited in our ability to make or fund
commitments to portfolio companies. An inability to obtain indebtedness could have a material adverse effect on our business, financial condition or results of operations.
Adverse developments in the credit markets may impair our ability to secure debt financing.
In past economic downturns, such as the financial crisis in the United States that began in mid-2007 and during other times of extreme market volatility, many commercial banks and other financial institutions stopped lending or significantly curtailed their lending activity. In addition, in an effort to stem losses and reduce their exposure to segments of the economy deemed to be high risk, some financial institutions limited routine refinancing and loan modification transactions and even reviewed the terms of existing facilities to identify bases for accelerating the maturity of existing lending facilities. If these conditions recur, for example as a result of rising interest rates or global conflict, it may be difficult for us to obtain desired financing to finance the growth of our investments on acceptable economic terms, or at all.
If we are unable to consummate credit facilities on commercially reasonable terms, our liquidity may be reduced significantly. If we are unable to repay amounts outstanding under our credit facilities or any facility we may enter into and are declared in default or are unable to renew or refinance any such facility, it would limit our ability to initiate significant originations or to operate our business in the normal course. These situations may arise due to circumstances that we may be unable to control, such as inaccessibility of the credit markets, a severe decline in the value of the U.S. dollar, a further economic downturn or an operational problem that affects third parties or us, and could materially damage our business. Moreover, we are unable to predict when economic and market conditions may become more favorable. Even if such conditions improve broadly and significantly over the long term, adverse conditions in particular sectors of the financial markets could adversely impact our business.
Further downgrades of the U.S. credit rating, impending automatic spending cuts or another government shutdown could negatively impact our liquidity, financial condition and earnings.
The U.S. debt ceiling and budget deficit concerns have increased the possibility of additional credit-rating downgrades and economic slowdowns, or a recession in the United States. U.S. lawmakers have passed legislation to raise the federal debt ceiling on multiple occasions, including, most recently, in June 2023, which suspended the debt ceiling through early 2025, unless Congress takes legislative action to further extend or defer it. Despite taking action to suspend the debt ceiling, ratings agencies have threatened to lower the long-term sovereign credit rating on the United States, including Fitch downgrading the U.S. government’s long-term rating from AAA to AA+ in August 2023 and Moody’s lowering the U.S. government’s credit rating outlook from “stable” to “negative” in November 2023.
The impact of this or any further downgrades to the U.S. government’s sovereign credit rating or its perceived creditworthiness could adversely affect the U.S. and global financial markets and economic conditions. Absent further quantitative easing by the Federal Reserve, these developments could cause interest rates and borrowing costs to rise, which may negatively impact our ability to access the debt markets on favorable terms. In addition, disagreement over the federal budget has caused the U.S. federal government to shut down for periods of time, and may lead to additional shutdowns in the future. Continued adverse political and economic conditions could have a material adverse effect on our business, financial condition and results of operations.
U.S. and worldwide economic, political, regulatory and financial market conditions may adversely affect our business, results of operations and financial condition, including our revenue growth and profitability.
We and our portfolio companies are subject to regulation by laws at the U.S. federal, state and local levels. These laws and regulations, as well as their interpretation, could change from time to time, including as the result of interpretive guidance or other directives from the U.S. President and others in the executive branch, and new laws, regulations and interpretations could also come into effect. Any such new or changed laws or regulations could have a material adverse effect on our business, and political uncertainty could increase regulatory uncertainty in the near term.
The effects of legislative and regulatory proposals directed at the financial services industry or affecting taxation, could negatively impact the operations, cash flows or financial condition of us and our portfolio companies, impose additional costs on us or our portfolio companies, intensify the regulatory supervision of us or our portfolio companies or otherwise adversely affect our business or the business of our portfolio companies. In addition, if we do not comply with applicable laws and regulations, we could lose any licenses that we then hold for the conduct of business and could be subject to civil fines and criminal penalties.
Over the last several years, there also has been an increase in regulatory attention to the extension of credit outside of the traditional banking sector, raising the possibility that some portion of the non-bank financial sector will be subject to new regulation. While it cannot be known at this time whether any regulation will be implemented or what form it will take, increased regulation of non-bank credit extension could negatively impact our operations, cash flows or financial condition,
impose additional costs on us, intensify the regulatory supervision of us or otherwise adversely affect our business, financial condition and results of operations.
Although we cannot predict the impact, if any, of these changes to our business, they could adversely affect our business, financial condition, operating results and cash flows. Until we know what policy changes are made and how those changes impact business and the business of our competitors over the long term, we will not know if, overall, it will benefit from them or be negatively affected by them.
In 2010, a financial crisis emerged in Europe, triggered by high budget deficits and rising direct and contingent sovereign debt, which created concerns about the ability of certain nations to continue to service their sovereign debt obligations. Risks resulting from such debt crisis, including any austerity measures taken in exchange for bailout of certain nations, and any future debt crisis in Europe or any similar crisis elsewhere could have a detrimental impact on the global economic recovery, sovereign and non-sovereign debt in certain countries and the financial condition of financial institutions generally. On January 31, 2020, the United Kingdom (the “UK”) ended its membership in the European Union (“Brexit”). Under the terms of the withdrawal agreement negotiated and agreed between the UK and the European Union, the UK’s departure from the European Union was followed by a transition period (the “Transition Period”), which ran until December 31, 2020 and during which the UK continued to apply European Union law and was treated for all material purposes as if it were still a member of the European Union. On December 24, 2020, the European Union and UK governments signed a trade deal that became provisionally effective on January 1, 2021 and that now governs the relationship between the UK and European Union (the “Trade Agreement”). The Trade Agreement implements significant regulation around trade, transport of goods and travel restrictions between the UK and the European Union. Notwithstanding the foregoing, the longer term economic, legal, political and social implications of Brexit are unclear at this stage and are likely to continue to lead to ongoing political and economic uncertainty and periods of increased volatility in both the UK and in wider European markets for some time. In particular, Brexit could lead to calls for similar referendums in other European jurisdictions, which could cause increased economic volatility in the European and global markets. This mid- to long-term uncertainty could have adverse effects on the economy generally and on our ability to earn attractive returns. In particular, currency volatility could mean that our returns are adversely affected by market movements and could make it more difficult, or more expensive, for us to execute prudent currency hedging policies. Potential decline in the value of the British Pound and/or the Euro against other currencies, along with the potential further downgrading of the UK’s sovereign credit rating, could also have an impact on the performance of certain investments made in the UK or Europe.
Increased geopolitical unrest, terrorist attacks, or acts of war may affect any market for our common stock, impact the businesses in which we invest, and harm our business, operating results, and financial conditions.
The continued threat of global terrorism and the impact of military and other action will likely continue to cause volatility in the economies of certain countries and various aspects thereof, including in prices of commodities, and could affect our financial results. Our portfolio investments may involve significant strategic assets having a national or regional profile. The nature of these assets could expose them to a greater risk of being the subject of a terrorist attack than other assets or businesses. Any terrorist attacks that occur at or near such assets would likely cause significant harm to employees, property and, potentially, the surrounding community, and may result in losses far in excess of available insurance coverage. As a result of global events and continued terrorism concerns, insurers significantly reduced the amount of insurance coverage available for liability to persons other than employees for claims resulting from acts of terrorism, war or similar events. As a result of a terrorist attack or terrorist activities in general, we may not be able to obtain insurance coverage and other endorsements at commercially reasonable prices or at all.
In addition, various social and political circumstances in the United States and around the world (including wars and other forms of conflict, terrorist acts, security operations and catastrophic events such as fires, floods, earthquakes, tornadoes, hurricanes and global health epidemics), may also contribute to increased market volatility and economic uncertainties. Such events, including rising trade tensions between the United States and China; other uncertainties regarding actual and potential shifts in U.S. and foreign, trade, economic and other policies with other countries; the ongoing conflict between Russia and Ukraine; and ongoing conflict in the Middle East. In response to the conflict between Russia and Ukraine, the United States and other countries have imposed sanctions or other restrictive actions against Russia. Any of the above factors, including sanctions, export controls, tariffs, trade wars and other governmental actions, could have a material adverse effect on our business, financial condition, cash flows and results of operations and could cause the market value of our common stock to decline.
Inflation and rising commodity prices may adversely impact our portfolio companies.
Inflation may affect our investments adversely in a number of ways. During periods of rising inflation, interest and distribution rates of any instruments we or entities related to portfolio investments may have issued could increase. Inflationary expectations or periods of rising inflation could also be accompanied by the rising prices of commodities which are critical to the operation of portfolio companies. Portfolio companies may have fixed income streams and, therefore, be unable to pay the interest amounts and other payments on our portfolio investments. The market value of such investments may decline in value
in times of higher inflation rates. Some of our portfolio investments may have income linked to inflation through contractual rights or other means. However, as inflation may affect both income and expenses, any increase in income may not be sufficient to cover increases in expenses.
There is uncertainty surrounding potential legal, regulatory and policy changes by new presidential administrations in the United States that may directly affect financial institutions and the global economy.
Following the November 2022 elections in the United States, the Democratic Party controls the Presidency and the Senate, with the Republican Party controlling the House of Representatives. Despite political tensions and uncertainty, changes in federal policy, including tax policies, and at regulatory agencies are expected to occur over time through policy and personnel changes, which may lead to changes involving the level of oversight and focus on the financial services industry or the tax rates paid by corporate entities. The nature, timing and economic and political effects of potential changes to the current legal and regulatory framework affecting financial institutions remain highly uncertain. Uncertainty surrounding future changes may adversely affect our operating environment and therefore our business, financial condition, results of operations and growth prospects.
Our business is dependent on bank relationships and recent strain on the banking system may adversely impact us.
The financial markets recently have encountered volatility associated with concerns about the balance sheets of banks, especially small and regional banks that may have significant losses associated with investments that make it difficult to fund demands to withdraw deposits and other liquidity needs. Although the federal government has announced measures to assist these banks and protect depositors, some banks have already been impacted and others may be materially and adversely impacted. Our business is dependent on bank relationships, and we are proactively monitoring the financial health of banks with which we (or our portfolio companies) do or may in the future do business. Continued strain on the banking system may adversely impact our business, financial condition and results of operations.
We may suffer credit losses.
Investments in small and middle market businesses are highly speculative and involve a high degree of risk of credit loss. These risks are likely to increase during volatile economic periods, such as the United States and many other economies have recently been experiencing.
Changes to U.S. tariff and import/export regulations may have a negative effect on our portfolio companies and, in turn, harm us.
There has been on-going discussion and commentary regarding potential significant changes to U.S. trade policies, treaties and tariffs. The current U.S. presidential administration, along with Congress, have created significant uncertainty about the future relationship between the United States and other countries with respect to the trade policies, treaties and tariffs. These developments, or the perception that any of them could occur, may have a material adverse effect on global economic conditions and the stability of global financial markets, and may significantly reduce global trade and, in particular, trade between the impacted nations and the United States. Any of these factors could depress economic activity and restrict our portfolio companies' access to suppliers or customers and have a material adverse effect on their business, financial condition and results of operations, which in turn would negatively impact us.
There is uncertainty as to the value of our portfolio investments because most of our investments are, and may continue to be in private companies and recorded at fair value. In addition, the fair values of our investments are determined by our board of directors in accordance with our valuation policy.
Some of our investments are and may be in the form of securities or loans that are not publicly traded, and these investments may not have a readily available market quotation. Under the 1940 Act, we are required to carry our portfolio investments at market value or, if there is no readily available market quotation, at fair value as determined in good faith by our board of directors, including reflection of significant events affecting the value of our securities. We value our investments for which we do not have readily available market quotations quarterly, or more frequently as circumstances require, at fair value as determined in good faith by our board of directors in accordance with our valuation policy, which is at all times consistent with GAAP and the 1940 Act.
Our board of directors utilizes the services of one or more independent third-party valuation firms to aid it in determining the fair value with respect to our material unquoted assets in accordance with our valuation policy. The inputs into the determination of fair value of these investments may require significant management judgment or estimation. Even if observable market data is available, such information may be the result of consensus pricing information or broker quotes, which include a disclaimer that the broker would not be held to such a price in an actual transaction. The non-binding nature of consensus pricing and/or quotes accompanied by disclaimers materially reduces the reliability of such information.
The types of factors that the board of directors takes into account in determining the fair value of our investments generally include, as appropriate: available market data, including relevant and applicable market trading and transaction comparables, applicable market yields and multiples, security covenants, call protection provisions, information rights, the nature and realizable value of any collateral, the portfolio company's ability to make payments, its earnings and discounted cash flows and the markets in which it does business, comparisons of financial ratios of peer companies that are public, comparable merger and acquisition transactions and the principal market and enterprise values. Since these valuations, and particularly valuations of private securities and private companies, are inherently uncertain, may fluctuate over short periods of time and may be based on estimates, our determinations of fair value may differ materially from the values that would have been used if a ready market for these securities existed.
Due to this uncertainty, our fair value determinations may cause our net asset value, on any given date, to be materially understated or overstated. In addition, investors purchasing our common stock based on an overstated net asset value would pay a higher price than the realizable value that our investments might warrant.
We may adjust quarterly the valuation of our portfolio to reflect our board of directors' determination of the fair value of each investment in our portfolio. Any changes in fair value are recorded in our statement of operations as net change in unrealized appreciation or depreciation.
Our ability to achieve our investment objective depends on key investment personnel of the Investment Adviser. If the Investment Adviser were to lose any of its key investment personnel, our ability to achieve our investment objective could be significantly harmed.
We depend on the investment judgment, skill and relationships of the investment professionals of the Investment Adviser, particularly Steven B. Klinsky, Robert A. Hamwee, John R. Kline and Laura C. Holson, as well as other key personnel to identify, evaluate, negotiate, structure, execute, monitor and service our investments. The Investment Adviser, as an affiliate of New Mountain Capital, is supported by New Mountain Capital's team, which as of December 31, 2023 consisted of approximately 245 employees and senior advisors of New Mountain Capital and its affiliates to fulfill its obligations to us under the Investment Management Agreement. The Investment Adviser may also depend upon New Mountain Capital to obtain access to investment opportunities originated by the professionals of New Mountain Capital and its affiliates. Our future success depends to a significant extent on the continued service and coordination of the key investment personnel of the Investment Adviser. The departure of any of these individuals could have a material adverse effect on our ability to achieve our investment objective.
The Investment Committee, which oversees our investment activities, is provided by the Investment Adviser. The Investment Committee currently consists of six members. The loss of any member of the Investment Committee or of other senior professionals of the Investment Adviser and its affiliates without suitable replacement could limit our ability to achieve our investment objective and operate as we anticipate. This could have a material adverse effect on our financial condition, results of operations and cash flows. To achieve our investment objective, the Investment Adviser may hire, train, supervise and manage new investment professionals to participate in its investment selection and monitoring process. If the Investment Adviser is unable to find investment professionals or do so in a timely manner, our business, financial condition and results of operations could be adversely affected.
The 1940 Act and the Code impose numerous constraints on the operations of BDCs and RICs, which could adversely affect our business.
The 1940 Act and the Code impose numerous constraints on the operations of BDCs and RICs that do not apply to the other investment vehicles previously managed by the investment professionals of the Investment Adviser. For example, under the 1940 Act, BDCs are required to invest at least 70.0% of their total assets primarily in "qualifying" assets such as U.S. private or thinly traded companies, cash, cash equivalents, U.S. government securities and other high quality debt investments that mature in one year or less. Moreover, qualification for taxation as a RIC under Subchapter M of the Code requires satisfaction of source-of-income, asset diversification and annual distribution requirements. The failure to comply with these provisions in a timely manner could prevent us from qualifying as a BDC or as a RIC and could force us to pay unexpected taxes and penalties, which would have a material adverse effect on our performance. If we fail to maintain our status as a BDC or tax treatment as a RIC, our operating flexibility could be significantly reduced.
We operate in a highly competitive market for investment opportunities and may not be able to compete effectively.
We compete for investments with other BDCs and investment funds (including private equity and hedge funds), as well as traditional financial services companies such as commercial banks and other sources of funding. Many of our competitors are substantially larger and have considerably greater financial, technical and marketing resources than we do. For example, some competitors may have a lower cost of capital and access to funding sources that are not available to us. In addition, some of our competitors may have higher risk tolerances or different risk assessments than us. Furthermore, many of
our competitors have greater experience operating under, or are not subject to, the regulatory restrictions that the 1940 Act imposes on us as a BDC or the source-of-income, asset diversification and distribution requirements that we must satisfy to maintain our tax treatment as a RIC. These characteristics could allow our competitors to consider a wider variety of investments, establish more relationships and offer better pricing and more flexible structuring than we are able to do.
We may lose investment opportunities if our pricing, terms and structure do not match those of our competitors. With respect to the investments that we make, we do not seek to compete based primarily on the interest rates we may offer, and we believe that some of our competitors may make loans with interest rates that may be lower than the rates we offer. In the secondary market for acquiring existing loans, we expect to compete generally on the basis of pricing terms. If we match our competitors' pricing, terms and structure, we may experience decreased net interest income, lower yields and increased risk of credit loss. If we are forced to match our competitors' pricing, terms and structure, we may not be able to achieve acceptable returns on our investments or may bear substantial risk of capital loss. Part of our competitive advantage stems from the fact that we believe the market for middle market lending is underserved by traditional bank lenders and other financial sources. A significant increase in the number and/or the size of our competitors in this target market could force us to accept less attractive investment terms. We may also compete for investment opportunities with accounts managed by the Investment Adviser or its affiliates. Although the Investment Adviser allocates opportunities in accordance with its policies and procedures, allocations to such other accounts reduces the amount and frequency of opportunities available to us and may not be in our best interests and, consequently, our stockholders. Moreover, the performance of investment opportunities is not known at the time of allocation. If we are not able to compete effectively, our business, financial condition and results of operations may be adversely affected, thus affecting our business, financial condition and results of operations. Because of this competition, there can be no assurance that we will be able to identify and take advantage of attractive investment opportunities that we identify or that we will be able to fully invest our available capital.
Our business, results of operations and financial condition depend on our ability to manage future growth effectively.
Our ability to achieve our investment objective and to grow depends on the Investment Adviser's ability to identify, invest in and monitor companies that meet our investment criteria. Accomplishing this result on a cost-effective basis is largely a function of the Investment Adviser's structuring of the investment process, its ability to provide competent, attentive and efficient services to us and its ability to access financing on acceptable terms. The Investment Adviser has substantial responsibilities under the Investment Management Agreement and may also be called upon to provide managerial assistance to our eligible portfolio companies. These demands on the time of the Investment Adviser and its investment professionals may distract them or slow our rate of investment. In order to grow, we and the Investment Adviser may need to retain, train, supervise and manage new investment professionals. However, these investment professionals may not be able to contribute effectively to the work of the Investment Adviser. If we are unable to manage our future growth effectively, our business, results of operations and financial condition could be materially adversely affected.
The management fee and incentive fee may induce the Investment Adviser to make speculative investments.
The incentive fee payable to the Investment Adviser may create an incentive for the Investment Adviser to pursue investments that are risky or more speculative than would be the case in the absence of such compensation arrangement, which could result in higher investment losses, particularly during cyclical economic downturns. The incentive fee payable to the Investment Adviser is calculated based on a percentage of our return on investment capital. This may encourage the Investment Adviser to use leverage to increase the return on our investments. In addition, because the base management fee is payable based upon our gross assets, which includes any borrowings for investment purposes, but excludes cash and cash equivalents for investment purposes, the Investment Adviser may be further encouraged to use leverage to make additional investments. Under certain circumstances, the use of leverage may increase the likelihood of default, which would impair the value of our common stock.
The incentive fee payable to the Investment Adviser also may create an incentive for the Investment Adviser to invest in instruments that have a deferred interest feature, even if such deferred payments would not provide the cash necessary to pay current distributions to our stockholders. Under these investments, we would accrue the interest over the life of the investment but would not receive the cash income from the investment until the end of the investment's term, if at all. Our net investment income used to calculate the income portion of the incentive fee, however, includes accrued interest. Thus, a portion of the incentive fee would be based on income that we have not yet received in cash and may never receive in cash if the portfolio company is unable to satisfy such interest payment obligations. In addition, the "catch-up" portion of the incentive fee may encourage the Investment Adviser to accelerate or defer interest payable by portfolio companies from one calendar quarter to another, potentially resulting in fluctuations in timing and dividend amounts.
We may be obligated to pay the Investment Adviser incentive compensation even if we incur a loss.
The Investment Adviser is entitled to incentive compensation for each fiscal quarter in an amount equal to a percentage of the excess of our Pre-Incentive Fee Net Investment Income for that quarter (before deducting incentive compensation) above a performance threshold for that quarter. Accordingly, since the performance threshold is based on a
percentage of our net asset value, decreases in our net asset value make it easier to achieve the performance threshold. Our Pre-Incentive Fee Net Investment Income for incentive compensation purposes excludes realized and unrealized capital losses or depreciation that it may incur in the fiscal quarter, even if such capital losses or depreciation result in a net loss on our statement of operations for that quarter. Thus, we may be required to pay the Investment Adviser incentive compensation for a fiscal quarter even if there is a decline in the value of our portfolio or we incur a net loss for that quarter.
The incentive fee we pay to the Investment Adviser with respect to capital gains may be effectively greater than 20.0%.
As a result of the operation of the cumulative method of calculating the capital gains portion of the incentive fee we pay to the Investment Adviser, the cumulative aggregate capital gains fee received by the Investment Adviser could be effectively greater than 20.0%, depending on the timing and extent of subsequent net realized capital losses or net unrealized depreciation. We cannot predict whether, or to what extent, this payment calculation would affect your investment in our common stock.
We may face risks due to shared employees between our Investment Adviser and its affiliates and other activities of the personnel of our Investment Adviser.
Our Investment Adviser expects to rely heavily on the extensive expertise and industry relationships developed by the employees and certain senior advisors of certain of its affiliates to identify and evaluate potential investment opportunities for us. Research from the Investment Adviser's private equity strategy on our behalf will be used to benefit other strategies and clients of our Investment Adviser, its affiliates and affiliated funds.
By reason of their responsibilities in connection with their other activities, certain personnel of our Investment Adviser (or employees and affiliates thereof) may acquire confidential or material non-public information or be restricted from initiating transactions in certain securities. In those instances, we will not be free to act upon any such information. Due to these restrictions, we may not be able to initiate a transaction that we otherwise might have initiated and may not be able to sell a portfolio investment that we otherwise might have sold. Conversely, we may not have access to material non-public information in the possession of our Investment Adviser and its affiliates which might be relevant to an investment decision to be made by us, and we may initiate a transaction or sell a portfolio investment which, if such information had been known to us, may not have been undertaken. See also "—The Investment Committee, the Investment Adviser or its affiliates may, from time to time, possess material non-public information, limiting our investment discretion."
We may pay additional consulting fees to New Mountain Capital’s Executive Advisory Council.
The Investment Adviser may consult New Mountain Capital's Executive Advisory Council from time to time concerning general industry trends, related matters and specific investment diligence. Members of the Executive Advisory Council may be paid by us for project‑related consulting fees and reimbursed by us for their reasonable and documented out‑of‑pocket expenses in connection with specific diligence for a potential portfolio company.
We borrow money, which could magnify the potential for gain or loss on amounts invested in us and increase the risk of investing in us.
We borrow money as part of our business plan. Borrowings, also known as leverage, magnify the potential for gain or loss on invested equity capital and may, consequently, increase the risk of investing in us. We expect to continue to use leverage to finance our investments, through senior securities issued by banks and other lenders. Lenders of these senior securities have fixed dollar claims on our assets that are superior to claims of our common stockholders and we would expect such lenders to seek recovery against our assets in the event of default. If the value of our assets decreases, leveraging would cause our net asset value to decline more sharply than it otherwise would have had it not leveraged. Similarly, any decrease in our income would cause our net income to decline more sharply than it would have had it not borrowed. Such a decline could adversely affect our ability to make common stock distribution payments. In addition, because our investments may be illiquid, we may be unable to dispose of them or to do so at a favorable price in the event we need to do so if we are unable to refinance any indebtedness upon maturity and, as a result, we may suffer losses. Leverage is generally considered a speculative investment technique and increases the risks associated with investing in our securities.
Our ability to service any debt that we incur depends largely on our financial performance and is subject to prevailing economic conditions and competitive pressures. Moreover, as the Investment Adviser's management fee is payable to the Investment Adviser based on gross assets, including those assets acquired through the use of leverage, the Investment Adviser may have a financial incentive to incur leverage which may not be consistent with our interests and the interests of our common stockholders. In addition, holders of our common stock will, indirectly, bear the burden of any increase in our expenses as a result of leverage, including any increase in the management fee payable to the Investment Adviser.
As of December 31, 2023, we had $515.1 million, $506.5 million, $300.0 million, $260.0 million, $186.4 million, $36.8 million and $2.9 million of indebtedness outstanding under the Holdings Credit Facility, the Unsecured Notes, the SBA-guaranteed debentures, the 2022 Convertible Notes, the DB Credit Facility, the NMFC Credit Facility and the NMNLC Credit
Facility II respectively (each as defined below). The Holdings Credit Facility, the Unsecured Notes, the SBA-guaranteed debentures, the DB Credit Facility, the NMFC Credit Facility and the NMNLC Credit Facility II had weighted average interest rates of 7.0%, 4.9%, 2.7%, 7.9%, 7.1% and 7.2% respectively, for the year ended December 31, 2023. The interest rate on the 2022 Convertible Notes is 7.5% per annum.
Illustration. The following table illustrates the effect of leverage on returns from an investment in our common stock assuming various annual returns, net of interest expense and adjusted for unsettled securities purchased. The calculations in the table below are hypothetical. Actual returns may be higher or lower than those appearing below. The calculation assumes (i) $3,159.2 million in total assets as of December 31, 2023, (ii) a weighted average cost of borrowings of 5.9%, which assumes the weighted average interest rates as of December 31, 2023 for the Holdings Credit Facility, the Unsecured Notes, the SBA-guaranteed debentures, the DB Credit Facility, the NMFC Credit Facility and the NMNLC Credit Facility II and the interest rate as of December 31, 2023 for the 2022 Convertible Notes, (iii) $1,807.7 million in debt outstanding and (iv) $1,320.0 million in net assets. | | | | | | | | | | | | | | | | | | | | | | | | | | | | | |
| Assumed Return on Our Portfolio (net of interest expense) |
| (10.0)% | | (5.0)% | | 0.0% | | 5.0% | | 10.0% |
| Corresponding return to stockholder | (32.0)% | | (20.0)% | | (8.0)% | | 3.9% | | 15.9% |
If we are unable to comply with the covenants or restrictions in our borrowings, our business could be materially adversely affected.
The Holdings Credit Facility includes covenants that, subject to exceptions, restrict our ability to pay distributions, create liens on assets, make investments, make acquisitions and engage in mergers or consolidations. The Holdings Credit Facility also includes a change of control provision that accelerates the indebtedness under the facility in the event of certain change of control events. Complying with these restrictions may prevent us from taking actions that we believe would help us grow our business or are otherwise consistent with our investment objective. These restrictions could also limit our ability to plan for or react to market conditions or meet extraordinary capital needs or otherwise restrict corporate activities. In addition, the restrictions contained in the Holdings Credit Facility could limit our ability to make distributions to our stockholders in certain circumstances, which could result in us failing to qualify as a RIC and thus becoming subject to corporate-level U.S. federal income tax at corporate rates (and any applicable state and local taxes).
Our Unsecured Notes are subject to certain covenants, including covenants such as information reporting, maintenance of our status as a BDC under the 1940 Act and a RIC under the Internal Revenue Code, minimum stockholders' equity, minimum asset coverage ratio, and prohibitions on certain fundamental changes, as well as customary events of default with customary cure and notice, including, without limitation, nonpayment, misrepresentation in a material respect, breach of covenant, cross-default under our other indebtedness or certain significant subsidiaries, certain judgments and orders, and certain events of bankruptcy. In addition, we are obligated to offer to prepay the Unsecured Notes (excluding the 8.250% Unsecured Notes) at par if the Investment Adviser, or an affiliate thereof, ceases to be our investment adviser or if certain change in control events occur with respect to the Investment Adviser.
The 2022 Convertible Notes are subject to certain covenants, including covenants requiring us to provide financial information to the holders of the Convertible Notes and the trustee if we cease to be subject to the reporting requirements of the Exchange Act. These covenants are subject to limitations and exceptions. In addition, if certain corporate events occur, holders of the 2022 Convertible Notes may require us to repurchase for cash all or part of their 2022 Convertible Notes at a repurchase price equal to 100.0% of the principal amount of the 2022 Convertible Notes to be repurchased, plus accrued and unpaid interest through, but excluding, the repurchase date.
The DB Credit Facility contains certain customary affirmative and negative covenants and events of default.
The NMFC Credit Facility includes customary covenants, including certain financial covenants related to asset coverage and liquidity and other maintenance covenants, as well as customary events of default.
The breach of any of the covenants or restrictions, unless cured within the applicable grace period, would result in a default under the applicable credit facility that would permit the lenders thereunder to declare all amounts outstanding to be due and payable. In such an event, we may not have sufficient assets to repay such indebtedness. As a result, any default could have serious consequences to our financial condition. An event of default or an acceleration under the credit facilities could also cause a cross-default or cross-acceleration of another debt instrument or contractual obligation, which would adversely impact our liquidity. We may not be granted waivers or amendments to the credit facilities if for any reason we are unable to comply with it, and we may not be able to refinance the credit facilities on terms acceptable to us, or at all.
The terms of our credit facilities may contractually limit our ability to incur additional indebtedness.
We will need additional capital to fund new investments and grow our portfolio of investments. We intend to access the capital markets periodically to issue debt or equity securities or borrow from financial institutions in order to obtain such additional capital. We believe that having the flexibility to incur additional leverage could augment the returns to our stockholders and would be in the best interests of our stockholders. Even though our board of directors and our stockholders have approved a resolution permitting us to be subject to a 150.0% asset coverage ratio effective as of June 9, 2018, contractual leverage limitations under our existing credit facilities or future borrowings may limit our ability to incur additional indebtedness. Currently, our NMFC Credit Facility restricts our ability to incur additional indebtedness, if after incurring such additional debt, our debt to equity ratio exceeds 1.65x. The NMFC Credit Facility requires that we not exceed a secured debt ratio of 0.70 to 1.00 at any time. We cannot assure you that we will be able to negotiate a change to our credit facilities to allow us to incur additional leverage or that any such an amendment will be available to us on favorable terms. An inability on our part to amend the contractual asset coverage limitation and access additional leverage could limit our ability to take advantage of the benefits described above related to our ability to incur additional leverage and could decrease our earnings, if any, which would have an adverse effect on our results of operations and the value of our shares of common stock.
We may enter into reverse repurchase agreements, which are another form of leverage.
We may enter into reverse repurchase agreements as part of our management of our investment portfolio. Under a reverse repurchase agreement, we will effectively pledge our assets as collateral to secure a short-term loan. Generally, the other party to the agreement makes the loan in an amount equal to a percentage of the fair value of the pledged collateral. At the maturity of the reverse repurchase agreement, the payor will be required to repay the loan and correspondingly receive back its collateral. While used as collateral, the assets continue to pay principal and interest which are for our benefit.
Our use of reverse repurchase agreements, if any, involves many of the same risks involved in our use of leverage, as the proceeds from reverse repurchase agreements generally will be invested in additional securities. There is a risk that the market value of the securities acquired with the proceeds of a reverse repurchase agreement may decline below the price of the securities that we have sold but remain obligated to repurchase under the reverse repurchase agreement. In addition, there is a risk that the market value of the securities effectively pledged by us may decline. If a buyer of securities under a reverse repurchase agreement were to file for bankruptcy or experience insolvency, we may be adversely affected. Also, in entering into reverse repurchase agreements, we would bear the risk of loss to the extent that the proceeds of such agreements at settlement are more than the fair value of the underlying securities being pledged. In addition, due to the interest costs associated with reverse repurchase agreements transactions, our net asset value would decline, and, in some cases, we may be worse off than if such instruments had not been used.
If we are unable to obtain additional debt financing, or if our borrowing capacity is materially reduced, our business could be materially adversely affected.
We may want to obtain additional debt financing, or need to do so upon maturity of our credit facilities, in order to obtain funds which may be made available for investments. The Holdings Credit Facility, the 2022 Convertible Notes, the DB Credit Facility, the NMFC Credit Facility and the NMNLC Credit Facility II will mature on October 26, 2028, October 15, 2025, March 25, 2027, June 4, 2026 and November 1, 2024, respectively. Our $116.5 million in 2019A Unsecured Notes had a maturity of April 30, 2024 but were fully repaid on February 5, 2024, our $200.0 million in 2021A Unsecured Notes will mature on January 29, 2026, our $75.0 million in 2022A Unsecured Notes will mature on June 15, 2027 and our $115.0 million in 8.250% Unsecured Notes will mature on November 15, 2028. The SBA-guaranteed debentures have ten year maturities and will begin to mature on March 1, 2025. If we are unable to increase, renew or replace any such facilities and enter into new debt financing facilities or other debt financing on commercially reasonable terms, our liquidity may be reduced significantly. In addition, if we are unable to repay amounts outstanding under any such facilities and are declared in default or are unable to renew or refinance these facilities, we may not be able to make new investments or operate our business in the normal course. These situations may arise due to circumstances that we may be unable to control, such as lack of access to the credit markets, a severe decline in the value of the U.S. dollar, an economic downturn or an operational problem that affects us or third parties, and could materially damage our business operations, results of operations and financial condition.
We may need to raise additional capital to grow.
We may need additional capital to fund new investments and grow. We may access the capital markets periodically to issue equity securities. In addition, we may also issue debt securities or borrow from financial institutions in order to obtain such additional capital. Unfavorable economic conditions could increase our funding costs and limit our access to the capital markets or result in a decision by lenders not to extend credit to us. A reduction in the availability of new capital could limit our ability to grow. In addition, we are required to distribute at least 90.0% of our net ordinary income and net short-term capital gains in excess of net long-term capital losses, if any, to our stockholders to maintain our RIC status. As a result, these earnings will not be available to fund new investments. If we are unable to access the capital markets or if we are unable to borrow from
financial institutions, we may be unable to grow our business and execute our business strategy fully, and our earnings, if any, could decrease, which could have an adverse effect on the value of our securities.
A renewed disruption in the capital markets and the credit markets could adversely affect our business.
As a BDC, we must maintain our ability to raise additional capital for investment purposes. If we are unable to access the capital markets or credit markets, we may be forced to curtail our business operations and may be unable to pursue new investment opportunities. The capital markets and the credit markets have experienced extreme volatility in recent periods, and, as a result, there have been and will likely continue to be uncertainty in the financial markets in general. Disruptions in the capital markets in recent years increased the spread between the yields realized on risk-free and higher risk securities, resulting in illiquidity in parts of the capital markets. In addition, a prolonged period of market illiquidity may cause us to reduce the volume of loans that we originate and/or fund and adversely affect the value of our portfolio investments. Unfavorable economic conditions could also increase our funding costs, limit our access to the capital markets or result in a decision by lenders not to extend credit to us. These events could limit our investment originations, limit our ability to grow and negatively impact our operating results. Ongoing disruptive conditions in the financial industry and the impact of new legislation in response to those conditions could restrict our business operations and, consequently, could adversely impact our business, results of operations and financial condition.
If the fair value of our assets declines substantially, we may fail to satisfy the asset coverage ratios imposed upon us by the 1940 Act and contained in the Holdings Credit Facility, certain of the Unsecured Notes, the 2022 Convertible Notes, the DB Credit Facility, the NMFC Credit Facility and the NMNLC Credit Facility II. Any such failure would result in a default under such indebtedness and otherwise affect our ability to issue senior securities, borrow under our credit facilities and pay distributions, which could materially impair our business operations. Our liquidity could be impaired further by our inability to access the capital or credit markets. For example, we cannot be certain that we will be able to renew our credit facilities as they mature or to consummate new borrowing facilities to provide capital for normal operations, including new originations, or reapply for SBIC licenses. In recent years, reflecting concern about the stability of the financial markets, many lenders and institutional investors have reduced or ceased providing funding to borrowers. This market turmoil and tightening of credit have led to increased market volatility and widespread reduction of business activity generally in recent years. In addition, adverse economic conditions due to these disruptive conditions could materially impact our ability to comply with the financial and other covenants in any existing or future credit facilities. If we are unable to comply with these covenants, this could materially adversely affect our business, results of operations and financial condition.
Changes in interest rates may affect our cost of capital and net investment income.
To the extent we borrow money to make investments, our net investment income depends, in part, upon the difference between the rate at which we borrow funds and the rate at which we invest those funds. As a result, a significant change in market interest rates may have a material adverse effect on our net investment income in the event we use debt to finance our investments. In periods of rising interest rates, our cost of funds would increase, which could reduce our net investment income. We may use interest rate risk management techniques in an effort to limit our exposure to interest rate fluctuations. These techniques may include various interest rate hedging activities to the extent permitted by the 1940 Act.
SBIC I and SBIC II are licensed by the SBA and are subject to SBA regulations.
On August 1, 2014 and August 25, 2017, respectively, our wholly-owned direct and indirect subsidiaries, SBIC I and SBIC II, received licenses to operate as SBICs under the 1958 Act and are regulated by the SBA. The SBA places certain limitations on the financing terms of investments by SBICs in portfolio companies, regulates the types of financing an SBIC can provide, prohibits investing in small businesses with certain characteristics or in certain industries and requires capitalization thresholds that limit distributions to us. Compliance with SBA regulations may cause SBIC I and SBIC II to invest at less competitive rates in order to find investments that qualify under SBA regulations.
The SBA regulations require, among other things, an annual periodic examination of a licensed SBIC by an SBA examiner to determine the SBIC's compliance with the relevant SBA regulations, and the performance of a financial audit by an independent auditor. If SBIC I and SBIC II fail to comply with applicable regulations, the SBA could, depending on the severity of the violation, limit or prohibit SBIC I's and SBIC II's use of the debentures, declare outstanding debentures immediately due and payable, and/or limit SBIC I and SBIC II from making new investments. In addition, the SBA could revoke or suspend SBIC I's or SBIC II's licenses for willful or repeated violation of, or willful or repeated failure to observe, any provision of the 1958 Act or any rule or regulation promulgated thereunder. These actions by the SBA would, in turn, negatively affect us because SBIC I and SBIC II are our wholly-owned direct and indirect subsidiaries.
SBA-guaranteed debentures are non-recourse to us, have a ten year maturity, and may be prepaid at any time without penalty. Pooling of issued SBA-guaranteed debentures occurs in March and September of each year. The interest rate of SBA-guaranteed debentures is fixed at the time of pooling at a market-driven spread over ten year U.S. Treasury Notes. Leverage through SBA-guaranteed debentures is subject to required capitalization thresholds. Legislation adopted in 2018 raised the
amount that any single SBIC may borrow to two tiers of leverage capped from $150.0 million to $175.0 million, subject to SBA approval, where each tier is equivalent to the SBIC's regulatory capital, which generally equates to the amount of equity capital in the SBIC. Currently, SBIC I and SBIC II operate under the prior $150.0 million cap. The amount of SBA-guaranteed debentures that SBICs under common control can have outstanding is $350.0 million, subject to SBA approval.
RISKS RELATED TO OUR OPERATIONS
Because we intend to distribute substantially all of our income to our stockholders to maintain our status as a RIC, we will continue to need additional capital to finance our growth. If additional funds are unavailable or not available on favorable terms, our ability to grow may be impaired.
In order for us to qualify for the tax benefits available to RICs and to avoid payment of excise taxes, we intend to distribute to our stockholders substantially all of our annual taxable income. As a result of these requirements, we may need to raise capital from other sources to grow our business.
As a BDC, we are required to meet a coverage ratio of total assets, less liabilities and indebtedness not represented by senior securities and excluding SBA-guaranteed debentures as permitted by exemptive relief obtained from the SEC, to total senior securities, which includes all of our borrowings with the exception of SBA-guaranteed debentures, of at least 150.0% (which means we can borrow $2 for every $1 of our equity). This requirement limits the amount that we may borrow. Since we continue to need capital to grow our investment portfolio, these limitations may prevent us from incurring debt and require us to raise additional equity at a time when it may be disadvantageous to do so. While we expect that we will be able to borrow and to issue additional debt securities and expect that we will be able to issue additional equity securities, which would in turn increase the equity capital available to us, we cannot assure you that debt and equity financing will be available to us on favorable terms, or at all. In addition, as a BDC, we generally are not permitted to issue equity securities at a price below then-current net asset value without stockholder approval. If additional funds are not available us, we may be forced to curtail or cease new investment activities, and our net asset value could decline.
SBIC I and SBIC II may be unable to make distributions to us that will enable us to meet or maintain our RIC tax treatment.
In order for us to continue to qualify for tax benefits available to RICs and to minimize corporate-level U.S. federal income tax, we must timely distribute to our stockholders, for each taxable year, at least 90.0% of our "investment company taxable income", which is generally our net ordinary income plus the excess of realized net short-term capital gains over realized net long-term capital losses, including investment company taxable income from SBIC I and SBIC II. We will be partially dependent on SBIC I and SBIC II for cash distributions to enable us to meet the RIC distribution requirements. SBIC I and SBIC II may be limited by SBA regulations governing SBICs from making certain distributions to us that may be necessary to maintain our tax treatment as a RIC. We may have to request a waiver of the SBA's restrictions for SBIC I and SBIC II to make certain distributions to maintain our RIC tax treatment. We cannot assure you that the SBA will grant such waiver and if SBIC I and SBIC II are unable to obtain a waiver, compliance with the SBA regulations may result in corporate-level U.S. federal income tax.
Our ability to enter into transactions with our affiliates is restricted.
As a BDC, we are prohibited under the 1940 Act from participating in certain transactions with certain of our affiliates without the prior approval of a majority of our independent directors and, in some cases, of the SEC. Any person that owns, directly or indirectly, 5.0% or more of our outstanding voting securities is an affiliate of ours for purposes of the 1940 Act. We are generally prohibited from buying or selling any securities (other than our securities) from or to an affiliate. The 1940 Act also prohibits us from participating in certain "joint" transactions with certain of our affiliates, including New Mountain Guardian III BDC, L.L.C., New Mountain Guardian IV BDC, L.L.C., New Mountain Guardian IV Income Fund, L.L.C., NMF SLF I, Inc. and other funds and accounts that the Investment Adviser manages, which could include investments in the same portfolio company (whether at the same or different times), without prior approval of independent directors and, in some cases, the SEC. If a person acquires more than 25.0% of our voting securities, we are prohibited from buying or selling any security (other than our securities) from or to such person or certain of that person's affiliates, or entering into prohibited joint transactions with such persons, absent the prior approval of the SEC. Similar restrictions limit our ability to transact business with our officers or directors or their affiliates. As a result of these restrictions, we may be prohibited from buying or selling any security (other than any security of which we are the issuer) from or to any portfolio company of a fund managed by any affiliate of the Investment Adviser, or entering into joint arrangement, such as certain co-investments with these companies or funds, without the prior approval of the SEC, which may limit the scope of investment opportunities that would otherwise be available to us.
We rely on exemptive relief granted to the Investment Adviser and certain of its affiliates by the SEC that allows us to engage in co‑investment transactions with other affiliated funds of the Investment Adviser, subject to certain terms and conditions. However, while the terms of the exemptive relief require that the Investment Adviser will be given the opportunity
to cause us to participate in certain transactions originated by affiliates of the Investment Adviser, the Investment Adviser may determine that we will not participate in those transactions and for certain other transactions (as set forth in guidelines approved by the Board) the Investment Adviser may not have the opportunity to cause us to participate.
The Investment Adviser has significant potential conflicts of interest with us and, consequently, your interests as stockholders which could adversely impact our investment returns.
Our executive officers and directors, as well as the current or future investment professionals of the Investment Adviser, serve or may serve as officers, directors or principals of entities that operate in the same or a related line of business as we do or of investment funds managed by our affiliates. Accordingly, they may have obligations to investors in those entities, the fulfillment of which might not be in your interests as stockholders. The investment professionals of the Investment Adviser and/or New Mountain Capital employees that provide services pursuant to the Investment Management Agreement may manage other funds which may from time to time have overlapping investment objectives with our own and, accordingly, may invest in, whether principally or secondarily, asset classes similar to those targeted by us. If this occurs, the Investment Adviser may face conflicts of interest in allocating investment opportunities to us and such other funds. Although the investment professionals endeavor to allocate investment opportunities in a fair and equitable manner, it is possible that we may not be given the opportunity to participate in certain investments made by the Investment Adviser or persons affiliated with the Investment Adviser or that certain of these investment funds may be favored over us. When these investment professionals identify an investment, they may be forced to choose which investment fund should make the investment.
While we may co-invest with investment entities managed by the Investment Adviser or its affiliates to the extent permitted by the 1940 Act and the rules and regulations thereunder, the 1940 Act imposes significant limits on co-investment. On October 8, 2019, the SEC issued the Exemptive Order, as amended by a subsequent order granted on August 30, 2022, which superseded a prior order issued on December 18, 2017, which permits us to co-invest in portfolio companies with certain funds or entities managed by the Investment Adviser or its affiliates in certain negotiated transactions where co-investing would otherwise be prohibited under the 1940 Act, subject to the conditions of the Exemptive Order. Pursuant to the Exemptive Order, we are permitted to co-invest with our affiliates if a “required majority” (as defined in Section 57(o) of the 1940 Act) of our independent directors make certain conclusions in connection with a co-investment transaction, including, but not limited to, that (1) the terms of the potential co-investment transaction, including the consideration to be paid, are reasonable and fair to us and our stockholders and does not involve overreaching by us or our stockholders on the part of any person concerned, and (2) the potential co-investment transaction is consistent with the interests of our stockholders and is consistent with our then- current investment objectives and strategies.
If the Investment Adviser manages certain other affiliates in the future, we may co-invest on a concurrent basis with such other affiliates, subject to compliance with applicable regulations and regulatory guidance or an exemptive order from the SEC and our allocation procedures. In addition, we pay management and incentive fees to the Investment Adviser and reimburse the Investment Adviser for certain expenses it incurs. As a result, investors in our common stock invest in us on a “gross” basis and receive distributions on a “net” basis after our expenses. Also, the incentive fee payable to the Investment Adviser may create an incentive for the Investment Adviser to pursue investments that are riskier or more speculative than would be the case in the absence of such compensation arrangements. Any potential conflict of interest arising as a result of the arrangements with the Investment Adviser could have a material adverse effect on our business, results of operations and financial condition.
The Investment Committee, the Investment Adviser or its affiliates may, from time to time, possess material non-public information, limiting our investment discretion.
The Investment Adviser’s investment professionals, Investment Committee or their respective affiliates may serve as directors of, or in a similar capacity with, companies in which we invest. In the event that material non-public information is obtained with respect to such companies, or we become subject to trading restrictions under the internal trading policies of those companies or as a result of applicable law or regulations, we could be prohibited for a period of time from purchasing or selling the securities of such companies, and this prohibition may have an adverse effect on us and our stockholders.
The valuation process for certain of our portfolio holdings creates a conflict of interest.
Some of our portfolio investments are made in the form of securities that are not publicly traded. As a result, our board of directors determines the fair value of these securities in good faith. In connection with this determination, investment professionals from the Investment Adviser may provide our board of directors with portfolio company valuations based upon the most recent portfolio company financial statements available and projected financial results of each portfolio company. In addition, Steven B. Klinsky, a member of our board of directors, has an indirect pecuniary interest in the Investment Adviser. The participation of the Investment Adviser’s investment professionals in our valuation process, and the indirect pecuniary interest in the Investment Adviser by a member of our board of directors, could result in a conflict of interest as the Investment Adviser’s management fee is based, in part, on our gross assets and incentive fees are based, in part, on unrealized gains and losses.
Conflicts of interest may exist related to other arrangements with the Investment Adviser or its affiliates.
We have entered into a royalty-free license agreement with New Mountain Capital under which New Mountain Capital has agreed to grant us a non-exclusive, royalty-free license to use the names "New Mountain" and "New Mountain Finance", as well as the NMF logo. In addition, we reimburse the Administrator for the allocable portion of overhead and other expenses incurred by the Administrator in performing its obligations to us under the Administration Agreement, such as, but not limited to, the allocable portion of the cost of our chief financial officer and chief compliance officer and their respective staffs. This could create conflicts of interest that our board of directors must monitor.
The Investment Management Agreement with the Investment Adviser and the Administration Agreement with the Administrator were not negotiated on an arm’s length basis.
The Investment Management Agreement and the Administration Agreement were negotiated between related parties. In addition, we may choose not to enforce, waive, or to enforce less vigorously, our respective rights and remedies under these agreements because of our desire to maintain our ongoing relationship with the Investment Adviser, the Administrator and their respective affiliates. Any such decision, however, could cause us to breach our fiduciary obligations to our stockholders.
The Investment Adviser’s liability is limited under the Investment Management Agreement, and we have agreed to indemnify the Investment Adviser against certain liabilities, which may lead the Investment Adviser to act in a riskier manner than it would when acting for its own account.
Under the Investment Management Agreement, the Investment Adviser does not assume any responsibility other than to render the services called for under that agreement, and it is not responsible for any action of our board of directors in following or declining to follow the Investment Adviser’s advice or recommendations. Under the terms of the Investment Management Agreement, the Investment Adviser, its officers, members, personnel, any person controlling or controlled by the Investment Adviser are not liable for acts or omissions performed in accordance with and pursuant to the Investment Management Agreement, except those resulting from acts constituting gross negligence, willful misconduct, bad faith or reckless disregard of the Investment Adviser’s duties under the Investment Management Agreement. In addition, we have agreed to indemnify the Investment Adviser and each of its officers, directors, members, managers and employees from and against any claims or liabilities, including reasonable legal fees and other expenses reasonably incurred, arising out of or in connection with our business and operations or any action taken or omitted pursuant to authority granted by the Investment Management Agreement, except where attributable to gross negligence, willful misconduct, bad faith or reckless disregard of such person’s duties under the Investment Management Agreement. These protections may lead the Investment Adviser to act in a riskier manner than it would when acting for its own account.
The Investment Adviser can resign upon 60 days’ notice, and a suitable replacement may not be found within that time, resulting in disruptions in our operations that could adversely affect our business, results of operations and financial condition.
Under the Investment Management Agreement, the Investment Adviser has the right to resign at any time upon 60 days’ written notice, whether a replacement has been found or not. If the Investment Adviser resigns, we may not be able to find a new investment adviser or hire internal management with similar expertise and ability to provide the same or equivalent services on acceptable terms within 60 days, or at all. If a replacement is not able to be found on a timely basis, our business, results of operations and financial condition and our ability to pay distributions are likely to be materially adversely affected and the market price of our common stock may decline. In addition, if we are unable to identify and reach an agreement with a single institution or group of executives having the expertise possessed by the Investment Adviser and its affiliates, the coordination of its internal management and investment activities is likely to suffer. Even if we are able to retain comparable management, whether internal or external, their integration into our business and lack of familiarity with our investment objective may result in additional costs and time delays that may materially adversely affect our business, results of operations and financial condition.
The Administrator can resign upon 60 days’ notice from its role as Administrator under the Administration Agreement, and a suitable replacement may not be found, resulting in disruptions that could adversely affect our business, results of operations and financial condition.
The Administrator has the right to resign under the Administration Agreement upon 60 days’ written notice, whether a replacement has been found or not. If the Administrator resigns, it may be difficult to find a new administrator or hire internal management with similar expertise and ability to provide the same or equivalent services on acceptable terms, or at all. If a replacement is not found quickly, our business, results of operations and financial condition, as well as our ability to pay distributions, are likely to be adversely affected, and the market price of our common stock may decline. In addition, the coordination of our internal management and administrative activities is likely to suffer if we are unable to identify and reach an agreement with a service provider or individuals with the expertise possessed by the Administrator. Even if a comparable service provider or individuals to perform such services are retained, whether internal or external, their integration into our
business and lack of familiarity with our investment objective may result in additional costs and time delays that may materially adversely affect our business, results of operations and financial condition.
If we fail to operate as a BDC, our business and operating flexibility could be significantly reduced.
We have elected to be regulated as a BDC under the 1940 Act. The 1940 Act imposes numerous constraints on the operations of BDCs. For example, BDCs are required to invest at least 70.0% of their total assets in qualifying assets such as U.S. private companies or thinly-traded U.S. public companies, cash, cash equivalents, U.S. government securities and other high quality debt investments that mature in one year or less. Failure to comply with the requirements imposed on BDCs by the 1940 Act could cause the SEC to bring an enforcement action against us and/or expose us to claims of private litigants. In addition, upon approval of a majority of our stockholders, we may elect to withdraw our election as a BDC. If we decide to withdraw our election, or if we otherwise fail to operate as a BDC, we may be subject to the substantially greater regulation under the 1940 Act as a registered closed-end investment company. Compliance with these regulations would significantly decrease our operating flexibility and could significantly increase our cost of doing business.
If we do not invest a sufficient portion of our assets in qualifying assets, we could be precluded from investing in certain assets or could be required to dispose of certain assets, which could have a material adverse effect on our business, financial condition and results of operations.
As a BDC, we are prohibited from acquiring any assets other than qualifying assets unless, at the time of and after giving effect to such acquisition, at least 70.0% of our total assets are qualifying assets. We may acquire in the future other investments that are not qualifying assets to the extent permitted by the 1940 Act. If we do not invest a sufficient portion of our assets in qualifying assets, we would be prohibited from investing in additional assets, which could have a material adverse effect on our business, financial condition and results of operations. Similarly, these rules could prevent us from making follow on investments in existing portfolio companies (which could result in the dilution of our position) or could require us to dispose of investments at inopportune times in order to come into compliance with the 1940 Act. If we need to dispose of these investments quickly, it may be difficult to dispose of such investments on favorable terms. For example, we may have difficulty in finding a buyer and, even if a buyer is found, we may have to sell the investments at a substantial loss.
Our ability to invest in public companies may be limited in certain circumstances.
To maintain our status as a BDC, we are not permitted to acquire any assets other than qualifying assets specified in the 1940 Act unless, at the time the acquisition is made, at least 70.0% of our total assets are qualifying assets (with certain limited exceptions). Subject to certain exceptions for follow-on investments and distressed companies, an investment in an issuer that has outstanding securities listed on a national securities exchange may be treated as qualifying assets only if such issuer has a common equity market capitalization that is less than $250.0 million at the time of such investment.
Regulations governing the operations of BDCs will affect our ability to raise additional equity capital as well as our ability to issue senior securities or borrow for investment purposes, any or all of which could have a negative effect on our investment objectives and strategies.
Our business requires a substantial amount of capital. We may acquire additional capital from the issuance of senior securities, including borrowing under a credit facility or other indebtedness. In addition, we may also issue additional equity capital, which would in turn increase the equity capital available to us. However, we may not be able to raise additional capital in the future on favorable terms or at all.
We may issue debt securities, preferred stock, and we may borrow money from banks or other financial institutions, which we refer to collectively as "senior securities", up to the maximum amount permitted by the 1940 Act. The 1940 Act permits us to issue senior securities in amounts such that our asset coverage, as defined in the 1940 Act, equals at least 150.0% after each issuance of senior securities (which means we can borrow $2 for every $1 of our equity). As a result of our SEC exemptive order, we are permitted to exclude the senior securities issued by SBIC I and SBIC II from the definition of senior securities in the 150.0% asset coverage ratio we are required to maintain under the 1940 Act. If our asset coverage ratio is not at least 150.0%, we would be unable to issue additional senior securities, and certain provisions of certain of our senior securities may preclude us from making distributions to our stockholders. For example, our 2019A Unsecured Notes, 2021A Unsecured Notes and 2022A Unsecured Notes contain a covenant that prohibits us from declaring or paying a distribution to our stockholders unless we satisfy the asset coverage ratio immediately after the distribution, and the 8.250% Unsecured Notes contain a covenant that would be triggered if we declare or pay a distribution to our stockholders resulting in an asset coverage ratio of less than 150.0% for more than six consecutive months. If the value of our assets declines, we may be unable to satisfy this test. If that happens, we may be required to liquidate a portion of our investments and repay a portion of our indebtedness at a time when such sales may be disadvantageous.
The following table summarizes our indebtedness as of December 31, 2023: | | | | | | | | | | | | | | | | | | | | |
| Borrowing | | Maturity Date | | Permitted Borrowing | | Total Outstanding |
| | | | (in millions) | | (in millions) |
| Holdings Credit Facility | | October 26, 2028 | | $ | 730.0 | | | $ | 515.1 | |
| 2019A Unsecured Notes | | April 30, 2024 | | N/A | | 116.5 | |
| 2021A Unsecured Notes | | January 29, 2026 | | N/A | | 200.0 | |
| 2022A Unsecured Notes | | June 15, 2027 | | N/A | | 75.0 | |
| 8.250% Unsecured Notes | | November 15, 2028 | | N/A | | 115.0 | |
| SBA-guaranteed debentures | | Beginning March 1, 2025 | | N/A | | 300.0 | |
| 2022 Convertible Notes | | October 15, 2025 | | N/A | | 260.0 | |
| DB Credit Facility | | March 25, 2027 | | 280.0 | | | 186.4 | |
| NMFC Credit Facility(1) | | June 4, 2026 | | 198.5 | | | 36.8 | |
| NMNLC Credit Facility II(2) | | November 1, 2024 | | 27.5 | | | 2.9 | |
| Unsecured Management Company Revolver | | December 31, 2027 | | 100.0 | | | — | |
| | | | | | $ | 1,807.7 | |
(1)Under the NMFC Credit Facility, we may borrow in United States dollars or certain other permitted currencies. As of December 31, 2023, we had borrowings denominated in British Pound Sterling ("GBP") of £22.9 million and in Euro ("EUR") of €0.7 million that have been converted to U.S. dollars.
(2)As of the November 1, 2022 amendment, NMNLC and NM CLFX LP are co-borrowers on the NMNLC Credit Facility II and the maximum amount of revolving borrowings available to all borrowers is $27.5 million, of which $25.4 million is outstanding as of December 31, 2023.
N/A - not applicable
We may also obtain capital through the issuance of additional equity capital. As a BDC, we generally are not able to issue or sell our common stock at a price below then-current net asset value per share. If our common stock trades at a discount to our net asset value per share, this restriction could adversely affect our ability to raise equity capital. We may, however, sell our common stock, or warrants, options or rights to acquire our common stock, at a price below our net asset value per share of the common stock if our board of directors and independent directors determine that such sale is in our best interests and the best interests of our stockholders, and our stockholders approve such sale. In any such case, the price at which our securities are to be issued and sold may not be less than a price that, in the determination of our board of directors, closely approximates the market value of such securities (less any underwriting commission or discount). If we raise additional funds by issuing more shares of our common stock, or if we issue senior securities convertible into, or exchangeable for, our common stock, the percentage ownership of our stockholders may decline and you may experience dilution.
Our business model in the future may depend to an extent upon our referral relationships with private equity sponsors, and the inability of the investment professionals of the Investment Adviser to maintain or develop these relationships, or the failure of these relationships to generate investment opportunities, could adversely affect our business strategy.
If the investment professionals of the Investment Adviser fail to maintain existing relationships or develop new relationships with other sponsors or sources of investment opportunities, we may not be able to grow our investment portfolio. In addition, individuals with whom the investment professionals of the Investment Adviser have relationships are not obligated to provide us with investment opportunities, and, therefore, there is no assurance that any relationships they currently or may in the future have will generate investment opportunities for us.
We may experience fluctuations in our annual and quarterly results due to the nature of our business.
We could experience fluctuations in our annual and quarterly operating results due to a number of factors, some of which are beyond our control, including the ability or inability of us to make investments in companies that meet our investment criteria, the interest rate payable on the debt securities acquired and the default rate on such securities, the level of our expenses, variations in and the timing of the recognition of realized and unrealized gains or losses, the degree to which we encounter competition in the markets in which we operate and general economic conditions. As a result of these factors, results for any period should not be relied upon as being indicative of performance in future periods.
Our board of directors may change our investment objective, operating policies and strategies without prior notice or stockholder approval, the effects of which may be adverse to your interests as stockholders.
Our board of directors has the authority, except as otherwise provided in the 1940 Act, to modify or waive certain of our operating policies and strategies without prior notice and without stockholder approval. As a result, our board of directors may be able to change our investment policies and objectives without any input from our stockholders. However, absent stockholder approval, we may not change the nature of our business so as to cease to be, or withdraw our election to be regulated as, a BDC. Under Delaware law, we also cannot be dissolved without prior stockholder approval. We cannot predict the effect any changes to our current operating policies and strategies would have on our business, operating results and the market price of our common stock. Nevertheless, any such changes could adversely affect our business and impair our ability to make distributions to our stockholders.
We will be subject to U.S. federal income tax at corporate rates on all of our income if we are unable to maintain tax treatment as a RIC under Subchapter M of the Code, which would have a material adverse effect on our financial performance.
Although we intend to continue to qualify annually as a RIC under Subchapter M of the Code, no assurance can be given that we will be able to maintain our RIC tax treatment. To maintain RIC tax treatment and be relieved of U.S. federal income taxes on income and gains distributed to our stockholders, we must meet the annual distribution, source-of-income and asset diversification requirements described below.
•The Annual Distribution Requirement for a RIC will be satisfied if we distribute (or are deemed to distribute) to our stockholders on an annual basis at least 90.0% of our net ordinary income plus the excess of realized net short-term capital gains over realized net long-term capital losses, if any. Because we use debt financing, we are subject to an asset coverage ratio requirement under the 1940 Act, and we are subject to certain financial covenants contained in the Holdings Credit Facility and other debt financing agreements (as applicable). This asset coverage ratio requirement and these financial covenants could, under certain circumstances, restrict us from making distributions to our stockholders, which distributions are necessary for us to satisfy the Annual Distribution Requirement. If we are unable to obtain cash from other sources, and thus are unable to make sufficient distributions to our stockholders, we could fail to qualify for RIC tax treatment and thus become subject to U.S. federal income tax (and any applicable state and local taxes).
•The source-of-income requirement will be satisfied if at least 90.0% of our allocable share of our gross income for each year is derived from dividends and interest payments with respect to loans of certain securities, gains from the sale of stock or other securities, net income from certain “qualified publicly traded partnerships” or other income derived with respect to our business of investing in such stock or securities.
•The asset diversification requirement will be satisfied if we meet certain asset diversification requirements at the end of each quarter of our taxable year. To satisfy this requirement, at least 50.0% of the value of our assets must consist of cash, cash equivalents, U.S. government securities, securities of other RICs, and other such securities if such other securities of any one issuer do not represent more than 5.0% of the value of our assets or more than 10.0% of the outstanding voting securities of the issuer; and no more than 25.0% of the value of our assets can be invested in the securities, other than U.S. government securities or securities of other RICs, of one issuer, the securities, other than securities of other RICs of two or more issuers that are controlled, as determined under applicable Code rules, by it and that are engaged in the same or similar or related trades or businesses or the securities of certain “qualified publicly traded partnerships”. Failure to meet these requirements may result in us having to dispose of certain investments quickly in order to prevent the loss of our RIC status. Because most of our investments are intended to be in private companies, and therefore may be relatively illiquid, any such dispositions could be made at disadvantageous prices and could result in substantial losses.
If we fail to maintain our tax treatment as a RIC for any reason, and we do not qualify for certain relief provisions under the Code, we would be subject to U.S. federal income tax at corporate rates (and any applicable state and local taxes). In this event, the resulting taxes could substantially reduce our net assets, the amount of income available for distribution and the amount of our distributions, which would have a material adverse effect on our financial performance.
You may have current tax liabilities on distributions you reinvest in our common stock.
Under the dividend reinvestment plan, if you own shares of our common stock registered in your own name, you will have all cash distributions automatically reinvested in additional shares of our common stock unless you opt out of the dividend reinvestment plan by delivering notice by phone, internet or in writing to the plan administrator at least three days prior to the payment date of the next dividend or distribution. If you have not “opted out” of the dividend reinvestment plan, you will be deemed to have received, and be required to include income for U.S. federal income tax purposes, the amount reinvested in our
common stock to the extent the amount reinvested was not a tax-free return of capital. As a result, you may have to use funds from other sources to pay your U.S. federal income tax liability on the value of the common stock received.
We may not be able to pay you distributions on our common stock, our distributions to you may not grow over time and a portion of our distributions to you may be a return of capital for U.S. federal income tax purposes.
We intend to pay quarterly distributions to our stockholders out of assets legally available for distribution. We cannot assure you that we will continue to achieve investment results that will allow us to make a specified level of cash distributions or year-to-year increases in cash distributions. If we are unable to satisfy the asset coverage test applicable to us as a BDC, or if we violate certain covenants under the Holdings Credit Facility, the Unsecured Notes, the DB Credit Facility, or the NMFC Credit Facility, our ability to pay distributions to our stockholders could be limited. All distributions are paid at the discretion of our board of directors and depend on our earnings, financial condition, maintenance of our RIC status, compliance with applicable BDC regulations, compliance with covenants under the Holdings Credit Facility, the NMFC Credit Facility, the DB Credit Facility and the Unsecured Notes, and such other factors as our board of directors may deem relevant from time to time. The distributions that we pay to our stockholders in a year may exceed our taxable income for that year and, accordingly, a portion of such distributions may constitute a return of capital for U.S. federal income tax purposes.
We may have difficulty paying our required distributions if we recognize taxable income before or without receiving cash representing such income.
For U.S. federal income tax purposes, we include in our taxable income our allocable share of certain amounts that we have not yet received in cash, such as original issue discount or accruals on a contingent payment debt instrument, which may occur if we receive warrants in connection with the origination of a loan or possibly in other circumstances or contracted PIK interest and dividends, which generally represents contractual interest added to the loan balance and due at the end of the loan term. Our allocable share of such original issue discount and PIK interest are included in our taxable income before we receive any corresponding cash payments. We also may be required to include in our taxable income our allocable share of certain other amounts that we will not receive in cash.
Because in certain cases we may recognize taxable income before or without receiving cash representing such income, we may have difficulty making distributions to our stockholders that will be sufficient to enable us to meet the Annual Distribution Requirement necessary for us to qualify for tax treatment as a RIC. Accordingly, we may need to sell some of our assets at times and/or at prices that we would not consider advantageous. We may need to raise additional equity or debt capital, or we may need to forego new investment opportunities or otherwise take actions that are disadvantageous to our business (or be unable to take actions that are advantageous to our business) to enable us to make distributions to our stockholders that will be sufficient to enable us to meet the annual distribution requirement. If we are unable to obtain cash from other sources to enable us to meet the annual distribution requirement, we may fail to qualify for the U.S. federal income tax benefits allowable to RICs and, thus, become subject to a U.S. federal income tax at corporate rates (and any applicable state and local taxes).
Special tax issues regarding below investment grade securities
We expect to invest in debt securities that are rated below investment grade by rating agencies or that would be rated below investment grade if they were rated. Investments in these types of instruments may present special tax issues for us. U.S. federal income tax rules are not entirely clear about issues such as when we may cease to accrue interest, original issue discount or market discount, when and to what extent deductions may be taken for bad debts or worthless instruments, how payments received on obligations in default should be allocated between principal and income and whether exchanges of debt obligations in a bankruptcy or workout context are taxable. These and other issues will be addressed by us, to the extent necessary, to preserve our status as a RIC and to distribute sufficient income to not become subject to U.S. federal income tax.
Changes in laws or regulations governing our operations may adversely affect our business or cause us to alter our business strategy.
Changes in the laws or regulations or the interpretations of the laws and regulations that govern BDCs, RICs or non-depository commercial lenders could significantly affect our operations and our cost of doing business. Our portfolio companies are subject to U.S. federal, state and local laws and regulations. New legislation may be enacted or new interpretations, rulings or regulations could be adopted, any of which could materially adversely affect our business, including with respect to the types of investments we are permitted to make, and your interests as stockholders potentially with retroactive effect. In addition, any changes to the laws and regulations governing our operations relating to permitted investments may cause us to alter our investment strategy in order to make available to ourselves new or different opportunities. These changes could result in material changes to our strategies which may result in our investment focus shifting from the areas of expertise of the Investment Adviser to other types of investments in which the Investment Adviser may have less expertise or little or no experience. Any such changes, if they occur, could have a material adverse effect on our business, results of operations and financial condition and, consequently, the value of your investment in us.
Over the last several years, there has been an increase in regulatory attention to the extension of credit outside of the traditional banking sector, raising the possibility that some portion of the non-bank financial sector will be subject to new regulation. While it cannot be known at this time whether these regulations will be implemented or what form they will take, increased regulation of non-bank credit extension could negatively impact our operations, cash flows or financial condition, impose additional costs on us, intensify the regulatory supervision of us or otherwise adversely affect our business.
We cannot predict how tax reform legislation will affect us, our investments, or our stockholders, and any such legislation could adversely affect our business.
Legislative or other actions relating to taxes could have a negative effect on us. The rules dealing with U.S. federal income taxation are constantly under review by persons involved in the legislative process and by the Internal Revenue Service and the U.S. Treasury Department. The Biden Administration has proposed significant changes to the existing U.S. tax rules, and there are a number of proposals in Congress that would similarly modify the existing U.S. tax rules. The likelihood of any such legislation being enacted is uncertain, but new legislation and any U.S. Treasury regulations, administrative interpretations or court decisions interpreting such legislation could have adverse consequences, including significantly and negatively affect our ability to qualify for tax treatment as a RIC or otherwise impact the U.S. federal income tax consequences applicable to us and our stockholders of such qualification, or could have other adverse consequences. Stockholders are urged to consult with their tax advisor regarding tax legislative, regulatory, or administrative developments and proposals and their potential effect on an investment in our securities.
Our business and operations could be negatively affected if we become subject to any securities litigation or shareholder activism, which could cause us to incur significant expense, hinder execution of investment strategy and impact our stock price.
In the past, following periods of volatility in the market price of a company’s securities, securities class action litigation has often been brought against that company. Stockholder activism, which could take many forms or arise in a variety of situations, has been increasing in recent years. While we are currently not subject to any securities litigation or stockholder activism, due to the potential volatility of our stock price and for a variety of other reasons, we may in the future become the target of securities litigation or shareholder activism. Securities litigation and stockholder activism, including potential proxy contests, could result in substantial costs and divert the attention of our management and board of directors and resources from our business. Additionally, such securities litigation and stockholder activism could give rise to perceived uncertainties as to our future, adversely affect our relationships with service providers and make it more difficult to attract and retain qualified personnel. Also, we may be required to incur significant legal fees and other expenses related to any securities litigation or activist stockholder matters. Further, our stock price could be subject to significant fluctuation or otherwise be adversely affected by the events, risks and uncertainties of any securities litigation or stockholder activism.
The effect of global climate change may impact the operations and valuation of our portfolio companies.
Climate change creates physical and financial risk and some of our portfolio companies may be adversely affected by climate change. For example, the needs of customers of energy companies vary with weather conditions, primarily temperature and humidity. To the extent weather conditions are affected by climate change, energy use could increase or decrease depending on the duration and magnitude of any changes. Increases in the cost of energy could adversely affect the cost of operations of our portfolio companies if the use of energy products or services is material to their business. A decrease in energy use due to weather changes may affect some of our portfolio companies’ financial condition through, for example, decreased revenues, which may, in turn, impact the valuation of such portfolio companies. Extreme weather conditions in general require more system backup, adding to costs, and can contribute to increased system stresses, including service interruptions.
In December 2015 the United Nations adopted a climate accord (the "Paris Agreement"), which the United States rejoined in 2021, with the long-term goal of limiting global warming and the short-term goal of significantly reducing greenhouse gas emissions. Additionally, the Inflation Reduction Act of 2022 included several measures designed to combat climate change, including restrictions on methane emissions. As a result, some of our portfolio companies may become subject to new or strengthened regulations or legislation, which could increase their operating costs and/or decrease their revenues, which may, in turn, impact their ability to make payments on our investments.
The Small Business Credit Availability Act ("SBCA") allows us to incur additional leverage, which could increase the risk of investing in our securities.
The SBCA amends the 1940 Act to permit a BDC to reduce the required minimum asset coverage ratio applicable to 150.0% (which means we can borrow $2 for every $1 of our equity), subject to certain requirements described therein. On April 12, 2018, our board of directors, including a "required majority" (as such term is defined in Section 57(o) of the 1940 Act) approved the application of the modified asset coverage requirements set forth in Section 61(a) of the 1940 Act, as amended by the SBCA, and recommended the submission of a proposal for stockholders to approve the application of the 150.0% minimum
asset coverage ratio to us at a special meeting of stockholders, which was held on June 8, 2018. The stockholder proposal was approved by the required votes of our stockholders at such special meeting of stockholders, and thus we became subject to the 150.0% minimum asset coverage ratio on June 9, 2018. Changing the asset coverage ratio permits us to double our leverage, which results in increased leverage risk and increased expenses.
Leverage magnifies the potential for loss on investments in our indebtedness and on invested equity capital. As we use leverage to partially finance our investments, you will experience increased risks of investing in our securities. If the value of our assets increases, then leveraging would cause the net asset value attributable to our common stock to increase more sharply than it would have had we not leveraged. Conversely, if the value of our assets decreases, leveraging would cause net asset value to decline more sharply than it otherwise would have had we not leveraged our business. Similarly, any increase in our income in excess of interest payable on the borrowed funds would cause our net investment income to increase more than it would without the leverage, while any decrease in our income would cause net investment income to decline more sharply than it would have had we not borrowed. Such a decline could negatively affect our ability to pay common stock dividends, scheduled debt payments or other payments related to our securities. Leverage is generally considered a speculative investment technique.
Additionally, in June 2018, legislation amending the 1958 Act increased the individual leverage limit available to a single SBIC from $150.0 million to $175.0 million, subject to SBA approval. SBICs are generally eligible to borrow up to the individual leverage limit as long as the licensee has at least $85.0 million in regulatory capital, has received a capital commitment from the SBA, and has been through an examination by the SBA subsequent to licensing. SBIC I and SBIC II operate under the prior $150.0 million cap. The maximum leverage available to a "family" of affiliated SBIC funds is $350.0 million, subject to SBA approval. We may issue additional SBIC debentures above the $225.0 million of SBA-guaranteed debentures previously permitted, pending application for and receipt of additional SBIC licenses. If we incur this additional indebtedness in the future, your risk of an investment in our securities may increase.
We incur significant costs as a result of being a publicly traded company.
As a publicly traded company, we incur legal, accounting and other expenses, which are paid by us, including costs associated with the periodic reporting requirements applicable to a company whose securities are registered under the Exchange Act, as well as additional corporate governance requirements, including requirements under the Sarbanes-Oxley Act of 2002, or the “Sarbanes-Oxley Act”, and other rules implemented by the SEC.
Efforts to comply with Section 404 of the Sarbanes-Oxley Act involve significant expenditures, and non-compliance with Section 404 of the Sarbanes-Oxley Act may adversely affect us and the market price of our common stock.
We are subject to the Sarbanes-Oxley Act, and the related rules and regulations promulgated by the SEC. Under current SEC rules, since our fiscal year ending December 31, 2012, our management has been required to report on our internal control over financial reporting pursuant to Section 404 of the Sarbanes-Oxley Act, and rules and regulations of the SEC thereunder. We are required to review on an annual basis our internal control over financial reporting, and on a quarterly and annual basis to evaluate and disclose changes in our internal control over financial reporting. As a result, we expect to continue to incur additional expenses, which may negatively impact our financial performance and our ability to make distributions to our stockholders. This process also may result in a diversion of management’s time and attention. We cannot be certain as to the timing of completion of any evaluation, testing and remediation actions or the impact of the same on our operations, and we are not able to ensure that the process is effective or that our internal control over financial reporting is or will continue to be effective in a timely manner. In the event that we are unable to maintain or achieve compliance with Section 404 of the Sarbanes-Oxley Act and related rules, we and, consequently, the market price of our common stock may be adversely affected.
Our business is highly dependent on information systems and systems failures could significantly disrupt our business, which may, in turn, negatively affect the market price of our common stock and our ability to pay distributions.
Our business is highly dependent on the communications and information systems of the Investment Adviser and its affiliates. Any failure or interruption of such systems could cause delays or other problems in our activities. This, in turn, could have a material adverse effect on our operating results and, consequently, negatively affect the market price of our common stock and our ability to pay distributions to our stockholders. In addition, because many of our portfolio companies operate and rely on network infrastructure and enterprise applications and internal technology systems for development, marketing, operational, support and other business activities, a disruption or failure of any or all of these systems in the event of a major telecommunications failure, cyber-attack, fire, earthquake, severe weather conditions or other catastrophic event could cause system interruptions, delays in product development and loss of critical data and could otherwise disrupt their business operations.
The failure of cybersecurity protection systems, as well as the occurrence of events unanticipated in our disaster recovery systems and management continuity planning, could impair our ability to conduct business effectively.
We, and others in our industry, are the targets of malicious cyber activity, which we work hard to prevent. A successful cyber-attack, whether perpetrated by criminal or state-sponsored actors, against us or our service providers, or an accidental disclosure of non-public information, could have an adverse effect on our ability to communicate or conduct business, negatively impacting our operations and financial condition. This adverse effect can become particularly acute if those events affect our electronic data processing, transmission, storage, and retrieval systems, or impact the availability, integrity, or confidentiality of our data.
We depend heavily upon computer systems to perform necessary business functions. Despite our implementation of a variety of security measures, our computer systems, networks, and data, like those of other companies, could be subject to unauthorized access, acquisition, use, alteration, or destruction, such as from the insertion of malware (including ransomware). physical and electronic break-ins or unauthorized tampering. If one or more of these events occurs, it could potentially jeopardize the confidential, proprietary, personal, and other information processed, stored in, and transmitted through our computer systems and networks. Such an attack could cause interruptions or malfunctions in our operations, which could result in financial losses, litigation, regulatory enforcement action and penalties, client dissatisfaction or loss, reputational damage, and increased costs associated with mitigation of damages and remediation.
If unauthorized parties gain access to such information and technology systems, they may be able to steal, publish, delete or modify private and sensitive information, including nonpublic personal information related to stockholders (and their beneficial owners) and material nonpublic information. The systems we have implemented to manage risks relating to these types of events could prove to be inadequate and, if compromised, could become inoperable for extended periods of time, cease to function properly or fail to adequately secure private information. Breaches such as those involving covertly introduced malware, impersonation of authorized users and industrial or other espionage may not be identified even with sophisticated prevention and detection systems, potentially resulting in further harm and preventing them from being addressed appropriately. The failure of these systems or of disaster recovery plans for any reason could cause significant interruptions in our and our Investment Adviser’s operations and result in a failure to maintain the security, confidentiality or privacy of sensitive data, including personal information relating to stockholders, material nonpublic information and other sensitive information in our possession.
A disaster or a disruption in the infrastructure that supports our business, including a disruption involving electronic communications or other services used by us or third parties with whom we conduct business, or directly affecting our headquarters, could have a material adverse impact on our ability to continue to operate our business without interruption. Our disaster recovery programs may not be sufficient to mitigate the harm that may result from such a disaster or disruption. In addition, insurance and other safeguards might only partially reimburse us for our losses, if at all.
Third parties with which we do business are sources of cybersecurity or other technological risk. We outsource certain functions and these relationships allow for the storage and processing of our information, as well as client, counterparty, employee, and borrower information. While we engage in actions to reduce our exposure resulting from outsourcing, ongoing threats may result in unauthorized access, acquisition, use, alteration, destruction, or other cybersecurity incident that affects our data, resulting in increased costs and other consequences as described above.
In addition, cybersecurity has become a top priority for regulators around the world, and some jurisdictions have enacted laws requiring companies to notify individuals of data security breaches involving certain types of personal data. If we fail to comply with the relevant laws and regulations, we could suffer financial losses, a disruption of our businesses, liability to investors, regulatory intervention or reputational damage.
We, the Investment Adviser and our portfolio companies are subject to risks associated with “phishing” and other cyber-attacks.
Our business and the business of our portfolio companies relies upon secure information technology systems for data processing, storage and reporting. Despite careful security and controls design, implementation and updating, ours and our portfolio companies’ information technology systems could become subject to cyber-attacks. Cyber-attacks include, but are not limited to, gaining unauthorized access to digital systems (e.g., through “hacking”, malicious software coding, social engineering or “phishing” attempts) for purposes of misappropriating assets or sensitive information, corrupting data, or causing operational disruption. Cyber-attacks may also be carried out in a manner that does not require gaining unauthorized access, such as causing denial-of service attacks on websites (i.e., efforts to make network services unavailable to intended users). The Investment Adviser’s employees have been and expect to continue to be the target of fraudulent calls, emails and other forms of activities. The result of these incidents may include disrupted operations, misstated or unreliable financial data, liability for stolen information, misappropriation of assets, increased cybersecurity protection and insurance costs, litigation and damage to our business relationships, regulatory fines or penalties, or other adverse effects on our business, financial condition or results of operations. In addition, we may be required to expend significant additional resources to modify our protective
measures and to investigate and remediate vulnerabilities or other exposures arising from operational and security risks related to cyber-attacks.
The Investment Adviser’s and other service providers’ increased use of mobile and cloud technologies could heighten the risk of a cyber-attack as well as other operational risks, as certain aspects of the security of such technologies may be complex, unpredictable or beyond their control. The Investment Adviser’s and other service providers’ reliance on mobile or cloud technology or any failure by mobile technology and cloud service providers to adequately safeguard their systems and prevent cyber-attacks could disrupt their operations and result in misappropriation, corruption or loss of personal, confidential or proprietary information. In addition, there is a risk that encryption and other protective measures against cyber-attacks may be circumvented, particularly to the extent that new computing technologies increase the speed and computing power available.
Additionally, remote working environments may be less secure and more susceptible to cyber-attacks, including phishing and social engineering attempts. Accordingly, the risks associated with cyber-attacks are heightened under current conditions.
RISKS RELATING TO OUR INVESTMENTS
Our investments in portfolio companies may be risky, and we could lose all or part of any of our investments.
Companies in which we invest could deteriorate as a result of, among other factors, an adverse development in their business, a change in the competitive environment or an economic downturn. As a result, companies which we expect to be stable may operate, or expect to operate, at a loss or have significant variations in operating results, may require substantial additional capital to support their operations or to maintain their competitive position, or may otherwise have a weak financial condition or be experiencing financial distress. In some cases, the success of our investment strategy will depend, in part, on the ability to restructure and effect improvements in the operations of a portfolio company. The activity of identifying and implementing restructuring programs and operating improvements at portfolio companies entails a high degree of uncertainty. There can be no assurance that any person (including us) will be able to successfully identify and implement such restructuring programs and improvements.
Although the Investment Adviser’s investment strategy includes a focus on tight control of risk, there can be no assurance that the various risks of an investment will be successfully controlled or that losses can be avoided.
Investments in small and middle market businesses are highly speculative and involve a high degree of risk of credit loss. These risks are likely to increase during volatile economic periods, such as the United States and many other economies have recently experienced. Among other things, these companies:
•may have limited financial resources and may be unable to meet their obligations under their debt instruments that we hold, which may be accompanied by a deterioration in the value of any collateral and a reduction in the likelihood of us realizing any guarantees from subsidiaries or affiliates of our portfolio companies that we may have obtained in connection with our investment, as well as a corresponding decrease in the value of any equity components of our investments;
•may have shorter operating histories, narrower product lines, smaller market shares and/or more significant customer concentrations than larger businesses, which tend to render them more vulnerable to competitors' actions and market conditions, as well as general economic downturns;
•are more likely to depend on the management talents and efforts of a small group of persons; therefore, the death, disability, resignation or termination of one or more of these persons could have a material adverse impact on our portfolio company and, in turn, on us;
•may be targets of cybersecurity or other technological risks;
•generally have less predictable operating results, may from time to time be parties to litigation, may be engaged in rapidly changing businesses with products subject to a substantial risk of obsolescence;
•may require substantial additional capital to support their operations, finance expansion or maintain their competitive position; and
•generally have less publicly available information about their businesses, operations and financial condition.
In addition, in the course of providing significant managerial assistance to certain of our eligible portfolio companies, certain of our officers and directors may serve as directors on the boards of such companies. To the extent that litigation arises out of our investments in these companies, our officers and directors may be named as defendants in such litigation, which could result in an expenditure of funds (through our indemnification of such officers and directors) and the diversion of management time and resources.
Our investment strategy, which is focused primarily on privately held companies, presents certain challenges, including the lack of available information about these companies.
We invest primarily in privately held companies. There is generally little public information about these companies, and, as a result, we must rely on the ability of the Investment Adviser to obtain adequate information to evaluate the potential returns from, and risks related to, investing in these companies. If we are unable to uncover all material information about these companies, we may not make a fully informed investment decision, and we may lose money on our investments. Also, privately held companies frequently have less diverse product lines and smaller market presence than larger competitors. They are, thus, generally more vulnerable to economic downturns and may experience substantial variations in operating results. These factors could adversely affect our investment returns.
Our investments in securities rated below investment grade are speculative in nature and are subject to additional risk factors such as increased possibility of default, illiquidity of the security, and changes in value based on changes in interest rates.
Our investments are almost entirely rated below investment grade or may be unrated, which are often referred to as “leveraged loans”, “high yield” or “junk” securities, and may be considered “high risk” compared to debt instruments that are rated investment grade. High yield securities are regarded as having predominantly speculative characteristics with respect to the issuer’s capacity to pay interest and repay principal in accordance with the terms of the obligations and involve major risk exposure to adverse conditions. In addition, high yield securities generally offer a higher current yield than that available from higher grade issues, but typically involve greater risk. These securities are especially sensitive to adverse changes in general economic conditions, to changes in the financial condition of their issuers and to price fluctuation in response to changes in interest rates. During periods of economic downturn or rising interest rates, issuers of below investment grade instruments may experience financial stress that could adversely affect their ability to make payments of principal and interest and increase the possibility of default.
Our portfolio may be concentrated in a limited number of industries, which may subject us to a risk of significant loss if there is a downturn in a particular industry in which a number of our investments are concentrated.
Our portfolio may be concentrated in a limited number of industries. For example, as of December 31, 2023, our investments in the software and the business services industries represented approximately 26.9% and 17.9%, respectively, of the fair value of our portfolio. A downturn in any particular industry in which we are invested could significantly impact the portfolio companies operating in that industry, and accordingly, the aggregate returns that we realize from our investment in such portfolio companies.
Specifically, companies in the business services industry are subject to general economic downturns and business cycles, and will often suffer reduced revenues and rate pressures during periods of economic uncertainty. In addition, companies in the software industry often have narrow product lines and small market shares. Because of rapid technological change, the average selling prices of products and some services provided by software companies have historically decreased over their productive lives. As a result, the average selling prices of products and services offered by software companies in which we invest may decrease over time. If an industry in which we have significant investments suffers from adverse business or economic conditions, as these industries have to varying degrees, a material portion of our investment portfolio could be affected adversely, which, in turn, could adversely affect our financial position and results of operations.
If we make unsecured investments, those investments might not generate sufficient cash flow to service their debt obligations to us.
We may make unsecured investments. Unsecured investments may be subordinated to other obligations of the obligor. Unsecured investments often reflect a greater possibility that adverse changes in the financial condition of the obligor or general economic conditions (including, for example, a substantial period of rising interest rates or declining earnings) or both may impair the ability of the obligor to make payment of principal and interest. If we make an unsecured investment in a portfolio company, that portfolio company may be highly leveraged, and its relatively high debt-to-equity ratio may increase the risk that its operations might not generate sufficient cash to service its debt obligations.
If we invest in the securities and obligations of distressed and bankrupt issuers, we might not receive interest or other payments.
From time to time, we may invest in other types of investments which are not our primary focus, including investments in the securities and obligations of distressed and bankrupt issuers, including debt obligations that are in covenant or payment default. Such investments generally are considered speculative. The repayment of defaulted obligations is subject to significant uncertainties. Defaulted obligations might be repaid only after lengthy workout or bankruptcy proceedings, during which the issuer of those obligations might not make any interest or other payments.
Defaults by our portfolio companies may harm our operating results.
A portfolio company’s failure to satisfy financial or operating covenants imposed by us or other lenders could lead to defaults and, potentially, termination of its loans and foreclosure on its secured assets, which could trigger cross-defaults under other agreements and jeopardize a portfolio company’s ability to meet its obligations under the debt or equity securities that we hold.
We may incur expenses to the extent necessary to seek recovery upon default or to negotiate new terms, which may include the waiver of certain financial covenants, with a defaulting portfolio company. In addition, lenders in certain cases can be subject to lender liability claims for actions taken by them when they become too involved in the borrower’s business or exercise control over a borrower. It is possible that we could become subject to a lender’s liability claim, including as a result of actions taken if we render significant managerial assistance to the borrower. Furthermore, if one of our portfolio companies were to file for bankruptcy protection, even though we may have structured our investment as senior secured debt, depending on the facts and circumstances, including the extent to which we provided managerial assistance to that portfolio company, a bankruptcy court might re-characterize our debt holding and subordinate all or a portion of our claim to claims of other creditors.
The lack of liquidity in our investments may adversely affect our business.
We invest, and will continue to invest, in companies whose securities are not publicly traded and whose securities will be subject to legal and other restrictions on resale or will otherwise be less liquid than publicly traded securities. The illiquidity of these investments may make it difficult for us to sell these investments when desired. In addition, if we are required or otherwise choose to liquidate all or a portion of our portfolio quickly, we may realize significantly less than the value at which we had previously recorded these investments. Our investments are usually subject to contractual or legal restrictions on resale or are otherwise illiquid because there is usually no established trading market for such investments. Because most of our investments are illiquid, we may be unable to dispose of them in which case we could fail to qualify as a RIC and/or a BDC, or we may be unable to do so at a favorable price, and, as a result, we may suffer losses.
Price declines and illiquidity in the corporate debt markets may adversely affect the fair value of our portfolio investments, reducing our net asset value through increased net unrealized depreciation.
As a BDC, we are required to carry our investments at market value or, if no market quotation is readily available, at fair value as determined in good faith by our board of directors. As part of the valuation process, we may take into account the following types of factors, if relevant, in determining the fair value of our investments:
•a comparison of the portfolio company's securities to publicly traded securities;
•the enterprise value of a portfolio company;
•the nature and realizable value of any collateral;
•the portfolio company's ability to make payments and its earnings and discounted cash flow;
•the markets in which the portfolio company does business; and
•changes in the interest rate environment and the credit markets generally that may affect the price at which similar investments may be made in the future and other relevant factors.
When an external event such as a purchase transaction, public offering or subsequent sale occurs, we will use the pricing indicated by the external event to corroborate our valuation. We will record decreases in the market values or fair values of our investments as unrealized depreciation. Declines in prices and liquidity in the corporate debt markets may result in significant net unrealized depreciation in our portfolio. The effect of all of these factors on our portfolio may reduce our net asset value by increasing net unrealized depreciation in our portfolio. Depending on market conditions, we could incur substantial realized losses and may suffer additional unrealized losses in future periods, which could have a material adverse effect on our business, financial condition, results of operations and cash flows.
If we are unable to make follow-on investments in our portfolio companies, the value of our investment portfolio could be adversely affected.
We may not have the funds or ability to make additional investments in our portfolio companies or to fund our unfunded debt commitments. We expect that certain of our investments will take the form of unfunded commitments that we will be contractually obligated to fund on the demand of a borrower or other counterparty. We will not be able to control when, or if, these unfunded debt commitments are funded.
Following an initial investment in a portfolio company, we may make additional investments in that portfolio company as “follow-on” investments, in order to, among other things, (i) increase or maintain in whole or in part our position as a creditor or equity ownership percentage in a portfolio company, (ii) exercise warrants, options or convertible securities that
were acquired in the original or subsequent financing or (iii) preserve or enhance the value of our initial and overall investment. We may elect not to make follow-on investments or may otherwise lack sufficient funds to make these investments. We have the discretion to make follow-on investments, subject to the availability of capital resources, and the limitations of the 1940 Act. If we fail to make follow-on investments, the continued viability of a portfolio company and our initial investment or may, in some circumstances, result in a missed opportunity for us to increase our participation in a successful operation and our expected return on the investment may be reduced. Even if we have sufficient capital to make a desired follow-on investment, we may elect not to make a follow-on investment because of regulatory, tax, diversification or asset profiles or we may not want to increase our concentration of risk, either because we prefer other opportunities or because we are subject to BDC requirements that would prevent such follow-on investments or such follow-on investments would adversely impact our ability to qualify for or maintain our RIC status.
Our portfolio companies may incur debt that ranks equally with, or senior to, our investments in such companies.
Our portfolio companies may incur debt that ranks equally with, or senior to, our investments in such companies. We invest in portfolio companies at all levels of the capital structure. Our portfolio companies may have, or may be permitted to incur, other debt that ranks equally with, or senior to, the debt in which we invest. By their terms, these debt instruments may entitle the holders to receive payment of interest or principal on or before the dates on which we are entitled to receive payments with respect to the debt instruments in which we invest. In addition, in the event of insolvency, liquidation, dissolution, reorganization or bankruptcy of a portfolio company, holders of debt instruments ranking senior to our investment in that portfolio company would typically be entitled to receive payment in full before we receive any distribution. After repaying the senior creditors, the portfolio company may not have any remaining assets to use for repaying its obligation to us. In the case of debt ranking equally with debt instruments in which we invest, we would have to share on an equal basis any distributions with other creditors holding such debt in the event of an insolvency, liquidation, dissolution, reorganization or bankruptcy of the relevant portfolio company.
The disposition of our investments may result in contingent liabilities.
Most of our investments will involve private securities. In connection with the disposition of an investment in private securities, we may be required to make representations about the business and financial affairs of the portfolio company typical of those made in connection with the sale of a business. We may also be required to indemnify the purchasers of such investment to the extent that any such representations turn out to be inaccurate or with respect to certain potential liabilities. These arrangements may result in contingent liabilities that ultimately yield funding obligations that must be satisfied through our return of certain distributions previously made to us.
There may be circumstances where our debt investments could be subordinated to claims of other creditors or we could be subject to lender liability claims.
Even though we may have structured certain of our investments as senior loans, if one of our portfolio companies were to go bankrupt, depending on the facts and circumstances, including the extent to which we actually provided managerial assistance to that portfolio company, a bankruptcy court might re-characterize our debt investment and subordinate all or a portion of our claim to that of other creditors. We may also be subject to lender liability claims for actions taken by us with respect to a borrower’s business or instances where we exercise control over the borrower. It is possible that we could become subject to a lender’s liability claim, including as a result of actions taken in rendering significant managerial assistance.
Second priority liens on collateral securing loans that we make to our portfolio companies may be subject to control by senior creditors with first priority liens. If there is a default, the value of the collateral may not be sufficient to repay in full both the first priority creditors and us.
Certain loans to portfolio companies will be secured on a second priority basis by the same collateral securing senior secured debt of such companies. The first priority liens on the collateral will secure the portfolio company’s obligations under any outstanding senior debt and may secure certain other future debt that may be permitted to be incurred by the portfolio company under the agreements governing the loans. The holders of obligations secured by the first priority liens on the collateral will generally control the liquidation of and be entitled to receive proceeds from any realization of the collateral to repay their obligations in full before us. In addition, the value of the collateral in the event of liquidation will depend on market and economic conditions, the availability of buyers and other factors. There can be no assurance that the proceeds, if any, from the sale or sales of all of the collateral would be sufficient to satisfy the loan obligations secured by the second priority liens after payment in full of all obligations secured by the first priority liens on the collateral. If such proceeds are not sufficient to repay amounts outstanding under the loan obligations secured by the second priority liens, then we, to the extent not repaid from the proceeds of the sale of the collateral, will only have an unsecured claim against the portfolio company’s remaining assets, if any.
The rights we may have with respect to the collateral securing the loans we make to our portfolio companies with senior debt outstanding may also be limited pursuant to the terms of one or more intercreditor agreements entered into with the
holders of first priority senior debt. Under an intercreditor agreement, at any time obligations which have the benefit of the first priority liens are outstanding, any of the following actions that may be taken in respect of the collateral will be at the direction of the holders of the obligations secured by the first priority liens: the ability to cause the commencement of enforcement proceedings against the collateral, the ability to control the conduct of such proceedings, the approval of amendments to collateral documents; releases of liens on the collateral and waivers of past defaults under collateral documents. We may not have the ability to control or direct these actions, even if our rights are adversely affected. In addition, a bankruptcy court may choose not to enforce an intercreditor agreement or other agreement with creditors.
Covenant-lite loans may offer us fewer protections than traditional investments.
Some of our debt investments may have less restrictive covenant terms that provide us with fewer protections, called "covenant-lite" loans, that generally provide for fewer financial covenants on the borrower. In particular, borrowers under such covenant-lite loans may have greater flexibility in how they manage their financial condition. As a result, we may face challenges in recovering on such covenant-lite loans, to the extent they go into distress, and may lack options that would normally be available to us as a lender under more traditional debt structures.
We generally do not control our portfolio companies.
Although we have taken and may in the future take controlling equity positions in our portfolio companies from time to time, we generally do not control most of our portfolio companies, even though we may have board representation or board observation rights, and our debt agreements may contain certain restrictive covenants that limit the business and operations of our portfolio companies. As a result, we are subject to the risk that a portfolio company may make business decisions with which we disagree and the management of such company may take risks or otherwise act in ways that do not serve our interests as debt investors. Due to the lack of liquidity of the investments that we typically hold in our portfolio companies, we may not be able to dispose of our investments in the event that we disagree with the actions of a portfolio company as readily as we would otherwise like to or at favorable prices which could decrease the value of our investments.
We do not have influence over the day-to-day management of portfolio companies or their retention of effective personnel.
Each portfolio company's day‑to‑day operations are the responsibility of such portfolio company's management team. Although the Investment Adviser is responsible for monitoring the performance of each portfolio investment, there can be no assurance that the existing management team, or any successor thereto, will be able to successfully operate the portfolio company in accordance with our plans and objectives. The success of each portfolio company depends in substantial part upon the skill and expertise of each portfolio company's management team. Additionally, portfolio companies will need to attract, retain and develop executives and members of their management teams. The market for executive talent is, notwithstanding general unemployment levels or developments within a particular industry, extremely competitive. There can be no assurance that portfolio companies will be able to attract, develop, integrate and retain suitable members of its management team and, as a result, such investment and we may be adversely affected thereby.
Economic recessions, downturns or government spending cuts could impair our portfolio companies and harm our operating results.
Many of our portfolio companies may be susceptible to economic slowdowns or recessions, and may be unable to repay its debt investments during these periods. Therefore, our non-performing assets are likely to increase, and the value of our portfolio is likely to decrease during these periods. Adverse economic conditions also may decrease the value of collateral securing some of our debt investments and the value of our equity investments. Economic slowdowns or recessions could lead to financial losses in our portfolio and a decrease in revenues, net income and assets. Unfavorable economic conditions also could increase our funding costs, limit our access to the capital markets or result in a decision by lenders not to extend credit to us. These events could prevent us from increasing investments and harm our operating results.
A number of our portfolio companies provide services to the U.S. government. Changes in the U.S. government’s priorities and spending, or significant delays or reductions in appropriations of the U.S. government’s funds, could have a material adverse effect on the financial position, results of operations and cash flows of such portfolio companies.
A number of our portfolio companies derive a substantial portion of their revenue from the U.S. government. Levels of the U.S. government’s spending in future periods are very difficult to predict and subject to significant risks. In addition, significant budgetary constraints may result in further reductions to projected spending levels. In particular, U.S. government expenditures are subject to the potential for automatic reductions, generally referred to as “sequestration.” Sequestration occurred during 2013, and may occur again in the future, resulting in significant additional reductions to spending by the U.S. government on both existing and new contracts as well as disruption of ongoing programs. Even if sequestration does not occur again in the future, we expect that budgetary constraints and ongoing concerns regarding the U.S. national debt will continue to place downward pressure on U.S. government spending levels. Due to these and other factors, overall U.S. government spending could decline, which could result in significant reductions to the revenues, cash flow and profits of our portfolio companies that provide services to the U.S. government.
Prepayments of our debt investments by our portfolio companies could adversely impact our results of operations and reduce our return on equity.
We are subject to the risk that the investments we make in our portfolio companies may be repaid prior to maturity. When this occurs, subject to qualification for or maintenance of our RIC status, we will generally reinvest these proceeds in temporary investments, pending our future investment in new portfolio companies. These temporary investments will typically have substantially lower yields than the debt being prepaid and we could experience significant delays in reinvesting these amounts. Any future investment in a new portfolio company may also be at lower yields than the debt that was repaid. As a result, our results of operations could be materially adversely affected if one or more of our portfolio companies elect to prepay amounts owed to us. Additionally, prepayments could negatively impact our return on equity, which could result in a decline in the market price of our common stock.
We may not realize gains from our equity-related investments.
When we invest in portfolio companies, we may acquire warrants or other equity-related securities of portfolio companies as well. We may also invest in equity-related securities directly. To the extent we hold equity investments, we will attempt to dispose of them and realize gains upon our disposition of them. However, the equity interests we receive may not appreciate in value and, in fact, may decline in value. As a result, we may not be able to realize gains from our equity interests, and any gains that we do realize on the disposition of any equity interests may not be sufficient to offset any other losses we experience. We also may be unable to realize any value if a portfolio company does not have a liquidity event, such as a sale of the business, recapitalization or public offering, which would allow us to sell the underlying equity interests.
Risks Relating to Due Diligence of and Conduct at Portfolio Companies
Before making portfolio investments, the Investment Adviser typically conducts due diligence that they deem reasonable and appropriate based on the facts and circumstances applicable to each portfolio investment. Due diligence may entail evaluation of important and complex business, financial, tax, accounting, environmental, social, governance and legal issues. When conducting due diligence and making an assessment regarding an investment, the Investment Adviser relies on the resources available to it, including information provided by the target of the investment and, in some circumstances, third‑party investigations. The due diligence investigation that the Investment Adviser carries out with respect to any investment opportunity may not reveal or highlight all relevant facts that may be necessary or helpful in evaluating such investment opportunity. Moreover, such an investigation will not necessarily result in the portfolio investment being successful. There can be no assurance that attempts to provide downside protection with respect to portfolio investments will achieve their desired effect and potential investors should regard an investment in us as being speculative and having a high degree of risk.
There can be no assurance that we will be able to detect or prevent irregular accounting, employee misconduct or other fraudulent practices during the due diligence phase or during our efforts to monitor the portfolio investment on an ongoing basis or that any risk management procedures implemented by us will be adequate. In the event of fraud by any portfolio company or any of its affiliates, we may suffer a partial or total loss of capital invested in that portfolio company. An additional concern is the possibility of material misrepresentation or omission on the part of the portfolio company or the seller. Such inaccuracy or incompleteness may adversely affect the value of our securities and/or instruments in such portfolio company. We rely upon the accuracy and completeness of representations made by portfolio companies and/or their former owners in the due diligence process to the extent reasonable when it makes our investments, but cannot guarantee such accuracy or completeness. Under certain circumstances, payments to us may be reclaimed if any such payment or distribution is later determined to have been a fraudulent conveyance or a preferential payment.
Consultants, legal advisors, appraisers, accountants, investment banks and other third parties may be involved in the due diligence process and/or the ongoing operation of our portfolio companies to varying degrees depending on the type of investment. For example, certain asset management, finance, administrative and other similar functions may be outsourced to a third‑party service provider whose fees and expenses will be borne by such portfolio company or us and will not offset the management fee. Such involvement of third‑party advisors or consultants may present a number of risks primarily relating to the Investment Adviser's reduced control of the functions that are outsourced. In addition, if the Investment Adviser is unable to timely engage third‑party providers, their ability to evaluate and acquire more complex targets could be adversely affected.
Our performance may differ from our historical performance as our current investment strategy includes significantly more primary originations in addition to secondary market purchases.
Historically, our investment strategy consisted primarily of secondary market purchases in debt securities. We adjusted that investment strategy to also include significantly more primary originations. While loans that we originate and loans we purchase in the secondary market face many of the same risks associated with the financing of leveraged companies, we may be exposed to different risks depending on specific business considerations for secondary market purchases or origination of loans. Primary originations require substantially more time and resources for sourcing, diligencing and monitoring investments, which may consume a significant portion of our resources. Further, the valuation process for primary originations may be more
cumbersome and uncertain due to the lack of comparable market quotes for the investment and would likely require more frequent review by a third-party valuation firm. This may result in greater costs for us and fluctuations in the quarterly valuations of investments that are primary originations. As a result, this strategy may result in different returns from these investments than the types of returns historically experienced from secondary market purchases of debt securities.
We may be subject to additional risks if we invest in foreign securities and/or engage in hedging transactions.
The 1940 Act generally requires that 70.0% of our investments be in issuers each of whom is, among other things, organized under the laws of, and has its principal place of business in the United States. Our investment strategy does not presently contemplate significant investments in securities of non-U.S. companies. However, we may desire to make such investments in the future, to the extent that such transactions and investments are permitted under the 1940 Act and any other applicable laws. We expect that these investments would focus on the same types of investments that we make in U.S. middle market companies and accordingly would be complementary to our overall strategy and enhance the diversity of our holdings. Investing in foreign companies could expose us to additional risks not typically associated with investing in U.S. companies. These risks include changes in exchange control regulations, political and social instability, expropriation, imposition of foreign taxes, less liquid markets and less available information than is generally the case in the U.S., higher transaction costs, less government supervision of exchanges, brokers and issuers, less developed bankruptcy laws, difficulty in enforcing contractual obligations, lack of uniform accounting and auditing standards and greater price volatility. Investments denominated in foreign currencies would be subject to the risk that the value of a particular currency will change in relation to one or more other currencies. Among the factors that may affect currency values are trade balances, the level of short-term interest rates, differences in relative values of similar assets in different currencies, long-term opportunities for investment and capital appreciation and political developments. We may employ hedging techniques to minimize these risks, but we can offer no assurance that we will, in fact, hedge currency risk, or that if we do, such strategies will be effective.
Engaging in hedging transactions would also, indirectly, entail additional risks to our stockholders. Although it is not currently anticipated that we would engage in hedging transactions as a principal investment strategy, if we determined to engage in hedging transactions, we generally would seek to hedge against fluctuations of the relative values of our portfolio positions from changes in market interest rates or currency exchange rates. Hedging against a decline in the values of our portfolio positions would not eliminate the possibility of fluctuations in the values of such positions or prevent losses if the values of the positions declined. However, such hedging could establish other positions designed to gain from those same developments, thereby offsetting the decline in the value of such portfolio positions.
These hedging transactions could also limit the opportunity for gain if the values of the underlying portfolio positions increased. Moreover, it might not be possible to hedge against an exchange rate or interest rate fluctuation that was so generally anticipated that we would not be able to enter into a hedging transaction at an acceptable price. If we choose to engage in hedging transactions, there can be no assurances that we will achieve the intended benefits of such transactions and, depending on the degree of exposure such transactions could create, such transactions may expose us to risk of loss.
While we may enter into these types of transactions to seek to reduce currency exchange rate and interest rate risks, unanticipated changes in currency exchange rates or interest rates could result in poorer overall investment performance than if we had not engaged in any such hedging transactions. In addition, the degree of correlation between price movements of the instruments used in a hedging strategy and price movements in the portfolio positions being hedged could vary. Moreover, for a variety of reasons, we might not seek to establish a perfect correlation between the hedging instruments and the portfolio holdings being hedged. Any imperfect correlation could prevent us from achieving the intended hedge and expose us to risk of loss. In addition, it might not be possible to hedge fully or perfectly against currency fluctuations affecting the value of securities denominated in non-U.S. currencies because the value of those securities would likely fluctuate as a result of factors not related to currency fluctuations.
Our ability to enter into transactions involving derivatives and unfunded commitment transactions may be limited.
In 2020, the SEC adopted Rule 18f-4 under the 1940 Act, which relates to the use of derivatives and other transactions that create future payment or delivery obligations by BDCs (and other funds that are registered investment companies). Under Rule 18f-4, for which compliance was required beginning in August 2022, BDCs that use derivatives are subject to a value-at-risk leverage limit, certain derivatives risk management program and testing requirements and requirements related to board reporting. These new requirements apply unless the BDC qualifies as a “limited derivatives user,” as defined in Rule 18f-4. A BDC that enters into reverse repurchase agreements or similar financing transactions could either (i) comply with the asset coverage requirements of Section 18, as modified by Section 61 of the 1940 Act, when engaging in reverse repurchase agreements or (ii) choose to treat such agreements as derivatives transactions under Rule 18f-4. In addition, under Rule 18f-4, a BDC may enter into an unfunded commitment agreement that is not a derivatives transaction, such as an agreement to provide financing to a portfolio company, if the BDC has a reasonable belief, at the time it enters into such an agreement, that it will have sufficient cash and cash equivalents to meet its obligations with respect to all of its unfunded commitment agreements, in each case as it becomes due. If the BDC cannot meet this requirement, it is required to treat the unfunded commitment as a
derivatives transaction subject to the aforementioned requirements of Rule 18f-4. Collectively, these requirements may limit our ability to use derivatives and/or enter into certain other financial contracts. We qualify as a “limited derivatives user,” and as a result the requirements applicable to us under Rule 18f-4 may limit our ability to use derivatives and enter into certain other financial contracts. However, if we fail to qualify as a limited derivatives user and become subject to the additional requirements under Rule 18f-4, compliance with such requirements may increase cost of doing business, which could have a material adverse effect on our business, financial condition, results of operations, and cash flows.
The alternative reference rates that have replaced LIBOR in our credit arrangements and other financial instruments may not yield the same or similar economic results as LIBOR over the life of such transactions.
LIBOR, the London Interbank Offered Rate, is an index rate that historically was widely used in lending transactions and was a common reference rate for setting the floating interest rate on private loans. LIBOR was typically the reference rate used in floating-rate loans extended to our portfolio companies.
The ICE Benchmark Administration (“IBA”) (the entity that is responsible for calculating LIBOR) ceased providing overnight, one, three, six and twelve months USD LIBOR tenors on June 30, 2023. In addition, the United Kingdom’s Financial Conduct Authority (“FCA”), which oversees the IBA, now prohibits entities supervised by the FCA from using LIBORs, including USD LIBOR, except in very limited circumstances.
In the United States, the Secured Overnight Financing Rate (“SOFR”) is the preferred alternative rate for LIBOR. SOFR is a measure of the cost of borrowing cash overnight, collateralized by U.S. Treasury securities, and is based on directly observable U.S. Treasury-backed repurchase transactions. SOFR is published by the Federal Reserve Bank of New York each U.S. Government Securities Business Day, for transactions made on the immediately preceding US. Government Securities Business Day. Alternative reference rates that have replaced LIBOR, including SOFR for USD transactions, may not yield the same or similar economic results as LIBOR over the lives of such transactions.
Substantially all of our loans that referenced LIBOR have been amended to reference the forward-looking term rate published by CME Group Benchmark Administration Limited based on the secured overnight financing rate (“CME Term SOFR”). CME Term SOFR rates are forward-looking rates that are derived by compounding projected overnight SOFR rates over one, three, and six months taking into account the values of multiple consecutive, executed, one-month and three-month CME Group traded SOFR futures contracts and, in some cases, over-the-counter SOFR Overnight Indexed Swaps as an indicator of CME Term SOFR reference rate values. CME Term SOFR and the inputs on which it is based are derived from SOFR. Since CME Term SOFR is a relatively new market rate, there will likely be no established trading market for credit agreements or other financial instruments when they are issued, and an established market may never develop or may not be liquid. Market terms for instruments referencing CME Term SOFR rates may be lower than those of later-issued CME Term SOFR indexed instruments. Similarly, if CME Term SOFR does not prove to be widely used, the trading price of instruments referencing CME Term SOFR may be lower than those of instruments indexed to indices that are more widely used.
RISKS RELATING TO OUR SECURITIES
The market price of our common stock may fluctuate significantly.
The market price and liquidity of the market for shares of our common stock may be significantly affected by numerous factors, some of which are beyond our control and may not be directly related to our operating performance. These factors include:
•price and volume fluctuations in the overall stock market or in the market for BDCs from time to time;
•investor demand for shares of our common stock;
•significant volatility in the market price and trading volume of securities of registered closed-end management investment companies, BDCs or other financial services companies, which is not necessarily related to the operating performance of these companies;
•the inability to raise equity capital;
•our inability to borrow money or deploy or invest our capital;
•fluctuations in interest rates;
•any shortfall in revenue or net income or any increase in losses from levels expected by investors or securities analysts;
•operating performance of companies comparable to us;
•changes in regulatory policies or tax guidelines with respect to RICs or BDCs;
•our loss of status as or ability to operate as a BDC;
•our failure to qualify as a RIC, loss of RIC status or ability to operate as a RIC;
•actual or anticipated changes in our earnings or fluctuations in our operating results;
•changes in the value of our portfolio of investments;
•general economic conditions, trends and other external factors;
•departures of key personnel; or
•loss of a major source of funding.
In addition, we are required to continue to meet certain listing standards in order for our common stock to remain listed on the NASDAQ Global Select Market ("NASDAQ"). If we were to be delisted by NASDAQ, the liquidity of our common stock would be materially impaired.
Investing in our common stock may involve an above average degree of risk.
The investments we may make may result in a higher amount of risk, volatility or loss of principal than alternative investment options. These investments in portfolio companies may be highly speculative and aggressive, and therefore, an investment in our common stock may not be suitable for investors with lower risk tolerance.
Sales of substantial amounts of our common stock in the public market may have an adverse effect on the market price of our common stock.
Sales of substantial amounts of our common stock could materially adversely affect the prevailing market prices for our common stock. If substantial amounts of our common stock were sold, this could impair our ability to raise additional capital through the sale of securities should we desire to do so.
Certain provisions of our certificate of incorporation and bylaws, as well as aspects of the Delaware General Corporation Law, could deter takeover attempts and have an adverse impact on the price of our common stock.
Our certificate of incorporation and bylaws as well as the Delaware General Corporation Law contain provisions that may have the effect of discouraging a third party from making an acquisition proposal for us. Among other things, our certificate of incorporation and bylaws:
•provide for a classified board of directors, which may delay the ability of our stockholders to change the membership of a majority of our board of directors;
•authorize the issuance of "blank check" preferred stock that could be issued by our board of directors to thwart a takeover attempt;
•do not provide for cumulative voting;
•provide that vacancies on the board of directors, including newly created directorships, may be filled only by a majority vote of directors then in office;
•provide that our directors may be removed only for cause;
•require supermajority voting to effect certain amendments to our certificate of incorporation and bylaws; and
•require stockholders to provide advance notice of new business proposals and director nominations under specific procedures.
These anti-takeover provisions may inhibit a change in control in circumstances that could give the holders of our common stock the opportunity to realize a premium over the market price for our common stock. Certain of the Holdings Credit Facility, the Unsecured Notes, the DB Credit Facility, the NMFC Credit Facility and the NMNLC Credit Facility II also include covenants that, among other things, restrict our ability to dispose of assets, incur additional indebtedness, make restricted payments, create liens on assets, make investments, make acquisitions and engage in mergers or consolidations. The Holdings Credit Facility, the Unsecured Notes (excluding the 8.250% Unsecured Notes), the DB Credit Facility and the NMFC Credit Facility also include change of control provisions that accelerate the indebtedness (or require prepayment of such indebtedness) under these agreements in the event of certain change of control events.
Shares of our common stock have traded at a discount from net asset value and may do so in the future.
Shares of BDCs have frequently traded at a market price that is less than the net asset value that is attributable to those shares. In part as a result of adverse economic conditions and increasing pressure within the financial sector of which we are a part, our common stock has at times traded below our net asset value per share since our IPO on May 19, 2011. Our shares could once again trade at a discount to net asset value. The possibility that our shares of common stock may trade at a discount from net asset value over the long term is separate and distinct from the risk that our net asset value will decrease. We cannot
predict whether shares of our common stock will trade above, at or below our net asset value. If our common stock trades below our net asset value, we will generally not be able to issue additional shares of our common stock without first obtaining the approval for such issuance from our stockholders and our independent directors. If additional funds are not available to us, we could be forced to curtail or cease our new lending and investment activities, and our net asset value could decrease and our level of distributions could be impacted.
You may not receive distributions or our distributions may decline or may not grow over time.
None of us, the Investment Adviser or their respective affiliates can provide any assurance whatsoever that we will be successful in choosing, making and realizing investments in any particular portfolio company or portfolio companies. There is no assurance that we will be able to generate returns for our investors or that the returns will be commensurate with the risks of investing in the type of companies and transactions described herein. While we expect to make regular distributions of income, there can be no assurance that any stockholder will receive any distribution from us. Partial or complete sales, transfers or other dispositions of portfolio investments which may result in a return of capital or the realization of gains, if any, are generally not expected to occur for a number of years after an investment is made. Accordingly, an investment in us should only be considered by persons for whom a speculative, illiquid and long‑term investment is an appropriate component of a larger investment program and who can afford a loss of their entire investment.
Past performance of investment entities associated with New Mountain Capital and its affiliates is not necessarily indicative of future results. There can be no assurance that we will achieve comparable results or that our performance objectives will be achieved. In particular, we do not expect to replicate the historical performance of New Mountain Capital's investments, or those of certain affiliates that have also elected to be regulated as a BDC, including New Mountain Guardian III BDC, L.L.C., New Mountain Guardian IV BDC, L.L.C., New Mountain Guardian IV Income Fund, L.L.C., and NMF SLF Inc. In addition, our investment strategies may differ from those of New Mountain Capital or its affiliates. We, as a BDC and as a RIC, are subject to certain regulatory restrictions that do not apply to New Mountain Capital or certain of its affiliates.
We are generally not permitted to invest in any portfolio company in which New Mountain Capital or any of its affiliates currently have an investment or to make any co‑investments with New Mountain Capital or its affiliates, except to the extent permitted by the 1940 Act, or pursuant to previously obtained exemptive orders. This may adversely affect the pace at which we make investments.
We will have broad discretion over the use of proceeds of any offering made pursuant to our prospectus.
We will have significant flexibility in applying the proceeds of any offering made pursuant to our prospectus. We will also pay operating expenses, and may pay other expenses such as due diligence expenses of potential new investments, from net proceeds. Our ability to achieve our investment objective may be limited to the extent that the net proceeds of the offering, pending full investment, are used to pay operating expenses. In addition, we can provide you no assurance that any offering will be successful, or that by increasing the size of our available equity capital, our aggregate expenses, and correspondingly, our expense ratio, will be lowered.
Your interest in NMFC may be diluted if you do not fully exercise your subscription rights in any rights offering.
In the event we issue subscription rights to purchase shares of our common stock, stockholders who do not fully exercise their rights should expect that they will, at the completion of the offer, own a smaller proportional interest in NMFC than would otherwise be the case if they fully exercised their rights. We cannot state precisely the amount of any such dilution in share ownership because we do not know at this time what proportion of the shares will be purchased as a result of the offer.
If we issue preferred stock, the net asset value and market value of our common stock will likely become more volatile.
We do not currently have any plans to issue preferred stock. However, to the extent that we do issue preferred stock in the future, we cannot assure you that the issuance of preferred stock would result in a higher yield or return to the holders of our common stock. The issuance of preferred stock would likely cause the net asset value and market price of the common stock to become more volatile. If the dividend rate on the preferred stock were to approach the net rate of return on our investment portfolio, the benefit of leverage to the holders of the common stock would be reduced. If the dividend rate on the preferred stock were to exceed the net rate of return on our portfolio, the leverage would result in a lower rate of return to the holders of common stock than if we had not issued preferred stock. Any decline in the net asset value of our investments would be borne entirely by the holders of common stock. Therefore, if the market value of our portfolio were to decline, the leverage would result in a greater decrease in net asset value to the holders of common stock than if we were not leveraged through the issuance of preferred stock. This greater net asset value decrease would also tend to cause a greater decline in the market price for the common stock.
We might be in danger of failing to maintain the required asset coverage of the preferred stock or of losing our ratings, if any, on the preferred stock or, in an extreme case, our current investment income might not be sufficient to meet the dividend requirements on the preferred stock. In order to counteract such an event, we might need to liquidate investments in order to
fund a redemption of some or all of the preferred stock. In addition, we would pay (and the holders of common stock would bear) all costs and expenses relating to the issuance and ongoing maintenance of the preferred stock, including higher advisory fees if our total return exceeds the dividend rate on the preferred stock. Holders of preferred stock may have different interests and rights than holders of common stock and may at times have disproportionate influence over our affairs.
Holders of any preferred stock we might issue would have the right to elect members of our board of directors and class voting rights on certain matters.
In accordance with the 1940 Act, holders of any preferred stock we might issue, voting separately as a single class, would have the right to elect two members of our board of directors at all times and in the event dividends become two full years in arrears would have the right to elect a majority of the directors until such arrearage is completely eliminated. In addition, preferred stockholders have class voting rights on certain matters, including changes in fundamental investment restrictions and conversion to open-end status, and accordingly can veto any such changes. Restrictions imposed on the declarations and payment of dividends or other distributions to the holders of our common stock and preferred stock, both by the 1940 Act and by requirements imposed by rating agencies, if any, or the terms of our credit facilities, if any, might impair our ability to maintain our tax treatment as a RIC for U.S. federal income tax purposes. While we would intend to redeem our preferred stock to the extent necessary to enable us to distribute our income as required to maintain our tax treatment as a RIC, there can be no assurance that such actions could be effected in time to meet the tax requirements.
Item 1B. Unresolved Staff Comments
None.
Item 1C. Cybersecurity
Risk Management and Strategy
We rely on the cybersecurity policies and procedures implemented by New Mountain Capital. New Mountain Capital has processes in place for assessing, identifying, and managing material risks from potential unauthorized occurrences on or through our electronic information systems that could adversely affect the confidentiality, integrity, or availability of our information systems or the information residing on those systems. These include a wide variety of controls, processes, systems, and tools that are designed to prevent, detect, or mitigate data loss, theft, misuse, unauthorized access, or other security incidents or vulnerabilities affecting our data. Pursuant to New Mountain Capital’s Information Security Program, the New Mountain Capital Information Technology Steering Committee (“ITSC”) is responsible for the development, evolution, and implementation of policies and technical measures to reasonably prevent security incidents. At times New Mountain Capital may also engage assessors, consultants, auditors, or other third parties to assist with assessing, identifying, and managing cybersecurity risks.
New Mountain Capital uses processes to oversee and identify material risks from cybersecurity threats, including those associated with the use of third-party service providers. Additionally, New Mountain Capital uses systems and processes designed to reduce the impact of a security incident at a third-party service provider. As part of its risk management process, New Mountain Capital also maintains an incident response plan that is utilized when cybersecurity incidents impacting us, our Investment Adviser, or our Administrator are detected. New Mountain Capital also requires that all employees, including employees of the Investment Adviser and Administrator, complete interactive security awareness training on an annual basis.
Material Impact of Cybersecurity Risks
As of the date of this report, we are not aware of any material risks from cybersecurity threats that have materially affected or are reasonably likely to materially affect the Company, including our business strategy, results of operations, or financial condition. However, future incidents could have a material impact on our business. Additional information about cybersecurity risks we face is discussed in Item 1A of Part I, “Risk Factors,” under the heading “The failure of cybersecurity protection systems, as well as the occurrence of events unanticipated in our disaster recovery systems and management continuity planning, could impair our ability to conduct business effectively,” which should be read in conjunction with the information above.
Governance
Our cybersecurity risks and associated mitigations are evaluated by our management and the ITSC as needed, but no less frequently than annually. Management and representatives of the ITSC periodically report to our board of directors on developments to the information security and cybersecurity risks we face. Reports include, among other things, an overview of New Mountain Capital’s controls and procedures related to assessing, identifying, and managing risks related to cybersecurity threats, oversight of third-party service providers and related cybersecurity threats, and management’s evaluation of cybersecurity risks material to us.
Item 2. Properties
We do not own any real estate or other physical properties materially important to our operations. Our principal executive offices are located at 1633 Broadway, 48th Floor, New York, New York 10019, where we occupy our office space pursuant to our Administration Agreement with the Administrator. The office space is shared with our Investment Adviser, our Administrator and New Mountain Capital. We believe that our current office facilities are suitable and adequate for our business as currently conducted.
Item 3. Legal Proceedings
We, and our consolidated subsidiaries, the Investment Adviser and the Administrator are not currently subject to any material pending legal proceedings threatened against us as of December 31, 2023. From time to time, we may be a party to certain legal proceedings incidental to the normal course of our business including the enforcement of our rights under contracts with our portfolio companies. While the outcome of these legal proceedings cannot be predicted with certainty, we do not expect that these proceedings will have a material effect upon our business, financial condition or results of operations.
Item 4. Mine Safety Disclosures
Not applicable.
PART II
Item 5. Market for Registrant's Common Equity, Related Stockholder Matters and Issuer Purchases of Equity Securities
Price Range of Common Stock and Distributions
New Mountain Finance Corporation's ("NMFC", the "Company", "we", "us" or "our") common stock is traded on the NASDAQ Global Select Market ("NASDAQ") under the symbol "NMFC". The following table sets forth the net asset value ("NAV") per share of our common stock, the high and low closing sale price for our common stock, the closing sale price as a percentage of NAV and the quarterly distributions per share for each fiscal quarter for the years ended December 31, 2023 and December 31, 2022. | | | | | | | | | | | | | | | | | | | | | | | | | | | | | | | | | | | | | | |
| | | | Closing Sales Price (2) | | | | | | |
| Fiscal Year Ended | | NAV Per Share (1) | | High | | Low | | (Discount) Premium of High Closing Sales Price to NAV (3) | | (Discount) Premium of Low Closing Sales Price to NAV (3) | | Declared Distributions Per Share (4)(5) |
| December 31, 2023 | | | | | | | | | | | | |
| Fourth Quarter | | $ | 12.87 | | | $ | 13.21 | | | $ | 12.25 | | | 2.64 | % | | (4.82) | % | | $ | 0.46 | (6) |
| Third Quarter | | $ | 13.06 | | | $ | 13.10 | | | $ | 12.48 | | | 0.31 | % | | (4.44) | % | | $ | 0.36 | (7) |
| Second Quarter | | $ | 13.14 | | | $ | 12.69 | | | $ | 11.42 | | | (3.42) | % | | (13.09) | % | | $ | 0.35 | (8) |
| First Quarter | | $ | 13.14 | | | $ | 13.11 | | | $ | 11.63 | | | (0.23) | % | | (11.49) | % | | $ | 0.32 | |
| December 31, 2022 | | | | | | | | | | | | |
| Fourth Quarter | | $ | 13.02 | | | $ | 12.80 | | | $ | 11.40 | | | (1.71) | % | | (12.46) | % | | $ | 0.32 | |
| Third Quarter | | $ | 13.20 | | | $ | 13.50 | | | $ | 11.26 | | | 2.27 | % | | (14.70) | % | | $ | 0.30 | |
| Second Quarter | | $ | 13.42 | | | $ | 13.91 | | | $ | 11.20 | | | 3.65 | % | | (16.54) | % | | $ | 0.30 | |
| First Quarter | | $ | 13.56 | | | $ | 13.85 | | | $ | 12.94 | | | 2.14 | % | | (4.57) | % | | $ | 0.30 | |
(1)NAV is determined as of the last date in the relevant quarter and therefore may not reflect the NAV per share on the date of the high and low closing sales prices. The NAVs shown are based on outstanding shares at the end of each period.
(2)Closing sales price is determined as the high or low closing sales price noted within the respective quarter, not adjusted for distributions.
(3)Calculated as of the respective high or low closing sales price divided by the quarter end NAV.
(4)Represents the distributions declared or paid for the specified quarter.
(5)Tax characteristics of all distributions paid are reported to stockholders on Form 1099 after the end of the calendar year.
(6)Includes a regular quarterly distribution of $0.32 per share, a supplemental distribution related to third quarter earnings of $0.04 per share and a special distribution of $0.10 per share.
(7)Includes a regular quarterly distribution of $0.32 per share and a supplemental distribution related to second quarter earnings of $0.04 per share.
(8)Includes a regular quarterly distribution of $0.32 per share and a supplemental distribution related to first quarter earnings of $0.03 per share.
As of February 22, 2024, we had thirteen stockholders of record and one beneficial owner whose shares are held in the names of brokers, dealers, funds, trusts and clearing agencies.
Shares of BDCs may trade at a market price that is less than the value of the net assets attributable to those shares. The possibility that our shares of common stock will trade at a discount from NAV or at premiums that are unsustainable over the long term are separate and distinct from the risk that our NAV will decrease. Since our initial public offering on May 19, 2011, our shares of common stock have traded at times at both a discount and a premium to the net assets attributable to those shares. As of February 22, 2024, our shares of common stock traded at a discount of approximately 1.4% of the NAV attributable to those shares as of December 31, 2023. It is not possible to predict whether the shares offered hereby will trade at, above, or below NAV.
Distributions
We intend to pay quarterly distributions to our stockholders in amounts sufficient to maintain our status as a RIC. We intend to distribute approximately our entire net investment income on a quarterly basis and substantially all of our taxable income on an annual basis, except that we may retain certain net capital gains for reinvestment. The distributions we pay to our stockholders in a year may exceed our taxable income for that year and, accordingly, a portion of such distributions may constitute a return of capital, which is a return of a portion of a stockholders original investment in our common stock, for U.S. federal income tax purposes. Generally, a return of capital will reduce an investor's adjusted tax basis in our stock for U.S. federal income tax purposes, which will result in a higher tax liability when the stock is sold. The specific tax characteristics of our distributions will be reported to stockholders after the end of the calendar year.
We maintain an "opt out" dividend reinvestment plan on behalf of our stockholders, pursuant to which each of our stockholders' cash distributions will be automatically reinvested in additional shares of our common stock, unless the stockholder elects to receive cash.
We apply the following in implementing the dividend reinvestment plan. If the price at which newly issued shares are to be credited to stockholders' accounts is equal to or greater than 110.0% of the last determined NAV of the shares, we will use only newly issued shares to implement the dividend reinvestment plan. Under such circumstances, the number of shares to be issued to a stockholder is determined by dividing the total dollar amount of the distribution payable to such stockholder by the market price per share of our common stock on NASDAQ on the distribution payment date. Market price per share on that date will be the closing price for such shares on NASDAQ or, if no sale is reported for such day, the average of their electronically reported bid and ask prices.
If the price at which newly issued shares are to be credited to stockholders' accounts is less than 110.0% of the last determined NAV of the shares, we will either issue new shares or instruct the plan administrator to purchase shares in the open market to satisfy the additional shares required. Shares purchased in open market transactions by the plan administrator will be allocated to a stockholder based on the average purchase price, excluding any brokerage charges or other charges, of all shares of common stock purchased in the open market. The number of shares of our common stock to be outstanding after giving effect to payment of the distribution cannot be established until the value per share at which additional shares will be issued has been determined and elections of our stockholders have been tabulated. See Item 8.—Financial Statements and Supplementary Data—Note 2. Summary of Significant Accounting Policies for discussion on our distributions policy in this Annual Report on Form 10-K for additional information.
Unregistered Sales of Equity Securities
We did not engage in unregistered sales of equity securities during the year ended December 31, 2023.
Issuer Purchases of Equity Securities
Dividend Reinvestment Plan
During the year ended December 31, 2023, as part of our dividend reinvestment plan for our common stockholders, our dividend reinvestment plan administrator purchased 418,007 shares of our common stock for $5.3 million in the open market in order to satisfy the reinvestment portion of our distribution.
The following table outlines purchases by our dividend reinvestment administrator of our common stock for this purpose during the year ended December 31, 2023. | | | | | | | | | | | | | | | | | | | | | | | | | | |
| (in thousands, except shares and per share data) | | Total Number of | | Weighted Average Price | | Total Number of Shares Purchased as Part of Publicly Announced Plans | | Maximum Number (or Approximate Dollar Value) of Shares that May Yet Be Purchased Under the |
| Period | | Shares Purchased | | Paid Per Share | | or Programs | | Plans or Programs |
| January 2023 | | 101,878 | | | $ | 12.46 | | | — | | | $ | — | |
| February 2023 | | — | | | — | | | — | | | — | |
| March 2023 | | — | | | — | | | — | | | — | |
| April 2023 | | 93,064 | | | 12.30 | | | — | | | — | |
| May 2023 | | — | | | — | | | — | | | — | |
| June 2023 | | — | | | — | | | — | | | — | |
| July 2023 | | 97,800 | | | 12.64 | | | — | | | — | |
| August 2023 | | — | | | — | | | — | | | — | |
| September 2023 | | — | | | — | | | — | | | — | |
| October 2023 | | 125,265 | | | 12.82 | | | — | | | — | |
| November 2023 | | — | | | — | | | — | | | — | |
| December 2023 | | — | | | — | | | — | | | — | |
| Total | | 418,007 | | | $ | 12.57 | | | — | | | $ | — | |
Stock Repurchase Program
On February 4, 2016, our board of directors authorized a program for the purpose of repurchasing up to $50.0 million worth of our common stock (the "Repurchase Program"). Under the Repurchase Program, we were permitted, but were not obligated to, repurchase our outstanding common stock in the open market from time to time, provided that we complied with our code of ethics and the guidelines specified in Rule 10b-18 of the Securities Exchange Act of 1934, as amended (the "Exchange Act"), including certain price, market volume and timing constraints. In addition, any repurchases were conducted in accordance with the 1940 Act. On December 8, 2023, our board of directors extended our Repurchase Program and we expect the Repurchase Program to be in place until the earlier of December 31, 2024 or until $50.0 million of outstanding shares of common stock have been repurchased. To date, approximately $2.9 million of our common stock has been repurchased by us under the Repurchase Program. We did not repurchase any shares of our common stock under the Repurchase Program during the year ended December 31, 2023.
Stock Performance Graph
This graph compares the return on our common stock with that of the Standard & Poor's 500 Total Return Index ("S&P 500 TR") and the Russell 2000 Index Total Return ("Russell 2000 TR") as we do not believe that there is an appropriate index of companies with an investment strategy similar to our own with which to compare the return on our common stock, for the period May 19, 2011 (commencement of operations) to December 31, 2023. The graph assumes that, on May 19, 2011, a person invested $100 in each of our common stock, the S&P 500 TR and the Russell 2000 TR. The graph measures total stockholder return, which takes into account both changes in stock price and distributions. It assumes that distributions paid are invested in like securities.
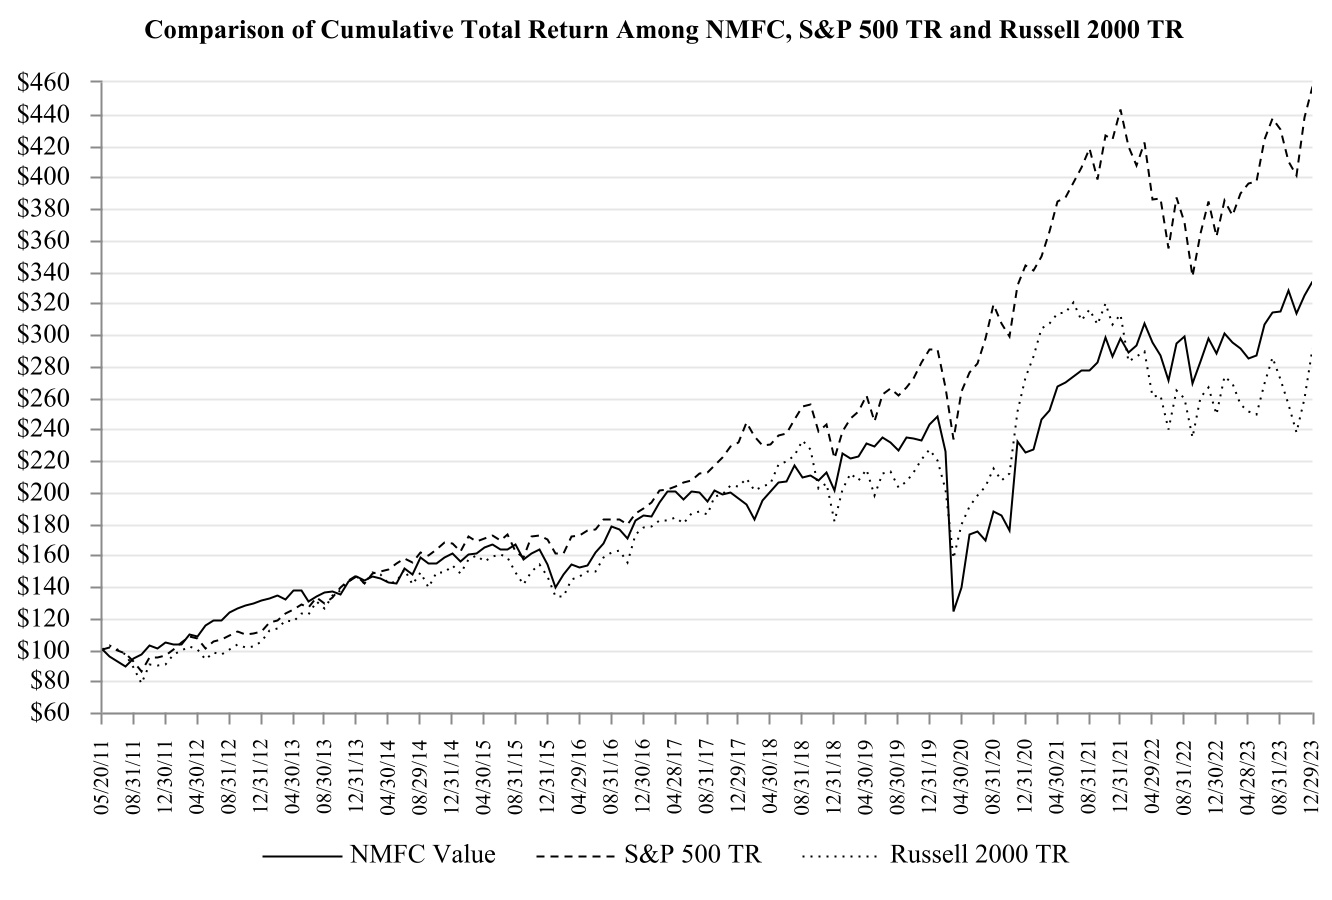
The graph and other information furnished under this Part II, Item 5 in this Annual Report on Form 10-K shall not be deemed to be "soliciting material" or to be filed with the U.S. Securities and Exchange Commission (the "SEC") or subject to Regulation 14A or 14C, or to the liabilities of Section 18 of the Exchange Act. The stock price performance included in the above graph is not necessarily indicative of future stock performance.
Fees and Expenses
The following table is intended to assist you in understanding the costs and expenses that you will bear directly or indirectly. We caution you that some of the percentages indicated in the table below are estimates and may vary. Except where the context suggests otherwise, whenever this Annual Report on Form 10-K contains a reference to fees or expenses paid by "you", "NMFC", or "us" or that "we", "NMFC", or the "Company" will pay fees or expenses, we will pay such fees and expenses out of our net assets and, consequently, you will indirectly bear such fees or expenses as an investor in us. However, you will not be required to deliver any money or otherwise bear personal liability or responsibility for such fees or expenses. | | | | | | | | |
| Stockholder transaction expenses: | | |
| Sales load (as a percentage of offering price) | N/A | (1) |
| Offering expenses borne by us (as a percentage of offering price) | N/A | (2) |
| Dividend reinvestment plan expenses (per sales transaction fee) | $ | 15.00 | | (3) |
| Total stockholder transaction expenses (as a percentage of offering price) | — | % | |
| Annual expenses (as a percentage of net assets attributable to common stock) | | |
| Base management fees | 3.46 | % | (4) |
| Incentive fees payable under the Investment Management Agreement | 2.90 | % | (5) |
| Interest payments on borrowed funds | 8.64 | % | (6) |
| Other expenses | 0.78 | % | (7) |
| Acquired fund fees and expenses | 3.75 | % | (8) |
| Total annual expenses | 19.53 | % | (9) |
| Base management fee waiver | (0.31) | % | (10) |
| | |
| Total annual expenses after the base management fee waiver | 19.22 | % | (9)(10) |
(1)If applicable, the prospectus or prospectus supplement relating to an offering of our common stock will disclose the applicable sales load.
(2)The prospectus supplement corresponding to each offering will disclose the applicable estimated amount of offering expenses of the offering and the offering expenses borne by us as a percentage of the offering price.
(3)If a participant elects by written notice to the plan administrator to have the plan administrator sell part or all of the shares held by the plan administrator in the participant's account and remit the proceeds to the participant, the plan administrator is authorized to deduct a $15.00 transaction fee plus a $0.10 per share brokerage commission from the proceeds. The expenses of the dividend reinvestment plan are included in "other expenses." The plan administrator's fees will be paid by us. There will be no brokerage charges or other charges to stockholders who participate in the plan. See Item 8—Financial Statements and Supplementary Data—Note 2. Summary of Significant Accounting Policies in this Annual Report on Form 10-K for additional details regarding our dividend reinvestment plan.
(4)The base management fee as of November 1, 2021 pursuant to Amendment No. 1 to the Investment Management Agreement is based on an annual rate of 1.4% of our average gross assets for the two most recent quarters, which equals our total assets on the Consolidated Statements of Assets and Liabilities less cash and cash equivalents. Prior to November 1, 2021, pursuant to the Investment Management Agreement, the base management fee was calculated at an annual rate of 1.75% of our average gross assets for the two most recent quarters less (i) the borrowings under the New Mountain SPV Funding LLC Loan and Security Agreement, as amended and restated, dated October 27, 2020 (the "SLF Credit Facility") and (ii) cash and cash equivalents. We have not invested, and currently do not invest, in derivatives. To the extent we invest in derivatives in the future, we will use the actual value of the derivatives, as reported on our Consolidated Statements of Assets and Liabilities, for purposes of calculating our base management fee. The base management fee reflected in the table above is based on the year ended December 31, 2023 and is calculated without deducting any management fees waived.
(5)Assumes that annual incentive fees earned by the Investment Adviser remain consistent with the gross incentive fees earned by the Investment Adviser during the year ended December 31, 2023 and calculated without deducting any incentive fees waived. As of December 31, 2023, we did not have a capital gains incentive fee accrual. As we cannot predict whether we will meet the thresholds for incentive fees under the Investment Management Agreement, the incentive fees paid in subsequent periods, if any, may be substantially different than the fees incurred during the year
ended December 31, 2023. For more detailed information about the incentive fee calculations, see Item 1 — Business — Investment Management Agreement in this Annual Report on Form 10-K.
(6)We may borrow funds from time to time to make investments to the extent we determine that additional capital would allow us to take advantage of additional investment opportunities or if the economic situation is otherwise conducive to doing so. The costs associated with these borrowings are indirectly borne by our stockholders. As of December 31, 2023, we had $515.1 million, $506.5 million, $300.0 million, $260.0 million, $186.4 million, $36.8 million and $2.9 million of indebtedness outstanding under the Holdings Credit Facility, the Unsecured Notes, the SBA-guaranteed debentures, the 2022 Convertible Notes, the DB Credit Facility, the NMFC Credit Facility and the NMNLC Credit Facility II, respectively. Under the NMFC Credit Facility, we may borrow in U.S. dollars or certain other permitted currencies. As of December 31, 2023, we had borrowings denominated in British Pound Sterling ("GBP") of £22.9 million and Euro ("EUR") of €0.7 million that have been converted to United States dollars. For purposes of this calculation, we have assumed the December 31, 2023 amounts outstanding under the Holdings Credit Facility, Unsecured Notes, SBA-guaranteed debentures, 2022 Convertible Notes, DB Credit Facility, NMFC Credit Facility and NMNLC Credit Facility II, and have computed interest expense using an assumed interest rate of 7.8% for the Holdings Credit Facility, 5.5% for the Unsecured Notes, 2.7% for the SBA-guaranteed debentures, 7.5% for the 2022 Convertible Notes, 8.1% for the DB Credit Facility, 7.3% for the NMFC Credit Facility and 7.7% for the NMNLC Credit Facility II, which were the rates payable as of December 31, 2023. See Item 7 — Management's Discussion and Analysis of Financial Condition and Results of Operations — Borrowings in this Annual Report on Form 10-K.
(7)"Other expenses" include our overhead expenses, including payments by us under the Administration Agreement based on the allocable portion of overhead and other expenses incurred by the Administrator in performing its obligations to us under the Administration Agreement. Pursuant to the Administration Agreement, the Administrator may, in its own discretion, submit to us for reimbursement some or all of the expenses that the Administrator has incurred on our behalf during any quarterly period. As a result, the amount of expenses for which we will have to reimburse the Administrator may fluctuate in future quarterly periods and there can be no assurance given as to when, or if, the Administrator may determine to limit the expenses that the Administrator submits to us for reimbursement in the future. However, it is expected that the Administrator will continue to support part of our expense burden in the near future and may decide to not calculate and charge through certain overhead related amounts as well as continue to cover some of the indirect costs. The Administrator cannot recoup any expenses that the Administrator has previously waived. This expense ratio is calculated without deducting any expenses waived or reimbursed by the Administrator. For the year ended December 31, 2023, the indirect administrative expenses that our Administrator did not waive of approximately $2.3 million represented approximately 0.07% of our gross assets. See Item 8 — Financial Statements and Supplementary Data — Note 5. Agreements in this Annual Report on Form 10-K.
(8)The holders of shares of our common stock indirectly bear the expenses of our investment in NMFC Senior Loan Program III ("SLP III") and NMFC Senior Loan Program IV ("SLP IV"). As SLP III and SLP IV are structured as private joint ventures, no management fees are paid by SLP III and SLP IV. Future expenses for SLP III and SLP IV may be substantially higher or lower because certain expenses may fluctuate over time.
(9)The holders of shares of our common stock indirectly bear the cost associated with our annual expenses.
(10)Effective as of and for the quarter ended March 31, 2021 through the quarter ending December 31, 2024, the Investment Adviser entered into a fee waiver agreement (the “Fee Waiver Agreement”), amended on August 7, 2023, pursuant to which the Investment Adviser will waive base management fees in order to reach a target base management fee of 1.25% on gross assets (the “Reduced Base Management Fee”). The Fee Waiver Agreement was most recently extended for a period of one year through the quarter ending December 31, 2024 by the Investment Adviser on August 7, 2023. The Investment Adviser cannot recoup management fees that the Investment Adviser has previously waived. The base management fee waiver reflected in the table above is based on the base management fees waived during the year ended December 31, 2023. See Item 8 — Financial Statements and Supplementary Data — Note 5. Agreements in this Annual Report on Form 10-K.
Example
The following example, required by the SEC, demonstrates the projected dollar amount of total cumulative expenses that would be incurred over various periods with respect to a hypothetical investment in our common stock. In calculating the following expense amounts, we have assumed that our borrowings and annual operating expenses would remain at the levels set forth in the table above. See footnote 6 above for additional information regarding certain assumptions regarding our level of leverage. | | | | | | | | | | | | | | | | | | | | | | | |
| 1 Year | | 3 Years | | 5 Years | | 10 Years |
| You would pay the following expenses on a $1,000 investment, assuming a 5.0% annual return without realization of any capital gains | $ | 166 | | | $ | 439 | | | $ | 649 | | | $ | 982 | |
The example should not be considered a representation of future expenses, and actual expenses may be greater or less than those shown.
While the example assumes, as required by the applicable rules of the SEC, a 5.0% annual return, our performance will vary and may result in a return greater or less than 5.0%. The incentive fee under the Investment Management Agreement, which, assuming a 5.0% annual return, would either not be payable or would have an insignificant impact on the expense amounts shown above, is not included in the above example. The above illustration assumes that we will not realize any capital gains (computed net of all realized capital losses and unrealized capital depreciation) in any of the indicated time periods. If we achieve sufficient returns on our investments, including through the realization of capital gains, to trigger an incentive fee of a material amount, our expenses and returns to our investors would be higher. For example, if we assumed that we received our 5.0% annual return completely in the form of net realized capital gains on our investments, computed net of all cumulative unrealized depreciation on our investments, the projected dollar amount of total cumulative expenses set forth in the above illustration would be as follows: | | | | | | | | | | | | | | | | | | | | | | | |
| 1 Year | | 3 Years | | 5 Years | | 10 Years |
| You would pay the following expenses on a $1,000 investment, assuming a 5.0% annual return completely in the form of net realized capital gains | $ | 175 | | | $ | 457 | | | $ | 670 | | | $ | 998 | |
The example assumes no sales load. In addition, while the examples assume reinvestment of all distributions at net asset value, participants in our dividend reinvestment plan will receive a number of shares of our common stock determined by dividing the total dollar amount of the distribution payable to a participant by the market price per share of our common stock at the close of trading on the dividend payment date. The market price per share of our common stock may be at, above or below net asset value. See Item 5 — Market for Registrant's Common Equity, Related Stockholder Matters and Issuer Purchases of Equity Securities — Dividend Reinvestment Plan in this Annual Report on Form 10-K for additional information regarding the dividend reinvestment plan.
Financial Highlights
The following information sets forth the Company's financial highlights for the years ended December 31, 2023, December 31, 2022, December 31, 2021, December 31, 2020 and December 31, 2019. | | | | | | | | | | | | | | | | | | | | | | | | | | | | | |
| Year Ended December 31, |
| 2023 | | 2022 | | 2021 | | 2020 | | 2019 |
| Per share data(1): | | | | | | | | | |
| Net asset value at the beginning of the period | $ | 13.02 | | | $ | 13.49 | | | $ | 12.62 | | | $ | 13.26 | | | $ | 13.22 | |
| Net investment income | 1.57 | | | 1.18 | | | 1.21 | | | 1.20 | | | 1.37 | |
| Net realized and unrealized (losses) gains(2) | (0.23) | | | (0.43) | | | 0.86 | | | (0.60) | | | 0.03 | |
| | | | | | | | | |
| | | | | | | | | |
| | | | | | | | | |
| Total net increase | 1.34 | | | 0.75 | | | 2.07 | | | 0.60 | | | 1.40 | |
| Distributions declared to stockholders from net investment income | (1.49) | | | (1.22) | | | (1.20) | | | (1.24) | | | (1.36) | |
| | | | | | | | | |
| Net asset value at the end of the period | $ | 12.87 | | | $ | 13.02 | | | $ | 13.49 | | | $ | 12.62 | | | $ | 13.26 | |
| Per share market value at the end of the period | $ | 12.72 | | | $ | 12.37 | | | $ | 13.70 | | | $ | 11.36 | | | $ | 13.74 | |
| Total return based on market value(3) | 15.48 | % | | (0.56) | % | | 31.91 | % | | (5.24) | % | | 20.45 | % |
| Total return based on net asset value(4) | 10.64 | % | | 5.71 | % | | 16.97 | % | | 5.52 | % | | 10.90 | % |
| Shares outstanding at end of period | 102,558,859 | | | 100,937,026 | | | 97,907,441 | | | 96,827,342 | | | 96,827,342 | |
| Average weighted shares outstanding for the period | 101,118,302 | | | 100,202,847 | | | 96,952,959 | | | 96,827,342 | | | 85,209,378 | |
| Average net assets for the period | $ | 1,323,778 | | | $ | 1,344,266 | | | $ | 1,261,338 | | | $ | 1,168,043 | | | $ | 1,154,615 | |
| Ratio to average net assets: | | | | | | | | | |
| Net investment income | 12.00 | % | | 8.82 | % | | 9.32 | % | | 10.05 | % | | 10.15 | % |
| Total expenses, before waivers/reimbursements | 16.54 | % | | 13.35 | % | | 13.11 | % | | 14.56 | % | | 14.87 | % |
| Total expenses, net of waivers/reimbursements | 16.23 | % | | 13.01 | % | | 12.05 | % | | 13.39 | % | | 13.80 | % |
| Average debt outstanding—Holdings Credit Facility | $ | 577,759 | | | $ | 581,367 | | | $ | 478,016 | | | $ | 526,645 | | | $ | 598,129 | |
| Average debt outstanding—Unsecured Notes (5) | 438,473 | | | 526,829 | | | 516,611 | | | 453,250 | | | 414,949 | |
| Average debt outstanding—Convertible Notes (6) | 320,494 | | | 228,806 | | | 201,250 | | | 201,250 | | | 234,332 | |
| Average debt outstanding—SBA-guaranteed debentures | 300,000 | | | 300,000 | | | 300,000 | | | 285,852 | | | 179,408 | |
| Average debt outstanding—DB Credit Facility | 186,422 | | | 209,898 | | | 209,307 | | | 233,649 | | | 113,967 | |
| Average debt outstanding—NMFC Credit Facility(7) | 103,244 | | | 133,053 | | | 132,685 | | | 155,497 | | | 105,533 | |
| Average debt outstanding—NMNLC Credit Facility II(8) | 2,506 | | | 7,195 | | | 3,501 | | | — | | | — | |
| Average debt outstanding—NMNLC Credit Facility(9) | — | | | — | | | — | | | — | | | 1,471 | |
| Asset coverage ratio(10) | 187.54 | % | | 177.42 | % | | 181.21 | % | | 180.68 | % | | 173.98 | % |
| Portfolio turnover | 8.87 | % | | 18.01 | % | | 35.33 | % | | 15.43 | % | | 11.58 | % |
(1)Per share data is based on weighted average shares outstanding for the respective period (except for distributions declared to stockholders which is based on actual rate per share).
(2)Includes the effect of common stock issuances per share, which for the years ended December 31, 2023, December 31, 2022, December 31, 2021, December 31, 2020 and December 31, 2019 were $0.00, $0.01, $(0.01), $0.00 and $0.08, respectively.
(3)Total return is calculated assuming a purchase of common stock at the opening of the first day of the year and a sale on the closing of the last business day of the period. Dividends and distributions, if any, are assumed for purposes of this calculation, to be reinvested at prices obtained under the Company's dividend reinvestment plan. Total return does not reflect sales load.
(4)Total return is calculated assuming a purchase at net asset value on the opening of the first day of the year and a sale at net asset value on the last day of the period. Dividends and distributions, if any, are assumed for purposes of this calculation, to be reinvested at the net asset value on the last day of the respective quarter. Total return does not reflect sales load.
(5)For the year ended December 31, 2023, average debt outstanding includes the 2018A Unsecured Notes for the period from January 1, 2023 to January 30, 2023 (repayment of the 2018A Unsecured Notes), the 2018B Unsecured Notes for the period from January 1, 2023 to June 28, 2023 (repayment of the 2018B Unsecured Notes) and the 8.250% Unsecured Notes for the period from November 13, 2023 (issuance of the 8.250% Unsecured Notes) to December 31, 2023. For the year ended December 31, 2022, average debt outstanding includes the 2017A Unsecured Notes for the period from January 1, 2022 to July 14, 2022 (repayment of the 2017A Unsecured Notes).
(6)For the year ended December 31, 2023, average debt outstanding includes the 2018 Convertible Notes for the period from January 1, 2023 to August 15, 2023 (repayment of the 2018 Convertible Notes). For the year ended December 31, 2022, the average debt outstanding includes the 2022 Convertible Notes for the period from November 2, 2022 (issuance of the 2022 Convertible Notes) to December 31, 2022.
(7)Under the NMFC Credit Facility, the Company may borrow in U.S. dollars or certain other permitted currencies. As of December 31, 2023, the Company had borrowings denominated in GBP of £22,850 and borrowings denominated in EUR of €700 that have been converted to U.S. dollars. As of December 31, 2022, the Company had borrowings denominated in GBP of £22,850 and borrowings denominated in EUR of €700 that have been converted to U.S. dollars. As of December 31, 2021, the Company had borrowings denominated in GBP of £16,400 that has been converted to U.S. dollars.
(8)For the year ended December 31, 2021, average debt outstanding represents the period from February 26, 2021 (commencement of the NMNLC Credit Facility II) to December 31, 2021.
(9)For the year ended December 31, 2020, average debt outstanding represents the period from January 1, 2020 to September 23, 2020 (maturity of the NMNLC Credit Facility). See Item 7 — Management's Discussion and Analysis of Financial Condition and Results of Operations — Borrowings in this Annual Report on Form 10-K for details.
(10)On November 5, 2014, the Company received exemptive relief from the SEC allowing the Company to modify the asset coverage requirement to exclude the SBA-guaranteed debentures from this calculation.
The following information sets forth the Company's financial highlights for the years ended December 31, 2018, December 31, 2017, December 31, 2016, December 31, 2015 and December 31, 2014. | | | | | | | | | | | | | | | | | | | | | | | | | | | | | |
| Year Ended December 31, |
| 2018 | | 2017 | | 2016 | | 2015 | | 2014 |
| Per share data(1): | | | | | | | | | |
| Net asset value at the beginning of the period | $ | 13.63 | | | $ | 13.46 | | | $ | 13.08 | | | $ | 13.83 | | | $ | 14.38 | |
| Net investment income | 1.39 | | | 1.38 | | | 1.36 | | | 1.38 | | | 1.10 | |
| Net realized and unrealized (losses) gains (2) | (0.44) | | | 0.15 | | | 0.38 | | | (0.77) | | | (0.80) | |
| Net increase in net assets resulting from operations allocated from NMF Holdings: | | | | | | | | | |
| Net investment income(3) | — | | | — | | | — | | | — | | | 0.44 | |
| Net realized and unrealized gains(2)(3) | — | | | — | | | — | | | — | | | 0.19 | |
| Total net increase | 0.95 | | | 1.53 | | | 1.74 | | | 0.61 | | | 0.93 | |
| | | | | | | | | |
| Dividends declared to stockholders from net investment income | (1.36) | | | (1.36) | | | (1.36) | | | (1.36) | | | (1.36) | |
| Dividends declared to stockholders from net realized gains | — | | | — | | | — | | | — | | | (0.12) | |
| Net asset value at the end of the period | $ | 13.22 | | | $ | 13.63 | | | $ | 13.46 | | | $ | 13.08 | | | $ | 13.83 | |
| Per share market value the end of the period | $ | 12.58 | | | $ | 13.55 | | | $ | 14.10 | | | $ | 13.02 | | | $ | 14.94 | |
| Total return based on market value(4) | 2.70 | % | | 5.54 | % | | 19.68 | % | | (4.00) | % | | 9.66 | % |
| Total return based on net asset value(5) | 7.16 | % | | 11.77 | % | | 13.98 | % | | 4.32 | % | | 6.56 | % |
| Shares outstanding at end of period | 76,106,372 | | | 75,935,093 | | | 69,717,814 | | | 64,005,387 | | | 57,997,890 | |
| Average weighted shares outstanding for the period | 76,022,375 | | | 74,171,268 | | | 64,918,191 | | | 59,715,290 | | | 51,846,164 | |
| Average net assets for the period | $ | 1,026,313 | | | $ | 1,011,562 | | | $ | 863,193 | | | $ | 832,805 | | | $ | 749,732 | |
| Ratio to average net assets(6): | | | | | | | | | |
| Net investment income | 10.33 | % | | 10.10 | % | | 10.21 | % | | 9.91 | % | | 10.68 | % |
| Total expenses, before waivers/reimbursements | 12.90 | % | | 10.23 | % | | 9.91 | % | | 9.28 | % | | 7.65 | % |
| Total expenses, net of waivers/reimbursements | 12.22 | % | | 9.45 | % | | 9.27 | % | | 8.57 | % | | 7.41 | % |
(1)Per share data is based on weighted average shares outstanding for the respective period (except for dividends declared to stockholders which is based on actual rate per share).
(2)Includes the accretive effect of common stock issuances per share, which for the years ended December 31, 2018, December 31, 2017, December 31, 2016, December 31, 2015 and December 31, 2014 were 0.00, $0.05, $0.02, $0.06, and $0.05 respectively.
(3)For the year ended December 31, 2014, per share data is based on the summation of the per share results of operations items over the outstanding shares for the period in which the respective line items were realized or earned.
(4)Total return is calculated assuming a purchase of common stock at the opening of the first day of the period and a sale on the closing of the last business day of the period. Dividends and distributions, if any, are assumed for purposes of this calculation, to be reinvested at prices obtained under the Company's dividend reinvestment plan. Total return does not reflect sales load.
(5)Total return is calculated assuming a purchase at net asset value on the opening of the first day of the year and a sale at net asset value on the last day of the period. Dividends and distributions, if any, are assumed for purposes of this calculation, to be reinvested at the net asset value on the last day of the respective quarter. Total return does not reflect sales load.
(6)Ratio to average net assets for the year ended December 31, 2014 is based on the summation of the results of operations items over the net assets for the period in which the respective line items were realized or earned. For the year ended December 31, 2014, the Company is reflecting its net investment income and expenses as well as its proportionate share of the Predecessor Operating Company's net investment income and expenses.
The following information sets forth the Company's the financial highlights for the years ended December 31, 2018, December 31, 2017, December 31, 2016, December 31, 2015 and December 31, 2014 | | | | | | | | | | | | | | | | | | | | | | | | | | | | | |
| NMFC Year Ended
December 31, |
| 2018 | | 2017 | | 2016 | | 2015 | | 2014 |
| Average debt outstanding—Holdings Credit Facility(1) | $ | 384,433 | | | $ | 345,174 | | | $ | 341,055 | | | $ | 394,945 | | | $ | 243,693 | |
| Average debt outstanding—SLF Credit Facility(2) | — | | | — | | | — | | | — | | | 208,377 | |
| Average debt outstanding—Convertible Notes(3) | 197,058 | | | 155,250 | | | 125,227 | | | 115,000 | | | 115,000 | |
| Average debt outstanding—SBA-guaranteed debentures(4) | 158,471 | | | 132,572 | | | 119,819 | | | 71,921 | | | 29,167 | |
| | | | | | | | | |
| Average debt outstanding—NMFC Credit Facility(5) | 117,719 | | | 54,853 | | | 66,876 | | | 60,477 | | | 11,227 | |
| Average debt outstanding—Unsecured Notes(6) | 266,296 | | | 117,877 | | | 65,500 | | | — | | | — | |
| Average debt outstanding—DB Credit Facility (7) | 49,833 | | | — | | | — | | | — | | | — | |
| Average debt outstanding—NMNLC Credit Facility(8) | 3,570 | | | — | | | — | | | — | | | — | |
| Asset coverage ratio(9) | 181.37 | % | | 240.76 | % | | 259.34 | % | | 234.05 | % | | 226.70 | % |
| Portfolio turnover(10) | 36.75 | % | | 41.98 | % | | 36.07 | % | | 33.93 | % | | 29.51 | % |
(1)For the year ended December 31, 2014, average debt outstanding represents the Company's average debt outstanding as well as the Company's proportionate share of the Predecessor Operating Company's average debt outstanding. The average debt outstanding for the year ended December 31, 2014 at the Holdings Credit Facility was $244,598.
(2)For the year ended December 31, 2014, average debt outstanding represents the Company's average debt outstanding as well as the Company's proportionate share of the Predecessor Operating Company's average debt outstanding for the period January 1, 2014 to December 17, 2014 (date of SLF Credit Facility merger with and into the Holdings Credit Facility). The average debt outstanding for the period January 1, 2014 to December 17, 2014 at the SLF Credit Facility was $209,333.
(3)For the year ended December 31, 2014, average debt outstanding represents the period from June 3, 2014 (issuance of the Convertible Notes) to December 31, 2014.
(4)For the year ended December 31, 2014, average debt outstanding represents the period from November 17, 2014 (date of initial SBA-guaranteed debenture borrowing) to December 31, 2014.
(5)For the year ended December 31, 2014, average debt outstanding represents the period from June 4, 2014 (commencement of the NMFC Credit Facility) to December 31, 2014.
(6)For the year ended December 31, 2016, average debt outstanding represents the period form May 6, 2016 (issuance of the 2016 Unsecured Notes) to December 31, 2016. See Item 7 - Management's Discussion and Analysis of Financial Condition and Results of Operations - Borrowings in this Annual Report on Form 10-K for details.
(7)For the year ended December 31, 2018, average debt outstanding represents the period from December 14, 2018 (commencement of the DB Credit Facility) to December 31, 2018. See Item 7 - Management's Discussion and Analysis of Financial Condition and Results of Operations - Borrowings in this Annual Report on Form 10-K for details.
(8)For the year ended December 31, 2018, average debt outstanding represents the period from September 21, 2018 (commencement of the NMNLC Credit Facility) to December 31, 2018. See Item 7 - Management's Discussion and Analysis of Financial Condition and Results of Operations - Borrowings in this Annual Report on Form 10-K for details.
(9)On November 5, 2014, the Company received exemptive relief from the SEC allowing the Company to modify the asset coverage requirement to exclude the SBA-guaranteed debentures from this calculation.
(10)For the year ended December 31, 2014, portfolio turnover represents the investment activity of the Predecessor Operating Company and the Company.
Item 6. Reserved
Item 7. Management's Discussion and Analysis of Financial Condition and Results of Operations
The information in management's discussion and analysis of financial condition and results of operations relates to New Mountain Finance Corporation, including its wholly-owned direct and indirect subsidiaries (collectively, "we", "us", "our", "NMFC" or the "Company").
The following analysis of our financial condition and results of operations should be read in conjunction with our financial data and our financial statements and the notes thereto contained in Item 8.—Financial Statements and Supplementary Data in this Annual Report on Form 10-K. See Item 1A.—Risk Factors in this Annual Report on Form 10-K for a discussion of the uncertainties, risks and assumptions associated with these statements.
Forward-Looking Statements
The information contained in this section should be read in conjunction with the financial data and consolidated financial statements and notes thereto appearing elsewhere in this Annual Report on Form 10-K. Some of the statements in this Annual Report on Form 10-K (including in the following discussion) constitute forward-looking statements, which relate to future events or our future performance or our financial condition. The forward-looking statements contained in this section involve a number of risks and uncertainties, including:
•statements concerning the impact of a protracted decline in the liquidity of credit markets;
•the general economy, including interest and inflation rates, on the industries in which we invest;
•the impact of interest rate volatility, including the replacement of LIBOR with alternative reference rates and rising interest rates, on our business and our portfolio companies;
•our future operating results, our business prospects, the adequacy of our cash resources and working capital;
•the ability of our portfolio companies to achieve their objectives;
•our ability to make investments consistent with our investment objectives, including with respect to the size, nature and terms of our investments;
•the ability of New Mountain Finance Advisers BDC, L.L.C. (the "Investment Adviser") or its affiliates to attract and retain highly talented professionals;
•actual and potential conflicts of interest with the Investment Adviser and New Mountain Capital Group, L.P. (together with New Mountain Capital, L.L.C. and its affiliates, "New Mountain Capital") whose ultimate owners include Steven B. Klinsky, other current and former New Mountain Capital professionals and related vehicles and a minority investor; and
•the risk factors set forth in Item 1A.—Risk Factors contained in this Annual Report on Form 10-K.
Forward-looking statements are identified by their use of such terms and phrases such as "anticipate", "believe", "continue", "could", "estimate", "expect", "intend", "may", "plan", "potential", "project", "seek", "should", "target", "will", "would" or similar expressions. Actual results could differ materially from those projected in the forward-looking statements for any reason, including the factors set forth in Item 1A.—Risk Factors contained in this Annual Report on Form 10-K.
We have based the forward-looking statements included in this Annual Report on Form 10-K on information available to us on the date of this Annual Report on Form 10-K. We assume no obligation to update or revise publicly any forward-looking statements, whether as a result of new information, future events or otherwise, except as required by law. Although we undertake no obligation to revise or update any forward-looking statements, you are advised to consult any additional disclosures that we may make directly to you or through reports that we have filed or in the future may file with the U.S. Securities and Exchange Commission (the "SEC"), including annual reports on Form 10-K, registration statements on Form N-2, quarterly reports on Form 10-Q and current reports on Form 8-K.
Overview
We are a Delaware corporation that was originally incorporated on June 29, 2010 and completed our initial public offering ("IPO") on May 19, 2011. We are a closed-end, non-diversified management investment company that has elected to be regulated as a business development company ("BDC") under the Investment Company Act of 1940, as amended (the "1940 Act"). We have elected to be treated, and intend to comply with the requirements to continue to qualify annually, as a regulated investment company ("RIC") under Subchapter M of the Internal Revenue Code of 1986, as amended (the "Code"). Since our IPO, and through December 31, 2023, we have raised approximately $966.9 million in net proceeds from additional offerings of our common stock.
The Investment Adviser is a wholly-owned subsidiary of New Mountain Capital. New Mountain Capital is a global investment firm with approximately $50 billion of assets under management and a track record of investing in the middle market. New Mountain Capital focuses on investing in defensive growth companies across its private equity, credit and net lease investment strategies. The Investment Adviser manages our day-to-day operations and provides us with investment advisory and management services. The Investment Adviser also manages other funds that may have investment mandates that are similar, in whole or in part, to ours. New Mountain Finance Administration, L.L.C. (the "Administrator”), a wholly-owned subsidiary of New Mountain Capital, provides the administrative services necessary to conduct our day-to-day operations.
We have established the following wholly-owned direct and indirect subsidiaries:
•New Mountain Finance Holdings, L.L.C. ("NMF Holdings") and New Mountain Finance DB, L.L.C. ("NMFDB"), whose assets are used to secure NMF Holdings’ credit facility and NMFDB’s credit facility, respectively;
•New Mountain Finance SBIC, L.P. ("SBIC I") and New Mountain Finance SBIC II, L.P. ("SBIC II"), who have received licenses from the U.S. Small Business Administration ("SBA") to operate as small business investment companies ("SBICs") under Section 301(c) of the Small Business Investment Act of 1958, as amended (the "1958 Act") and their general partners, New Mountain Finance SBIC G.P., L.L.C. ("SBIC I GP") and New Mountain Finance SBIC II G.P., L.L.C. ("SBIC II GP"), respectively;
•NMF Ancora Holdings, Inc. ("NMF Ancora"), NMF QID NGL Holdings, Inc. ("NMF QID"), NMF YP Holdings, Inc. ("NMF YP"), NMF Permian Holdings LLC ("NMF Permian"), NMF HB, Inc. ("NMF HB"), NMF TRM, LLC ("NMF TRM"), NMF Pioneer, Inc. ("NMF Pioneer") and NMF OEC, Inc. ("NMF OEC"), which are treated as corporations for U.S. federal income tax purposes and are intended to facilitate our compliance with the requirements to be treated as a RIC under the Code by holding equity or equity related investments in portfolio companies organized as limited liability companies (or other forms of pass-through entities); we consolidate these corporations for accounting purposes but the corporations are not consolidated for income tax purposes and may incur income tax expense as a result of their ownership of the portfolio companies; and
•New Mountain Finance Servicing, L.L.C. ("NMF Servicing"), which serves as the administrative agent on certain investment transactions.
New Mountain Net Lease Corporation ("NMNLC") is a majority-owned consolidated subsidiary of ours, which acquires commercial real estate properties that are subject to "triple net" leases has elected to be treated, and intends to comply with the requirements to continue to qualify annually, as a real estate investment trust, or REIT, within the meaning of Section 856(a) of the Code.
We are a leading BDC focused on providing direct lending solutions to U.S. upper middle market companies backed by top private equity sponsors. Our investment objective is to generate current income and capital appreciation through the sourcing and origination of senior secured loans and select junior capital positions, to growing businesses in defensive industries that offer attractive risk-adjusted returns. Our differentiated investment approach leverages the deep sector knowledge and operating resources of New Mountain Capital.
Senior secured loans may include traditional first lien loans or unitranche loans. We invest a significant portion of our portfolio in unitranche loans, which are loans that combine both senior and subordinated debt, generally in a first-lien position. Because unitranche loans combine characteristics of senior and subordinated debt, they have risks similar to the risks associated with secured debt and subordinated debt. Certain unitranche loan investments may include “last-out” positions, which generally heighten the risk of loss. In some cases, our investments may also include equity interests.
We primarily invest in senior secured debt of U.S. sponsor-backed, middle market companies. We define middle market companies as those with annual earnings before interest, taxes, depreciation, and amortization ("EBITDA") of $10 million to $200 million. Our focus is on defensive growth businesses that generally exhibit the following characteristics: (i) acyclicality, (ii) sustainable secular growth drivers, (iii) niche market dominance and high barriers to competitive entry, (iv) recurring revenue and strong free cash flow, (v) flexible cost structures and (vi) seasoned management teams.
Similar to us, the investment objective of SBIC I and SBIC II is to generate current income and capital appreciation under the investment criteria we use. However, SBIC I and SBIC II investments must be in SBA eligible small businesses. Our portfolio may be concentrated in a limited number of industries. As of December 31, 2023, our top five industry concentrations were software, business services, healthcare, investment funds (which includes our investments in our joint ventures) and education.
As of December 31, 2023, our net asset value was approximately $1,320.0 million and our portfolio had a fair value, as determined in good faith by the board of directors, of approximately $3,011.3 million in 110 portfolio companies, with a weighted average yield to maturity at cost for income producing investments ("YTM at Cost") of approximately 10.9% and a weighted average yield to maturity at cost for all investments ("YTM at Cost for Investments") of approximately 9.7%. The YTM at Cost calculation assumes that all investments, including secured collateralized agreements, not on non-accrual are purchased at cost on the quarter end date and held until their respective maturities with no prepayments or losses and exited at par at maturity. The YTM at Cost for Investments calculation assumes that all investments, including secured collateralized agreements, are purchased at cost on the quarter end date and held until their respective maturities with no prepayments or losses and exited at par at maturity. YTM at Cost and YTM at Cost for Investments calculations exclude the impact of existing leverage. YTM at Cost and YTM at Cost for Investments use London Interbank Offered Rate ("LIBOR"), Sterling Overnight Interbank Average Rate ("SONIA"), Secured Overnight Financing Rate ("SOFR") and Euro Interbank Offered Rate ("EURIBOR") curves at each quarter's end date. The actual yield to maturity may be higher or lower due to the future selection of the SONIA, SOFR and EURIBOR contracts by the individual companies in our portfolio or other factors.
Recent Developments
On January 25, 2024, we caused notices to be issued to holders of our 2019A Unsecured Notes regarding the exercise of our option to repay all of our $116.5 million in aggregate principal amount of issued and outstanding 2019A Unsecured Notes, which was repaid on February 5, 2024.
On January 30, 2024, our board of directors declared a first quarter 2024 distribution of $0.32 per share and a supplemental distribution related to fourth quarter earnings of $0.04 per share, each payable on March 29, 2024 to holders of record as of March 15, 2024.
On February 1, 2024, we issued $300.0 million in aggregate principal amount of our 6.875% notes due 2029 (the "2029 Unsecured Notes") for net proceeds of $293.9 million after deducting underwriting commissions of $3.0 million. Offering costs incurred were approximately $0.9 million. Interest on the 2029 Unsecured Notes will be paid semi-annually in arrears on February 1 and August 1 at a rate of 6.875% per year, beginning on August 1, 2024, to holders of record as of the close of business on January 15 or July 15 (whether or not a business day), as the case may be, immediately preceding the relevant interest payment date. The 2029 Unsecured Notes may be redeemed in whole or in part at our option at any time prior to January 1, 2029, at par plus a “make-whole” premium, and thereafter at par, plus accrued interest.
Critical Accounting Estimates
The preparation of financial statements and related disclosures in conformity with accounting principles generally accepted in the United States ("GAAP") requires management to make estimates and assumptions that affect the reported amounts of assets and liabilities, disclosure of contingent assets and liabilities at the date of the financial statements, and revenues and expenses during the periods reported. Actual results could materially differ from those estimates. We have identified the following items as critical accounting policies.
Basis of Accounting
We consolidate our wholly-owned direct and indirect subsidiaries: NMF Holdings, NMF Servicing, NMFDB, SBIC I, SBIC I GP, SBIC II, SBIC II GP, NMF Ancora, NMF QID, NMF YP, NMF Permian, NMF HB, NMF TRM, NMF Pioneer and NMF OEC and our majority-owned consolidated subsidiary, NMNLC. We are an investment company following accounting and reporting guidance as described in Accounting Standards Codification Topic 946, Financial Services—Investment Companies ("ASC 946").
Valuation and Leveling of Portfolio Investments
At all times consistent with GAAP and the 1940 Act, we conduct a valuation of our assets, which impacts our net asset value.
We value our assets on a quarterly basis, or more frequently if required under the 1940 Act. In all cases, our board of directors is ultimately and solely responsible for determining the fair value of our portfolio investments on a quarterly basis in good faith, including investments that are not publicly traded, those whose market prices are not readily available and any other
situation where our portfolio investments require a fair value determination. Security transactions are accounted for on a trade date basis. Our quarterly valuation procedures are set forth in more detail below:
(1)Investments for which market quotations are readily available on an exchange are valued at such market quotations based on the closing price indicated from independent pricing services.
(2)Investments for which indicative prices are obtained from various pricing services and/or brokers or dealers are valued through a multi-step valuation process, as described below, to determine whether the quote(s) obtained is representative of fair value in accordance with GAAP.
a. Bond quotes are obtained through independent pricing services. Internal reviews are performed by the investment professionals of the Investment Adviser to ensure that the quote obtained is representative of fair value in accordance with GAAP and, if so, the quote is used. If the Investment Adviser is unable to sufficiently validate the quote(s) internally and if the investment's par value or its fair value exceeds the materiality threshold, the investment is valued similarly to those assets with no readily available quotes (see (3) below); and
b. For investments other than bonds, we look at the number of quotes readily available and perform the following procedures:
i. Investments for which two or more quotes are received from a pricing service are valued using the mean of the mean of the bid and ask of the quotes obtained. We will evaluate the reasonableness of the quote, and if the quote is determined to not be representative of fair value, we will use one or more of the methodologies outlined below to determine fair value;
ii. Investments for which one quote is received from a pricing service are validated internally. The investment professionals of the Investment Adviser analyze the market quotes obtained using an array of valuation methods (further described below) to validate the fair value. If the Investment Adviser is unable to sufficiently validate the quote internally and if the investment's par value or its fair value exceeds the materiality threshold, the investment is valued similarly to those assets with no readily available quotes (see (3) below).
(3)Investments for which quotations are not readily available through exchanges, pricing services, brokers or dealers are valued through a multi-step valuation process:
a. Each portfolio company or investment is initially valued by the investment professionals of the Investment Adviser responsible for the credit monitoring;
b. Preliminary valuation conclusions will then be documented and discussed with our senior management;
c. If an investment falls into (3) above for four consecutive quarters and if the investment's par value or its fair value exceeds the materiality threshold, then at least once each fiscal year, the valuation for each portfolio investment for which we do not have a readily available market quotation will be reviewed by an independent valuation firm engaged by our board of directors; and
d. When deemed appropriate by our management, an independent valuation firm may be engaged to review and value investment(s) of a portfolio company, without any preliminary valuation being performed by the Investment Adviser. The investment professionals of the Investment Adviser will review and validate the value provided.
For investments in revolving credit facilities and delayed draw commitments, the cost basis of the funded investments purchased is offset by any costs/netbacks received for any unfunded portion on the total balance committed. The fair value is also adjusted for the price appreciation or depreciation on the unfunded portion. As a result, the purchase of a commitment not completely funded may result in a negative fair value until it is called and funded.
The values assigned to investments are based upon available information and do not necessarily represent amounts which might ultimately be realized, since such amounts depend on future circumstances and cannot be reasonably determined until the individual positions are liquidated. Due to the inherent uncertainty of determining the fair value of investments that do not have a readily available market value, the fair value of our investments may fluctuate from period to period and the fluctuations could be material.
GAAP fair value measurement guidance classifies the inputs used in measuring fair value into three levels as follows:
Level I—Quoted prices (unadjusted) are available in active markets for identical investments and we have the ability to access such quotes as of the reporting date. The type of investments which would generally be included in Level I include active exchange-traded equity securities and exchange-traded derivatives. As required by Accounting Standards Codification
Topic 820, Fair Value Measurements and Disclosures ("ASC 820"), we, to the extent that we hold such investments, do not adjust the quoted price for these investments, even in situations where we hold a large position and a sale could reasonably impact the quoted price.
Level II—Pricing inputs are observable for the investments, either directly or indirectly, as of the reporting date, but are not the same as those used in Level I. Level II inputs include the following:
•Quoted prices for similar assets or liabilities in active markets;
•Quoted prices for identical or similar assets or liabilities in non-active markets (examples include corporate and municipal bonds, which trade infrequently);
•Pricing models whose inputs are observable for substantially the full term of the asset or liability (examples include most over-the-counter derivatives, including foreign exchange forward contracts); and
•Pricing models whose inputs are derived principally from or corroborated by observable market data through correlation or other means for substantially the full term of the asset or liability.
Level III—Pricing inputs are unobservable for the investment and include situations where there is little, if any, market activity for the investment.
The inputs used to measure fair value may fall into different levels. In all instances when the inputs fall within different levels of the hierarchy, the level within which the fair value measurement is categorized is based on the lowest level of input that is significant to the fair value measurement in its entirety. As such, a Level III fair value measurement may include inputs that are both observable and unobservable. Gains and losses for such assets categorized within the Level III table below may include changes in fair value that are attributable to both observable inputs and unobservable inputs.
The inputs into the determination of fair value require significant judgment or estimation by management and consideration of factors specific to each investment. A review of the fair value hierarchy classifications is conducted on a quarterly basis. Changes in the observability of valuation inputs may result in the transfer of certain investments within the fair value hierarchy from period to period.
See Item 8.—Financial Statements and Supplementary Data—Note 4. Fair Value in this Annual Report on Form 10-K for additional information on fair value hierarchy for the year ended December 31, 2023.
We generally use the following framework when determining the fair value of investments where there are little, if any, market activity or observable pricing inputs. We typically determine the fair value of our performing debt investments utilizing an income approach. Additional consideration is given using a market based approach, as well as reviewing the overall underlying portfolio company's performance and associated financial risks. The following outlines additional details on the approaches considered:
Company Performance, Financial Review, and Analysis: Prior to investment, as part of our due diligence process, we evaluate the overall performance and financial stability of the portfolio company. Post investment, we analyze each portfolio company's current operating performance and relevant financial trends versus prior year and budgeted results, including, but not limited to, factors affecting its revenue and earnings before interest, taxes, depreciation, and amortization ("EBITDA") growth, margin trends, liquidity position, covenant compliance and changes to its capital structure. We also attempt to identify and subsequently track any developments at the portfolio company, within its customer or vendor base or within the industry or the macroeconomic environment, generally, that may alter any material element of our original investment thesis. This analysis is specific to each portfolio company. We leverage the knowledge gained from our original due diligence process, augmented by this subsequent monitoring, to continually refine our outlook for each of our portfolio companies and ultimately form the valuation of our investment in each portfolio company. When an external event such as a purchase transaction, public offering or subsequent sale occurs, we will consider the pricing indicated by the external event to corroborate the private valuation.
For debt investments, we may employ the Market Based Approach (as described below) to assess the total enterprise value of the portfolio company, in order to evaluate the enterprise value coverage of our debt investment. For equity investments or in cases where the Market Based Approach implies a lack of enterprise value coverage for the debt investment, we may additionally employ a discounted cash flow analysis based on the free cash flows of the portfolio company to assess the total enterprise value.
After enterprise value coverage is demonstrated for our debt investments through the method(s) above, the Income Based Approach (as described below) may be employed to estimate the fair value of the investment.
Market Based Approach: We may estimate the total enterprise value of each portfolio company by utilizing EBITDA or revenue multiples of publicly traded comparable companies and comparable transactions. We consider numerous factors when selecting the appropriate companies whose trading multiples are used to value our portfolio companies. These factors include, but are not limited to, the type of organization, similarity to the business being valued, and relevant risk factors, as well as size, profitability and growth expectations. We may apply an average of various relevant comparable company EBITDA or revenue multiples to the portfolio company's latest twelve month ("LTM") EBITDA or revenue, or projected EBITDA or revenue to calculate the enterprise value of the portfolio company. Significant increases or decreases in the EBITDA or revenue multiples will result in an increase or decrease in enterprise value, which may result in an increase or decrease in the fair value estimate of the investment.
Income Based Approach: We also may use a discounted cash flow analysis to estimate the fair value of the investment. Projected cash flows represent the relevant security's contractual interest, fee and principal payments plus the assumption of full principal recovery at the investment's expected maturity date. These cash flows are discounted at a rate established utilizing a combination of a yield calibration approach and a comparable investment approach. The yield calibration approach incorporates changes in the credit quality (as measured by relevant statistics) of the portfolio company, as compared to changes in the yield associated with comparable credit quality market indices, between the date of origination and the valuation date. The comparable investment approach utilizes an average yield-to maturity of a selected set of high-quality, liquid investments to determine a comparable investment discount rate. Significant increases or decreases in the discount rate would result in a decrease or increase in the fair value measurement.
See Item 8.—Financial Statements and Supplementary Data—Note 4. Fair Value in this Annual Report on Form 10-K for additional information on unobservable inputs used in the fair value measurement of our Level III investments for the year ended December 31, 2023.
NMFC Senior Loan Program III LLC
NMFC Senior Loan Program III LLC ("SLP III") was formed as a Delaware limited liability company and commenced operations on April 25, 2018. SLP III is structured as a private joint venture investment fund between us and SkyKnight Income II, LLC (“SkyKnight II”) and operates under a limited liability company agreement (the "SLP III Agreement"). The purpose of the joint venture is to invest primarily in senior secured loans issued by portfolio companies within our core industry verticals. These investments are typically broadly syndicated first lien loans. All investment decisions must be unanimously approved by the board of managers of SLP III, which has equal representation from us and SkyKnight II. SLP III has a five year investment period and will continue in existence until April 25, 2025. The investment period may be extended for up to one year pursuant to certain terms of the SLP III Agreement.
SLP III is capitalized with equity contributions which are called from its members, on a pro-rata basis based on their equity commitments, as transactions are completed. Any decision by SLP III to call down on capital commitments requires approval by the board of managers of SLP III. As of December 31, 2023, we and SkyKnight II have committed and contributed $140.0 million and $35.0 million, respectively, of equity to SLP III. Our investment in SLP III is disclosed on our Consolidated Schedule of Investments as of December 31, 2023 and December 31, 2022.
On May 2, 2018, SLP III entered into its revolving credit facility with Citibank, N.A., which matures on January 8, 2026. Effective July 8, 2021, the reinvestment period was extended to July 8, 2024. As of the amendment on June 23, 2023, during the reinvestment period, the credit facility bears interest at a rate of SOFR plus 1.80%, and after the reinvestment period it will bear interest at a rate of SOFR plus 2.10%. Prior to the amendment on June 23, 2023, the facility bore interest at a rate of LIBOR plus 1.60% per annum during the reinvestment period and LIBOR plus 1.90% per annum after the reinvestment period. Effective November 23, 2020, SLP III's revolving credit facility has a maximum borrowing capacity of $525.0 million. As of December 31, 2023 and December 31, 2022, SLP III had total investments with an aggregate fair value of approximately $636.6 million and $639.3 million, respectively, and debt outstanding under its credit facility of $453.2 million and $512.1 million, respectively. As of December 31, 2023 and December 31, 2022, none of SLP III's investments were on non-accrual. Additionally, as of December 31, 2023 and December 31, 2022, SLP III had unfunded commitments in the form of delayed draws of $1.1 million and $2.9 million, respectively.
Below is a summary of SLP III's portfolio as of December 31, 2023 and December 31, 2022: | | | | | | | | | | | | | | | | |
| (in thousands) | | December 31, 2023 | | December 31, 2022 | | |
| First lien investments (1) | | $ | 657,208 | | | $ | 690,017 | | | |
| Weighted average interest rate on first lien investments (2) | | 9.79 | % | | 8.51 | % | | |
| Number of portfolio companies in SLP III | | 87 | | | 83 | | | |
| Largest portfolio company investment (1) | | $ | 17,883 | | | $ | 18,197 | | | |
| Total of five largest portfolio company investments (1) | | $ | 79,458 | | | $ | 85,948 | | | |
(1)Reflects principal amount or par value of investment.
(2)Computed as the all in interest rate in effect on accruing investments divided by the total principal amount of investments.
See Item 8.—Financial Statements and Supplementary Data—Note 3. Investments in this Annual Report on Form 10-K for a listing of the individual investments in SLP III's portfolio as of December 31, 2023 and December 31, 2022, and additional information on certain summarized financial information for SLP III as of December 31, 2023 and December 31, 2022 and for the years ended December 31, 2023, December 31, 2022 and December 31, 2021.
NMFC Senior Loan Program IV LLC
NMFC Senior Loan Program IV LLC ("SLP IV") was formed as a Delaware limited liability company on April 6, 2021, and commenced operations on May 5, 2021. SLP IV is structured as a private joint venture investment fund between us and SkyKnight Income Alpha, LLC ("SkyKnight Alpha") and operates under the First Amended and Restated Limited Liability Company Agreement of NMFC Senior Loan Program IV LLC, dated May 5, 2021 (the "SLP IV Agreement"). Upon the effectiveness of the SLP IV Agreement, the members contributed their respective membership interests in NMFC Senior Loan Program I LLC ("SLP I") and NMFC Senior Loan Program II LLC ("SLP II") to SLP IV. Immediately following the contribution of their membership interests, SLP I and SLP II became wholly-owned subsidiaries of SLP IV. The purpose of the joint venture is to invest primarily in senior secured loans issued by portfolio companies within our core industry verticals. These investments are typically broadly syndicated first lien loans. All investment decisions must be unanimously approved by the board of managers of SLP IV, which has equal representation from us and SkyKnight Alpha. SLP IV has a five year investment period and will continue in existence until May 5, 2028. The investment period may be extended for up to one year pursuant to certain terms of the SLP IV Agreement.
SLP IV is capitalized with equity contributions which were transferred and contributed from its members. As of December 31, 2023, we and SkyKnight Alpha have transferred and contributed $112.4 million and $30.6 million, respectively, of their membership interests in SLP I and SLP II to SLP IV. Our investment in SLP IV is disclosed on our Consolidated Schedule of Investments as of December 31, 2023 and December 31, 2022.
On May 5, 2021, SLP IV entered into a $370.0 million revolving credit facility with Wells Fargo Bank, National Association which matures on May 5, 2026. As of the amendment on April 28, 2023, the facility bears interest at a rate of SOFR plus 1.70%. Prior to the amendment on April 28, 2023, the facility bore interest at a rate of LIBOR plus 1.60% per annum. As of December 31, 2023 and December 31, 2022, SLP IV had total investments with an aggregate fair value of approximately $467.9 million and $473.8 million, respectively, and debt outstanding under its credit facility of $306.5 million and $365.5 million, respectively. As of December 31, 2023 and December 31, 2022, none of SLP IV’s investments were on non-accrual. Additionally, as of December 31, 2023 and December 31, 2022, SLP IV had unfunded commitments in the form of delayed draws of $0.8 million and $2.0 million, respectively.
Below is a summary of SLP IV's consolidated portfolio as of December 31, 2023 and December 31, 2022:
| | | | | | | | | | | | | | | | |
| (in thousands) | | December 31, 2023 | | December 31, 2022 | | |
| First lien investments (1) | | $ | 482,776 | | | $ | 510,372 | | | |
| Weighted average interest rate on first lien investments (2) | | 9.81 | % | | 8.54 | % | | |
| Number of portfolio companies in SLP IV | | 78 | | | 74 | | | |
| Largest portfolio company investment (1) | | $ | 17,400 | | | $ | 21,982 | | | |
| Total of five largest portfolio company investments (1) | | $ | 67,838 | | | $ | 93,734 | | | |
(1)Reflects principal amount or par value of investment.
(2)Computed as the all in interest rate in effect on accruing investments divided by the total principal amount of investments.
See Item 8.—Financial Statements and Supplementary Data—Note 3. Investments in this Annual Report on Form 10-K for a listing of the individual investments in SLP IV's consolidated portfolio as of December 31, 2023 and December 31, 2022, and additional information on certain summarized financial information for SLP IV as of December 31, 2023 and December 31, 2022, for the years ended December 31, 2023, December 31, 2022, and for the period from May 5, 2021 to December 31, 2021.
New Mountain Net Lease Corporation
NMNLC was formed to acquire commercial real estate properties that are subject to "triple net" leases. NMNLC's investments are disclosed on our Consolidated Schedule of Investments as of December 31, 2023.
On March 30, 2020, an affiliate of the Investment Adviser purchased directly from NMNLC 105,030 shares of NMNLC’s common stock at a price of $107.73 per share, which represented the net asset value per share of NMNLC at the date of purchase, for an aggregate purchase price of approximately $11.3 million. Immediately thereafter, NMNLC redeemed 105,030 shares of its common stock held by NMFC in exchange for a promissory note with a principal amount of $11.3 million and a 7.0% interest rate, which was repaid by NMNLC to NMFC on March 31, 2020.
Below is certain summarized property information for NMNLC as of December 31, 2023: | | | | | | | | | | | | | | | | | | | | | | | | | | | | | | | | |
| | | | Lease | | | | Total | | Fair Value as of |
| Portfolio Company | | Tenant | | Expiration Date | | Location | | Square Feet | | December 31, 2023 |
| | | | | | | | (in thousands) | | (in thousands) |
| NM NL Holdings LP / NM GP Holdco LLC | | Various | | Various | | Various | | Various | | $ | 97,119 | |
| NM CLFX LP | | Victor Equipment Company | | 8/31/2033 | | TX | | 423 | | 11,731 | |
| NM YI, LLC | | Young Innovations, Inc. | | 10/31/2039 | | IL / MO | | 212 | | 9,550 | |
| | | | | | | | | | $ | 118,400 | |
(1)Excludes residual value in NM APP Canada Corp. due to tax withholding. As of December 31, 2023, NM APP Canada Corp. had a fair value of $7.
Collateralized agreements or repurchase financings
We follow the guidance in Accounting Standards Codification Topic 860, Transfers and Servicing—Secured Borrowing and Collateral ("ASC 860") when accounting for transactions involving the purchases of securities under collateralized agreements to resell (resale agreements). These transactions are treated as collateralized financing transactions and are recorded at their contracted resale or repurchase amounts, as specified in the respective agreements. Interest on collateralized agreements is accrued and recognized over the life of the transaction and included in interest income. As of December 31, 2023 and December 31, 2022, we held one collateralized agreement to resell with a cost basis of $30.0 million and $30.0 million, respectively, and a fair value of $16.5 million and $16.5 million, respectively. The collateralized agreement to resell is on non-accrual. The collateralized agreement to resell is guaranteed by a private hedge fund, PPVA Fund, L.P. The private hedge fund is currently in liquidation under the laws of the Cayman Islands. Pursuant to the terms of the collateralized agreement, the private hedge fund was obligated to repurchase the collateral from us at the par value of the collateralized agreement. The private hedge fund has breached its agreement to repurchase the collateral under the collateralized agreement. The default by the private hedge fund did not release the collateral to us, therefore, we do not have full rights and title to the collateral. A claim has been filed with the Cayman Islands joint official liquidators to resolve this matter. The joint official
liquidators have recognized our contractual rights under the collateralized agreement. We continue to exercise our rights under the collateralized agreement and continue to monitor the liquidation process of the private hedge fund. The fair value of the collateralized agreement to resell is reflective of the increased risk of the position.
PPVA Black Elk (Equity) LLC
On May 3, 2013, we entered into a collateralized securities purchase and put agreement (the “SPP Agreement”) with a private hedge fund. Under the SPP Agreement, we purchased twenty million Class E Preferred Units of Black Elk Energy Offshore Operations, LLC (“Black Elk”) for $20.0 million with a corresponding obligation of the private hedge fund, PPVA Black Elk (Equity) LLC, to repurchase the preferred units for $20.0 million plus other amounts due under the SPP Agreement. The majority owner of Black Elk was the private hedge fund. In August 2014, we received a payment of $20.5 million, the full amount due under the SPP Agreement.
In August 2017, a trustee (the “Trustee”) for Black Elk informed us that the Trustee intended to assert a fraudulent conveyance claim (the “Claim”) against us and one of its affiliates seeking the return of the $20.5 million repayment. Black Elk filed a Chapter 11 bankruptcy petition pursuant to the U.S. Bankruptcy Code in August 2015. The Trustee alleged that individuals affiliated with the private hedge fund conspired with Black Elk and others to improperly use proceeds from the sale of certain Black Elk assets to repay, in August 2014, the private hedge fund’s obligation to us under the SPP Agreement. We were unaware of these claims at the time the repayment was received. The private hedge fund is currently in liquidation under the laws of the Cayman Islands.
On December 22, 2017, we settled the Trustee’s $20.5 million Claim for $16.0 million and filed a claim with the Cayman Islands joint official liquidators of the private hedge fund for $16.0 million that is owed to us under the SPP Agreement. The SPP Agreement was restored and is in effect since repayment has not been made. We continue to exercise our rights under the SPP Agreement and continue to monitor the liquidation process of the private hedge fund. During the year ended December 31, 2018, we received a $1.5 million payment from our insurance carrier in respect to the settlement. As of December 31, 2023 and December 31, 2022, the SPP Agreement had a cost basis of $14.5 million and $14.5 million, respectively, and a fair value of $8.0 million and $8.0 million, respectively, which is reflective of the higher inherent risk in this transaction.
Revenue Recognition
Sales and paydowns of investments: Realized gains and losses on investments are determined on the specific identification method.
Interest and dividend income: Interest income, including amortization of premium and discount using the effective interest method, is recorded on the accrual basis and periodically assessed for collectability. Interest income also includes interest earned from cash on hand. Upon the prepayment of a loan or debt security, any prepayment penalties are recorded as part of interest income. We have loans and certain preferred equity investments in the portfolio that contain a payment-in-kind (“PIK”) interest or dividend provision. PIK interest and dividends are accrued and recorded as income at the contractual rates, if deemed collectible. The PIK interest and dividends are added to the principal or share balances on the capitalization dates and are generally due at maturity or when redeemed by the issuer. For the years ended December 31, 2023 and December 31, 2022, we recognized PIK and non-cash interest from investments of approximately $33.6 million and $17.3 million, respectively, and PIK and non-cash dividends from investments of approximately $27.4 million and $22.5 million, respectively.
Dividend income on common equity is recorded on the record date for private portfolio companies or on the ex-dividend date for publicly traded portfolio companies. Dividend income on preferred securities is recorded as dividend income on an accrual basis to the extent that such amounts are deemed collectible.
Non-accrual income: Investments are placed on non-accrual status when principal or interest payments are past due for 30 days or more and when there is reasonable doubt that principal or interest will be collected. Accrued cash and un-capitalized PIK interest or dividends are reversed when an investment is placed on non-accrual status. Previously capitalized PIK interest or dividends are not reversed when an investment is placed on non-accrual status. Interest or dividend payments received on non-accrual investments may be recognized as income or applied to principal depending upon management’s judgment of the ultimate collectibility. Non-accrual investments are restored to accrual status when past due principal and interest is paid and, in management’s judgment, are likely to remain current.
Other income: Other income represents delayed compensation, consent or amendment fees, revolver fees, structuring fees, upfront fees and other miscellaneous fees received and are typically non-recurring in nature. Delayed compensation is income earned from counterparties on trades that do not settle within a set number of business days after trade date. Other income may also include fees from bridge loans. We may from time to time enter into bridge financing commitments, an obligation to provide interim financing to a counterparty until permanent credit can be obtained. These commitments are short-
term in nature and may expire unfunded. A fee is received for providing such commitments. Structuring fees and upfront fees are recognized as income when earned, usually when paid at the closing of the investment, and are non-refundable.
Monitoring of Portfolio Investments
We monitor the performance and financial trends of our portfolio companies on at least a quarterly basis. We attempt to identify any developments within the portfolio company, the industry or the macroeconomic environment that may alter any material element of our original investment strategy. Our portfolio monitoring procedures are designed to provide a simple yet comprehensive analysis of our portfolio companies based on their operating performance and underlying business characteristics, which in turn forms the basis of its Risk Rating (as defined below).
We use an investment risk rating system to characterize and monitor the credit profile and expected level of returns on each investment in the portfolio. As such, we assign each investment a composite score (“Risk Rating”) based on two metrics – 1) Operating Performance and 2) Business Characteristics:
•Operating Performance assesses the health of the investment in context of its financial performance and the market environment it faces. The metric is expressed in Tiers of “1” to “4”, with “1” being the worst and “4” being the best:
◦Tier 1 – Severe business underperformance and/or severe market headwinds
◦Tier 2 – Significant business underperformance and/or significant market headwinds
◦Tier 3 – Moderate business underperformance and/or moderate market headwinds
◦Tier 4 – Business performance is in-line with or above expectations
•Business Characteristics assesses the health of the investment in context of the underlying portfolio company’s business and credit quality, the underlying portfolio company’s current balance sheet, and the level of support from the equity sponsor. The metric is expressed as on a qualitative scale of “A” to “C”, with “A” being the best and “C” being the worst.
The Risk Rating for each investment is a composite of these two metrics. The Risk Rating is expressed in categories of Red, Orange, Yellow and Green, with Red reflecting an investment performing materially below expectations and Green reflecting an investment that is in-line with or above expectations. The mapping of the composite scores to these categories are below:
•Red – 1C (e.g., Tier 1 for Operating Performance and C for Business Characteristics)
•Orange – 2C and 1B
•Yellow – 3C, 2B, and 1A
•Green – 4C, 3B, 2A, 4B, 3A, and 4A
The following table shows the Risk Rating of our portfolio companies as of December 31, 2023: | | | | | | | | | | | | | | | | | | | | | | | | | | |
| (in millions) | | As of December 31, 2023 |
| Investment Rating | | Cost | | Percent | | Fair Value | | Percent |
| Red | | $ | 39.7 | | | 1.3 | % | | $ | 4.6 | | | 0.2 | % |
| Orange | | 73.1 | | | 2.4 | % | | 42.5 | | | 1.4 | % |
| Yellow | | 157.6 | | | 5.1 | % | | 118.5 | | | 3.9 | % |
| Green | | 2,797.8 | | | 91.2 | % | | 2,862.2 | | | 94.5 | % |
| Total | | $ | 3,068.2 | | | 100.0 | % | | $ | 3,027.8 | | | 100.0 | % |
As of December 31, 2023, all investments in our portfolio had a Green Risk Rating with the exception of six portfolio companies that had a Yellow Risk Rating, four portfolio companies that had an Orange Risk Rating and three portfolio companies that had a Red Risk Rating.
As of December 31, 2023, our aggregate principal amount of our second lien term loan in Integro Parent Inc. ("Integro") was $13.7 million. During the second quarter of 2022, we placed an aggregate principal amount of $4.8 million of our second lien position on non-accrual status, that was subsequently taken off non-accrual status in the third quarter of 2023. As of December 31, 2023, our position in Integro had total unearned other income of $0.4 million for the year then ended. As of December 31, 2023, our investment in Integro has a Green Risk Rating.
During the second quarter of 2022, we placed our second lien positions in National HME, Inc. ("National HME") on non-accrual status. As of December 31, 2023, our second lien position in National HME had an aggregate cost basis of $7.9 million, an aggregate fair value of $3.0 million and total unearned interest income of $1.8 million for the year ended. During the fourth quarter of 2022, we reversed $11.2 million of previously recorded PIK interest in National HME and $1.5 million of previously recorded other income in NHME Holdings Corp. as we believe this PIK interest and other income will ultimately not be collectible. As of December 31, 2023, our investment in National HME has a Red Risk Rating.
As of December 31, 2023, our aggregate principal amount of our subordinated position and first lien term loans in American Achievement Corporation ("AAC") was $5.2 million and $31.4 million, respectively. During the first quarter of 2021, we placed an aggregate principal amount of $5.2 million of our subordinated position on non-accrual status. During the third quarter of 2021, we placed an aggregate principal amount of $13.5 million of our first lien term loans on non-accrual status. During the third quarter of 2023, we placed the remaining aggregate principal amount of $17.9 million of our first lien term loans on non-accrual status. As of December 31, 2023, our positions in AAC on non-accrual status had an aggregate cost basis of $31.4 million, an aggregate fair value of $20.6 million and total unearned interest income of $3.4 million for the year then ended. As of December 31, 2023, our investment in AAC has an Orange Risk Rating.
During the first quarter of 2020, we placed our investment in our junior preferred shares of UniTek Global Services, Inc. ("UniTek") on non-accrual status. As of December 31, 2023, our junior preferred shares of UniTek had an aggregate cost basis of $34.4 million, an aggregate fair value of $0.0 million and total unearned dividend income of $7.7 million for the year then ended. During the third quarter of 2021, we placed an aggregate amount of $19.8 million of our investment in our senior preferred shares of UniTek on non-accrual status. As of December 31, 2023, our senior preferred shares of UniTek had an aggregate cost basis of $19.8 million, an aggregate fair value of approximately $4.2 million and total unearned dividend income of approximately $5.6 million for the year then ended. As of December 31, 2023, our investment in UniTek has a Green Risk Rating.
During the fourth quarter of 2023, we placed our investment in our second lien term loan in Transcendia Holdings, Inc. ("Transcendia") on non-accrual status. As of December 31, 2023, our investment had an aggregate cost of $14.4 million, an aggregate fair value of $7.3 million and total unearned interest income of $0.5 million for the year then ended. As of December 31, 2023, our investment in Transcendia has an Orange Risk Rating.
During the year ended December 31, 2019, our security purchased under collateralized agreements to resell was placed on non-accrual. As of December 31, 2023, our investment in this security has a Yellow Risk Rating and has an aggregate cost basis of $30.0 million and an aggregate fair value of approximately $16.5 million.
Portfolio and Investment Activity
The fair value of our investments, as determined in good faith by our board of directors, was approximately $3,011.3 million in 110 portfolio companies at December 31, 2023 and approximately $3,221.2 million in 107 portfolio companies at December 31, 2022.
The following table shows our portfolio and investment activity for the years ended December 31, 2023 and December 31, 2022: | | | | | | | | | | | | | | |
| | Year Ended December 31, |
| (in millions) | 2023 | | 2022 | |
| New investments in 46 and 50 portfolio companies, respectively | $ | 283.4 | | | $ | 620.7 | | |
| Debt repayments in existing portfolio companies | 358.3 | | | 395.1 | | |
| Sales of securities in 10 and 9 portfolio companies, respectively | 182.1 | | | 188.8 | | |
| Change in unrealized appreciation on 78 and 21 portfolio companies, respectively | 108.6 | | | 81.3 | | |
| Change in unrealized depreciation on 39 and 92 portfolio companies, respectively | (98.3) | | | (165.4) | | |
Recent Accounting Standards Updates
See Item 8.—Financial Statements and Supplementary Data—Note 14. Recent Accounting Standards in this Annual Report on Form 10-K for details on recent accounting standards updates.
Results of Operations for the Years Ended December 31, 2023 and December 31, 2022
Results of Operations for the fiscal year ended December 31, 2021 can be found in Item 7. Management's Discussion and Analysis of Financial Condition and Results of Operations in our Annual Report on Form 10-K filed on February 27, 2023, which is incorporated by reference herein.
Revenue | | | | | | | | | | | | | | |
| | Year Ended December 31, |
| (in thousands) | 2023 | | 2022 | |
| Total interest income | $ | 290,782 | | | $ | 212,193 | | |
| Total dividend income | 73,507 | | | 65,885 | | |
| Other income | 10,547 | | | 16,552 | | |
| Total investment income | $ | 374,836 | | | $ | 294,630 | | |
Our total investment income increased by approximately $80.2 million, or 27%, for the year ended December 31, 2023 as compared to the year ended December 31, 2022. For the year ended December 31, 2023, total investment income of $374.8 million consisted of approximately $250.8 million in cash interest from investments, approximately $33.6 million in PIK and non-cash interest from investments, approximately $0.1 million in prepayment fees, net amortization of purchase premiums and discounts of approximately $6.3 million, approximately $46.1 million in cash dividends from investments, approximately $27.4 million in PIK and non-cash dividends from investments and approximately $10.5 million in other income. The increase in interest income of approximately $78.6 million from the year ended December 31, 2022 to the year ended December 31, 2023, was primarily due to a higher effective interest rate of our portfolio due to the higher SOFR rates on our floating rate assets. The increase in dividend income from the year ended December 31, 2022 to the year ended December 31, 2023 was primarily driven by an increase in PIK dividends and an increase in cash dividends from our investments in SLP III and SLP IV, partially offset by a decrease in cash dividends from our investment in NMNLC. Other income during the year ended December 31, 2023, which represents fees that are generally non-recurring in nature, was primarily attributable to upfront, consent and amendment fees received from 35 different portfolio companies.
Operating Expenses | | | | | | | | | | | | | | |
| | Year Ended December 31, |
| (in thousands) | 2023 | | 2022 | |
| Management fee | $ | 45,610 | | | $ | 46,617 | | |
| Less: management fee waiver | (4,117) | | | (4,402) | | |
| Total management fee | 41,493 | | | 42,215 | | |
| | | | |
| | | | |
| Incentive fee | 38,303 | | | 29,901 | | |
| Interest and other financing expenses | 124,784 | | | 92,421 | | |
| Administrative fees | 4,101 | | | 4,131 | | |
| Professional fees | 3,771 | | | 3,433 | | |
| Other general and administrative expenses | 2,068 | | | 2,338 | | |
| Total expenses | 214,520 | | | 174,439 | | |
| Less: expenses waived and reimbursed | — | | | (238) | | |
| Net expenses before income taxes | 214,520 | | | 174,201 | | |
| Income tax expense | 418 | | | 825 | | |
| Net expenses after income taxes | $ | 214,938 | | | $ | 175,026 | | |
Our total net operating expenses increased by approximately $39.9 million for the year ended December 31, 2023 as compared to the year ended December 31, 2022. Our management fee, net of a management fee waiver, for the year ended December 31, 2023 as compared to the year ended December 31, 2022, remained relatively flat. Our incentive fee increased by $8.4 million for the year ended December 31, 2023 as compared to the year ended December 31, 2022. The increase in incentive fees was attributable to an increase in net investment income
Interest and other financing expenses increased by approximately $32.4 million during the year ended December 31, 2023 as compared to the year ended December 31, 2022, primarily due to higher LIBOR and SOFR rates on our floating rate borrowings, our 2022 Convertible Notes, which were initially issued in the fourth quarter of 2022 with a further issuance in the first quarter of 2023 and higher interest expense on our 8.250% Unsecured Notes, which were issued in the fourth quarter of
2023. Our increase in interest expense was partially offset by lower interest expense on our 2017A Unsecured Notes, which were fully repaid in the third quarter of 2022, lower interest expense on our 2018A Unsecured Notes, which were fully repaid in the first quarter of 2023 and lower interest expense on our 2018 Convertible Notes. Our 2018 Convertible Notes were partially repaid in the fourth quarter of 2022 in connection with our tender offer to purchase $84.4 million aggregate principal amount of outstanding 2018 Convertible Notes, with the remaining amount fully repaid at maturity in the third quarter of 2023. Our total professional fees, administrative fees, net of expenses waived and reimbursed, and other general and administrative expenses for the year ended December 31, 2023 as compared to the year ended December 31, 2022 remained relatively flat.
Net Realized Gains (Losses) and Net Change in Unrealized Appreciation (Depreciation) | | | | | | | | | | | | | | |
| | Year Ended December 31, |
| (in thousands) | 2023 | | 2022 | |
| Net realized (losses) gains on investments | $ | (32,854) | | | $ | 52,703 | | |
| Net realized gains on foreign currency | 13 | | | 827 | | |
| Net change in unrealized appreciation (depreciation) of investments | 10,316 | | | (84,134) | | |
| Net change in unrealized appreciation (depreciation) on foreign currency | 100 | | | (1,115) | | |
| Net change in unrealized depreciation of securities purchased under collateralized agreements to resell | (39) | | | (4,883) | | |
| Provision for taxes | (1,344) | | | (8,474) | | |
| Net realized and unrealized losses | $ | (23,808) | | | $ | (45,076) | | |
Our net realized losses and unrealized gains resulted in a net loss of approximately $23.8 million for the year ended December 31, 2023 compared to the net realized gains and unrealized losses resulting in a net loss of approximately $45.1 million for the same period in 2022. As movement in unrealized appreciation or depreciation can be the result of realizations, we look at net realized and unrealized gains or losses together. The net loss for the year ended December 31, 2023 was primarily driven by a realized loss in Ansira and unrealized depreciation on our investments in Edmentum and New Trojan Parent Inc., which was partially offset by unrealized appreciation in UniTek and CentralSquare Technologies, LLC. The provision for income taxes was primarily attributable to our equity investments that are held as of December 31, 2023 in eight of our corporate subsidiaries. The net loss for the year ended December 31, 2022 was primarily driven by unrealized depreciation on our investments in NM CLFX LP, Ansira, National HME and TVG-Edmentum Holdings, LLC, which was partially offset by unrealized appreciation in Haven Midstream LLC, Unitek and New Permian Holdco, Inc. and realized gains in NM GLCR LP and Haven Midstream Holdings LLC. See Monitoring of Portfolio Investments above for more details regarding the health of our portfolio companies.
Investment Income and Net Realized and Unrealized (Losses) Gains Related to Non-Controlling Interest in New Mountain Net Lease Corporation ("NMNLC")
| | | | | | | | | | | | | | | | | | | | | |
| | | Year Ended December 31, | |
| (in thousands) | | 2023 | | 2022 | | 2021 | |
| Total investment income | | $ | 374,836 | | | $ | 294,630 | | | $ | 270,959 | | |
| Net expenses after income taxes | | 214,938 | | | 175,026 | | | 152,119 | | |
| Net investment income | | 159,898 | | | 119,604 | | | 118,840 | | |
| Less: Net investment income related to non-controlling interest in NMNLC | | 980 | | | 1,107 | | | 1,326 | | |
| Net investment income related to NMFC | | $ | 158,918 | | | $ | 118,497 | | | $ | 117,514 | | |
| | | | | | | |
| Net change in realized (losses) gains on investments | | (32,854) | | | 52,703 | | | (3,864) | | |
| | | | | | | |
| Net change in realized gains on foreign currency | | 13 | | | 827 | | | 15 | | |
| Less: Net change in realized gains on investments related to non-controlling interest in NMNLC | | — | | | 4,054 | | | — | | |
| Net change in realized (losses) gains of investments related to NMFC | | $ | (32,841) | | | $ | 49,476 | | | $ | (3,849) | | |
| | | | | | | |
| Net change in unrealized appreciation (depreciation) of investments | | 10,316 | | | (84,134) | | | 92,386 | | |
| | | | | | | |
| Net change in unrealized depreciation of securities purchased under collateralized agreements to resell | | (39) | | | (4,883) | | | — | | |
| Net change in unrealized appreciation (depreciation) on foreign currency | | 100 | | | (1,115) | | | (81) | | |
| Provision for taxes | | (1,344) | | | (8,474) | | | (114) | | |
| Less: Net change in unrealized (depreciation) appreciation of investments related to non-controlling interest in NMNLC | | (233) | | | (5,365) | | | 4,457 | | |
| Net change in unrealized appreciation (depreciation) of investments related to NMFC | | $ | 9,266 | | | $ | (93,241) | | | $ | 87,734 | | |
Liquidity, Capital Resources, Off-Balance Sheet Arrangements and Contractual Obligations
Liquidity and Capital Resources
The primary use of existing funds and any funds raised in the future is expected to be for repayment of indebtedness, investments in portfolio companies, cash distributions to our stockholders or for other general corporate purposes.
Since our IPO, and through December 31, 2023, we have raised approximately $966.9 million in net proceeds from additional offerings of common stock.
Our liquidity is generated and generally available through advances from the revolving credit facilities, from cash flows from operations, and, we expect, through periodic follow-on equity offerings. In addition, we may from time to time enter into additional debt facilities, increase the size of existing facilities or issue additional debt securities, including unsecured debt and/or debt securities convertible into common stock. Any such incurrence or issuance would be subject to prevailing market conditions, our liquidity requirements, contractual and regulatory restrictions and other factors. On June 8, 2018 our shareholders approved the application of the modified asset coverage requirements set forth in Section 61(a) of the 1940 Act, which resulted in the reduction of the minimum asset coverage ratio applicable to us from 200.0% to 150.0% as of June 9, 2018. In accordance with the 1940 Act, with certain limited exceptions, we are only allowed to borrow amounts such that our asset coverage, calculated pursuant to the 1940 Act, is at least 150.0% after such borrowing (which means we can borrow $2 for every $1 of our equity). As a result of our exemptive relief received on November 5, 2014, we are permitted to exclude our SBA-guaranteed debentures from the 150.0% asset coverage ratio that we are required to maintain under the 1940 Act. The agreements governing the NMFC Credit Facility, the Convertible Notes and the Unsecured Notes (as defined below) contain certain covenants and terms, including a requirement that we not exceed a debt-to-equity ratio of 1.65 to 1.00 at the time of incurring additional indebtedness and a requirement that we not exceed a secured debt ratio of 0.70 to 1.00 at any time. As of December 31, 2023, our asset coverage ratio was 187.54%.
As of December 31, 2023 and December 31, 2022, our credit facilities consisted of the Holdings Credit Facility, NMFC Credit Facility, Unsecured Management Company Revolver, DB Credit Facility, NMNLC Credit Facility II, 2022 Convertible Notes, 2019A Unsecured Notes, 2021A Unsecured Notes, 2022A Unsecured Notes and 8.250% Unsecured Notes and SBA-guaranteed debentures. See Item 8—Financial Statements and Supplementary Data—Note 7. Borrowings in this Annual Report on Form 10-K for additional information.
At December 31, 2023 and December 31, 2022, we had cash and cash equivalents of approximately $70.1 million and $71.2 million, respectively. Our cash provided by operating activities during the years ended December 31, 2023 and December 31, 2022, was approximately $332.7 million and $35.0 million, respectively. We expect that all current liquidity needs will be met with cash flows from operations and other activities.
On November 3, 2021, we entered into an equity distribution agreement, as amended on May 18, 2023 and August 23, 2023 (the “Distribution Agreement”) with B. Riley Securities, Inc. and Raymond James & Associates, Inc. (collectively, the “Agents”). The Distribution Agreement provides that we may issue and sell our shares from time to time through the Agents, up to $250.0 million worth of our common stock by means of at-the-market ("ATM") offerings.
For the year ended December 31, 2023, we sold 1,621,833 shares of common stock under the Distribution Agreement. For the same period, we received total accumulated net proceeds of approximately $21.2 million, including $0.0 million of offering expenses from these sales. For the year ended December 31, 2022, we sold 2,950,300 shares of common stock under the Distribution Agreement. For the same period, we received total accumulated net proceeds of approximately $40.0 million, including $0.4 million of offering expenses from these sales.
We generally use net proceeds from these ATM offerings to make investments, to pay down liabilities and for general corporate purposes. As of December 31, 2023 and December 31, 2022, shares representing approximately $175.7 million and $196.9 million, respectively, of our common stock remain available for issuance and sale under the Distribution Agreement.
Off-Balance Sheet Agreements
We may become a party to financial instruments with off-balance sheet risk in the normal course of business to meet the financial needs of our portfolio companies. These instruments may include commitments to extend credit and involve, to varying degrees, elements of liquidity and credit risk in excess of the amount recognized in the balance sheet. As of December 31, 2023 and December 31, 2022, we had outstanding commitments to third parties to fund investments totaling $156.8 million and $224.1 million, respectively, under various undrawn revolving credit facilities, delayed draw commitments or other future funding commitments.
We may from time to time enter into financing commitment letters or bridge financing commitments, which could require funding in the future. As of December 31, 2023 and December 31, 2022, we had commitment letters to purchase investments in an aggregate par amount of $11.1 million and $45.6 million, respectively. As of December 31, 2023 and December 31, 2022, we had not entered into any bridge financing commitments which could require funding in the future.
Contractual Obligations
A summary of our significant contractual payment obligations as of December 31, 2023 is as follows: | | | | | | | | | | | | | | | | | | | | | | | | | | | | | |
| | Contractual Obligations Payments Due by Period |
| (in millions) | Total | | Less than
1 Year | | 1 - 3 Years | | 3 - 5 Years | | More than
5 Years |
| Holdings Credit Facility(1) | $ | 515.1 | | | $ | — | | | $ | — | | | $ | 515.1 | | | $ | — | |
| Unsecured Notes(2) | 506.5 | | | 116.5 | | | 200.0 | | | 190.0 | | | — | |
| SBA-guaranteed debentures(3) | 300.0 | | | — | | | 121.7 | | | 43.3 | | | 135.0 | |
| Convertible Notes(4) | 260.0 | | | — | | | 260.0 | | | — | | | — | |
| DB Credit Facility(5) | 186.4 | | | — | | | — | | | 186.4 | | | — | |
| NMFC Credit Facility(6) | 36.8 | | | — | | | 36.8 | | | — | | | — | |
| NMNLC Credit Facility II(7) | 2.9 | | | 2.9 | | | — | | | — | | | — | |
| Total Contractual Obligations | $ | 1,807.7 | | | $ | 119.4 | | | $ | 618.5 | | | $ | 934.8 | | | $ | 135.0 | |
(1)Under the terms of the $730.0 million Holdings Credit Facility, all outstanding borrowings under that facility ($515.1 million as of December 31, 2023) must be repaid on or before October 26, 2028. As of December 31, 2023, there was approximately $214.9 million of possible capacity remaining under the Holdings Credit Facility.
(2)$116.5 million of the 2019A Unsecured Notes were repaid on February 5, 2024. $200.0 million of the 2021A Unsecured Notes will mature on January 29, 2026 unless earlier repurchased, $75.0 million of the 2022A Unsecured Notes will mature on June 15, 2027 unless earlier repurchased and $115.0 million of the 8.250% Unsecured Notes will mature on November 15, 2028 unless earlier redeemed.
(3)Our SBA-guaranteed debentures will begin to mature on March 1, 2025.
(4)The 2022 Convertible Notes will mature on October 15, 2025 unless earlier converted or purchased at the holder's option or redeemed by us.
(5)Under the terms of the $280.0 million DB Credit Facility, all outstanding borrowings under that facility ($186.4 million as of December 31, 2023) must be repaid on or before March 25, 2027. As of December 31, 2023, there was approximately $93.6 million of possible capacity remaining under the DB Credit Facility.
(6)Under the terms of the $198.5 million NMFC Credit Facility, all outstanding borrowings under that facility ($36.8 million, which included £22.9 million denominated in GBP and €0.7 million denominated in EUR that have been converted to U.S. dollars as of December 31, 2023) must be repaid on or before June 4, 2026. As of December 31, 2023, there was approximately $161.7 million of available capacity remaining under the NMFC Credit Facility.
(7)Under the terms of the NMNLC Credit Facility II, all outstanding borrowings under that facility must be repaid on or before November 1, 2024. As of December 31, 2023, the outstanding borrowings for all borrowers was $25.4 million, of which $2.9 million was outstanding for NMNLC.
We have entered into an investment management and advisory agreement (the "Investment Management Agreement") with the Investment Adviser in accordance with the 1940 Act. Under the Investment Management Agreement, the Investment Adviser has agreed to provide us with investment advisory and management services. We have agreed to pay for these services (1) a management fee and (2) an incentive fee based on our performance.
We have also entered into the administration agreement, as amended and restated (the "Administration Agreement") with the Administrator. Under the Administration Agreement, the Administrator has agreed to arrange office space for us and provide office equipment and clerical, bookkeeping and record keeping services and other administrative services necessary to conduct our respective day-to-day operations. The Administrator has also agreed to maintain, or oversee the maintenance of, our financial records, our reports to stockholders and reports filed with the SEC.
If any of the contractual obligations discussed above are terminated, our costs under any new agreements that are entered into may increase. In addition, we would likely incur significant time and expense in locating alternative parties to provide the services we expect to receive under the Investment Management Agreement and the Administration Agreement.
Distributions and Dividends
Distributions declared and paid to stockholders for the year ended December 31, 2023 totaled approximately $150.7 million.
The following table reflects cash distributions, including dividends and returns of capital, if any, per share that have been declared by our board of directors for the years ended December 31, 2023 and December 31, 2022: | | | | | | | | | | | | | | | | | | | | | | | | | | |
| Fiscal Year Ended | | Date Declared | | Record Date | | Payment Date | | Per Share Amount (1) |
| December 31, 2023 | | | | | | | | |
| Fourth Quarter | | December 8, 2023 | | December 22, 2023 | | December 29, 2023 | | $ | 0.10 | (2) |
| Fourth Quarter | | October 24, 2023 | | December 15, 2023 | | December 29, 2023 | | 0.36 | (3) |
| Third Quarter | | July 27, 2023 | | September 15, 2023 | | September 29, 2023 | | 0.36 | (4) |
| Second Quarter | | April 25, 2023 | | June 16, 2023 | | June 30, 2023 | | 0.35 | (5) |
| First Quarter | | January 24, 2023 | | March 17, 2023 | | March 31, 2023 | | 0.32 | |
| | | | | | | | $ | 1.49 | |
| December 31, 2022 | | | | | | | | |
| Fourth Quarter | | November 2, 2022 | | December 16, 2022 | | December 30, 2022 | | $ | 0.32 | |
| Third Quarter | | August 3, 2022 | | September 16, 2022 | | September 30, 2022 | | 0.30 | |
| Second Quarter | | May 3, 2022 | | June 16, 2022 | | June 30, 2022 | | 0.30 | |
| First Quarter | | February 23, 2022 | | March 17, 2022 | | March 31, 2022 | | 0.30 | |
| | | | | | | | | $ | 1.22 | |
(1)Tax characteristics of all distributions paid are reported to stockholders on Form 1099 after the end of the calendar year. For the years ended December 31, 2023 and December 31, 2022, total distributions were $150.7 million and $122.4 million, respectively, of which the distributions were comprised of approximately 93.14% and 70.59%, respectively, of ordinary income, 6.86% and 0.00% respectively, of qualified income, 0.00% and 20.79%, respectively, of long-term capital gains and approximately 0.00% and 8.62%, respectively, of a return of capital. Future quarterly distributions, if any, will be determined by our board of directors.
(2)Special distribution of excess undistributed taxable income, driven primarily from the gain realized on our investment in Haven Midstream Holdings LLC.
(3)Includes a regular quarterly distribution of $0.32 per share and a supplemental distribution related to third quarter earnings of $0.04 per share.
(4)Includes a regular quarterly distribution of $0.32 per share and a supplemental distribution related to second quarter earnings of $0.04 per share.
(5)Includes a regular quarterly distribution of $0.32 per share and a supplemental distribution related to first quarter earnings of $0.03 per share.
We intend to pay quarterly distributions to our stockholders in amounts sufficient to maintain our status as a RIC. We intend to distribute approximately all of our net investment income on a quarterly basis and substantially all of our taxable income on an annual basis, except that we may retain certain net capital gains for reinvestment.
We maintain an "opt out" dividend reinvestment plan on behalf of our common stockholders, pursuant to which each of our stockholders' cash distributions will be automatically reinvested in additional shares of our common stock, unless the stockholder elects to receive cash. See Item 8—Financial Statements and Supplementary Data—Note 2. Summary of Significant Accounting Policies in this Annual Report on Form 10-K for additional details regarding our dividend reinvestment plan.
Related Parties
We have entered into a number of business relationships with affiliated or related parties, including the following:
•We have entered into the Investment Management Agreement with the Investment Adviser, a wholly-owned subsidiary of New Mountain Capital. Therefore, New Mountain Capital is entitled to any profits earned by the Investment Adviser, which includes any fees payable to the Investment Adviser under the terms of the Investment Management Agreement, less expenses incurred by the Investment Adviser in performing its services under the Investment Management Agreement.
•We have entered into a fee waiver agreement (the "Fee Waiver Agreement") with the Investment Adviser, pursuant to which the Investment Adviser agreed to voluntarily reduce the base management fees payable to the Investment Adviser by us under the Investment Management Agreement beginning with the quarter ended March 31, 2021 through the quarter ending December 31, 2024. See Item 8— Financial Statements—Note 5. Agreements for details.
•We have entered into the Administration Agreement with the Administrator, a wholly-owned subsidiary of New Mountain Capital. The Administrator arranges our office space and provides office equipment and administrative services necessary to conduct our respective day-to-day operations pursuant to the Administration Agreement. We reimburse the Administrator for the allocable portion of overhead and other expenses incurred by it in performing its obligations to us under the Administration Agreement, which includes the fees and expenses associated with performing administrative, finance, and compliance functions, and the compensation of our chief financial officer and chief compliance officer and their respective staffs. Pursuant to the Administration Agreement and further restricted by us, the Administrator may, in its own discretion, submit to us for reimbursement some or all of the expenses that the Administrator has incurred on our behalf during any quarterly period. As a result, the amount of expenses for which we will have to reimburse the Administrator may fluctuate in future quarterly periods and there can be no assurance given as to when, or if, the Administrator may determine to limit the expenses that the Administrator submits to us for reimbursement in the future. However, it is expected that the Administrator will continue to support part of our expense burden in the near future and may decide to not calculate and charge through certain overhead related amounts as well as continue to cover some of the indirect costs. The Administrator cannot recoup any expenses that the Administrator has previously waived. For the year ended December 31, 2023 approximately $2.3 million of indirect administrative expenses were included in administrative expenses, of which approximately $0.0 million were waived by the Administrator. As of December 31, 2023, approximately $0.7 million of indirect administrative expenses were included in payable to affiliates. For the year ended December 31, 2023, the reimbursement to the Administrator represented approximately 0.07% of our gross assets.
•We, the Investment Adviser and the Administrator have entered into a royalty-free Trademark License Agreement, as amended, with New Mountain Capital, pursuant to which New Mountain Capital has agreed to grant us, the Investment Adviser and the Administrator, a non-exclusive, royalty-free license to use the name "New Mountain" and "New Mountain Finance", as well as the NMF logo.
In addition, we have adopted a formal code of ethics that governs the conduct of our officers and directors, which is available on our website at http://www.newmountainfinance.com. These officers and directors also remain subject to the duties imposed by the 1940 Act and the Delaware General Corporation Law.
The Investment Adviser and its affiliates may also manage other funds in the future that may have investment mandates that are similar, in whole or in part, to our investment mandates. The Investment Adviser and its affiliates may determine that an investment is appropriate for us and for one or more of those other funds. In such event, depending on the availability of such investment and other appropriate factors, the Investment Adviser or its affiliates may determine that we should invest side-by-side with one or more other funds. Any such investments will be made only to the extent permitted by applicable law and interpretive positions of the SEC and its staff, and consistent with the Investment Adviser's allocation procedures. On October 8, 2019, the SEC issued an exemptive order (the “Exemptive Order”), which superseded a prior order issued on December 18, 2017, which permits us to co-invest in portfolio companies with certain funds or entities managed by the Investment Adviser or its affiliates in certain negotiated transactions where co-investing would otherwise be prohibited under the 1940 Act, subject to the conditions of the Exemptive Order. Pursuant to the Exemptive Order, we are permitted to co-invest with our affiliates if a “required majority” (as defined in Section 57(o) of the 1940 Act) of our independent directors make certain conclusions in connection with a co-investment transaction, including, but not limited to, that (1) the terms of the potential co-investment transaction, including the consideration to be paid, are reasonable and fair to us and our stockholders and do not involve overreaching in respect of us or our stockholders on the part of any person concerned, and (2) the potential co-investment transaction is consistent with the interests of our stockholders and is consistent with our then-current investment objective and strategies. The Exemptive Order was amended on August 30, 2022 to permit us to complete follow-on investments in our existing portfolio companies with certain affiliates that are private funds if such private funds do not hold an investment in such existing portfolio company, subject to certain conditions.
On March 30, 2020, an affiliate of the Investment Adviser purchased directly from NMNLC 105,030 shares of NMNLC’s common stock at a price of $107.73 per share, which represented the net asset value per share of NMNLC at the date of purchase, for an aggregate purchase price of approximately $11.3 million. Immediately thereafter, NMNLC redeemed 105,030 shares of its common stock held by NMFC in exchange for a promissory note with a principal amount of $11.3 million and a 7.0% interest rate, which was repaid by NMNLC to NMFC on March 31, 2020.
On March 30, 2020, we entered into the Unsecured Management Company Revolver with NMF Investments III, L.L.C., an affiliate of the Investment Adviser, with a $30.0 million maximum amount of revolver borrowings available and a maturity date of December 31, 2022. On May 4, 2020, we entered into an Amended and Restated Uncommitted Revolving Loan Agreement with NMF Investments III, L.L.C., which increased the maximum amounts of revolving borrowings available thereunder from $30.0 million to $50.0 million. On December 17, 2021, we entered into Amendment No. 1 to the Amended and Restated Uncommitted Revolving Loan Agreement with NMF Investments III, L.L.C., which lowered the interest rate and
extended the maturity date from December 31, 2022 to December 31, 2024. On October 31, 2023, we entered into a Second Amendment and Restated Uncommitted Revolving Loan Agreement with NMF Investments III, L.L.C., which increased the maximum amount of revolving borrowings thereunder from $50.0 million to $100.0 million, extended the maturity date from December 31, 2024 to December 31, 2027 and changed the interest rate to the Applicable Federal Rate. Refer to Item 8 — Financial Statements and Supplementary Data — Note 7. Borrowings, for discussion of the Unsecured Management Company Revolver.
Item 7A. Quantitative and Qualitative Disclosures About Market Risk
We are subject to certain financial market risks, such as interest rate fluctuations. Because we fund a portion of our investments with borrowings, our net investment income is affected by the difference between the rate at which we invest and the rate at which we borrow. As a result, there can be no assurance that a significant change in market interest rates will not have a material adverse effect on our net investment income. Since March 2022, the Federal Reserve has been rapidly raising interest rates and has indicated that it would consider additional rate hikes in response to ongoing inflation concerns. In a rising interest rate environment, our net investment income would increase due to an increase in interest income generated by our investment portfolio. However, our cost of funds would also increase, which could also impact net investment income. It is possible that the Federal Reserve's tightening cycle could result in a recession in the United States, which would likely decrease interest rates. Alternatively, in a prolonged low interest rate environment, including a reduction of base rates, such as SONIA or SOFR, to zero, the difference between the total interest income earned on interest earning assets and the total interest expense incurred on interest bearing liabilities may be compressed, reducing our net interest income and potentially adversely affecting our operating results. During the year ended December 31, 2023, certain of the loans held in our portfolio had floating LIBOR, SONIA or SOFR interest rates. As of December 31, 2023, approximately 86.46% of our investments at fair value (excluding investments on non-accrual, unfunded debt investments and non-interest bearing equity investments) represent floating-rate investments with a LIBOR, SONIA or SOFR floor (includes investments bearing prime interest rate contracts) and approximately 13.54% of investments at fair value represent fixed-rate investments. Additionally, our senior secured revolving credit facilities are also subject to floating interest rates and are currently paid based on floating SONIA or SOFR rates.
The following table estimates the potential changes in interest income, net of interest expense, should interest rates increase by 100, 200 or 300 basis points, or decrease by 25 basis points. Interest income is calculated as revenue from interest generated from our portfolio of investments held on December 31, 2023. Interest expense is calculated based on the terms of our outstanding revolving credit facilities, convertible notes and unsecured notes. For our credit facilities, we use the outstanding balance as of December 31, 2023. This analysis does not take into account the impact of the incentive fee or other expenses. The base interest rate case assumes the rates on our portfolio investments remain unchanged from the actual effective interest rates as of December 31, 2023. These hypothetical calculations are based on a model of the investments in our portfolio, held as of December 31, 2023, and are only adjusted for assumed changes in the underlying base interest rates.
Actual results could differ significantly from those estimated in the table. | | | | | |
| Change in Interest Rates | Estimated Percentage
Change in Interest
Income Net of
Interest Expense
(unaudited) |
| –25 Basis Points | (1.97) | % |
| Base Interest Rate | — | % |
| +100 Basis Points | 7.87 | % |
| +200 Basis Points | 15.75 | % |
| +300 Basis Points | 23.62 | % |
Item 8. Financial Statements and Supplementary Data
TABLE OF CONTENTS
| | | | | |
| | PAGE |
| AUDITED FINANCIAL STATEMENTS | |
| |
| |
| |
| |
| |
| |
| |
| |
| | | | | |
| Deloitte & Touche LLP 30 Rockefeller Plaza New York, NY 10112 USA Tel: 212 492 4000 Fax: 212 489 1687 www.deloitte.com |
REPORT OF INDEPENDENT REGISTERED PUBLIC ACCOUNTING FIRM
To the shareholders and the Board of Directors of New Mountain Finance Corporation
Opinion on the Consolidated Financial Statements and Financial Highlights
We have audited the accompanying consolidated statements of assets and liabilities of New Mountain Finance Corporation and subsidiaries (the "Company"), including the consolidated schedules of investments, as of December 31, 2023 and 2022, the related consolidated statements of operations, changes in net assets, and cash flows for each of the three years in the period then ended, the consolidated financial highlights for each of the five years in the period then ended, and the related notes. In our opinion, the consolidated financial statements and financial highlights present fairly, in all material respects, the financial position of the Company as of December 31, 2023 and 2022, and the results of its operations, changes in net assets, and cash flows for each of the three years in the period then ended, and the financial highlights for each of the five years in the period then ended, in conformity with accounting principles generally accepted in the United States of America.
We have also audited, in accordance with the standards of the Public Company Accounting Oversight Board (United States) (PCAOB), the Company's internal control over financial reporting as of December 31, 2023, based on criteria established in Internal Control — Integrated Framework (2013) issued by the Committee of Sponsoring Organizations of the Treadway Commission and our report dated February 26, 2024, expressed an unqualified opinion on the Company's internal control over financial reporting.
Basis for Opinion
These consolidated financial statements and financial highlights are the responsibility of the Company's management. Our responsibility is to express an opinion on the Company's consolidated financial statements and financial highlights based on our audits. We are a public accounting firm registered with the PCAOB and are required to be independent with respect to the Company in accordance with the U.S. federal securities laws and the applicable rules and regulations of the Securities and Exchange Commission and the PCAOB.
We conducted our audits in accordance with the standards of the PCAOB. Those standards require that we plan and perform the audit to obtain reasonable assurance about whether the consolidated financial statements and financial highlights are free of material misstatement, whether due to error or fraud.
Our audits included performing procedures to assess the risks of material misstatement of the consolidated financial statements and financial highlights, whether due to error or fraud, and performing procedures that respond to those risks. Such procedures included examining, on a test basis, evidence regarding the amounts and disclosures in the consolidated financial statements and financial highlights. Our audits also included evaluating the accounting principles used and significant estimates made by management, as well as evaluating the overall presentation of the consolidated financial statements and financial highlights. Our procedures included confirmation of investments owned as of December 31, 2023 and 2022, by correspondence with the custodian, loan agents, and borrowers; when replies were not received, we performed other auditing procedures. We believe that our audits provide a reasonable basis for our opinion.
Critical Audit Matter
The critical audit matter communicated below is a matter arising from the current-period audit of the consolidated financial statements that was communicated or required to be communicated to the audit committee and that (1) relates to accounts or disclosures that are material to the consolidated financial statements and (2) involved our especially challenging, subjective, or complex judgments. The communication of critical audit matters does not alter in any way our opinion on the consolidated financial statements, taken as a whole, and we are not, by communicating the critical audit matter below, providing a separate opinion on the critical audit matter or on the accounts or disclosures to which it relates.
Fair Value – Investments — Refer to Footnotes 2, 3, and 4 in the consolidated financial statements
Critical Audit Matter Description
The Company invests in debt securities, including first and second lien debt, notes, bonds, mezzanine securities, and equity interests. The Company’s determination of fair value for these investments involves subjective judgments and estimates utilizing a market approach, an income approach, or both approaches, as appropriate. These approaches require management to make judgments and estimates related to significant unobservable inputs including the selection of discount rates and EBITDA or revenue multiples based on multiples of publicly traded comparable companies and comparable transactions.
We identified the valuation of investments as a critical audit matter given the significant judgments made by management to estimate the fair value of certain debt and equity positions. This required a high degree of auditor judgment and extensive audit effort, including the need to involve internal fair value specialists who possess significant valuation experience and modeling expertise, to evaluate the appropriateness of the valuation methodologies and the significant unobservable inputs.
How the Critical Audit Matter Was Addressed in the Audit
Our audit procedures related to the valuation methodologies and unobservable inputs used by management to estimate the fair value of investments included the following, among others:
•We tested the operating effectiveness of controls over the valuation of investments, including those over the selection of valuation methodologies and development of unobservable inputs.
•We evaluated the reasonableness and consistency of application of the Company's valuation polices over investments, including those surrounding the selection of valuation methodologies and the derivation of valuation inputs.
•With the assistance of our internal fair value specialists, we evaluated the appropriateness of the valuation methodologies and the reasonableness of the significant unobservable inputs.
•With the assistance of our internal fair value specialists, in certain instances, we developed independent fair value estimates and compared our estimates to the Company's estimates.
•We evaluated the impact of current market events and conditions on the selected valuation methodologies and significant unobservable inputs.
/s/ DELOITTE & TOUCHE LLP
February 26, 2024
We have served as the Company's auditor since 2008.
New Mountain Finance Corporation
Consolidated Statements of Assets and Liabilities
(in thousands, except shares and per share data) | | | | | | | | | | | |
| | December 31, 2023 | | December 31, 2022 |
| Assets | | | |
| Investments at fair value | | | |
Non-controlled/non-affiliated investments (cost of $2,283,490 and $2,523,522, respectively) | $ | 2,209,867 | | | $ | 2,400,425 | |
Non-controlled/affiliated investments (cost of $107,895 and $85,971, respectively) | 133,659 | | | 130,787 | |
Controlled investments (cost of $646,823 and $650,474, respectively) | 667,796 | | | 690,035 | |
Total investments at fair value (cost of $3,038,208 and $3,259,967, respectively) | 3,011,322 | | | 3,221,247 | |
Securities purchased under collateralized agreements to resell (cost of $30,000 and $30,000, respectively) | 16,500 | | | 16,539 | |
| Cash and cash equivalents | 70,090 | | | 71,190 | |
| Interest and dividend receivable | 44,107 | | | 36,154 | |
| Deferred tax asset | 594 | | | — | |
| Receivable from affiliates | 82 | | | — | |
| | | |
| Other assets | 16,519 | | | 9,797 | |
| Total assets | $ | 3,159,214 | | | $ | 3,354,927 | |
| Liabilities | | | |
| Borrowings | | | |
| Holdings Credit Facility | $ | 515,063 | | | $ | 618,963 | |
| Unsecured Notes | 506,500 | | | 531,500 | |
| SBA-guaranteed debentures | 300,000 | | | 300,000 | |
| Convertible Notes | 260,207 | | | 316,853 | |
| DB Credit Facility | 186,400 | | | 186,400 | |
| NMFC Credit Facility | 36,813 | | | 40,359 | |
| NMNLC Credit Facility II | 2,853 | | | 3,785 | |
Deferred financing costs (net of accumulated amortization of $54,263 and $47,531, respectively) | (22,387) | | | (17,199) | |
| Net borrowings | 1,785,449 | | | 1,980,661 | |
| Management fee payable | 10,116 | | | 10,524 | |
| Incentive fee payable | 8,555 | | | 6,296 | |
| Interest payable | 20,440 | | | 19,627 | |
| | | |
| Payable to affiliates | — | | | 78 | |
| Deferred tax liability | — | | | 8,487 | |
| Other liabilities | 2,931 | | | 3,063 | |
| Total liabilities | 1,827,491 | | | 2,028,736 | |
| Commitments and contingencies (See Note 9) | | | |
| Net assets | | | |
Preferred stock, par value $0.01 per share, 2,000,000 shares authorized, none issued | — | | | — | |
Common stock, par value $0.01 per share, 200,000,000 shares authorized and 102,558,859 and 100,937,026 shares issued and outstanding, respectively | 1,026 | | | 1,009 | |
| Paid in capital in excess of par | 1,331,269 | | | 1,305,945 | |
| | | |
| Accumulated undistributed earnings | (12,344) | | | 7,519 | |
| Total net assets of New Mountain Finance Corporation | $ | 1,319,951 | | | $ | 1,314,473 | |
| Non-controlling interest in New Mountain Net Lease Corporation | 11,772 | | | 11,718 | |
| Total net assets | $ | 1,331,723 | | | $ | 1,326,191 | |
| Total liabilities and net assets | $ | 3,159,214 | | | $ | 3,354,927 | |
| Number of shares outstanding | 102,558,859 | | | 100,937,026 | |
| Net asset value per share of New Mountain Finance Corporation | $ | 12.87 | | | $ | 13.02 | |
The accompanying notes are an integral part of these consolidated financial statements.
88
New Mountain Finance Corporation
Consolidated Statements of Operations
(in thousands, except shares and per share data) | | | | | | | | | | | | | | | | | |
| | Year Ended December 31, |
| | 2023 | | 2022 | | 2021 |
| Investment income | | | | | |
| From non-controlled/non-affiliated investments: | | | | | |
| Interest income (excluding Payment-in-kind ("PIK") interest income) | $ | 249,851 | | | $ | 184,367 | | | $ | 159,189 | |
| PIK interest income | 15,968 | | | 11,767 | | | 8,582 | |
| Dividend income | 193 | | | 193 | | | 915 | |
| Non-cash dividend income | 17,481 | | | 14,071 | | | 10,153 | |
| Other income | 4,981 | | | 9,156 | | | 14,106 | |
| From non-controlled/affiliated investments: | | | | | |
| Interest income (excluding PIK interest income) | 1,951 | | | 1,062 | | | 1,579 | |
| PIK interest income | 2,183 | | | 1,043 | | | 434 | |
| Dividend income | — | | | — | | | 288 | |
| Non-cash dividend income | 4,625 | | | 4,109 | | | 4,835 | |
| Other income | 251 | | | 250 | | | 345 | |
| From controlled investments: | | | | | |
| Interest income (excluding PIK interest income) | 5,386 | | | 9,438 | | | 5,470 | |
| PIK interest income | 15,443 | | | 4,516 | | | 14,327 | |
| Dividend income | 45,905 | | | 43,149 | | | 41,659 | |
| Non-cash dividend income | 5,303 | | | 4,363 | | | 4,497 | |
| Other income | 5,315 | | | 7,146 | | | 4,580 | |
| Total investment income | 374,836 | | | 294,630 | | | 270,959 | |
| Expenses | | | | | |
| Interest and other financing expenses | 124,784 | | | 92,421 | | | 73,098 | |
| Management fee | 45,610 | | | 46,617 | | | 52,960 | |
| Incentive fee | 38,303 | | | 29,901 | | | 29,710 | |
| Administrative expenses | 4,101 | | | 4,131 | | | 4,461 | |
| Professional fees | 3,771 | | | 3,433 | | | 3,197 | |
| Other general and administrative expenses | 2,068 | | | 2,338 | | | 1,923 | |
| Total expenses | 218,637 | | | 178,841 | | | 165,349 | |
| Less: management fee waived (see Note 5) | (4,117) | | | (4,402) | | | (13,104) | |
| Less: expenses waived and reimbursed (see Note 5) | — | | | (238) | | | (244) | |
| Net expenses | 214,520 | | | 174,201 | | | 152,001 | |
| Net investment income before income taxes | 160,316 | | | 120,429 | | | 118,958 | |
| Income tax expense | 418 | | | 825 | | | 118 | |
| Net investment income | 159,898 | | | 119,604 | | | 118,840 | |
| Net realized (losses) gains: | | | | | |
| Non-controlled/non-affiliated investments | (49,267) | | | (737) | | | (3,167) | |
| Non-controlled/affiliated investments | — | | | — | | | 8,338 | |
| Controlled investments | 16,413 | | | 53,440 | | | (9,035) | |
| | | | | |
| Foreign currency | 13 | | | 827 | | | 15 | |
| Net change in unrealized appreciation (depreciation): | | | | | |
| Non-controlled/non-affiliated investments | 47,956 | | | (81,197) | | | (23,466) | |
| Non-controlled/affiliated investments | (19,052) | | | (9,156) | | | 66,505 | |
| Controlled investments | (18,588) | | | 6,219 | | | 49,347 | |
| Securities purchased under collateralized agreements to resell | (39) | | | (4,883) | | | — | |
| Foreign currency | 100 | | | (1,115) | | | (81) | |
| | | | | |
| Provision for taxes | (1,344) | | | (8,474) | | | (114) | |
| Net realized and unrealized (losses) gains | (23,808) | | | (45,076) | | | 88,342 | |
| Net increase in net assets resulting from operations | 136,090 | | | 74,528 | | | 207,182 | |
| Less: Net (increase) decrease in net assets resulting from operations related to non-controlling interest in New Mountain Net Lease Corporation | (747) | | | 204 | | | (5,783) | |
| Net increase in net assets resulting from operations related to New Mountain Finance Corporation | $ | 135,343 | | | $ | 74,732 | | | $ | 201,399 | |
| Basic earnings per share | $ | 1.34 | | | $ | 0.75 | | | $ | 2.08 | |
| Weighted average shares of common stock outstanding—basic (See Note 12) | 101,118,302 | | | 100,202,847 | | | 96,952,959 | |
| Diluted earnings per share | $ | 1.24 | | | $ | 0.74 | | | $ | 1.91 | |
| Weighted average shares of common stock outstanding—diluted (See Note 12) | 123,488,882 | | | 115,426,198 | | | 110,210,545 | |
| Distributions declared and paid per share | $ | 1.49 | | | $ | 1.22 | | | $ | 1.20 | |
The accompanying notes are an integral part of these consolidated financial statements.
89
New Mountain Finance Corporation
Consolidated Statements of Changes in Net Assets
(in thousands, except share data) | | | | | | | | | | | | | | | | | |
| | Year Ended December 31, |
| | 2023 | | 2022 | | 2021 |
| Increase (decrease) in net assets resulting from operations | | | | | |
| Net investment income | $ | 159,898 | | | $ | 119,604 | | | $ | 118,840 | |
| Net realized (losses) gains on investments, New Mountain Net Lease Corporation ("NMNLC") and foreign currency | (32,841) | | | 53,530 | | | (3,849) | |
| Net change in unrealized appreciation (depreciation) of investments, NMNLC and foreign currency | 10,416 | | | (85,249) | | | 92,305 | |
| Net change in unrealized depreciation of securities purchased under collateralized agreements to resell | (39) | | | (4,883) | | | — | |
| Provision for taxes | (1,344) | | | (8,474) | | | (114) | |
| Net increase in net assets resulting from operations | 136,090 | | | 74,528 | | | 207,182 | |
| Less: Net (increase) decrease in net assets resulting from operations related to non-controlling interests in NMNLC | (747) | | | 204 | | | (5,783) | |
| Net increase in net assets resulting from operations related to New Mountain Finance Corporation | 135,343 | | | 74,732 | | | 201,399 | |
| Capital transactions | | | | | |
| Net proceeds from shares sold | 21,241 | | | 40,006 | | | 12,427 | |
| Offering costs | (369) | | | (222) | | | (231) | |
| | | | | |
| Distributions declared to stockholders from net investment income | (150,737) | | | (122,386) | | | (116,453) | |
| Reinvestment of distributions | — | | | 1,098 | | | 2,228 | |
| | | | | |
| Total net decrease in net assets resulting from capital transactions | (129,865) | | | (81,504) | | | (102,029) | |
| Net increase (decrease) in net assets | 5,478 | | | (6,772) | | | 99,370 | |
| New Mountain Finance Corporation net assets at the beginning of the period | 1,314,473 | | | 1,321,245 | | | 1,221,875 | |
| New Mountain Finance Corporation net assets at the end of the period | 1,319,951 | | | 1,314,473 | | | 1,321,245 | |
| Non-controlling interest in NMNLC | 11,772 | | | 11,718 | | | 21,367 | |
| Net assets at the end of the period | $ | 1,331,723 | | | $ | 1,326,191 | | | $ | 1,342,612 | |
| | | | | |
| Capital share activity | | | | | |
| Shares sold | 1,621,833 | | | 2,950,300 | | | 914,175 | |
| Shares issued from the reinvestment of distributions | — | | | 79,285 | | | 165,924 | |
| | | | | |
| | | | | |
| Net increase in shares outstanding | 1,621,833 | | | 3,029,585 | | | 1,080,099 | |
The accompanying notes are an integral part of these consolidated financial statements.
90
New Mountain Finance Corporation
Consolidated Statements of Cash Flows
(in thousands) | | | | | | | | | | | | | | | | | |
| | Year Ended December 31, |
| | 2023 | | 2022 | | 2021 |
| Cash flows from operating activities | | | | | |
| Net increase in net assets resulting from operations | $ | 136,090 | | | $ | 74,528 | | | $ | 207,182 | |
| Adjustments to reconcile net (increase) decrease in net assets resulting from operations to net cash (used in) provided by operating activities: | | | | | |
| Net realized losses (gains) on investments and New Mountain Net Lease Corporation ("NMNLC") | 32,854 | | | (52,703) | | | 3,864 | |
| Net realized gains on translation of assets and liabilities in foreign currencies | (13) | | | (827) | | | (15) | |
| Net change in unrealized (appreciation) depreciation of investments and NMNLC | (10,316) | | | 84,134 | | | (92,386) | |
| Net change in unrealized (appreciation) depreciation on translation of assets and liabilities in foreign currencies | (100) | | | 1,115 | | | 81 | |
| Net change in unrealized depreciation of securities purchased under collateralized agreements to resell | 39 | | | 4,883 | | | — | |
| Amortization of purchase discount | (6,328) | | | (5,631) | | | (8,567) | |
| Amortization of deferred financing costs | 6,780 | | | 6,837 | | | 7,388 | |
| Amortization of premium on Convertible Notes | (130) | | | (130) | | | (103) | |
| Non-cash investment income | (61,492) | | | (40,037) | | | (50,377) | |
| (Increase) decrease in operating assets: | | | | | |
| | | | | |
| Purchase of investments and delayed draw facilities | (283,663) | | | (620,885) | | | (1,134,752) | |
| Proceeds from sales and paydowns of investments | 540,460 | | | 583,840 | | | 1,066,740 | |
Cash received for purchase of undrawn portion of revolving credit
or delayed draw facilities | 224 | | | 370 | | | 811 | |
| Cash paid for purchase of drawn portion of revolving credit facilities | — | | | (185) | | | (978) | |
| Cash paid for drawn revolvers | (28,090) | | | (41,078) | | | (32,671) | |
| Cash repayments on drawn revolvers | 27,793 | | | 42,827 | | | 27,107 | |
| Interest and dividend receivable | (7,907) | | | (5,260) | | | (2,457) | |
| Receivable from affiliates | (82) | | | — | | | 117 | |
| Deferred tax (asset) liability | (594) | | | — | | | 101 | |
| Receivable from unsettled securities sold | — | | | — | | | 9,019 | |
| Other assets | (6,623) | | | 1,333 | | | (5,105) | |
| (Decrease) increase in operating liabilities: | | | | | |
| Interest payable | 813 | | | 2,239 | | | 1,801 | |
| Management fee payable | (408) | | | 360 | | | (255) | |
| Incentive fee payable | 2,259 | | | (1,207) | | | 149 | |
| Payable for unsettled securities purchased | — | | | (7,910) | | | (18,932) | |
| Deferred tax (liability) asset | (8,487) | | | 8,474 | | | 13 | |
| Payable to affiliates | (78) | | | (478) | | | (311) | |
| Other liabilities | (272) | | | 397 | | | 479 | |
| | | | | |
| Net cash flows provided by (used in) operating activities | 332,729 | | | 35,006 | | | (22,057) | |
| Cash flows from financing activities | | | | | |
| Net proceeds from shares sold | 21,241 | | | 40,006 | | | 12,427 | |
| Distributions paid | (150,737) | | | (121,288) | | | (114,225) | |
| Offering costs paid | (409) | | | (204) | | | (205) | |
| Proceeds from Holdings Credit Facility | 199,600 | | | 277,400 | | | 211,000 | |
| Repayment of Holdings Credit Facility | (303,500) | | | (203,700) | | | (115,900) | |
| Proceeds from Unsecured Notes | 115,000 | | | 75,000 | | | 200,000 | |
| Repayment from Unsecured Notes | (140,000) | | | (55,000) | | | (141,750) | |
| Proceeds from Convertible Notes | 60,300 | | | 200,000 | | | — | |
| Repayment of Convertible Notes | (116,816) | | | (84,434) | | | — | |
| | | | | |
| Proceeds from NMFC Credit Facility | 348,500 | | | 212,707 | | | 336,505 | |
| Repayment of NMFC Credit Facility | (353,550) | | | (297,000) | | | (374,500) | |
| Proceeds from DB Credit Facility | 8,000 | | | 108,600 | | | 144,000 | |
| Repayment of DB Credit Facility | (8,000) | | | (148,500) | | | (161,700) | |
| | | | | |
| | | | | |
| Proceeds from NMNLC Credit Facility II | 6,305 | | | 5,288 | | | 24,225 | |
| Repayment from NMNLC Credit Facility II | (7,237) | | | (16,703) | | | (9,025) | |
| Contributions related to non-controlling interest in NMNLC | — | | | 124 | | | 1,792 | |
| Distributions related to non-controlling interest in NMNLC | (693) | | | (9,569) | | | (1,222) | |
| Deferred financing costs paid | (11,888) | | | (4,229) | | | (10,222) | |
| | | | | |
| | | | | |
| Net cash flows (used in) provided by financing activities | (333,884) | | | (21,502) | | | 1,200 | |
| Net (decrease) increase in cash and cash equivalents | (1,155) | | | 13,504 | | | (20,857) | |
| Effect of foreign exchange rate changes on cash and cash equivalents | 55 | | | (391) | | | (32) | |
| Cash and cash equivalents at the beginning of the period | 71,190 | | | 58,077 | | | 78,966 | |
| Cash and cash equivalents at the end of the period | $ | 70,090 | | | $ | 71,190 | | | $ | 58,077 | |
| Supplemental disclosure of cash flow information | | | | | |
| Cash interest paid | $ | 115,521 | | | $ | 81,826 | | | $ | 61,703 | |
| Income taxes paid | 11,577 | | | 901 | | | 65 | |
| Non-cash operating activities: | | | | | |
| Non-cash activity on investments | $ | 15,772 | | | $ | — | | | $ | 34,650 | |
| Non-cash financing activities: | | | | | |
| Value of shares issued in connection with reinvestment of distributions | $ | — | | | $ | 1,098 | | | $ | 2,228 | |
| | | | | |
| Accrual for offering costs | 147 | | | 68 | | | 21 | |
| Accrual for deferred financing costs | 213 | | | 152 | | | 11 | |
The accompanying notes are an integral part of these consolidated financial statements.
91
New Mountain Finance Corporation
Consolidated Schedule of Investments
December 31, 2023
(in thousands, except shares)
| | | | | | | | | | | | | | | | | | | | | | | | | | | | | | | | | | | | | | | | | | | | | | | | | | | | | | | | | | | | | | |
| Portfolio Company, Location and Industry(1) | | Type of
Investment | | Reference | | Spread | | Total Coupon (19) | | Acquisition Date | | Maturity/Expiration
Date | | Principal
Amount,
Par Value
or Shares (17) | | Cost | | Fair Value | | Percent of
Net
Assets |
| Non-Controlled/Non-Affiliated Investments | | | | | | | | | | | | | | | | | | | | |
| Funded Debt Investments - United States | | | | | | | | | | | | | | | | | | | | |
| Paw Midco, Inc. | | | | | | | | | | | | | | | | | | | | |
| AAH Topco, LLC | | | | | | | | | | | | | | | | | | | | |
| Consumer Services | | First lien (2)(15)(18) - Drawn | | SOFR(M) | | 5.50% | | 10.96% | | 12/2021 | | 12/2027 | | $ | 22,965 | | | $ | 22,772 | | | $ | 22,965 | | | |
| | First lien (8)(15) | | SOFR(M) | | 5.50% | | 10.96% | | 12/2021 | | 12/2027 | | 20,426 | | | 20,278 | | | 20,426 | | | |
| | First lien (4)(15) | | SOFR(M) | | 5.50% | | 10.96% | | 01/2022 | | 12/2027 | | 9,698 | | | 9,628 | | | 9,698 | | | |
| | First lien (4)(15)(18) - Drawn | | SOFR(M) | | 5.50% | | 10.96% | | 12/2021 | | 12/2027 | | 7,450 | | | 7,388 | | | 7,450 | | | |
| | Subordinated (3)(15) | | FIXED(Q)* | | 11.50%/PIK | | 11.50% | | 12/2021 | | 12/2031 | | 14,011 | | 13,865 | | | 13,420 | | | |
| | Subordinated (4)(15) | | FIXED(Q)* | | 11.50%/PIK | | 11.50% | | 01/2022 | | 12/2031 | | 5,495 | | | 5,437 | | | 5,263 | | | |
| | | | | | | | | | | | | | | | 79,368 | | | 79,222 | | | 5.95 | % |
| Associations, Inc. | | | | | | | | | | | | | | | | | | | | |
| Business Services | | First lien (2)(15) | | SOFR(Q)* | | 4.00% + 2.50%/PIK | | 12.18% | | 07/2021 | | 07/2027 | | 33,701 | | | 33,604 | | | 33,701 | | | |
| | First lien (2)(15) | | SOFR(Q)* | | 4.00% + 2.50%/PIK | | 12.13% | | 07/2021 | | 07/2027 | | 9,037 | | | 9,007 | | | 9,037 | | | |
| | First lien (8)(15) | | SOFR(Q)* | | 4.00% + 2.50%/PIK | | 12.15% | | 07/2021 | | 07/2027 | | 9,036 | | | 9,006 | | | 9,036 | | | |
| | First lien (8)(15) | | SOFR(Q)* | | 4.00% + 2.50%/PIK | | 12.13% | | 07/2021 | | 07/2027 | | 5,457 | | | 5,439 | | | 5,457 | | | |
| | First lien (8)(15) | | SOFR(Q)* | | 4.00% + 2.50%/PIK | | 12.17% | | 07/2021 | | 07/2027 | | 4,341 | | | 4,327 | | | 4,341 | | | |
| | First lien (2)(15) | | SOFR(Q)* | | 4.00% + 2.50%/PIK | | 12.16% | | 10/2023 | | 07/2027 | | 4,121 | | | 4,102 | | | 4,121 | | | |
| | First lien (3)(15)(18) - Drawn | | SOFR(Q) | | 6.50% | | 12.14% | | 07/2021 | | 07/2027 | | 1,252 | | | 1,246 | | | 1,252 | | | |
| | | | | | | | | | | | | | | | 66,731 | | | 66,945 | | | 5.03 | % |
| Knockout Intermediate Holdings I Inc. (32) | | | | | | | | | | | | | | | | | | | | |
| Kaseya Inc. | | | | | | | | | | | | | | | | | | | | |
| Software | | First lien (2)(15) | | SOFR(Q)* | | 3.50% + 2.50%/PIK | | 11.38% | | 06/2022 | | 06/2029 | | 63,633 | | | 63,237 | | | 63,633 | | | |
| | First lien (3)(15)(18) - Drawn | | SOFR(M) | | 5.50% | | 10.86% | | 06/2022 | | 06/2029 | | 973 | | | 966 | | | 973 | | | |
| | First lien (3)(15)(18) - Drawn | | SOFR(Q)* | | 3.50% + 2.50%/PIK | | 11.38% | | 06/2022 | | 06/2029 | | 237 | | | 235 | | | 237 | | | |
| | | | | | | | | | | | | | | | 64,438 | | | 64,843 | | | 4.87 | % |
| | | | | | | | | | | | | | | | | | | | |
| | | | | | | | | | | | | | | | | | | | |
The accompanying notes are an integral part of these consolidated financial statements.
92
New Mountain Finance Corporation
Consolidated Schedule of Investments (Continued)
December 31, 2023
(in thousands, except shares)
| | | | | | | | | | | | | | | | | | | | | | | | | | | | | | | | | | | | | | | | | | | | | | | | | | | | | | | | | | | | | | |
| Portfolio Company, Location and Industry(1) | | Type of
Investment | | Reference | | Spread | | Total Coupon (19) | | Acquisition Date | | Maturity/Expiration
Date | | Principal
Amount,
Par Value
or Shares (17) | | Cost | | Fair Value | | Percent of
Net
Assets |
| GC Waves Holdings, Inc. | | | | | | | | | | | | | | | | | | | | |
| Financial Services | | First lien (2)(15) | | SOFR(M) | | 6.00% | | 11.46% | | 08/2021 | | 08/2028 | | $ | 40,270 | | | $ | 40,008 | | | $ | 40,270 | | | |
| | First lien (5)(15) | | SOFR(M) | | 6.00% | | 11.46% | | 08/2021 | | 08/2028 | | 21,666 | | | 21,591 | | | 21,666 | | | |
| | First lien (2)(15)(18) - Drawn | | SOFR(M) | | 6.00% | | 11.46% | | 10/2019 | | 08/2028 | | 451 | | | 446 | | | 451 | | | |
| | | | | | | | | | | | | | | | 62,045 | | | 62,387 | | | 4.68 | % |
| GS Acquisitionco, Inc. | | | | | | | | | | | | | | | | | | | | |
| Software | | First lien (2)(15) | | SOFR(Q) | | 5.50% | | 11.00% | | 08/2019 | | 05/2026 | | 34,023 | | | 33,947 | | | 34,023 | | | |
| | First lien (5)(15) | | SOFR(Q) | | 5.50% | | 11.00% | | 08/2019 | | 05/2026 | | 21,521 | | | 21,476 | | | 21,521 | | | |
| | | | | | | | | | | | | | | | 55,423 | | | 55,544 | | | 4.17 | % |
| CentralSquare Technologies, LLC | | | | | | | | | | | | | | | | | | | | |
| Software | | Second lien (3)(15) | | SOFR(Q) | | 7.50% | | 13.00% | | 08/2018 | | 08/2026 | | 47,838 | | | 47,581 | | | 45,072 | | | |
| | Second lien (8)(15) | | SOFR(Q) | | 7.50% | | 13.00% | | 08/2018 | | 08/2026 | | 7,500 | | | 7,459 | | | 7,066 | | | |
| | | | | | | | | | | | | | | | 55,040 | | | 52,138 | | | 3.91 | % |
| IG Intermediateco LLC | | | | | | | | | | | | | | | | | | | | |
| Infogain Corporation | | | | | | | | | | | | | | | | | | | | |
| Business Services | | First lien (2)(15) | | SOFR(M) | | 5.50% | | 10.96% | | 07/2021 | | 07/2028 | | 18,707 | | | 18,605 | | | 18,707 | | | |
| | First lien (8)(15) | | SOFR(M) | | 5.50% | | 10.96% | | 07/2022 | | 07/2028 | | 7,844 | | | 7,781 | | | 7,844 | | | |
| | Subordinated (3)(15) | | SOFR(Q) | | 8.25% | | 13.70% | | 07/2022 | | 07/2029 | | 17,245 | | | 17,060 | | | 17,245 | | | |
| | | | | | | | | | | | | | | | 43,446 | | | 43,796 | | | 3.29 | % |
| iCIMS, Inc. | | | | | | | | | | | | | | | | | | | | |
| Software | | First lien (8)(15) | | SOFR(Q)* | | 3.88%/PIK + 3.38% | | 12.62% | | 08/2022 | | 08/2028 | | 30,783 | | | 30,569 | | | 31,008 | | | |
| | First lien (2)(15) | | SOFR(Q) | | 7.25% | | 12.62% | | 10/2022 | | 08/2028 | | 7,366 | | | 7,311 | | | 7,440 | | | |
| | First lien (2)(15) | | SOFR(Q)* | | 3.88%/PIK + 3.38% | | 12.62% | | 09/2023 | | 08/2028 | | 4,772 | | | 4,726 | | | 4,807 | | | |
| | First lien (3)(15)(18) - Drawn | | SOFR(Q) | | 6.75% | | 12.10% | | 08/2022 | | 08/2028 | | 471 | | | 467 | | | 471 | | | |
| | | | | | | | | | | | | | | | 43,073 | | | 43,726 | | | 3.28 | % |
| Deca Dental Holdings LLC | | | | | | | | | | | | | | | | | | | | |
| Healthcare | | First lien (2)(15) | | SOFR(Q) | | 5.75% | | 11.20% | | 08/2021 | | 08/2028 | | 37,477 | | | 37,204 | | | 36,791 | | | |
| | First lien (3)(15) | | SOFR(Q) | | 5.75% | | 11.20% | | 08/2021 | | 08/2028 | | 3,945 | | | 3,915 | | | 3,873 | | | |
| | First lien (3)(15)(18) - Drawn | | SOFR(Q) | | 5.75% | | 11.20% | | 08/2021 | | 08/2027 | | 2,623 | | | 2,597 | | | 2,576 | | | |
| | | | | | | | | | | | | | | | 43,716 | | | 43,240 | | | 3.25 | % |
| MRI Software LLC | | | | | | | | | | | | | | | | | | | | |
| Software | | First lien (5)(15) | | SOFR(Q) | | 5.50% | | 10.95% | | 01/2020 | | 02/2027 | | 21,655 | | | 21,610 | | | 21,598 | | | |
| | First lien (3)(15) | | SOFR(Q) | | 5.50% | | 10.95% | | 03/2021 | | 02/2027 | | 7,670 | | | 7,655 | | | 7,650 | | | |
| | First lien (2)(15) | | SOFR(Q) | | 5.50% | | 10.95% | | 03/2021 | | 02/2027 | | 4,568 | | | 4,561 | | | 4,557 | | | |
| | First lien (2)(15) | | SOFR(Q) | | 5.50% | | 10.95% | | 01/2020 | | 02/2027 | | 3,140 | | | 3,133 | | | 3,132 | | | |
| | First lien (3)(15) | | SOFR(Q) | | 5.50% | | 10.95% | | 01/2020 | | 02/2027 | | 801 | | | 799 | | | 800 | | | |
| | | | | | | | | | | | | | | | 37,758 | | | 37,737 | | | 2.83 | % |
| | | | | | | | | | | | | | | | | | | | |
| | | | | | | | | | | | | | | | | | | | |
The accompanying notes are an integral part of these consolidated financial statements.
93
New Mountain Finance Corporation
Consolidated Schedule of Investments (Continued)
December 31, 2023
(in thousands, except shares)
| | | | | | | | | | | | | | | | | | | | | | | | | | | | | | | | | | | | | | | | | | | | | | | | | | | | | | | | | | | | | | |
| Portfolio Company, Location and Industry(1) | | Type of
Investment | | Reference | | Spread | | Total Coupon (19) | | Acquisition Date | | Maturity/Expiration
Date | | Principal
Amount,
Par Value
or Shares (17) | | Cost | | Fair Value | | Percent of
Net
Assets |
| WEG Sub Intermediate Holdings, LLC | | | | | | | | | | | | | | | | | | | | |
| Wealth Enhancement Group, LLC | | | | | | | | | | | | | | | | | | | | |
| Financial Services | | First lien (2)(15) | | SOFR(Q) | | 5.75% | | 11.11% | | 08/2021 | | 10/2027 | | $ | 18,758 | | | $ | 18,715 | | | $ | 18,758 | | | |
| | First lien (2)(15)(18) - Drawn | | SOFR(Q) | | 5.75% | | 11.20% | | 05/2022 | | 10/2027 | | 13,336 | | | 13,307 | | | 13,336 | | | |
| | First lien (2)(15) | | SOFR(Q) | | 5.75% | | 11.23% | | 01/2022 | | 10/2027 | | 1,241 | | | 1,232 | | | 1,241 | | | |
| | First lien (2)(15) | | SOFR(Q) | | 5.75% | | 11.23% | | 01/2022 | | 10/2027 | | 832 | | | 826 | | | 832 | | | |
| | Subordinated (3)(15) | | FIXED(Q)* | | 15.00%/PIK | | 15.00% | | 05/2023 | | 05/2033 | | 3,513 | | | 3,464 | | | 3,459 | | | |
| | | | | | | | | | | | | | | | 37,544 | | | 37,626 | | | 2.83 | % |
| Recorded Future, Inc. | | | | | | | | | | | | | | | | | | | | |
| Software | | First lien (8)(15) | | SOFR(M) | | 5.25% | | 10.71% | | 08/2019 | | 07/2025 | | 24,220 | | | 24,147 | | | 24,220 | | | |
| | First lien (2)(15) | | SOFR(M) | | 5.25% | | 10.71% | | 03/2021 | | 07/2025 | | 12,524 | | | 12,484 | | | 12,524 | | | |
| | | | | | | | | | | | | | | | 36,631 | | | 36,744 | | | 2.76 | % |
| Auctane Inc. (fka Stamps.com Inc.) | | | | | | | | | | | | | | | | | | | | |
| Software | | First lien (8)(15) | | SOFR(Q) | | 5.75% | | 11.23% | | 10/2021 | | 10/2028 | | 21,847 | | | 21,684 | | | 21,473 | | | |
| | First lien (2)(15) | | SOFR(Q) | | 5.75% | | 11.23% | | 10/2021 | | 10/2028 | | 14,774 | | | 14,664 | | | 14,522 | | | |
| | | | | | | | | | | | | | | | 36,348 | | | 35,995 | | | 2.70 | % |
| OEC Holdco, LLC (21) | | | | | | | | | | | | | | | | | | | | |
| OEConnection LLC | | | | | | | | | | | | | | | | | | | | |
| Software | | Second lien (2)(15) | | SOFR(M) | | 7.00% | | 12.46% | | 12/2021 | | 09/2027 | | 23,406 | | | 23,239 | | | 23,406 | | | |
| | Second lien (2)(15) | | SOFR(M) | | 7.00% | | 12.46% | | 09/2019 | | 09/2027 | | 12,044 | | | 11,977 | | | 12,044 | | | |
| | | | | | | | | | | | | | | | 35,216 | | | 35,450 | | | 2.66 | % |
| Foreside Financial Group, LLC | | | | | | | | | | | | | | | | | | | | |
| Business Services | | First lien (2)(15) | | SOFR(Q) | | 5.50% | | 11.04% | | 05/2022 | | 09/2027 | | 33,698 | | | 33,444 | | | 33,698 | | | |
| | First lien (3)(15)(18) - Drawn | | SOFR(Q) | | 5.50% | | 11.02% | | 05/2022 | | 09/2027 | | 1,006 | | | 996 | | | 1,006 | | | |
| | First lien (3)(15) | | SOFR(Q) | | 5.50% | | 11.04% | | 05/2022 | | 09/2027 | | 347 | | | 344 | | | 347 | | | |
| | | | | | | | | | | | | | | | 34,784 | | | 35,051 | | | 2.63 | % |
| KAMC Holdings, Inc. | | | | | | | | | | | | | | | | | | | | |
| Business Services | | Second lien (2)(15) | | SOFR(Q) | | 8.00% | | 13.63% | | 08/2019 | | 08/2027 | | 18,750 | | | 18,673 | | | 17,079 | | | |
| | Second lien (8)(15) | | SOFR(Q) | | 8.00% | | 13.63% | | 08/2019 | | 08/2027 | | 18,750 | | | 18,673 | | | 17,079 | | | |
| | | | | | | | | | | | | | | | 37,346 | | | 34,158 | | | 2.56 | % |
| IG Investments Holdings, LLC | | | | | | | | | | | | | | | | | | | | |
| Business Services | | First lien (2)(15) | | SOFR(Q) | | 6.00% | | 11.48% | | 09/2021 | | 09/2028 | | 28,839 | | | 28,625 | | | 28,839 | | | |
| | First lien (2)(15) | | SOFR(Q) | | 6.00% | | 11.48% | | 02/2022 | | 09/2028 | | 4,214 | | | 4,197 | | | 4,214 | | | |
| | | | | | | | | | | | | | | | 32,822 | | | 33,053 | | | 2.48 | % |
| | | | | | | | | | | | | | | | | | | | |
| | | | | | | | | | | | | | | | | | | | |
The accompanying notes are an integral part of these consolidated financial statements.
94
New Mountain Finance Corporation
Consolidated Schedule of Investments (Continued)
December 31, 2023
(in thousands, except shares)
| | | | | | | | | | | | | | | | | | | | | | | | | | | | | | | | | | | | | | | | | | | | | | | | | | | | | | | | | | | | | | |
| Portfolio Company, Location and Industry(1) | | Type of
Investment | | Reference | | Spread | | Total Coupon (19) | | Acquisition Date | | Maturity/Expiration
Date | | Principal
Amount,
Par Value
or Shares (17) | | Cost | | Fair Value | | Percent of
Net
Assets |
| Granicus, Inc. | | | | | | | | | | | | | | | | | | | | |
| Software | | First lien (4)(15) | | SOFR(Q)* | | 5.50% + 1.50%/PIK | | 12.48% | | 01/2021 | | 01/2027 | | $ | 15,463 | | | $ | 15,396 | | | $ | 15,463 | | | |
| | First lien (8)(15) | | SOFR(Q)* | | 5.50% + 1.50%/PIK | | 12.48% | | 01/2021 | | 01/2027 | | 5,981 | | | 5,954 | | | 5,981 | | | |
| | First lien (2)(15) | | SOFR(Q)* | | 5.50% + 1.50%/PIK | | 12.48% | | 01/2021 | | 01/2027 | | 5,899 | | | 5,874 | | | 5,899 | | | |
| | First lien (2)(15) | | SOFR(Q) | | 6.00% | | 11.48% | | 04/2021 | | 01/2027 | | 4,542 | | | 4,511 | | | 4,542 | | | |
| | First lien (3)(15)(18) - Drawn | | SOFR(M) | | 6.50% | | 11.96% | | 01/2021 | | 01/2027 | | 579 | | | 575 | | | 579 | | | |
| | | | | | | | | | | | | | | | 32,310 | | | 32,464 | | | 2.44 | % |
| TigerConnect, Inc. | | | | | | | | | | | | | | | | | | | | |
| Healthcare | | First lien (8)(15) | | SOFR(Q)* | | 3.38% + 3.38%/PIK | | 12.28% | | 02/2022 | | 02/2028 | | 29,868 | | | 29,644 | | | 29,614 | | | |
| | First lien (2)(15)(18) - Drawn | | SOFR(Q)* | | 3.38% + 3.38%/PIK | | 12.28% | | 02/2022 | | 02/2028 | | 1,354 | | | 1,354 | | | 1,343 | | | |
| | | | | | | | | | | | | | | | 30,998 | | | 30,957 | | | 2.32 | % |
| Diamond Parent Holdings Corp. (27) | | | | | | | | | | | | | | | | | | | | |
| Diligent Corporation | | | | | | | | | | | | | | | | | | | | |
| Software | | First lien (2)(15) | | SOFR(Q) | | 5.75% | | 11.28% | | 03/2021 | | 08/2025 | | 17,404 | | | 17,369 | | | 16,998 | | | |
| | First lien (3)(15) | | SOFR(Q) | | 6.25% | | 11.78% | | 12/2018 | | 08/2025 | | 5,768 | | | 5,755 | | | 5,654 | | | |
| | First lien (2)(15) | | SOFR(Q) | | 5.75% | | 11.28% | | 03/2021 | | 08/2025 | | 5,679 | | | 5,667 | | | 5,546 | | | |
| | First lien (3)(15)(18) - Drawn | | SOFR(Q) | | 6.25% | | 11.76% | | 03/2021 | | 08/2025 | | 1,957 | | | 1,947 | | | 1,919 | | | |
| | | | | | | | | | | | | | | | 30,738 | | | 30,117 | | | 2.26 | % |
| OA Topco, L.P. (31) | | | | | | | | | | | | | | | | | | | | |
| OA Buyer, Inc. | | | | | | | | | | | | | | | | | | | | |
| Healthcare | | First lien (2)(15) | | SOFR(M) | | 5.50% | | 10.86% | | 12/2021 | | 12/2028 | | 27,707 | | | 27,493 | | | 27,707 | | | |
| | First lien (2)(15) | | SOFR(M) | | 5.50% | | 10.86% | | 05/2022 | | 12/2028 | | 1,754 | | | 1,740 | | | 1,754 | | | |
| | | | | | | | | | | | | | | | 29,233 | | | 29,461 | | | 2.21 | % |
| NMC Crimson Holdings, Inc. | | | | | | | | | | | | | | | | | | | | |
| Healthcare | | First lien (8)(15) | | SOFR(Q) | | 6.09% | | 11.64% | | 03/2021 | | 03/2028 | | 19,259 | | | 19,067 | | | 19,133 | | | |
| | First lien (3)(15)(18) - Drawn | | SOFR(Q) | | 6.09% | | 11.62% | | 03/2021 | | 03/2028 | | 5,012 | | | 4,992 | | | 4,979 | | | |
| | First lien (2)(15) | | SOFR(Q) | | 6.09% | | 11.64% | | 03/2021 | | 03/2028 | | 4,913 | | | 4,864 | | | 4,881 | | | |
| | | | | | | | | | | | | | | | 28,923 | | | 28,993 | | | 2.18 | % |
| Foundational Education Group, Inc. | | | | | | | | | | | | | | | | | | | | |
| Education | | Second lien (5)(15) | | SOFR(Q) | | 6.50% | | 12.14% | | 08/2021 | | 08/2029 | | 22,500 | | | 22,412 | | | 22,100 | | | |
| | Second lien (2)(15) | | SOFR(Q) | | 6.50% | | 12.14% | | 08/2021 | | 08/2029 | | 7,009 | | | 6,989 | | | 6,884 | | | |
| | | | | | | | | | | | | | | | 29,401 | | | 28,984 | | | 2.18 | % |
| | | | | | | | | | | | | | | | | | | | |
| | | | | | | | | | | | | | | | | | | | |
The accompanying notes are an integral part of these consolidated financial statements.
95
New Mountain Finance Corporation
Consolidated Schedule of Investments (Continued)
December 31, 2023
(in thousands, except shares)
| | | | | | | | | | | | | | | | | | | | | | | | | | | | | | | | | | | | | | | | | | | | | | | | | | | | | | | | | | | | | | |
| Portfolio Company, Location and Industry(1) | | Type of
Investment | | Reference | | Spread | | Total Coupon (19) | | Acquisition Date | | Maturity/Expiration
Date | | Principal
Amount,
Par Value
or Shares (17) | | Cost | | Fair Value | | Percent of
Net
Assets |
| Fortis Solutions Group, LLC | | | | | | | | | | | | | | | | | | | | |
| Packaging | | First lien (2)(15) | | SOFR(Q) | | 5.50% | | 10.95% | | 10/2021 | | 10/2028 | | $ | 17,353 | | | $ | 17,219 | | | $ | 17,243 | | | |
| | First lien (8)(15) | | SOFR(Q) | | 5.50% | | 10.95% | | 10/2021 | | 10/2028 | | 10,092 | | | 10,017 | | | 10,028 | | | |
| | First lien (3)(15) | | SOFR(Q) | | 5.50% | | 10.95% | | 10/2021 | | 10/2028 | | 1,178 | | | 1,168 | | | 1,171 | | | |
| | First lien (3)(15)(18) - Drawn | | SOFR(Q) | | 5.50% | | 10.95% | | 10/2021 | | 10/2027 | | 143 | | | 142 | | | 142 | | | |
| | First lien (3)(15)(18) - Drawn | | SOFR(Q) | | 5.50% | | 10.98% | | 06/2022 | | 10/2028 | | 138 | | | 137 | | | 138 | | | |
| | First lien (3)(15) | | SOFR(Q) | | 5.50% | | 10.95% | | 10/2021 | | 10/2028 | | 80 | | | 80 | | | 80 | | | |
| | | | | | | | | | | | | | | | 28,763 | | | 28,802 | | | 2.16 | % |
| PetVet Care Centers, LLC | | | | | | | | | | | | | | | | | | | | |
| Consumer Services | | First lien (2) | | SOFR(M) | | 6.00% | | 11.36% | | 10/2023 | | 11/2030 | | 28,430 | | | 28,148 | | | 28,439 | | | 2.14 | % |
| Syndigo LLC | | | | | | | | | | | | | | | | | | | | |
| Software | | Second lien (4)(15) | | SOFR(M) | | 8.00% | | 13.48% | | 12/2020 | | 12/2028 | | 22,500 | | | 22,379 | | | 22,500 | | | |
| | Second lien (2)(15) | | SOFR(M) | | 8.00% | | 13.48% | | 02/2022 | | 12/2028 | | 5,697 | | | 5,708 | | | 5,697 | | | |
| | | | | | | | | | | | | | | | 28,087 | | | 28,197 | | | 2.12 | % |
| ACI Parent Inc. (28) | | | | | | | | | | | | | | | | | | | | |
| ACI Group Holdings, Inc. | | | | | | | | | | | | | | | | | | | | |
| Healthcare | | First lien (2)(15) | | SOFR(M) | | 5.50% | | 10.96% | | 08/2021 | | 08/2028 | | 22,025 | | | 21,868 | | | 21,498 | | | |
| | First lien (3)(15) | | SOFR(M) | | 5.50% | | 10.96% | | 08/2021 | | 08/2028 | | 3,904 | | | 3,871 | | | 3,810 | | | |
| | First lien (3)(15)(18) - Drawn | | SOFR(M) | | 5.50% | | 10.96% | | 08/2021 | | 08/2028 | | 1,397 | | | 1,384 | | | 1,364 | | | |
| | First lien (3)(15)(18) - Drawn | | SOFR(M) | | 5.50% | | 10.96% | | 08/2021 | | 08/2027 | | 353 | | | 350 | | | 345 | | | |
| | | | | | | | | | | | | | | | 27,473 | | | 27,017 | | | 2.03 | % |
| CRCI Longhorn Holdings, Inc. | | | | | | | | | | | | | | | | | | | | |
| Business Services | | Second lien (3)(15) | | SOFR(M) | | 7.25% | | 12.71% | | 08/2018 | | 08/2026 | | 18,266 | | | 18,237 | | | 18,184 | | | |
| | Second lien (8)(15) | | SOFR(M) | | 7.25% | | 12.71% | | 08/2018 | | 08/2026 | | 7,500 | | | 7,488 | | | 7,467 | | | |
| | | | | | | | | | | | | | | | 25,725 | | | 25,651 | | | 1.93 | % |
| Idera, Inc. | | | | | | | | | | | | | | | | | | | | |
| Software | | Second lien (4)(15) | | SOFR(Q) | | 6.75% | | 12.28% | | 06/2019 | | 03/2029 | | 22,500 | | | 22,273 | | | 22,500 | | | |
| | Second lien (3)(15) | | SOFR(Q) | | 6.75% | | 12.28% | | 04/2021 | | 03/2029 | | 3,000 | | | 2,989 | | | 3,000 | | | |
| | | | | | | | | | | | | | | | 25,262 | | | 25,500 | | | 1.91 | % |
| AmeriVet Partners Management, Inc. | | | | | | | | | | | | | | | | | | | | |
| Consumer Services | | First lien (2)(15) | | SOFR(Q) | | 5.50% | | 11.00% | | 02/2022 | | 02/2028 | | 19,159 | | | 19,089 | | | 19,159 | | | |
| | First lien (2)(15) | | SOFR(Q) | | 5.50% | | 11.00% | | 02/2022 | | 02/2028 | | 5,331 | | | 5,308 | | | 5,331 | | | |
| | First lien (3)(15)(18) - Drawn | | SOFR(Q) | | 5.50% | | 11.00% | | 02/2022 | | 02/2028 | | 700 | | | 697 | | | 700 | | | |
| | | | | | | | | | | | | | | | 25,094 | | | 25,190 | | | 1.89 | % |
| | | | | | | | | | | | | | | | | | | | |
| | | | | | | | | | | | | | | | | | | | |
The accompanying notes are an integral part of these consolidated financial statements.
96
New Mountain Finance Corporation
Consolidated Schedule of Investments (Continued)
December 31, 2023
(in thousands, except shares)
| | | | | | | | | | | | | | | | | | | | | | | | | | | | | | | | | | | | | | | | | | | | | | | | | | | | | | | | | | | | | | |
| Portfolio Company, Location and Industry(1) | | Type of
Investment | | Reference | | Spread | | Total Coupon (19) | | Acquisition Date | | Maturity/Expiration
Date | | Principal
Amount,
Par Value
or Shares (17) | | Cost | | Fair Value | | Percent of
Net
Assets |
| DOCS, MSO, LLC | | | | | | | | | | | | | | | | | | | | |
| Healthcare | | First lien (8)(15) | | SOFR(M) | | 5.75% | | 11.20% | | 06/2022 | | 06/2028 | | $ | 18,572 | | | $ | 18,572 | | | $ | 18,238 | | | |
| | First lien (4)(15) | | SOFR(M) | | 5.75% | | 11.20% | | 06/2022 | | 06/2028 | | 6,955 | | | 6,955 | | | 6,830 | | | |
| | | | | | | | | | | | | | | | 25,527 | | | 25,068 | | | 1.88 | % |
| HS Purchaser, LLC / Help/Systems Holdings, Inc. | | | | | | | | | | | | | | | | | | | | |
| Software | | Second lien (5)(15) | | SOFR(S) | | 6.75% | | 12.35% | | 11/2019 | | 11/2027 | | 22,500 | | | 22,429 | | | 21,059 | | | |
| | Second lien (2)(15) | | SOFR(S) | | 6.75% | | 12.35% | | 11/2019 | | 11/2027 | | 4,208 | | | 4,184 | | | 3,938 | | | |
| | | | | | | | | | | | | | | | 26,613 | | | 24,997 | | | 1.88 | % |
| Xactly Corporation | | | | | | | | | | | | | | | | | | | | |
| Software | | First lien (4)(15) | | SOFR(Q) | | 7.25% | | 12.74% | | 07/2017 | | 07/2025 | | 22,500 | | | 22,472 | | | 22,500 | | | 1.69 | % |
| Sierra Enterprises, LLC | | | | | | | | | | | | | | | | | | | | |
| Food & Beverage | | First lien (3) | | SOFR(Q)* | | 4.25%/PIK + 2.50% | | 12.13% | | 06/2023 | | 05/2027 | | 23,780 | | | 20,370 | | | 22,055 | | | 1.66 | % |
| FS WhiteWater Holdings, LLC (29) | | | | | | | | | | | | | | | | | | | | |
| FS WhiteWater Borrower, LLC | | | | | | | | | | | | | | | | | | | | |
| Consumer Services | | First lien (5)(15) | | SOFR(Q) | | 5.75% | | 11.25% | | 12/2021 | | 12/2027 | | 10,290 | | | 10,217 | | | 10,125 | | | |
| | First lien (3)(15)(18) - Drawn | | SOFR(Q) | | 6.00% | | 11.52% | | 07/2022 | | 12/2027 | | 4,503 | | | 4,462 | | | 4,466 | | | |
| | First lien (5)(15) | | SOFR(Q) | | 5.75% | | 11.28% | | 12/2021 | | 12/2027 | | 3,454 | | | 3,427 | | | 3,398 | | | |
| | First lien (5)(15) | | SOFR(Q) | | 5.75% | | 11.25% | | 12/2021 | | 12/2027 | | 3,432 | | | 3,407 | | | 3,378 | | | |
| | First lien (3)(15)(18) - Drawn | | SOFR(M) | | 5.75% | | 11.26% | | 12/2021 | | 12/2027 | | 315 | | | 312 | | | 310 | | | |
| | | | | | | | | | | | | | | | 21,825 | | | 21,677 | | | 1.63 | % |
| Bullhorn, Inc. | | | | | | | | | | | | | | | | | | | | |
| Software | | First lien (2)(15) | | SOFR(M) | | 5.50% | | 10.96% | | 09/2019 | | 09/2026 | | 16,487 | | | 16,432 | | | 16,487 | | | |
| | First lien (2)(15) | | SOFR(M) | | 5.50% | | 10.96% | | 10/2021 | | 09/2026 | | 3,407 | | | 3,401 | | | 3,407 | | | |
| | First lien (2)(15) | | SOFR(M) | | 5.50% | | 10.96% | | 09/2019 | | 09/2026 | | 763 | | | 760 | | | 763 | | | |
| | First lien (2)(15) | | SOFR(M) | | 5.50% | | 10.96% | | 09/2019 | | 09/2026 | | 342 | | | 341 | | | 342 | | | |
| | First lien (2)(15) | | SOFR(M) | | 5.50% | | 10.96% | | 09/2019 | | 09/2026 | | 273 | | | 272 | | | 273 | | | |
| | | | | | | | | | | | | | | | 21,206 | | | 21,272 | | | 1.60 | % |
| YLG Holdings, Inc. | | | | | | | | | | | | | | | | | | | | |
| Business Services | | First lien (5)(15) | | SOFR(Q) | | 5.00% | | 10.48% | | 11/2019 | | 10/2025 | | 17,677 | | | 17,646 | | | 17,676 | | | |
| | First lien (5)(15) | | SOFR(Q) | | 5.00% | | 10.48% | | 11/2019 | | 10/2025 | | 2,302 | | | 2,298 | | | 2,301 | | | |
| | First lien (5)(15)(18) - Drawn | | SOFR(Q) | | 5.00% | | 10.48% | | 10/2021 | | 10/2025 | | 1,204 | | | 1,196 | | | 1,204 | | | |
| | First lien (5)(15)(18) - Drawn | | SOFR(Q) | | 5.50% | | 10.99% | | 10/2021 | | 10/2025 | | 80 | | | 80 | | | 80 | | | |
| | | | | | | | | | | | | | | | 21,220 | | | 21,261 | | | 1.60 | % |
| TMK Hawk Parent, Corp. | | | | | | | | | | | | | | | | | | | | |
| Distribution & Logistics | | First lien (2)(15) | | SOFR(Q) | | 3.50% | | 9.14% | | 06/2019 | | 08/2024 | | 16,227 | | | 15,852 | | | 9,736 | | | |
| | First lien (8)(15) | | SOFR(Q) | | 3.50% | | 9.14% | | 10/2019 | | 08/2024 | | 15,651 | | | 15,190 | | | 9,392 | | | |
| | First lien (2) | | SOFR(M) | | 9.50% | | 14.98% | | 12/2023 | | 05/2024 | | 1,033 | | | 1,033 | | | 1,033 | | | |
| | First lien (8) | | SOFR(M) | | 9.50% | | 14.98% | | 12/2023 | | 05/2024 | | 996 | | | 996 | | | 996 | | | |
| | | | | | | | | | | | | | | | 33,071 | | | 21,157 | | | 1.59 | % |
| | | | | | | | | | | | | | | | | | | | |
| | | | | | | | | | | | | | | | | | | | |
The accompanying notes are an integral part of these consolidated financial statements.
97
New Mountain Finance Corporation
Consolidated Schedule of Investments (Continued)
December 31, 2023
(in thousands, except shares)
| | | | | | | | | | | | | | | | | | | | | | | | | | | | | | | | | | | | | | | | | | | | | | | | | | | | | | | | | | | | | | |
| Portfolio Company, Location and Industry(1) | | Type of
Investment | | Reference | | Spread | | Total Coupon (19) | | Acquisition Date | | Maturity/Expiration
Date | | Principal
Amount,
Par Value
or Shares (17) | | Cost | | Fair Value | | Percent of
Net
Assets |
| AAC Lender Holdings, LLC (26) | | | | | | | | | | | | | | | | | | | | |
| American Achievement Corporation (aka AAC Holding Corp.) | | | | | | | | | | | | | | | | | | | | |
| Education | | First lien (2)(15) | | SOFR(M)(34)* | | 5.75%/PIK + 0.50% | | 11.69% | | 09/2015 | | 09/2026 | | $ | 29,879 | | | $ | 29,842 | | | $ | 20,586 | | | |
| | First lien (3)(15) | | SOFR(M)(34)* | | 13.50%/PIK + 0.50% | | 19.44% | | 06/2021 | | 09/2026 | | 1,527 | | | 1,527 | | | — | | | |
| | Subordinated (3)(15) | | SOFR(Q)(34)* | | 1.00%/PIK | | 7.54% | | 03/2021 | | 09/2026 | | 5,230 | | | — | | | — | | | |
| | | | | | | | | | | | | | | | 31,369 | | | 20,586 | | | 1.55 | % |
| MED Parentco, LP | | | | | | | | | | | | | | | | | | | | |
| Healthcare | | Second lien (8)(15) | | SOFR(M) | | 8.25% | | 13.72% | | 08/2019 | | 08/2027 | | 20,857 | | | 20,769 | | | 20,119 | | | 1.51 | % |
| Brave Parent Holdings, Inc. | | | | | | | | | | | | | | | | | | | | |
| Software | | First lien (5)(15) | | SOFR(M) | | 5.00% | | 10.36% | | 11/2023 | | 11/2030 | | 20,171 | | | 20,071 | | | 20,070 | | | 1.51 | % |
| Cardinal Parent, Inc. | | | | | | | | | | | | | | | | | | | | |
| Software | | First lien (4) | | SOFR(Q) | | 4.50% | | 10.00% | | 10/2020 | | 11/2027 | | 11,852 | | | 11,798 | | | 10,919 | | | |
| | Second lien (4)(15) | | SOFR(Q) | | 7.75% | | 13.25% | | 11/2020 | | 11/2028 | | 9,767 | | | 9,698 | | | 8,975 | | | |
| | | | | | | | | | | | | | | | 21,496 | | | 19,894 | | | 1.49 | % |
| Convey Health Solutions, Inc. | | | | | | | | | | | | | | | | | | | | |
| Healthcare | | First lien (4)(15) | | SOFR(Q) | | 5.25% | | 10.70% | | 09/2019 | | 09/2026 | | 19,022 | | | 18,928 | | | 16,768 | | | |
| | First lien (4)(15) | | SOFR(Q) | | 5.25% | | 10.70% | | 02/2022 | | 09/2026 | | 3,176 | | | 3,146 | | | 2,800 | | | |
| | | | | | | | | | | | | | | | 22,074 | | | 19,568 | | | 1.47 | % |
| Trinity Air Consultants Holdings Corporation | | | | | | | | | | | | | | | | | | | | |
| Business Services | | First lien (2)(15) | | SOFR(S) | | 5.75% | | 11.29% | | 06/2021 | | 06/2027 | | 15,382 | | | 15,283 | | | 15,382 | | | |
| | First lien (2)(15)(18) - Drawn | | SOFR(S) | | 5.75% | | 11.18% | | 06/2021 | | 06/2027 | | 4,070 | | | 4,038 | | | 4,070 | | | |
| | | | | | | | | | | | | | | | 19,321 | | | 19,452 | | | 1.46 | % |
| Groundworks, LLC | | | | | | | | | | | | | | | | | | | | |
| Consumer Services | | First lien (4)(15) | | SOFR(Q) | | 6.50% | | 11.90% | | 03/2023 | | 03/2030 | | 19,517 | | | 19,245 | | | 19,330 | | | 1.45 | % |
| Notorious Topco, LLC | | | | | | | | | | | | | | | | | | | | |
| Consumer Products | | First lien (8)(15) | | SOFR(Q) | | 6.75% | | 12.28% | | 11/2021 | | 11/2027 | | 9,950 | | | 9,896 | | | 9,215 | | | |
| | First lien (8)(15) | | SOFR(Q) | | 6.75% | | 12.28% | | 05/2022 | | 11/2027 | | 9,825 | | | 9,769 | | | 9,100 | | | |
| | First lien (3)(15)(18) - Drawn | | SOFR(Q) | | 6.75% | | 12.28% | | 11/2021 | | 11/2027 | | 867 | | | 858 | | | 803 | | | |
| | First lien (3)(15)(18) - Drawn | | SOFR(Q) | | 6.75% | | 12.28% | | 11/2021 | | 05/2027 | | 59 | | | 59 | | | 55 | | | |
| | | | | | | | | | | | | | | | 20,582 | | | 19,173 | | | 1.44 | % |
| | | | | | | | | | | | | | | | | | | | |
| | | | | | | | | | | | | | | | | | | | |
The accompanying notes are an integral part of these consolidated financial statements.
98
New Mountain Finance Corporation
Consolidated Schedule of Investments (Continued)
December 31, 2023
(in thousands, except shares)
| | | | | | | | | | | | | | | | | | | | | | | | | | | | | | | | | | | | | | | | | | | | | | | | | | | | | | | | | | | | | | |
| Portfolio Company, Location and Industry(1) | | Type of
Investment | | Reference | | Spread | | Total Coupon (19) | | Acquisition Date | | Maturity/Expiration
Date | | Principal
Amount,
Par Value
or Shares (17) | | Cost | | Fair Value | | Percent of
Net
Assets |
| Pioneer Topco I, L.P. (30) | | | | | | | | | | | | | | | | | | | | |
| Pioneer Buyer I, LLC | | | | | | | | | | | | | | | | | | | | |
| Software | | First lien (8)(15) | | SOFR(Q)* | | 7.00%/PIK | | 12.35% | | 11/2021 | | 11/2028 | | $ | 16,802 | | | $ | 16,700 | | | $ | 16,802 | | | |
| | First lien (8)(15) | | SOFR(Q)* | | 7.00%/PIK | | 12.35% | | 03/2022 | | 11/2028 | | 2,303 | | | 2,287 | | | 2,303 | | | |
| | | | | | | | | | | | | | | | 18,987 | | | 19,105 | | | 1.43 | % |
| DG Investment Intermediate Holdings 2, Inc. | | | | | | | | | | | | | | | | | | | | |
| Business Services | | Second lien (3) | | SOFR(M) | | 6.75% | | 12.22% | | 03/2021 | | 03/2029 | | 20,313 | | | 20,275 | | | 18,333 | | | 1.38 | % |
| Power Grid Holdings, Inc. | | | | | | | | | | | | | | | | | | | | |
| Business Products | | First lien (4)(15) | | SOFR(Q) | | 4.75% | | 10.14% | | 11/2023 | | 12/2030 | | 18,193 | | | 18,013 | | | 18,011 | | | |
| | First lien (3)(15)(18) - Drawn | | SOFR(Q) | | 4.75% | | 10.12% | | 11/2023 | | 12/2030 | | 214 | | | 212 | | | 212 | | | |
| | | | | | | | | | | | | | | | 18,225 | | | 18,223 | | | 1.37 | % |
| Avalara, Inc. | | | | | | | | | | | | | | | | | | | | |
| Software | | First lien (8)(15) | | SOFR(Q) | | 7.25% | | 12.60% | | 10/2022 | | 10/2028 | | 17,198 | | | 17,015 | | | 17,198 | | | 1.29 | % |
| Coyote Buyer, LLC | | | | | | | | | | | | | | | | | | | | |
| Specialty Chemicals & Materials | | First lien (5) | | SOFR(Q) | | 6.00% | | 11.53% | | 03/2020 | | 02/2026 | | 13,653 | | | 13,625 | | | 13,653 | | | |
| | First lien (5) | | SOFR(Q) | | 8.00% | | 13.54% | | 10/2020 | | 08/2026 | | 2,457 | | | 2,445 | | | 2,457 | | | |
| | | | | | | | | | | | | | | | 16,070 | | | 16,110 | | | 1.21 | % |
| Oranje Holdco, Inc. | | | | | | | | | | | | | | | | | | | | |
| Education | | First lien (8)(15) | | SOFR(Q) | | 7.50% | | 12.88% | | 02/2023 | | 02/2029 | | 7,440 | | | 7,357 | | | 7,440 | | | |
| | First lien (2)(15) | | SOFR(Q) | | 7.50% | | 12.88% | | 02/2023 | | 02/2029 | | 7,440 | | | 7,357 | | | 7,440 | | | |
| | | | | | | | | | | | | | | | 14,714 | | | 14,880 | | | 1.12 | % |
| EAB Global, Inc. | | | | | | | | | | | | | | | | | | | | |
| Education | | Second lien (2)(15) | | SOFR(M) | | 6.50% | | 11.97% | | 08/2021 | | 08/2029 | | 14,868 | | | 14,695 | | | 14,868 | | | 1.12 | % |
| Kele Holdco, Inc. | | | | | | | | | | | | | | | | | | | | |
| Distribution & Logistics | | First lien (5)(15) | | SOFR(M) | | 5.25% | | 10.71% | | 02/2020 | | 02/2026 | | 14,796 | | | 14,767 | | | 14,796 | | | 1.11 | % |
| Coupa Holdings, LLC | | | | | | | | | | | | | | | | | | | | |
| Software | | First lien (2)(15) | | SOFR(M) | | 7.50% | | 12.86% | | 02/2023 | | 02/2030 | | 7,230 | | | 7,147 | | | 7,303 | | | |
| | First lien (8)(15) | | SOFR(M) | | 7.50% | | 12.86% | | 02/2023 | | 02/2030 | | 7,230 | | | 7,147 | | | 7,303 | | | |
| | | | | | | | | | | | | | | | 14,294 | | | 14,606 | | | 1.10 | % |
| Daxko Acquisition Corporation | | | | | | | | | | | | | | | | | | | | |
| Software | | First lien (8)(15) | | SOFR(M) | | 5.50% | | 10.96% | | 10/2021 | | 10/2028 | | 13,011 | | | 12,914 | | | 13,011 | | | |
| | First lien (2)(15) | | SOFR(M) | | 5.50% | | 10.96% | | 10/2021 | | 10/2028 | | 1,096 | | | 1,088 | | | 1,096 | | | |
| | First lien (3)(15)(18) - Drawn | | SOFR(M) | | 5.50% | | 10.96% | | 10/2021 | | 10/2028 | | 66 | | | 65 | | | 66 | | | |
| | First lien (3)(15)(18) - Drawn | | P(Q) | | 4.50% | | 13.00% | | 10/2021 | | 10/2027 | | 66 | | | 65 | | | 66 | | | |
| | | | | | | | | | | | | | | | 14,132 | | | 14,239 | | | 1.07 | % |
| | | | | | | | | | | | | | | | | | | | |
| | | | | | | | | | | | | | | | | | | | |
The accompanying notes are an integral part of these consolidated financial statements.
99
New Mountain Finance Corporation
Consolidated Schedule of Investments (Continued)
December 31, 2023
(in thousands, except shares)
| | | | | | | | | | | | | | | | | | | | | | | | | | | | | | | | | | | | | | | | | | | | | | | | | | | | | | | | | | | | | | |
| Portfolio Company, Location and Industry(1) | | Type of
Investment | | Reference | | Spread | | Total Coupon (19) | | Acquisition Date | | Maturity/Expiration
Date | | Principal
Amount,
Par Value
or Shares (17) | | Cost | | Fair Value | | Percent of
Net
Assets |
| IMO Investor Holdings, Inc. | | | | | | | | | | | | | | | | | | | | |
| Healthcare | | First lien (2)(15) | | SOFR(Q) | | 6.00% | | 11.40% | | 05/2022 | | 05/2029 | | $ | 12,844 | | | $ | 12,739 | | | $ | 12,742 | | | |
| | First lien (3)(15)(18) - Drawn | | SOFR(S) | | 6.00% | | 11.39% | | 05/2022 | | 05/2029 | | 1,139 | | | 1,128 | | | 1,130 | | | |
| | First lien (3)(15)(18) - Drawn | | SOFR(S) | | 6.00% | | 11.42% | | 05/2022 | | 05/2028 | | 62 | | | 61 | | | 61 | | | |
| | | | | | | | | | | | | | | | 13,928 | | | 13,933 | | | 1.05 | % |
| Alegeus Technologies Holdings Corp. | | | | | | | | | | | | | | | | | | | | |
| Healthcare | | First lien (8)(15) | | SOFR(S) | | 8.25% | | 13.75% | | 09/2018 | | 09/2024 | | 13,444 | | | 13,433 | | | 13,444 | | | 1.01 | % |
| Calabrio, Inc. | | | | | | | | | | | | | | | | | | | | |
| Software | | First lien (5) | | SOFR(M) | | 7.13% | | 12.48% | | 04/2021 | | 04/2027 | | 12,347 | | | 12,290 | | | 12,224 | | | |
| | First lien (3)(18) - Drawn | | SOFR(M) | | 7.13% | | 12.48% | | 04/2021 | | 04/2027 | | 850 | | | 843 | | | 841 | | | |
| | | | | | | | | | | | | | | | 13,133 | | | 13,065 | | | 0.98 | % |
| USRP Holdings, Inc. | | | | | | | | | | | | | | | | | | | | |
| Business Services | | First lien (2)(15) | | SOFR(S) | | 5.75% | | 11.18% | | 07/2021 | | 07/2027 | | 11,226 | | | 11,152 | | | 11,226 | | | |
| | First lien (3)(15) | | SOFR(S) | | 5.75% | | 11.18% | | 07/2021 | | 07/2027 | | 1,462 | | | 1,451 | | | 1,462 | | | |
| | | | | | | | | | | | | | | | 12,603 | | | 12,688 | | | 0.95 | % |
| CFS Management, LLC | | | | | | | | | | | | | | | | | | | | |
| Healthcare | | First lien (2)(15) | | SOFR(Q)* | | 6.25% + 0.75%/PIK | | 12.61% | | 08/2019 | | 07/2024 | | 11,188 | | | 11,181 | | | 9,775 | | | |
| | First lien (2)(15) | | SOFR(Q)* | | 6.25% + 0.75%/PIK | | 12.61% | | 08/2019 | | 07/2024 | | 3,333 | | | 3,330 | | | 2,912 | | | |
| | | | | | | | | | | | | | | | 14,511 | | | 12,687 | | | 0.95 | % |
| CHA Holdings, Inc. | | | | | | | | | | | | | | | | | | | | |
| Business Services | | Second lien (4)(15) | | SOFR(M) | | 8.75% | | 14.22% | | 04/2018 | | 04/2026 | | 7,012 | | | 6,985 | | | 7,012 | | | |
| | Second lien (3)(15) | | SOFR(M) | | 8.75% | | 14.22% | | 04/2018 | | 04/2026 | | 4,453 | | | 4,436 | | | 4,454 | | | |
| | | | | | | | | | | | | | | | 11,421 | | | 11,466 | | | 0.86 | % |
| Anaplan, Inc. | | | | | | | | | | | | | | | | | | | | |
| Software | | First lien (2)(15) | | SOFR(Q) | | 6.50% | | 11.85% | | 06/2022 | | 06/2029 | | 10,618 | | | 10,535 | | | 10,618 | | | 0.80 | % |
| Specialtycare, Inc. | | | | | | | | | | | | | | | | | | | | |
| Healthcare | | First lien (2)(15) | | SOFR(Q) | | 5.75% | | 11.41% | | 06/2021 | | 06/2028 | | 10,352 | | | 10,253 | | | 9,938 | | | |
| | First lien (3)(15)(18) - Drawn | | SOFR(M) | | 4.00% | | 9.46% | | 06/2021 | | 06/2026 | | 78 | | | 77 | | | 76 | | | |
| | First lien (3)(15) | | SOFR(Q) | | 5.75% | | 11.41% | | 06/2021 | | 06/2028 | | 78 | | | 76 | | | 76 | | | |
| | | | | | | | | | | | | | | | 10,406 | | | 10,090 | | | 0.76 | % |
| Quartz Holding Company | | | | | | | | | | | | | | | | | | | | |
| Software | | Second lien (3)(15) | | SOFR(M) | | 8.00% | | 13.46% | | 04/2019 | | 04/2027 | | 10,000 | | | 9,900 | | | 10,000 | | | 0.75 | % |
| | | | | | | | | | | | | | | | | | | | |
| | | | | | | | | | | | | | | | | | | | |
The accompanying notes are an integral part of these consolidated financial statements.
100
New Mountain Finance Corporation
Consolidated Schedule of Investments (Continued)
December 31, 2023
(in thousands, except shares)
| | | | | | | | | | | | | | | | | | | | | | | | | | | | | | | | | | | | | | | | | | | | | | | | | | | | | | | | | | | | | | |
| Portfolio Company, Location and Industry(1) | | Type of
Investment | | Reference | | Spread | | Total Coupon (19) | | Acquisition Date | | Maturity/Expiration
Date | | Principal
Amount,
Par Value
or Shares (17) | | Cost | | Fair Value | | Percent of
Net
Assets |
| CG Group Holdings, LLC | | | | | | | | | | | | | | | | | | | | |
| Specialty Chemicals & Materials | | First lien (2)(15) | | SOFR(Q)* | | 6.75% + 2.00%/PIK | | 14.10% | | 07/2021 | | 07/2027 | | $ | 8,403 | | | $ | 8,342 | | | $ | 8,039 | | | |
| | First lien (3)(15)(18) - Drawn | | SOFR(M)* | | 6.75% + 2.00%/PIK | | 14.11% | | 07/2021 | | 07/2026 | | 935 | | | 925 | | | 894 | | | |
| | | | | | | | | | | | | | | | 9,267 | | | 8,933 | | | 0.67 | % |
| KPSKY Acquisition Inc. | | | | | | | | | | | | | | | | | | | | |
| Business Services | | First lien (8)(15) | | SOFR(Q) | | 5.25% | | 10.73% | | 10/2021 | | 10/2028 | | 6,898 | | | 6,846 | | | 6,763 | | | |
| | First lien (2)(15)(18) - Drawn | | SOFR(Q) | | 5.25% | | 10.73% | | 06/2022 | | 10/2028 | | 1,160 | | | 1,150 | | | 1,138 | | | |
| | First lien (2)(15) | | SOFR(Q) | | 5.25% | | 10.76% | | 10/2021 | | 10/2028 | | 790 | | | 784 | | | 774 | | | |
| | First lien (3)(15)(18) - Drawn | | SOFR(Q) | | 5.75% | | 11.23% | | 11/2023 | | 10/2028 | | 19 | | | 19 | | | 19 | | | |
| | | | | | | | | | | | | | | | 8,799 | | | 8,694 | | | 0.65 | % |
| Ncontracts, LLC | | | | | | | | | | | | | | | | | | | | |
| Software | | First lien (2) | | SOFR(S) | | 6.50% | | 11.80% | | 12/2023 | | 12/2029 | | 8,372 | | | 8,268 | | | 8,267 | | | 0.62 | % |
| Virtusa Corporation | | | | | | | | | | | | | | | | | | | | |
| Business Services | | Subordinated (3) | | FIXED(S) | | 7.13% | | 7.13% | | 10/2022 | | 12/2028 | | 9,401 | | | 7,565 | | | 8,077 | | | 0.61 | % |
| PPVA Black Elk (Equity) LLC | | | | | | | | | | | | | | | | | | | | |
| Business Services | | Subordinated (3)(15) | | SOFR(Q) | | — | | — | | 05/2013 | | — | | 14,500 | | | 14,500 | | | 7,975 | | | 0.60 | % |
| TRC Companies L.L.C. (fka Energize Holdco LLC) | | | | | | | | | | | | | | | | | | | | |
| Business Services | | Second lien (2)(15) | | SOFR(M) | | 6.75% | | 12.22% | | 11/2021 | | 12/2029 | | 7,950 | | | 7,918 | | | 7,711 | | | 0.58 | % |
| DS Admiral Bidco, LLC | | | | | | | | | | | | | | | | | | | | |
| Software | | First lien (2)(15) | | SOFR(Q) | | 7.00% | | 12.35% | | 12/2022 | | 03/2028 | | 7,472 | | | 7,377 | | | 7,564 | | | 0.57 | % |
| PPV Intermediate Holdings, LLC | | | | | | | | | | | | | | | | | | | | |
| Consumer Services | | First lien (4)(15) | | SOFR(Q) | | 5.75% | | 11.14% | | 08/2022 | | 08/2029 | | 7,514 | | | 7,449 | | | 7,514 | | | 0.56 | % |
| Safety Borrower Holdings LLC | | | | | | | | | | | | | | | | | | | | |
| Software | | First lien (2)(15) | | SOFR(M) | | 5.25% | | 10.87% | | 09/2021 | | 09/2027 | | 6,904 | | | 6,881 | | | 6,904 | | | |
| | First lien (3)(15)(18) - Drawn | | P(Q) | | 4.25% | | 12.75% | | 09/2021 | | 09/2027 | | 384 | | | 382 | | | 384 | | | |
| | | | | | | | | | | | | | | | 7,263 | | | 7,288 | | | 0.55 | % |
| Transcendia Holdings, Inc. | | | | | | | | | | | | | | | | | | | | |
| Packaging | | Second lien (8)(15) | | L(Q)(34) | | 8.00% | | 13.61% | | 06/2017 | | 05/2025 | | 14,500 | | | 14,445 | | | 7,250 | | | 0.54 | % |
| Community Brands ParentCo, LLC | | | | | | | | | | | | | | | | | | | | |
| Software | | First lien (2)(15) | | SOFR(M) | | 5.50% | | 10.96% | | 02/2022 | | 02/2028 | | 7,091 | | | 7,037 | | | 6,899 | | | 0.52 | % |
| Sun Acquirer Corp. | | | | | | | | | | | | | | | | | | | | |
| Consumer Services | | First lien (2)(15) | | SOFR(M) | | 5.75% | | 11.22% | | 09/2021 | | 09/2028 | | 3,945 | | | 3,919 | | | 3,878 | | | |
| | First lien (2)(15) | | SOFR(M) | | 5.75% | | 11.22% | | 09/2021 | | 09/2028 | | 2,788 | | | 2,757 | | | 2,740 | | | |
| | First lien (3)(15)(18) - Drawn | | SOFR(M) | | 5.75% | | 11.22% | | 09/2021 | | 09/2027 | | 112 | | | 113 | | | 110 | | | |
| | | | | | | | | | | | | | | | 6,789 | | | 6,728 | | | 0.51 | % |
| | | | | | | | | | | | | | | | | | | | |
| | | | | | | | | | | | | | | | | | | | |
The accompanying notes are an integral part of these consolidated financial statements.
101
New Mountain Finance Corporation
Consolidated Schedule of Investments (Continued)
December 31, 2023
(in thousands, except shares)
| | | | | | | | | | | | | | | | | | | | | | | | | | | | | | | | | | | | | | | | | | | | | | | | | | | | | | | | | | | | | | |
| Portfolio Company, Location and Industry(1) | | Type of
Investment | | Reference | | Spread | | Total Coupon (19) | | Acquisition Date | | Maturity/Expiration
Date | | Principal
Amount,
Par Value
or Shares (17) | | Cost | | Fair Value | | Percent of
Net
Assets |
| Houghton Mifflin Harcourt Company | | | | | | | | | | | | | | | | | | | | |
| Education | | First lien (8) | | SOFR(M) | | 5.25% | | 10.71% | | 10/2023 | | 04/2029 | | $ | 6,822 | | | $ | 6,430 | | | $ | 6,704 | | | 0.50 | % |
| Greenway Health, LLC | | | | | | | | | | | | | | | | | | | | |
| Healthcare | | First lien (8) | | SOFR(S) | | 6.75% | | 11.93% | | 12/2023 | | 04/2029 | | 6,349 | | | 6,254 | | | 6,254 | | | 0.47 | % |
| Appriss Health Holdings, Inc. (22) | | | | | | | | | | | | | | | | | | | | |
| Appriss Health, LLC | | | | | | | | | | | | | | | | | | | | |
| Healthcare | | First lien (8)(15) | | SOFR(Q) | | 6.75% | | 12.32% | | 05/2021 | | 05/2027 | | 6,188 | | | 6,150 | | | 6,188 | | | 0.46 | % |
| Pye-Barker Fire & Safety, LLC | | | | | | | | | | | | | | | | | | | | |
| Business Services | | First lien (2)(15) | | SOFR(Q) | | 5.50% | | 11.00% | | 11/2021 | | 11/2027 | | 5,109 | | | 5,071 | | | 5,109 | | | 0.38 | % |
| Healthspan Buyer, LLC | | | | | | | | | | | | | | | | | | | | |
| Healthcare | | First lien (8)(15) | | SOFR(Q) | | 5.75% | | 11.10% | | 10/2023 | | 10/2030 | | 5,120 | | | 5,070 | | | 5,069 | | | 0.38 | % |
| Cube Industrials Buyer, Inc. | | | | | | | | | | | | | | | | | | | | |
| Business Products | | First lien (3)(15) | | SOFR(Q) | | 6.00% | | 11.40% | | 10/2023 | | 10/2030 | | 4,483 | | | 4,450 | | | 4,450 | | | 0.33 | % |
| CommerceHub, Inc. | | | | | | | | | | | | | | | | | | | | |
| Software | | First lien (3)(15) | | SOFR(Q) | | 6.25% | | 11.79% | | 06/2023 | | 12/2027 | | 3,960 | | | 3,564 | | | 3,960 | | | 0.30 | % |
| Project Power Buyer, LLC | | | | | | | | | | | | | | | | | | | | |
| Software | | First lien (2)(15) | | SOFR(Q) | | 7.00% | | 12.35% | | 01/2023 | | 05/2026 | | 3,553 | | | 3,513 | | | 3,553 | | | 0.27 | % |
| Next Holdco, LLC | | | | | | | | | | | | | | | | | | | | |
| Healthcare | | First lien (2)(15) | | SOFR(M) | | 6.00% | | 11.37% | | 11/2023 | | 11/2030 | | 3,520 | | | 3,494 | | | 3,494 | | | 0.26 | % |
| DCA Investment Holding, LLC | | | | | | | | | | | | | | | | | | | | |
| Healthcare | | First lien (2)(15) | | SOFR(Q) | | 6.41% | | 11.75% | | 03/2021 | | 04/2028 | | 1,823 | | | 1,815 | | | 1,768 | | | |
| | First lien (3)(15)(18) - Drawn | | SOFR(Q) | | 6.50% | | 11.85% | | 12/2022 | | 04/2028 | | 1,021 | | | 1,007 | | | 992 | | | |
| | | | | | | | | | | | | | | | 2,822 | | | 2,760 | | | 0.21 | % |
| New Trojan Parent, Inc. | | | | | | | | | | | | | | | | | | | | |
| Healthcare | | Second lien (2)(15) | | SOFR(M) | | 7.25% | | 12.72% | | 01/2021 | | 01/2029 | | 26,762 | | | 26,663 | | | 1,421 | | | 0.11 | % |
| PPVA Fund, L.P. | | | | | | | | | | | | | | | | | | | | |
| Business Services | | Collateralized Financing (34)(35) | | — | | — | | — | | 11/2014 | | — | | — | | | — | | | — | | | — | % |
| Total Funded Debt Investments - United States | | | | | | | | | | | | | | | | $ | 1,992,317 | | | $ | 1,917,817 | | | 144.02 | % |
| Funded Debt Investments - United Kingdom | | | | | | | | | | | | | | | | | | | | |
| Aston FinCo S.a r.l. / Aston US Finco, LLC** | | | | | | | | | | | | | | | | | | | | |
| Software | | Second lien (8)(15) | | SOFR(M) | | 8.25% | | 13.72% | | 10/2019 | | 10/2027 | | $ | 34,459 | | | $ | 34,301 | | | $ | 34,458 | | | 2.59 | % |
| Integro Parent Inc.** | | | | | | | | | | | | | | | | | | | | |
| Business Services | | First lien (2)(15) | | SOFR(Q)* | | 12.25%/PIK | | 17.60% | | 10/2015 | | 10/2024 | | 4,086 | | | 4,085 | | | 4,086 | | | |
| | First lien (3)(15) | | SOFR(Q)* | | 12.25%/PIK | | 17.60% | | 06/2018 | | 10/2024 | | 807 | | | 805 | | | 807 | | | |
| | Second lien (3)(15) | | SOFR(Q)* | | 12.25%/PIK | | 17.60% | | 10/2015 | | 10/2024 | | 13,657 | | | 12,888 | | | 13,231 | | | |
| | | | | | | | | | | | | | | | 17,778 | | | 18,124 | | | 1.36 | % |
| Total Funded Debt Investments - United Kingdom | | | | | | | | | | | | | | | | $ | 52,079 | | | $ | 52,582 | | | 3.95 | % |
| | | | | | | | | | | | | | | | | | | | |
| | | | | | | | | | | | | | | | | | | | |
The accompanying notes are an integral part of these consolidated financial statements.
102
New Mountain Finance Corporation
Consolidated Schedule of Investments (Continued)
December 31, 2023
(in thousands, except shares)
| | | | | | | | | | | | | | | | | | | | | | | | | | | | | | | | | | | | | | | | | | | | | | | | | | | | | | | | | | | | | | |
| Portfolio Company, Location and Industry(1) | | Type of
Investment | | Reference | | Spread | | Total Coupon (19) | | Acquisition Date | | Maturity/Expiration
Date | | Principal
Amount,
Par Value
or Shares (17) | | Cost | | Fair Value | | Percent of
Net
Assets |
| Funded Debt Investments - Jersey | | | | | | | | | | | | | | | | | | | | |
| Tennessee Bidco Limited ** | | | | | | | | | | | | | | | | | | | | |
| Business Services | | First lien (3)(15)(16) | | SONIA(D)* | | 5.00% +2.50% /PIK | | 12.96% | | 08/2021 | | 08/2028 | | £ | 13,039 | | | $ | 17,864 | | | $ | 16,600 | | | |
| | First lien (3)(15)(16) | | SONIA(D)* | | 5.00% +2.50% /PIK | | 12.96% | | 08/2021 | | 08/2028 | | £ | 10,734 | | | 13,407 | | | 13,664 | | | |
| | First lien (3)(15) | | SOFR(S)* | | 5.00% +2.50% /PIK | | 13.03% | | 08/2021 | | 08/2028 | | $ | 10,312 | | | 10,200 | | | 10,312 | | | |
| | First lien (3)(15) | | SOFR(S)* | | 5.00% +2.50% /PIK | | 12.90% | | 08/2021 | | 08/2028 | | $ | 6,373 | | | 6,300 | | | 6,373 | | | |
| | First lien (3)(15)(16) | | EURIBOR(S)* | | 5.00% +2.50% /PIK | | 11.47% | | 08/2021 | | 08/2028 | | € | 716 | | | 726 | | | 791 | | | |
| | | | | | | | | | | | | | | | 48,497 | | | 47,740 | | | 3.58 | % |
| Total Funded Debt Investments - Jersey | | | | | | | | | | | | | | | | $ | 48,497 | | | $ | 47,740 | | | 3.58 | % |
| Funded Debt Investments - Australia | | | | | | | | | | | | | | | | | | | | |
| Atlas AU Bidco Pty Ltd** | | | | | | | | | | | | | | | | | | | | |
| Business Services | | First lien (2)(15) | | SOFR(M) | | 7.25% | | 12.61% | | 12/2022 | | 12/2029 | | $ | 3,454 | | | $ | 3,407 | | | $ | 3,454 | | | |
| | First lien (2) | | SOFR(M) | | 6.75% | | 12.11% | | 12/2023 | | 12/2029 | | 1,345 | | | 1,332 | | | 1,332 | | | |
| | | | | | | | | | | | | | | | 4,739 | | | 4,786 | | | 0.36 | % |
| Total Funded Debt Investments - Australia | | | | | | | | | | | | | | | | $ | 4,739 | | | $ | 4,786 | | | 0.36 | % |
| Total Funded Debt Investments | | | | | | | | | | | | | | | | $ | 2,097,632 | | | $ | 2,022,925 | | | 151.91 | % |
| Equity - United States | | | | | | | | | | | | | | | | | | | | |
| Dealer Tire Holdings, LLC | | | | | | | | | | | | | | | | | | | | |
| Distribution & Logistics | | Preferred shares (3)(15) | | FIXED(S)* | | 7.00%/PIK | | 7.00% | | 09/2021 | | — | | 56,271 | | | $ | 70,383 | | | $ | 74,768 | | | 5.61 | % |
| Symplr Software Intermediate Holdings, Inc. | | | | | | | | | | | | | | | | | | | | |
| Healthcare | | Preferred shares (4)(15) | | SOFR(Q)* | | 10.50%/PIK | | 16.03% | | 11/2018 | | — | | 7,500 | | | 13,999 | | | 13,807 | | | |
| | Preferred shares (3)(15) | | SOFR(Q)* | | 10.50%/PIK | | 16.03% | | 11/2018 | | — | | 2,586 | | | 4,826 | | | 4,759 | | | |
| | | | | | | | | | | | | | | | 18,825 | | | 18,566 | | | 1.39 | % |
| Knockout Intermediate Holdings I Inc. (32) | | | | | | | | | | | | | | | | | | | | |
| Software | | Preferred shares (3)(15) | | FIXED(S)* | | 11.75%/PIK | | 11.75% | | 06/2022 | | — | | 15,150 | | | 16,837 | | | 17,019 | | | 1.28 | % |
| ACI Parent Inc. (28) | | | | | | | | | | | | | | | | | | | | |
| Healthcare | | Preferred shares (3)(15) | | FIXED(Q)* | | 11.75%/PIK | | 11.75% | | 08/2021 | | — | | 12,500 | | | 16,414 | | | 15,040 | | | 1.13 | % |
| Project Essential Super Parent, Inc. | | | | | | | | | | | | | | | | | | | | |
| Software | | Preferred shares (3)(15) | | SOFR(Q)* | | 9.50%/PIK | | 14.85% | | 04/2021 | | — | | 10,000 | | | 13,754 | | | 12,382 | | | 0.93 | % |
| Diamond Parent Holdings Corp. (27) | | | | | | | | | | | | | | | | | | | | |
| Diligent Preferred Issuer, Inc. | | | | | | | | | | | | | | | | | | | | |
| Software | | Preferred shares (3)(15) | | FIXED(S)* | | 10.50%/PIK | | 10.50% | | 04/2021 | | — | | 10,000 | | | 12,771 | | | 12,162 | | | 0.91 | % |
| | | | | | | | | | | | | | | | | | | | |
| | | | | | | | | | | | | | | | | | | | |
The accompanying notes are an integral part of these consolidated financial statements.
103
New Mountain Finance Corporation
Consolidated Schedule of Investments (Continued)
December 31, 2023
(in thousands, except shares)
| | | | | | | | | | | | | | | | | | | | | | | | | | | | | | | | | | | | | | | | | | | | | | | | | | | | | | | | | | | | | | |
| Portfolio Company, Location and Industry(1) | | Type of
Investment | | Reference | | Spread | | Total Coupon (19) | | Acquisition Date | | Maturity/Expiration
Date | | Principal
Amount,
Par Value
or Shares (17) | | Cost | | Fair Value | | Percent of
Net
Assets |
| OEC Holdco, LLC (21) | | | | | | | | | | | | | | | | | | | | |
| Software | | Preferred shares (12)(15) | | FIXED(S)* | | 11.00%/PIK | | 11.00% | | 12/2021 | | — | | 7,214 | | | $ | 8,431 | | | $ | 8,115 | | | 0.61 | % |
| HB Wealth Management, LLC | | | | | | | | | | | | | | | | | | | | |
| Financial Services | | Preferred shares (11)(15) | | FIXED(Q)* | | 4.00%/PIK | | 4.00% | | 09/2021 | | — | | 48,303 | | | 4,777 | | | 5,125 | | | 0.38 | % |
| FS WhiteWater Holdings, LLC (29) | | | | | | | | | | | | | | | | | | | | |
| Consumer Services | | Ordinary shares (5)(15) | | — | | — | | — | | 12/2021 | | — | | 50,000 | | | 5,000 | | | 4,454 | | | 0.33 | % |
| OA Topco, L.P. (31) | | | | | | | | | | | | | | | | | | | | |
| Healthcare | | Ordinary shares (3)(15) | | — | | — | | — | | 12/2021 | | — | | 2,000,000 | | | 2,000 | | | 3,343 | | | 0.25 | % |
| Appriss Health Holdings, Inc. (22) | | | | | | | | | | | | | | | | | | | | |
| Appriss Health Intermediate Holdings, Inc. | | | | | | | | | | | | | | | | | | | | |
| Healthcare | | Preferred shares (3)(15) | | FIXED(Q)* | | 11.00%/PIK | | 11.00% | | 05/2021 | | — | | 2,333 | | | 2,992 | | | 2,863 | | | 0.21 | % |
| Pioneer Topco I, L.P. (30) | | | | | | | | | | | | | | | | | | | | |
| Software | | Ordinary shares (13)(15) | | — | | — | | — | | 11/2021 | | — | | 199,980 | | | 2,000 | | | 1,796 | | | 0.13 | % |
| GEDC Equity, LLC | | | | | | | | | | | | | | | | | | | | |
| Healthcare | | Ordinary shares (3)(15) | | — | | — | | — | | 06/2023 | | — | | 190,000 | | | 190 | | | 150 | | | 0.01 | % |
| Ancora Acquisition LLC | | | | | | | | | | | | | | | | | | | | |
| Education | | Preferred shares (9)(15) | | SOFR(Q) | | — | | — | | 08/2013 | | — | | 372 | | | 83 | | | — | | | — | % |
| AAC Lender Holdings, LLC(26) | | | | | | | | | | | | | | | | | | | | |
| Education | | Ordinary shares (3)(15) | | SOFR(Q) | | — | | — | | 03/2021 | | — | | 758 | | | — | | | — | | | — | % |
| Total Shares - United States | | | | | | | | | | | | | | | | $ | 174,457 | | | $ | 175,783 | | | 13.17 | % |
| Equity - Hong Kong | | | | | | | | | | | | | | | | | | | | |
| Bach Special Limited (Bach Preference Limited)** | | | | | | | | | | | | | | | | | | | | |
| Education | | Preferred shares (3)(15) | | FIXED(Q)* | | 12.25%/PIK | | 12.25% | | 09/2017 | | — | | 122,712 | | | $ | 12,189 | | | $ | 11,742 | | | 0.88 | % |
| Total Shares - Hong Kong | | | | | | | | | | | | | | | | $ | 12,189 | | | $ | 11,742 | | | 0.88 | % |
| Total Shares | | | | | | | | | | | | | | | | $ | 186,646 | | | $ | 187,525 | | | 14.05 | % |
| Total Funded Investments | | | | | | | | | | | | | | | | $ | 2,284,278 | | | $ | 2,210,450 | | | 165.96 | % |
| Unfunded Debt Investments - United States | | | | | | | | | | | | | | | | | | | | |
| Coupa Holdings, LLC | | | | | | | | | | | | | | | | | | | | |
| Software | | First lien (3)(15)(18) - Undrawn | | — | | — | | — | | 02/2023 | | 08/2024 | | $ | 1,291 | | | $ | — | | | $ | 13 | | | |
| | First lien (3)(15)(18) - Undrawn | | — | | — | | — | | 02/2023 | | 02/2029 | | 989 | | | (12) | | | — | | | |
| | | | | | | | | | | | | | | | (12) | | | 13 | | | 0.00 | % |
| | | | | | | | | | | | | | | | | | | | |
| | | | | | | | | | | | | | | | | | | | |
The accompanying notes are an integral part of these consolidated financial statements.
104
New Mountain Finance Corporation
Consolidated Schedule of Investments (Continued)
December 31, 2023
(in thousands, except shares)
| | | | | | | | | | | | | | | | | | | | | | | | | | | | | | | | | | | | | | | | | | | | | | | | | | | | | | | | | | | | | | |
| Portfolio Company, Location and Industry(1) | | Type of
Investment | | Reference | | Spread | | Total Coupon (19) | | Acquisition Date | | Maturity/Expiration
Date | | Principal
Amount,
Par Value
or Shares (17) | | Cost | | Fair Value | | Percent of
Net
Assets |
| PetVet Care Centers, LLC | | | | | | | | | | | | | | | | | | | | |
| Consumer Services | | First lien (3)(18) - Undrawn | | — | | — | | — | | 10/2023 | | 11/2025 | | $ | 3,708 | | | $ | — | | | $ | 1 | | | |
| | First lien (3)(18) - Undrawn | | — | | — | | — | | 10/2023 | | 11/2029 | | 3,708 | | | (37) | | | — | | | |
| | | | | | | | | | | | | | | | (37) | | | 1 | | | 0.00 | % |
| AAC Lender Holdings, LLC (26) | | | | | | | | | | | | | | | | | | | | |
| American Achievement Corporation (aka AAC Holding Corp.) | | | | | | | | | | | | | | | | | | | | |
| Education | | First lien (3)(15)(18) - Undrawn | | — | | — | | — | | 01/2021 | | 09/2026 | | 2,652 | | | — | | | — | | | — | % |
| Safety Borrower Holdings LLC | | | | | | | | | | | | | | | | | | | | |
| Software | | First lien (3)(15)(18) - Undrawn | | — | | — | | — | | 09/2021 | | 09/2027 | | 128 | | | (1) | | | — | | | — | % |
| Project Power Buyer, LLC | | | | | | | | | | | | | | | | | | | | |
| Software | | First lien (3)(15)(18) - Undrawn | | — | | — | | — | | 01/2023 | | 05/2025 | | 184 | | | (3) | | | — | | | — | % |
| Appriss Health Holdings, Inc. (22) | | | | | | | | | | | | | | | | | | | | |
| Appriss Health, LLC | | | | | | | | | | | | | | | | | | | | |
| Healthcare | | First lien (3)(15)(18) - Undrawn | | — | | — | | — | | 05/2021 | | 05/2027 | | 417 | | | (4) | | | — | | | — | % |
| PPV Intermediate Holdings, LLC | | | | | | | | | | | | | | | | | | | | |
| Consumer Services | | First lien (3)(15)(18) - Undrawn | | — | | — | | — | | 08/2022 | | 08/2029 | | 486 | | | (5) | | | — | | | — | % |
| Coyote Buyer, LLC | | | | | | | | | | | | | | | | | | | | |
| Specialty Chemicals & Materials | | First lien (3)(18) - Undrawn | | — | | — | | — | | 03/2020 | | 02/2025 | | 1,013 | | | (5) | | | — | | | — | % |
| Bullhorn, Inc. | | | | | | | | | | | | | | | | | | | | |
| Software | | First lien (3)(15)(18) - Undrawn | | — | | — | | — | | 09/2019 | | 09/2026 | | 852 | | | (6) | | | — | | | — | % |
| Wealth Enhancement Group, LLC | | | | | | | | | | | | | | | | | | | | |
| Financial Services | | First lien (2)(15)(18) - Undrawn | | — | | — | | — | | 05/2022 | | 05/2024 | | 2,396 | | | — | | | — | | | |
| | First lien (3)(15)(18) - Undrawn | | — | | — | | — | | 08/2021 | | 10/2027 | | 2,040 | | | (6) | | | — | | | |
| | | | | | | | | | | | | | | | (6) | | | — | | | — | % |
| USRP Holdings, Inc. | | | | | | | | | | | | | | | | | | | | |
| Business Services | | First lien (3)(15)(18) - Undrawn | | — | | — | | — | | 07/2021 | | 07/2027 | | 893 | | | (9) | | | — | | | — | % |
| | | | | | | | | | | | | | | | | | | | |
| | | | | | | | | | | | | | | | | | | | |
The accompanying notes are an integral part of these consolidated financial statements.
105
New Mountain Finance Corporation
Consolidated Schedule of Investments (Continued)
December 31, 2023
(in thousands, except shares)
| | | | | | | | | | | | | | | | | | | | | | | | | | | | | | | | | | | | | | | | | | | | | | | | | | | | | | | | | | | | | | |
| Portfolio Company, Location and Industry(1) | | Type of
Investment | | Reference | | Spread | | Total Coupon (19) | | Acquisition Date | | Maturity/Expiration
Date | | Principal
Amount,
Par Value
or Shares (17) | | Cost | | Fair Value | | Percent of
Net
Assets |
| Daxko Acquisition Corporation | | | | | | | | | | | | | | | | | | | | |
| Software | | First lien (3)(15)(18) - Undrawn | | — | | — | | — | | 10/2021 | | 04/2024 | | $ | 459 | | | $ | — | | | $ | — | | | |
| | First lien (3)(15)(18) - Undrawn | | — | | — | | — | | 10/2021 | | 10/2027 | | 920 | | | (9) | | | — | | | |
| | | | | | | | | | | | | | | | (9) | | | — | | | — | % |
| Kele Holdco, Inc. | | | | | | | | | | | | | | | | | | | | |
| Distribution & Logistics | | First lien (3)(15)(18) - Undrawn | | — | | — | | — | | 02/2020 | | 02/2026 | | 1,799 | | | (9) | | | — | | | — | % |
| Xactly Corporation | | | | | | | | | | | | | | | | | | | | |
| Software | | First lien (3)(15)(18) - Undrawn | | — | | — | | — | | 07/2017 | | 07/2025 | | 992 | | | (10) | | | — | | | — | % |
| AmeriVet Partners Management, Inc. | | | | | | | | | | | | | | | | | | | | |
| Consumer Services | | First lien (3)(15)(18) - Undrawn | | — | | — | | — | | 02/2022 | | 02/2028 | | 1,969 | | | (10) | | | — | | | — | % |
| Associations, Inc. | | | | | | | | | | | | | | | | | | | | |
| Business Services | | First lien (3)(15)(18) - Undrawn | | — | | — | | — | | 07/2021 | | 07/2027 | | 2,291 | | | (11) | | | — | | | — | % |
| Foreside Financial Group, LLC | | | | | | | | | | | | | | | | | | | | |
| Business Services | | First lien (3)(15)(18) - Undrawn | | — | | — | | — | | 05/2022 | | 05/2024 | | 4,557 | | | — | | | — | | | |
| | First lien (3)(15)(18) - Undrawn | | — | | — | | — | | 05/2022 | | 09/2027 | | 1,090 | | | (11) | | | — | | | |
| | | | | | | | | | | | | | | | (11) | | | — | | | — | % |
| Granicus, Inc. | | | | | | | | | | | | | | | | | | | | |
| Software | | First lien (3)(15)(18) - Undrawn | | — | | — | | — | | 01/2021 | | 01/2027 | | 1,834 | | | (14) | | | — | | | — | % |
| Trinity Air Consultants Holdings Corporation | | | | | | | | | | | | | | | | | | | | |
| Business Services | | First lien (2)(15)(18) - Undrawn | | — | | — | | — | | 06/2021 | | 06/2024 | | 1,182 | | | — | | | — | | | |
| | First lien (3)(15)(18) - Undrawn | | — | | — | | — | | 06/2021 | | 06/2027 | | 1,501 | | | (15) | | | — | | | |
| | | | | | | | | | | | | | | | (15) | | | — | | | — | % |
| Pye-Barker Fire & Safety, LLC | | | | | | | | | | | | | | | | | | | | |
| Business Services | | First lien (3)(15)(18) - Undrawn | | — | | — | | — | | 11/2021 | | 11/2026 | | 1,161 | | | (16) | | | — | | | — | % |
| Recorded Future, Inc. | | | | | | | | | | | | | | | | | | | | |
| Software | | First lien (3)(15)(18) - Undrawn | | — | | — | | — | | 08/2019 | | 07/2025 | | 2,981 | | | (20) | | | — | | | — | % |
| | | | | | | | | | | | | | | | | | | | |
| | | | | | | | | | | | | | | | | | | | |
The accompanying notes are an integral part of these consolidated financial statements.
106
New Mountain Finance Corporation
Consolidated Schedule of Investments (Continued)
December 31, 2023
(in thousands, except shares)
| | | | | | | | | | | | | | | | | | | | | | | | | | | | | | | | | | | | | | | | | | | | | | | | | | | | | | | | | | | | | | |
| Portfolio Company, Location and Industry(1) | | Type of
Investment | | Reference | | Spread | | Total Coupon (19) | | Acquisition Date | | Maturity/Expiration
Date | | Principal
Amount,
Par Value
or Shares (17) | | Cost | | Fair Value | | Percent of
Net
Assets |
| YLG Holdings, Inc. | | | | | | | | | | | | | | | | | | | | |
| Business Services | | First lien (5)(15)(18) - Undrawn | | — | | — | | — | | 10/2021 | | 12/2024 | | $ | 785 | | | $ | — | | | $ | — | | | |
| | First lien (3)(15)(18) - Undrawn | | — | | — | | — | | 11/2019 | | 10/2025 | | 3,968 | | | (20) | | | — | | | |
| | | | | | | | | | | | | | | | (20) | | | — | | | — | % |
| Avalara, Inc. | | | | | | | | | | | | | | | | | | | | |
| Software | | First lien (3)(15)(18) - Undrawn | | — | | — | | — | | 10/2022 | | 10/2028 | | 1,720 | | | (21) | | | — | | | — | % |
| iCIMS, Inc. | | | | | | | | | | | | | | | | | | | | |
| Software | | First lien (8)(15)(18) - Undrawn | | — | | — | | — | | 08/2022 | | 08/2024 | | 6,293 | | | — | | | — | | | |
| | First lien (2)(15)(18) - Undrawn | | — | | — | | — | | 09/2023 | | 08/2024 | | 976 | | | — | | | — | | | |
| | First lien (3)(15)(18) - Undrawn | | — | | — | | — | | 08/2022 | | 08/2028 | | 2,347 | | | (21) | | | — | | | |
| | | | | | | | | | | | | | | | (21) | | | — | | | — | % |
| Knockout Intermediate Holdings I Inc. (32) | | | | | | | | | | | | | | | | | | | | |
| Kaseya Inc. | | | | | | | | | | | | | | | | | | | | |
| Software | | First lien (3)(15)(18) - Undrawn | | — | | — | | — | | 06/2022 | | 06/2024 | | 3,616 | | | — | | | — | | | |
| | First lien (3)(15)(18) - Undrawn | | — | | — | | — | | 06/2022 | | 06/2029 | | 2,888 | | | (22) | | | — | | | |
| | | | | | | | | | | | | | | | (22) | | | — | | | — | % |
| Oranje Holdco, Inc. | | | | | | | | | | | | | | | | | | | | |
| Education | | First lien (3)(15)(18) - Undrawn | | — | | — | | — | | 02/2023 | | 02/2029 | | 1,860 | | | (23) | | | — | | | — | % |
| IG Investments Holdings, LLC | | | | | | | | | | | | | | | | | | | | |
| Business Services | | First lien (3)(15)(18) - Undrawn | | — | | — | | — | | 09/2021 | | 09/2027 | | 2,298 | | | (23) | | | — | | | — | % |
| GS Acquisitionco, Inc. | | | | | | | | | | | | | | | | | | | | |
| Software | | First lien (3)(15)(18) - Undrawn | | — | | — | | — | | 08/2019 | | 05/2026 | | 3,730 | | | (23) | | | — | | | — | % |
| Pioneer Topco I, L.P. (30) | | | | | | | | | | | | | | | | | | | | |
| Pioneer Buyer I, LLC | | | | | | | | | | | | | | | | | | | | |
| Software | | First lien (3)(15)(18) - Undrawn | | — | | — | | — | | 11/2021 | | 11/2027 | | 2,446 | | | (24) | | | — | | | — | % |
| Infogain Corporation | | | | | | | | | | | | | | | | | | | | |
| Business Services | | First lien (3)(15)(18) - Undrawn | | — | | — | | — | | 07/2021 | | 07/2026 | | 3,827 | | | (29) | | | — | | | — | % |
| GC Waves Holdings, Inc. | | | | | | | | | | | | | | | | | | | | |
| Financial Services | | First lien (3)(15)(18) - Undrawn | | — | | — | | — | | 10/2019 | | 08/2028 | | 3,951 | | | (30) | | | — | | | — | % |
| | | | | | | | | | | | | | | | | | | | |
| | | | | | | | | | | | | | | | | | | | |
The accompanying notes are an integral part of these consolidated financial statements.
107
New Mountain Finance Corporation
Consolidated Schedule of Investments (Continued)
December 31, 2023
(in thousands, except shares)
| | | | | | | | | | | | | | | | | | | | | | | | | | | | | | | | | | | | | | | | | | | | | | | | | | | | | | | | | | | | | | |
| Portfolio Company, Location and Industry(1) | | Type of
Investment | | Reference | | Spread | | Total Coupon (19) | | Acquisition Date | | Maturity/Expiration
Date | | Principal
Amount,
Par Value
or Shares (17) | | Cost | | Fair Value | | Percent of
Net
Assets |
| OA Topco, L.P. (31) | | | | | | | | | | | | | | | | | | | | |
| OA Buyer, Inc. | | | | | | | | | | | | | | | | | | | | |
| Healthcare | | First lien (3)(15)(18) - Undrawn | | — | | — | | — | | 12/2021 | | 12/2028 | | $ | 3,600 | | | $ | (36) | | | $ | — | | | — | % |
| Paw Midco, Inc. | | | | | | | | | | | | | | | | | | | | |
| AAH Topco, LLC | | | | | | | | | | | | | | | | | | | | |
| Consumer Services | | First lien (3)(15)(18) - Undrawn | | — | | — | | — | | 12/2021 | | 12/2027 | | 3,659 | | | (37) | | | — | | | — | % |
| Next Holdco, LLC | | | | | | | | | | | | | | | | | | | | |
| Healthcare | | First lien (3)(15)(18) - Undrawn | | — | | — | | — | | 11/2023 | | 11/2025 | | 903 | | | — | | | — | | | |
| | First lien (3)(15)(18) - Undrawn | | — | | — | | — | | 11/2023 | | 11/2029 | | 339 | | | (3) | | | (3) | | | |
| | | | | | | | | | | | | | | | (3) | | | (3) | | | (0.00)% |
| Cube Industrials Buyer, Inc. | | | | | | | | | | | | | | | | | | | | |
| Business Products | | First lien (3)(15)(18) - Undrawn | | — | | — | | — | | 10/2023 | | 10/2029 | | 517 | | | (4) | | | (4) | | | (0.00)% |
| MRI Software LLC | | | | | | | | | | | | | | | | | | | | |
| Software | | First lien (3)(15)(18) - Undrawn | | — | | — | | — | | 01/2020 | | 02/2027 | | 2,002 | | | (10) | | | (5) | | | (0.00)% |
| Calabrio, Inc. | | | | | | | | | | | | | | | | | | | | |
| Software | | First lien (3)(18) - Undrawn | | — | | — | | — | | 04/2021 | | 04/2027 | | 637 | | | (5) | | | (6) | | | (0.00)% |
| Brave Parent Holdings, Inc. | | | | | | | | | | | | | | | | | | | | |
| Software | | First lien (5)(15)(18) - Undrawn | | — | | — | | — | | 11/2023 | | 05/2025 | | 2,292 | | | — | | | — | | | |
| | First lien (3)(15)(18) - Undrawn | | — | | — | | — | | 11/2023 | | 11/2030 | | 1,146 | | | (6) | | | (6) | | | |
| | | | | | | | | | | | | | | | (6) | | | (6) | | | (0.00)% |
| Deca Dental Holdings LLC | | | | | | | | | | | | | | | | | | | | |
| Healthcare | | First lien (3)(15)(18) - Undrawn | | — | | — | | — | | 08/2021 | | 08/2027 | | 404 | | | (4) | | | (7) | | | (0.00)% |
| Sun Acquirer Corp. | | | | | | | | | | | | | | | | | | | | |
| Consumer Services | | First lien (3)(15)(18) - Undrawn | | — | | — | | — | | 09/2021 | | 09/2027 | | 447 | | | (6) | | | (8) | | | (0.00)% |
| CG Group Holdings, LLC | | | | | | | | | | | | | | | | | | | | |
| Specialty Chemicals & Materials | | First lien (3)(15)(18) - Undrawn | | — | | — | | — | | 07/2021 | | 07/2026 | | 226 | | | (3) | | | (10) | | | (0.00)% |
| | | | | | | | | | | | | | | | | | | | |
| | | | | | | | | | | | | | | | | | | | |
The accompanying notes are an integral part of these consolidated financial statements.
108
New Mountain Finance Corporation
Consolidated Schedule of Investments (Continued)
December 31, 2023
(in thousands, except shares)
| | | | | | | | | | | | | | | | | | | | | | | | | | | | | | | | | | | | | | | | | | | | | | | | | | | | | | | | | | | | | | |
| Portfolio Company, Location and Industry(1) | | Type of
Investment | | Reference | | Spread | | Total Coupon (19) | | Acquisition Date | | Maturity/Expiration
Date | | Principal
Amount,
Par Value
or Shares (17) | | Cost | | Fair Value | | Percent of
Net
Assets |
| Ncontracts, LLC | | | | | | | | | | | | | | | | | | | | |
| Software | | First lien (3)(18) - Undrawn | | — | | — | | — | | 12/2023 | | 12/2025 | | $ | 773 | | | $ | — | | | $ | — | | | |
| | First lien (3)(18) - Undrawn | | — | | — | | — | | 12/2023 | | 12/2029 | | 773 | | | (10) | | | (10) | | | |
| | | | | | | | | | | | | | | | (10) | | | (10) | | | (0.00)% |
| Healthspan Buyer, LLC | | | | | | | | | | | | | | | | | | | | |
| Healthcare | | First lien (3)(15)(18) - Undrawn | | — | | — | | — | | 10/2023 | | 10/2030 | | 1,229 | | | (12) | | | (12) | | | (0.00)% |
| KPSKY Acquisition Inc. | | | | | | | | | | | | | | | | | | | | |
| Business Services | | First lien (3)(15)(18) - Undrawn | | — | | — | | — | | 11/2023 | | 11/2025 | | 1,568 | | | — | | | (16) | | | (0.00)% |
| Specialtycare, Inc. | | | | | | | | | | | | | | | | | | | | |
| Healthcare | | First lien (3)(15)(18) - Undrawn | | — | | — | | — | | 06/2021 | | 06/2026 | | 481 | | | (7) | | | (17) | | | (0.00)% |
| Groundworks, LLC | | | | | | | | | | | | | | | | | | | | |
| Consumer Services | | First lien (4)(15)(18) - Undrawn | | — | | — | | — | | 03/2023 | | 09/2024 | | 891 | | | — | | | (9) | | | |
| | First lien (3)(15)(18) - Undrawn | | — | | — | | — | | 03/2023 | | 03/2029 | | 1,076 | | | (16) | | | (10) | | | |
| | | | | | | | | | | | | | | | (16) | | | (19) | | | (0.00)% |
| FS WhiteWater Holdings, LLC (29) | | | | | | | | | | | | | | | | | | | | |
| FS WhiteWater Borrower, LLC | | | | | | | | | | | | | | | | | | | | |
| Consumer Services | | First lien (3)(15)(18) - Undrawn | | — | | — | | — | | 07/2022 | | 07/2024 | | 1,229 | | | — | | | (10) | | | |
| | First lien (3)(15)(18) - Undrawn | | — | | — | | — | | 12/2021 | | 12/2027 | | 1,085 | | | (11) | | | (17) | | | |
| | | | | | | | | | | | | | | | (11) | | | (27) | | | (0.00)% |
| IMO Investor Holdings, Inc. | | | | | | | | | | | | | | | | | | | | |
| Healthcare | | First lien (3)(15)(18) - Undrawn | | — | | — | | — | | 05/2022 | | 05/2028 | | 1,487 | | | (15) | | | (12) | | | |
| | First lien (3)(15)(18) - Undrawn | | — | | — | | — | | 05/2022 | | 05/2024 | | 1,951 | | | — | | | (16) | | | |
| | | | | | | | | | | | | | | | (15) | | | (28) | | | (0.00)% |
| Diamond Parent Holdings Corp. (27) | | | | | | | | | | | | | | | | | | | | |
| Diligent Corporation | | | | | | | | | | | | | | | | | | | | |
| Software | | First lien (3)(15)(18) - Undrawn | | — | | — | | — | | 03/2021 | | 08/2025 | | 1,667 | | | (8) | | | (33) | | | (0.00)% |
| | | | | | | | | | | | | | | | | | | | |
| | | | | | | | | | | | | | | | | | | | |
The accompanying notes are an integral part of these consolidated financial statements.
109
New Mountain Finance Corporation
Consolidated Schedule of Investments (Continued)
December 31, 2023
(in thousands, except shares)
| | | | | | | | | | | | | | | | | | | | | | | | | | | | | | | | | | | | | | | | | | | | | | | | | | | | | | | | | | | | | | |
| Portfolio Company, Location and Industry(1) | | Type of
Investment | | Reference | | Spread | | Total Coupon (19) | | Acquisition Date | | Maturity/Expiration
Date | | Principal
Amount,
Par Value
or Shares (17) | | Cost | | Fair Value | | Percent of
Net
Assets |
| Community Brands ParentCo, LLC | | | | | | | | | | | | | | | | | | | | |
| Software | | First lien (3)(15)(18) - Undrawn | | — | | — | | — | | 02/2022 | | 02/2028 | | $ | 425 | | | $ | (4) | | | $ | (11) | | | |
| | First lien (3)(15)(18) - Undrawn | | — | | — | | — | | 02/2022 | | 02/2024 | | 849 | | | — | | | (23) | | | |
| | | | | | | | | | | | | | | | (4) | | | (34) | | | (0.00)% |
| Power Grid Holdings, Inc. | | | | | | | | | | | | | | | | | | | | |
| Business Products | | First lien (3)(15)(18) - Undrawn | | — | | — | | — | | 11/2023 | | 12/2030 | | 4,075 | | | (41) | | | (41) | | | (0.00)% |
| DOCS, MSO, LLC | | | | | | | | | | | | | | | | | | | | |
| Healthcare | | First lien (3)(15)(18) - Undrawn | | — | | — | | — | | 06/2022 | | 06/2028 | | 2,405 | | | — | | | (43) | | | (0.00)% |
| TigerConnect, Inc. | | | | | | | | | | | | | | | | | | | | |
| Healthcare | | First lien (2)(15)(18) - Undrawn | | — | | — | | — | | 02/2022 | | 02/2024 | | 885 | | | — | | | (8) | | | |
| | First lien (3)(15)(18) - Undrawn | | — | | — | | — | | 02/2022 | | 02/2028 | | 4,267 | | | (43) | | | (36) | | | |
| | | | | | | | | | | | | | | | (43) | | | (44) | | | (0.00)% |
| Fortis Solutions Group, LLC | | | | | | | | | | | | | | | | | | | | |
| Packaging | | First lien (3)(15)(18) - Undrawn | | — | | — | | — | | 10/2021 | | 10/2027 | | 2,718 | | | (27) | | | (17) | | | |
| | First lien (3)(15)(18) - Undrawn | | — | | — | | — | | 06/2022 | | 06/2024 | | 4,435 | | | — | | | (28) | | | |
| | | | | | | | | | | | | | | | (27) | | | (45) | | | (0.00)% |
| Notorious Topco, LLC | | | | | | | | | | | | | | | | | | | | |
| Consumer Products | | First lien (3)(15)(18) - Undrawn | | — | | — | | — | | 11/2021 | | 05/2027 | | 822 | | | (6) | | | (61) | | | (0.00)% |
| ACI Parent Inc. (28) | | | | | | | | | | | | | | | | | | | | |
| ACI Group Holdings, Inc. | | | | | | | | | | | | | | | | | | | | |
| Healthcare | | First lien (3)(15)(18) - Undrawn | | — | | — | | — | | 08/2021 | | 08/2027 | | 2,001 | | | (20) | | | (48) | | | |
| | First lien (3)(15)(18) - Undrawn | | — | | — | | — | | 08/2021 | | 08/2024 | | 2,909 | | | — | | | (70) | | | |
| | | | | | | | | | | | | | | | (20) | | | (118) | | | (0.01) | % |
| Total Unfunded Debt Investments - United States | | | | | | | | | | | | | | | | $ | (783) | | | $ | (583) | | | (0.01) | % |
| Unfunded Debt Investments - Australia | | | | | | | | | | | | | | | | | | | | |
| Atlas AU Bidco Pty Ltd** | | | | | | | | | | | | | | | | | | | | |
| Business Services | | First lien (3)(15)(18) - Undrawn | | — | | — | | — | | 12/2022 | | 12/2028 | | $ | 320 | | | $ | (5) | | | $ | — | | | — | % |
| Total Unfunded Debt Investments - Australia | | | | | | | | | | | | | | | | $ | (5) | | | $ | — | | | — | % |
| Total Unfunded Debt Investments | | | | | | | | | | | | | | | | $ | (788) | | | $ | (583) | | | (0.01) | % |
| Total Non-Controlled/Non-Affiliated Investments | | | | | | | | | | | | | | | | $ | 2,283,490 | | | $ | 2,209,867 | | | 165.95 | % |
| | | | | | | | | | | | | | | | | | | | |
| | | | | | | | | | | | | | | | | | | | |
The accompanying notes are an integral part of these consolidated financial statements.
110
New Mountain Finance Corporation
Consolidated Schedule of Investments (Continued)
December 31, 2023
(in thousands, except shares)
| | | | | | | | | | | | | | | | | | | | | | | | | | | | | | | | | | | | | | | | | | | | | | | | | | | | | | | | | | | | | | |
| Portfolio Company, Location and Industry(1) | | Type of
Investment | | Reference | | Spread | | Total Coupon (19) | | Acquisition Date | | Maturity/Expiration
Date | | Principal
Amount,
Par Value
or Shares (17) | | Cost | | Fair Value | | Percent of
Net
Assets |
| Non-Controlled/Affiliated Investments (36) | | | | | | | | | | | | | | | | | | | | |
| Funded Debt Investments - United States | | | | | | | | | | | | | | | | | | | | |
| TVG-Edmentum Holdings, LLC (23) | | | | | | | | | | | | | | | | | | | | |
| Edmentum Ultimate Holdings, LLC | | | | | | | | | | | | | | | | | | | | |
| Education | | Subordinated (3)(15) | | SOFR(Q)* | | 7.50% + 4.50%/PIK | | 17.50% | | 12/2020 | | 01/2027 | | $ | 18,635 | | | $ | 18,544 | | | $ | 18,635 | | | 1.40 | % |
| Eagle Infrastructure Super HoldCo, LLC (33) | | | | | | | | | | | | | | | | | | | | |
| Eagle Infrastructure Services, LLC (fka FR Arsenal Holdings II Corp.) | | | | | | | | | | | | | | | | | | | | |
| Business Services | | First lien (2)(15) | | SOFR(Q) | | 7.50% | | 13.00% | | 03/2023 | | 04/2028 | | 10,676 | | | 10,676 | | | 10,676 | | | |
| | First lien (3)(15) | | SOFR(Q) | | 7.50% | | 13.00% | | 03/2023 | | 04/2028 | | 342 | | | 342 | | | 342 | | | |
| | | | | | | | | | | | | | | | 11,018 | | | 11,018 | | | 0.83 | % |
| Permian Holdco 3, Inc. | | | | | | | | | | | | | | | | | | | | |
| Permian Trust | | | | | | | | | | | | | | | | | | | | |
| Energy | | First lien (10)(15) | | FIXED(Q)(34)* | | 10.00%/PIK | | 10.00% | | 03/2021 | | — | | 247 | | | — | | | — | | | |
| | First lien (3)(15) | | SOFR(Q)(34)* | | 10.00%/PIK | | 11.00% | | 07/2020 | | — | | 3,409 | | | — | | | — | | | |
| | | | | | | | | | | | | | | | — | | | — | | | — | % |
| Total Funded Debt Investments - United States | | | | | | | | | | | | | | | | $ | 29,562 | | | $ | 29,653 | | | 2.23 | % |
| Equity - United States | | | | | | | | | | | | | | | | | | | | |
| TVG-Edmentum Holdings, LLC (23) | | | | | | | | | | | | | | | | | | | | |
| Education | | Ordinary shares (3)(15) | | FIXED(Q)* | | 12.00%/PIK | | 12.00% | | 12/2020 | | — | | 48,899 | | | $ | 61,449 | | | $ | 95,151 | | | 7.14 | % |
| Eagle Infrastructure Super HoldCo, LLC | | | | | | | | | | | | | | | | | | | | |
| Business Services | | Ordinary shares (3)(15) | | — | | — | | — | | 03/2023 | | — | | 72,536 | | | 4,102 | | | 6,855 | | | 0.51 | % |
| Sierra Hamilton Holdings Corporation | | | | | | | | | | | | | | | | | | | | |
| Energy | | Ordinary shares (2)(15) | | — | | — | | — | | 07/2017 | | — | | 25,000,000 | | | 11,500 | | | 1,799 | | | |
| | Ordinary shares (3)(15) | | — | | — | | — | | 07/2017 | | — | | 2,786,000 | | | 1,282 | | | 201 | | | |
| | | | | | | | | | | | | | | | 12,782 | | | 2,000 | | | 0.15 | % |
| Total Shares - United States | | | | | | | | | | | | | | | | $ | 78,333 | | | $ | 104,006 | | | 7.80 | % |
| Total Non-Controlled/Affiliated Investments | | | | | | | | | | | | | | | | $ | 107,895 | | | $ | 133,659 | | | 10.03 | % |
| | | | | | | | | | | | | | | | | | | | |
| | | | | | | | | | | | | | | | | | | | |
The accompanying notes are an integral part of these consolidated financial statements.
111
New Mountain Finance Corporation
Consolidated Schedule of Investments (Continued)
December 31, 2023
(in thousands, except shares)
| | | | | | | | | | | | | | | | | | | | | | | | | | | | | | | | | | | | | | | | | | | | | | | | | | | | | | | | | | | | | | |
| Portfolio Company, Location and Industry(1) | | Type of
Investment | | Reference | | Spread | | Total Coupon (19) | | Acquisition Date | | Maturity/Expiration
Date | | Principal
Amount,
Par Value
or Shares (17) | | Cost | | Fair Value | | Percent of
Net
Assets |
| Controlled Investments (37) | | | | | | | | | | | | | | | | | | | | |
| Funded Debt Investments - United States | | | | | | | | | | | | | | | | | | | | |
| New Benevis Topco, LLC (25) | | | | | | | | | | | | | | | | | | | | |
| New Benevis Holdco, Inc. | | | | | | | | | | | | | | | | | | | | |
| Healthcare | | First lien (2)(15) | | SOFR(Q)* | | 9.50%/PIK | | 14.96% | | 10/2020 | | 04/2026 | | $ | 41,731 | | | $ | 41731 | | | $ | 41,731 | | | |
| | First lien (3)(15) | | SOFR(Q)* | | 9.50%/PIK | | 14.96% | | 10/2020 | | 04/2026 | | 19,798 | | | 19,798 | | | 19,798 | | | |
| | First lien (8)(15) | | SOFR(Q)* | | 9.50%/PIK | | 14.96% | | 10/2020 | | 04/2026 | | 10,239 | | | 10,239 | | | 10,239 | | | |
| | Subordinated (3)(15) | | FIXED(M)* | | 12.00%/PIK | | 12.00% | | 10/2020 | | 10/2026 | | 21,092 | | | 19,801 | | | 16,874 | | | |
| | | | | | | | | | | | | | | | 91,569 | | | 88,642 | | | 6.66 | % |
| New Permian Holdco, Inc. | | | | | | | | | | | | | | | | | | | | |
| New Permian Holdco, L.L.C. | | | | | | | | | | | | | | | | | | | | |
| Energy | | First lien (3)(15) | | SOFR(Q) | | 9.00% | | 14.61% | | 10/2020 | | 12/2024 | | 23,336 | | | 23,336 | | | 23,335 | | | |
| | First lien (3)(15)(18) - Drawn | | SOFR(Q) | | 6.00% | | 11.61% | | 10/2020 | | 12/2024 | | 13,835 | | | 13,835 | | | 13,835 | | | |
| | | | | | | | | | | | | | | | 37,171 | | | 37,170 | | | 2.79 | % |
| UniTek Global Services, Inc. | | | | | | | | | | | | | | | | | | | | |
| Business Services | | Second lien (3)(15) | | FIXED(Q)* | | 15.00%/PIK | | 15.00% | | 12/2020 | | 02/2025 | | 13,438 | | | 13,438 | | | 12,893 | | | |
| | Second lien (3)(15) | | FIXED(Q)* | | 15.00%/PIK | | 15.00% | | 07/2022 | | 02/2025 | | 5,957 | | | 5,957 | | | 5,713 | | | |
| | | | | | | | | | | | | | | | 19,395 | | | 18,606 | | | 1.40 | % |
| NHME Holdings Corp. (24) | | | | | | | | | | | | | | | | | | | | |
| National HME, Inc. | | | | | | | | | | | | | | | | | | | | |
| Healthcare | | Second lien (3)(15) | | SOFR(Q)(34)* | | 5.00%/PIK | | 10.66% | | 11/2018 | | 11/2025 | | 8,281 | | | 7,872 | | | 3,000 | | | 0.23 | % |
| Total Funded Debt Investments - United States | | | | | | | | | | | | | | | | $ | 156,007 | | | $ | 147,418 | | | 11.08 | % |
| Equity - United States | | | | | | | | | | | | | | | | | | | | |
| NMFC Senior Loan Program III LLC** | | | | | | | | | | | | | | | | | | | | |
| Investment Fund | | Membership interest (3)(15) | | — | | — | | — | | 05/2018 | | — | | — | | | $ | 140,000 | | | $ | 140,000 | | | 10.51 | % |
| NMFC Senior Loan Program IV LLC** | | | | | | | | | | | | | | | | | | | | |
| Investment Fund | | Membership interest (3)(15) | | — | | — | | — | | 05/2021 | | — | | — | | | 112,400 | | | 112,400 | | | 8.44 | % |
| NM NL Holdings, L.P.** | | | | | | | | | | | | | | | | | | | | |
| Net Lease | | Membership interest (7)(15) | | — | | — | | — | | 06/2018 | | — | | — | | | 76,371 | | | 96,071 | | | 7.21 | % |
| New Benevis Topco, LLC (25) | | | | | | | | | | | | | | | | | | | | |
| Healthcare | | Ordinary shares (2)(15) | | — | | — | | — | | 10/2020 | | — | | 325,516 | | | 27,154 | | | 31,838 | | | |
| | Ordinary shares (8)(15) | | — | | — | | — | | 10/2020 | | — | | 79,867 | | | 6,662 | | | 7,812 | | | |
| | Ordinary shares (3)(15) | | — | | — | | — | | 10/2020 | | — | | 72,681 | | | 6,108 | | | 7,109 | | | |
| | | | | | | | | | | | | | | | 39,924 | | | 46,759 | | | 3.51 | % |
| | | | | | | | | | | | | | | | | | | | |
| | | | | | | | | | | | | | | | | | | | |
The accompanying notes are an integral part of these consolidated financial statements.
112
New Mountain Finance Corporation
Consolidated Schedule of Investments (Continued)
December 31, 2023
(in thousands, except shares)
| | | | | | | | | | | | | | | | | | | | | | | | | | | | | | | | | | | | | | | | | | | | | | | | | | | | | | | | | | | | | | |
| Portfolio Company, Location and Industry(1) | | Type of
Investment | | Reference | | Spread | | Total Coupon (19) | | Acquisition Date | | Maturity/Expiration
Date | | Principal
Amount,
Par Value
or Shares (17) | | Cost | | Fair Value | | Percent of
Net
Assets |
| UniTek Global Services, Inc. | | | | | | | | | | | | | | | | | | | | |
| Business Services | | Preferred shares (3)(15) | | FIXED(Q)* | | 20.00%/PIK | | 20.00% | | 08/2018 | | — | | 18,760,261 | | | $ | 18,760 | | | $ | 16,348 | | | |
| | Preferred shares (3)(15) | | FIXED(Q)* | | 20.00%/PIK | | 20.00% | | 08/2019 | | — | | 11,150,103 | | | 11,150 | | | 10,119 | | | |
| | Preferred shares (3)(15)(34) | | FIXED(Q)(34)* | | 19.00%/PIK | | 19.00% | | 06/2017 | | — | | 19,795,435 | | | 19,795 | | | 4,210 | | | |
| | Preferred shares (2)(15)(34) | | FIXED(Q)(34)* | | 13.50%/PIK | | 13.50% | | 01/2015 | | — | | 29,326,545 | | | 26,946 | | | — | | | |
| | Preferred shares (3)(15)(34) | | FIXED(Q)(34)* | | 13.50%/PIK | | 13.50% | | 01/2015 | | — | | 8,104,462 | | | 7,447 | | | — | | | |
| | Ordinary shares (2)(15) | | — | | — | | — | | 01/2015 | | — | | 2,096,477 | | | 1,925 | | | — | | | |
| | Ordinary shares (3)(15) | | — | | — | | — | | 01/2015 | | — | | 1,993,749 | | | 532 | | | — | | | |
| | | | | | | | | | | | | | | | 86,555 | | | 30,677 | | | 2.30 | % |
| New Permian Holdco, Inc. | | | | | | | | | | | | | | | | | | | | |
| Energy | | Ordinary shares (3)(15) | | — | | — | | — | | 10/2020 | | — | | 100 | | | 11,155 | | | 26,000 | | | 1.95 | % |
| NM CLFX LP | | | | | | | | | | | | | | | | | | | | |
| Net Lease | | Membership interest (7)(15) | | — | | — | | — | | 10/2017 | | — | | — | | | 12,278 | | | 11,731 | | | 0.88 | % |
| NM YI, LLC | | | | | | | | | | | | | | | | | | | | |
| Net Lease | | Membership interest (7)(15) | | — | | — | | — | | 09/2019 | | — | | — | | | 6,272 | | | 9,550 | | | 0.72 | % |
| QID TRH Holdings LLC (20) | | | | | | | | | | | | | | | | | | | | |
| Haven Midstream Holdings LLC(20) | | | | | | | | | | | | | | | | | | | | |
| Specialty Chemicals & Materials | | Ordinary shares (14)(15) | | — | | — | | — | | 10/2021 | | — | | 80 | | | — | | | 3,323 | | | |
| | Profit Interest (6)(15) | | — | | — | | — | | 10/2021 | | — | | 5 | | | — | | | 96 | | | |
| | | | | | | | | | | | | | | | — | | | 3,419 | | | 0.26 | % |
| NM GP Holdco, LLC** | | | | | | | | | | | | | | | | | | | | |
| Net Lease | | Membership interest (7)(15) | | — | | — | | — | | 06/2018 | | — | | — | | | 861 | | | 1,048 | | | 0.08 | % |
| NHME Holdings Corp.(24) | | | | | | | | | | | | | | | | | | | | |
| Healthcare | | Ordinary shares (3)(15) | | — | | — | | — | | 11/2018 | | — | | 640,000 | | | 4,000 | | | — | | | — | % |
| Total Shares - United States | | | | | | | | | | | | | | | | $ | 489,816 | | | $ | 477,655 | | | 35.86 | % |
| Equity - Canada | | | | | | | | | | | | | | | | | | | | |
| NM APP Canada Corp.** | | | | | | | | | | | | | | | | | | | | |
| Net Lease | | Membership interest (7)(15) | | — | | — | | — | | 09/2016 | | — | | — | | | $ | — | | | $ | 7 | | | — | % |
| Total Shares - Canada | | | | | | | | | | | | | | | | $ | — | | | $ | 7 | | | — | % |
| Total Shares | | | | | | | | | | | | | | | | $ | 489,816 | | | $ | 477,662 | | | 35.86 | % |
| Warrants - United States | | | | | | | | | | | | | | | | | | | | |
| UniTek Global Services, Inc. | | | | | | | | | | | | | | | | | | | | |
| Business Services | | Warrants (3)(15) | | — | | — | | — | | 12/2020 | | 02/2025 | | 13,339 | | | $ | — | | | $ | 42,716 | | | 3.21 | % |
| NHME Holdings Corp. (24) | | | | | | | | | | | | | | | | | | | | |
| Healthcare | | Warrants (3)(15) | | — | | — | | — | | 11/2018 | | — | | 160,000 | | | 1,000 | | | — | | | — | % |
| Total Warrants - United States | | | | | | | | | | | | | | | | $ | 1,000 | | | $ | 42,716 | | | 3.21 | % |
| Total Funded Investments | | | | | | | | | | | | | | | | $ | 646,823 | | | $ | 667,796 | | | 50.15 | % |
| | | | | | | | | | | | | | | | | | | | |
| | | | | | | | | | | | | | | | | | | | |
The accompanying notes are an integral part of these consolidated financial statements.
113
New Mountain Finance Corporation
Consolidated Schedule of Investments (Continued)
December 31, 2023
(in thousands, except shares)
| | | | | | | | | | | | | | | | | | | | | | | | | | | | | | | | | | | | | | | | | | | | | | | | | | | | | | | | | | | | | | |
| Portfolio Company, Location and Industry(1) | | Type of
Investment | | Reference | | Spread | | Total Coupon (19) | | Acquisition Date | | Maturity/Expiration
Date | | Principal
Amount,
Par Value
or Shares (17) | | Cost | | Fair Value | | Percent of
Net
Assets |
| Unfunded Debt Investments - United States | | | | | | | | | | | | | | | | | | | | |
| New Permian Holdco, Inc. | | | | | | | | | | | | | | | | | | | | |
| New Permian Holdco, L.L.C. | | | | | | | | | | | | | | | | | | | | |
| Energy | | First lien (3)(15)(18) - Undrawn | | — | | — | | — | | 10/2020 | | 12/2024 | | $ | 8,060 | | | $ | — | | | $ | — | | | — | % |
| Haven Midstream Holdings LLC (20) | | | | | | | | | | | | | | | | | | | | |
| Haven Midstream LLC | | | | | | | | | | | | | | | | | | | | |
| Specialty Chemicals & Materials | | First lien (3)(15)(18) - Undrawn | | — | | — | | — | | 12/2021 | | 10/2026 | | 8,000 | | | — | | | — | | | — | % |
| Total Unfunded Debt Investments - United States | | | | | | | | | | | | | | | | $ | — | | | $ | — | | | — | % |
| Total Controlled Investments | | | | | | | | | | | | | | | | $ | 646,823 | | | $ | 667,796 | | | 50.15 | % |
| Total Investments | | | | | | | | | | | | | | | | $ | 3,038,208 | | | $ | 3,011,322 | | | 226.13 | % |
| | | | | | | | | | | | | | | | | | | | |
(1)New Mountain Finance Corporation (the "Company") generally acquires its investments in private transactions exempt from registration under the Securities Act of 1933, as amended (the "Securities Act"). These investments are generally subject to certain limitations on resale, and may be deemed to be "restricted securities" under the Securities Act.
(2)Investment is pledged as collateral for the Holdings Credit Facility, a revolving credit facility among the Company, as the Collateral Manager, New Mountain Finance Holdings, L.L.C. ("NMF Holdings") as the Borrower, Wells Fargo Securities, LLC, as the Administrative Agent and Wells Fargo Bank, National Association, as the Lender and Collateral Custodian. See Note 7. Borrowings, for details.
(3)Investment is pledged as collateral for the NMFC Credit Facility, a revolving credit facility among the Company as the Borrower and Goldman Sachs Bank USA as the Administrative Agent and the Collateral Agent and Goldman Sachs Bank USA, Morgan Stanley Bank, N.A., Stifel Bank & Trust and MUFG Union Bank, N.A. as Lenders. See Note 7. Borrowings, for details.
(4)Investment is held by New Mountain Finance SBIC, L.P.
(5)Investment is held by New Mountain Finance SBIC II, L.P.
(6)Investment is held by NMF QID NGL Holdings, Inc.
(7)Investment is held by New Mountain Net Lease Corporation.
(8)Investment is pledged as collateral for the DB Credit Facility, a revolving credit facility among New Mountain Finance DB, L.L.C. as the Borrower and Deutsche Bank AG, New York Branch as the Facility Agent. See Note 7. Borrowings, for details.
(9)Investment is held by NMF Ancora Holdings, Inc.
(10)Investment is held by NMF Permian Holdings, LLC.
(11)Investment is held by NMF HB, Inc.
(12)Investment is held by NMF OEC, Inc.
(13)Investment is held by NMF Pioneer, Inc.
(14)Investment is held by NMF TRM, LLC.
(15)The fair value of the Company's investment is determined using unobservable inputs that are significant to the overall fair value measurement. See Note 4. Fair Value, for details.
(16)Investment is denominated in foreign currency and is translated into U.S. dollars as of the valuation date. As of December 31, 2023, the par value U.S. dollar equivalent of the first lien term loan, and drawn first lien term loan is $16,600 and $14,457, respectively. See Note 2. Summary of Significant Accounting Policies, for details.
(17)Par amount is denominated in United States Dollar unless otherwise noted, which may include British Pound ("£") and/or Euro ("€").
(18)Par value amounts represent the drawn or undrawn (as indicated in type of investment) portion of revolving credit facilities or delayed draws. Cost amounts represent the cash received at settlement date net of the impact of paydowns and cash paid for drawn revolvers or delayed draws.
The accompanying notes are an integral part of these consolidated financial statements.
114
New Mountain Finance Corporation
Consolidated Schedule of Investments (Continued)
December 31, 2023
(in thousands, except shares)
(19)Total Coupon is payable in cash unless otherwise indicated. A majority of the variable rate debt investments bear interest and dividends at a rate that may be determined by reference to the London Interbank Offered Rate (L), the Prime Rate (P), the Sterling Overnight Interbank Average Rate (SONIA), Secured Overnight Financing Rate (SOFR) and Euro Interbank Offered Rate (EURIBOR) and which resets daily (D), weekly (W), monthly (M), quarterly (Q), semi-annually (S) or annually (A). For each investment the current coupon rate provided reflects the rate in effect as of December 31, 2023.
(20)The Company holds investments in multiple entities of Haven Midstream Holdings LLC. The Company holds 4.6% of the Class B profits interest in QID NGL, LLC (which at closing represented 97.0% of the ownership in the class B units in QID TRH Holdings, LLC), class A common units of Haven Midstream Holdings LLC, and holds a first lien revolver in Haven Midstream LLC.
(21)The Company holds preferred equity in OEC Holdco, LLC, and two second lien term loans in OEConnection LLC, a wholly-owned subsidiary of OEC Holdco, LLC. The preferred equity is entitled to receive preferential dividends of 11.0% per annum.
(22)The Company holds investments in two wholly-owned subsidiaries of Appriss Health Holdings, Inc. The company holds a first lien term loan and a first lien revolver in Appriss Health, LLC, and preferred equity in Appriss Health Intermediate Holdings, Inc. The preferred equity is entitled to receive preferential dividends at a rate of 11.0% per annum.
(23)The Company holds ordinary shares in TVG-Edmentum Holdings, LLC, and subordinated notes in Edmentum Ultimate Holdings, LLC, a wholly-owned subsidiary of TVG-Edmentum Holdings, LLC. The ordinary shares are entitled to receive cumulative preferential dividends at a rate of 12.0% per annum.
(24)The Company holds ordinary shares and warrants in NHME Holdings Corp., as well as a second lien Tranche A Term Loan in National HME, Inc., a wholly-owned subsidiary of NHME Holdings Corp. The second lien Tranche A Term Loan is entitled to receive 20% of the interest earned on the first lien Tranche A Term Loan, which accrues interest at a rate of SOFR + 5.00%, and 20% of the interest earned on the first lien Tranche B Term Loan, which accrues interest at a rate of SOFR + 6.00%.
(25)The Company holds ordinary shares in New Benevis Topco, LLC, and holds first lien last out term loans and subordinated notes in New Benevis Holdco Inc., a wholly-owned subsidiary of New Benevis Topco, LLC.
(26)The Company holds ordinary shares in AAC Lender Holdings, LLC and two first lien term loans, a first lien revolver and subordinated notes in American Achievement Corporation, a partially-owned subsidiary of AAC Lender Holdings, LLC.
(27)The Company holds investments in two wholly-owned subsidiary of Diamond Parent Holdings Corp. The Company holds three first lien term loans and a first lien revolver in Diligent Corporation and preferred equity in Diligent Preferred Issuer Inc. The preferred equity in Diligent Preferred Issuer Inc. is entitled to receive cumulative preferential dividends at a rate 10.5% per annum.
(28)The Company holds investments in ACI Parent Inc. and a wholly-owned subsidiary of ACI Parent Inc. The Company holds a first lien term loan, two first lien delayed draws and a first lien revolver in ACI Group Holdings, Inc. and preferred equity in ACI Parent Inc. The preferred equity in ACI Parent Inc. is entitled to receive cumulative preferential dividends at a rate of 11.75% per annum.
(29)The Company holds ordinary shares in FS WhiteWater Holdings, LLC, and a first lien term loan, a first lien revolver, and three first lien delayed draws in FS WhiteWater Borrower, LLC, a partially-owned subsidiary of FS WhiteWater Holdings, LLC.
(30)The Company holds ordinary shares in Pioneer Topco I, L.P., and two first lien term loans and a first lien revolver in Pioneer Buyer I, LLC, a wholly-owned subsidiary of Pioneer Topco I, L.P.
(31)The Company holds ordinary shares in OA Topco, L.P., and two first lien term loans and a first lien revolver in OA Buyer, Inc., a wholly-owned subsidiary of OA Topco, L.P.
(32)The Company holds preferred equity in Knockout Intermediate Holdings I Inc. and a first lien term loan, a first lien revolver and a first lien delayed draw in Kaseya, Inc., a wholly-owned subsidiary of Knockout Intermediate Holdings I Inc. The preferred equity is entitled to received cumulative preferential dividends at a rate of 11.75% per annum.
(33)The Company holds ordinary shares in Eagle Infrastructure Super HoldCo, LLC and a first lien term loan in Eagle Infrastructure Services, LLC (fka FR Arsenal Holdings II Corp.), a wholly-owned subsidiary of Eagle Infrastructure Super Holdco, LLC.
(34)Investment is on non-accrual status. See Note 3. Investments, for details.
(35)The Company holds one security purchased under a collateralized agreement to resell on its Consolidated Statement of Assets and Liabilities with a cost basis of $30,000 and a fair value of $16,500 as of December 31, 2023. See Note 2. Summary of Significant Accounting Policies, for details.
The accompanying notes are an integral part of these consolidated financial statements.
115
New Mountain Finance Corporation
Consolidated Schedule of Investments (Continued)
December 31, 2023
(in thousands, except shares)
(36)Denotes investments in which the Company is an “Affiliated Person”, as defined in the Investment Company Act of 1940, as amended (the "1940 Act"), due to owning or holding the power to vote 5.0% or more of the outstanding voting securities of the investment but not controlling the company. Fair value as of December 31, 2023 and December 31, 2022 along with transactions during the year ended December 31, 2023 in which the issuer was a non-controlled/affiliated investment is as follows:
| | | | | | | | | | | | | | | | | | | | | | | | | | | | | | | | | | | | | | | | | | | | | | | | | | | | | | | | | | |
| Portfolio Company | | Fair Value at December 31, 2022 | | Gross
Additions (A) | | Gross
Redemptions
(B) | | Net Change In Unrealized Appreciation (Depreciation) | | Fair Value at December 31, 2023 | | Net Realized Gains (Losses) | | Interest
Income | | Dividend
Income | | Other
Income | | |
| Eagle Infrastructure Services, LLC (fka FR Arsenal Holdings II Corp.) / Eagle Infrastructure Super HoldCo, LLC | | $ | — | | | $ | 15,581 | | | $ | (459) | | | $ | 2,751 | | | $ | 17,873 | | | $ | — | | | $ | 1,084 | | | $ | — | | | $ | — | | | |
| Sierra Hamilton Holdings Corporation | | 4,000 | | | 2 | | | (7) | | | (1,995) | | | 2,000 | | | — | | | 2 | | | — | | | 1 | | | |
| TVG-Edmentum Holdings, LLC / Edmentum Ultimate Holdings, LLC | | 126,787 | | | 6,807 | | | — | | | (19,808) | | | 113,786 | | | — | | | 3,048 | | | 4,625 | | | 250 | | | |
| Total Non-Controlled/Affiliated Investments | | $ | 130,787 | | | $ | 22,390 | | | $ | (466) | | | $ | (19,052) | | | $ | 133,659 | | | $ | — | | | $ | 4,134 | | | $ | 4,625 | | | $ | 251 | | | |
(A)Gross additions include increases in the cost basis of investments resulting from new portfolio investments, payment-in-kind (“PIK”) interest or dividends, the amortization of discounts, reorganizations or restructurings and the movement of an existing portfolio company into this category from a different category.
(B)Gross reductions include decreases in the cost basis of investments resulting from principal collections related to investment repayments or sales, reorganizations or restructurings and the movement of an existing portfolio company out of this category into a different category.
(37) Denotes investments in which the Company is in “Control”, as defined in the 1940 Act, due to owning or holding the power to vote more than 25.0% of the outstanding voting securities of the investment. Fair value as of December 31, 2023 and December 31, 2022 along with transactions during the year ended December 31, 2023 in which the issuer was a controlled investment, is as follows:
| | | | | | | | | | | | | | | | | | | | | | | | | | | | | | | | | | | | | | | | | | | | | | | | | | | | | | | | |
| Portfolio Company | | Fair Value at December 31, 2022 | | Gross
Additions
(A) | | Gross
Redemptions
(B) | | Net Change In
Unrealized
Appreciation
(Depreciation) | | Fair Value at December 31, 2023 | | Net Realized Gains (Losses) | | Interest
Income | | Dividend
Income | | Other
Income |
| Haven Midstream LLC / Haven Midstream Holdings LLC / QID TRH Holdings LLC | | $ | 35,788 | | | $ | — | | | $ | — | | | $ | (32,369) | | | $ | 3,419 | | | $ | 33,815 | | | $ | — | | | $ | — | | | $ | 2,041 | |
| National HME, Inc./NHME Holdings Corp. | | 5,381 | | | — | | | (17,404) | | | 15,023 | | | 3,000 | | | (17,404) | | | — | | | — | | | — | |
| New Benevis Topco, LLC / New Benevis Holdco, Inc. | | 114,146 | | | 26,153 | | | — | | | (4,898) | | | 135,401 | | | — | | | 11,632 | | | — | | | 1,500 | |
| New Permian Holdco, Inc. / New Permian Holdco, L.L.C. | | 57,564 | | | 5,606 | | | — | | | — | | | 63,170 | | | — | | | 5,197 | | | — | | | 506 | |
| NM APP CANADA CORP | | — | | | — | | | — | | | 7 | | | 7 | | | — | | | — | | | — | | | — | |
| | | | | | | | | | | | | | | | | | |
| NM CLFX LP | | 16,172 | | | — | | | (259) | | | (4,182) | | | 11,731 | | | — | | | — | | | 1,252 | | | — | |
| | | | | | | | | | | | | | | | | | |
| | | | | | | | | | | | | | | | | | |
| | | | | | | | | | | | | | | | | | |
| | | | | | | | | | | | | | | | | | |
| NM NL Holdings, L.P. | | 94,305 | | | — | | | — | | | 1,766 | | | 96,071 | | | — | | | — | | | 8,191 | | | — | |
| NM GP Holdco, LLC | | 1,028 | | | — | | | — | | | 20 | | | 1,048 | | | — | | | — | | | 88 | | | — | |
| NM YI LLC | | 9,481 | | | — | | | — | | | 69 | | | 9,550 | | | — | | | — | | | 853 | | | — | |
| NMFC Senior Loan Program III LLC | | 140,000 | | | — | | | — | | | — | | | 140,000 | | | — | | | — | | | 20,038 | | | — | |
| NMFC Senior Loan Program IV LLC | | 112,400 | | | — | | | — | | | — | | | 112,400 | | | — | | | — | | | 15,483 | | | — | |
| | | | | | | | | | | | | | | | | | |
| UniTek Global Services, Inc. | | 103,770 | | | 8,699 | | | (26,446) | | | 5,976 | | | 91,999 | | | 2 | | | 4,000 | | | 5,303 | | | 1,268 | |
| Total Controlled Investments | | $ | 690,035 | | | $ | 40,458 | | | $ | (44,109) | | | $ | (18,588) | | | $ | 667,796 | | | $ | 16,413 | | | $ | 20,829 | | | $ | 51,208 | | | $ | 5,315 | |
(A)Gross additions include increases in the cost basis of investments resulting from new portfolio investments, PIK interest or dividends, the amortization of discounts, reorganizations or restructurings and the movement of an existing portfolio company into this category from a different category.
(B)Gross redemptions include decreases in the cost basis of investments resulting from principal collections related to investment repayments or sales, reorganizations or restructurings and the movement of an existing portfolio company out of this category into a different category.
* All or a portion of interest contains PIK interest.
** Indicates assets that the Company deems to be “non-qualifying assets” under Section 55(a) of the 1940 Act. Qualifying assets must represent at least 70.0% of the Company’s total assets at the time of acquisition of any additional non-qualifying assets. As of December 31, 2023, 14.8% of the Company’s total assets are represented by investments at fair value that are considered non-qualifying assets.
The accompanying notes are an integral part of these consolidated financial statements.
116
New Mountain Finance Corporation
Consolidated Schedule of Investments (Continued)
December 31, 2023
| | | | | |
| | December 31, 2023 |
| Investment Type | Percent of Total
Investments at Fair Value |
| First lien | 55.92 | % |
| Second lien | 14.10 | % |
| Subordinated | 3.02 | % |
| Equity and other | 26.96 | % |
| Total investments | 100.00 | % |
| | | | | |
| | December 31, 2023 |
| Industry Type | Percent of Total
Investments at Fair Value |
| Software | 26.89 | % |
| Business Services | 17.93 | % |
| Healthcare | 15.87 | % |
| Investment Funds (includes investments in joint ventures) | 8.38 | % |
| Education | 7.03 | % |
| Consumer Services | 6.39 | % |
| Net Lease | 3.93 | % |
| Distribution & Logistics | 3.68 | % |
| Financial Services | 3.49 | % |
| Energy | 2.16 | % |
| Packaging | 1.20 | % |
| Specialty Chemicals & Materials | 0.94 | % |
| Business Products | 0.75 | % |
| Food & Beverage | 0.73 | % |
| Consumer Products | 0.63 | % |
| Total investments | 100.00 | % |
| | | | | |
| | December 31, 2023 |
| Interest Rate Type | Percent of Total
Investments at Fair Value |
| Floating rates | 88.76 | % |
| Fixed rates | 11.24 | % |
| Total investments | 100.00 | % |
The accompanying notes are an integral part of these consolidated financial statements.
117
New Mountain Finance Corporation
Consolidated Schedule of Investments
December 31, 2022
(in thousands, except shares)
| | | | | | | | | | | | | | | | | | | | | | | | | | | | | | | | | | | | | | | | | | | | | | | | | | | | | | | | | | | | | | |
| Portfolio Company, Location and Industry(1) | | Type of
Investment | | Reference | | Spread | | Interest Rate (19) | | Acquisition Date | | Maturity/Expiration
Date | | Principal
Amount,
Par Value
or Shares (17) | | Cost | | Fair Value | | Percent of
Net
Assets |
| Non-Controlled/Non-Affiliated Investments | | | | | | | | | | | | | | | | | | | | |
| Funded Debt Investments - United States | | | | | | | | | | | | | | | | | | | | |
| GS Acquisitionco, Inc. | | | | | | | | | | | | | | | | | | | | |
| Software | | First lien (2)(15) | | L(Q) | | 5.75% | | 9.92 | % | | 08/2019 | | 05/2026 | | $ | 67,275 | | | $ | 67,074 | | | $ | 66,675 | | | |
| | First lien (5)(15) | | L(Q) | | 5.75% | | 9.92 | % | | 08/2019 | | 05/2026 | | 21,745 | | | 21,683 | | | 21,551 | | | |
| | | | | | | | | | | | | | | | 88,757 | | | 88,226 | | | 6.65 | % |
| PhyNet Dermatology LLC | | | | | | | | | | | | | | | | | | | | |
| Healthcare | | First lien (2)(15) | | SOFR(S) | | 6.25% | | 10.80 | % | | 09/2018 | | 08/2024 | | 49,270 | | 49,116 | | 49,270 | | |
| | First lien (2)(15) | | SOFR(S) | | 6.25% | | 10.80 | % | | 09/2018 | | 08/2024 | | 18,726 | | 18,663 | | | 18,726 | | | |
| | | | | | | | | | | | | | | | 67,779 | | | 67,996 | | | 5.13 | % |
| Associations, Inc. | | | | | | | | | | | | | | | | | | | | |
| Business Services | | First lien (2)(15) | | SOFR(Q)* | | 4.00% + 2.50%/PIK | | 10.36 | % | | 07/2021 | | 07/2027 | | 35,786 | | | 35,657 | | 35,786 | | |
| | First lien (8)(15) | | SOFR(Q)* | | 4.00% + 2.50%/PIK | | 11.26 | % | | 07/2021 | | 07/2027 | | 8,810 | | | 8,774 | | | 8,810 | | | |
| | First lien (2)(15) | | SOFR(Q)* | | 4.00% + 2.50%/PIK | | 11.29 | % | | 07/2021 | | 07/2027 | | 8,810 | | | 8,773 | | | 8,810 | | | |
| | First lien (8)(15) | | SOFR(Q)* | | 4.00% + 2.50%/PIK | | 10.97 | % | | 07/2021 | | 07/2027 | | 5,321 | | | 5,300 | | | 5,321 | | | |
| | First lien (8)(15) | | SOFR(Q)* | | 4.00% + 2.50%/PIK | | 10.36 | % | | 07/2021 | | 07/2027 | | 4,233 | | | 4,217 | | | 4,233 | | | |
| | | | | | | | | | | | | | | | 62,721 | | | 62,960 | | | 4.75 | % |
| Paw Midco, Inc. | | | | | | | | | | | | | | | | | | | | |
| AAH Topco, LLC | | | | | | | | | | | | | | | | | | | | |
| Consumer Services | | First lien (8)(15) | | L(M) | | 5.50% | | 9.89 | % | | 12/2021 | | 12/2027 | | 20,634 | | | 20,457 | | | 20,378 | | | |
| | First lien (3)(15)(18) - Drawn | | L(M) | | 5.50% | | 9.82 | % | | 12/2021 | | 12/2027 | | 12,357 | | | 12,369 | | | 12,204 | | | |
| | First lien (4)(15) | | L(M) | | 5.50% | | 9.89 | % | | 01/2022 | | 12/2027 | | 9,797 | | | 9,713 | | | 9,676 | | | |
| | First lien (4)(15)(18) - Drawn | | L(M) | | 5.50% | | 9.82 | % | | 12/2021 | | 12/2027 | | 4,009 | | | 4,013 | | | 3,959 | | | |
| | Subordinated (3)(15) | | FIXED(Q)* | | 11.50%/PIK | | 11.50 | % | | 12/2021 | | 12/2031 | | 12,494 | | | 12,337 | | | 11,908 | | | |
| | Subordinated (4)(15) | | FIXED(Q)* | | 11.50%/PIK | | 11.50 | % | | 01/2022 | | 12/2031 | | 4,900 | | | 4,838 | | | 4,670 | | | |
| | | | | | | | | | | | | | | | 63,727 | | | 62,795 | | | 4.73 | % |
| GC Waves Holdings, Inc. | | | | | | | | | | | | | | | | | | | | |
| Financial Services | | First lien (5)(15) | | L(M) | | 5.50% | | 9.88 | % | | 08/2021 | | 08/2026 | | 21,885 | | | 21,793 | | | 21,623 | | | |
| | First lien (2)(15)(18) - Drawn | | L(M) | | 5.50% | | 9.88 | % | | 04/2022 | | 08/2026 | | 16,611 | | | 16,450 | | | 16,411 | | | |
| | First lien (2)(15) | | L(M) | | 5.50% | | 9.88 | % | | 08/2021 | | 08/2026 | | 13,211 | | | 13,135 | | | 13,052 | | | |
| | First lien (2)(15) | | L(M) | | 5.50% | | 9.88 | % | | 08/2021 | | 08/2026 | | 10,551 | | | 10,465 | | | 10,424 | | | |
| | First lien (3)(15)(18) - Drawn | | L(M) | | 5.50% | | 9.88 | % | | 10/2019 | | 08/2026 | | 988 | | | 980 | | | 976 | | | |
| | | | | | | | | | | | | | | | 62,823 | | | 62,486 | | | 4.71 | % |
| | | | | | | | | | | | | | | | | | | | |
| | | | | | | | | | | | | | | | | | | | |
The accompanying notes are an integral part of these consolidated financial statements.
118
New Mountain Finance Corporation
Consolidated Schedule of Investments (Continued)
December 31, 2022
(in thousands, except shares)
| | | | | | | | | | | | | | | | | | | | | | | | | | | | | | | | | | | | | | | | | | | | | | | | | | | | | | | | | | | | | | |
| Portfolio Company, Location and Industry(1) | | Type of
Investment | | Reference | | Spread | | Interest Rate (19) | | Acquisition Date | | Maturity/Expiration
Date | | Principal
Amount,
Par Value
or Shares (17) | | Cost | | Fair Value | | Percent of
Net
Assets |
| Knockout Intermediate Holdings I Inc. (41) | | | | | | | | | | | | | | | | | | | | |
| Kaseya Inc. | | | | | | | | | | | | | | | | | | | | |
| Software | | First lien (2)(15) | | SOFR(Q) | | 5.75% | | 10.33% | | 06/2022 | | 06/2029 | | $ | 63,093 | | | $ | 62,647 | | | $ | 62,172 | | | 4.69 | % |
| iCIMS, Inc. | | | | | | | | | | | | | | | | | | | | |
| Software | | First lien (8)(15) | | SOFR(Q)* | | 3.38% + 3.88%/PIK | | 11.52% | | 08/2022 | | 08/2028 | | 44,287 | | | 43,917 | | | 43,901 | | | |
| | First lien (2)(15) | | SOFR(Q) | | 7.25% | | 11.52% | | 10/2022 | | 08/2028 | | 7,366 | | | 7,303 | | | 7,311 | | | |
| | | | | | | | | | | | | | | | 51,220 | | | 51,212 | | | 3.86 | % |
| CentralSquare Technologies, LLC | | | | | | | | | | | | | | | | | | | | |
| Software | | Second lien (3) | | L(Q) | | 7.50% | | 12.23% | | 08/2018 | | 08/2026 | | 47,838 | | | 47,505 | | | 40,941 | | | |
| | Second lien (8) | | L(Q) | | 7.50% | | 12.23% | | 08/2018 | | 08/2026 | | 7,500 | | | 7,448 | | | 6,419 | | | |
| | | | | | | | | | | | | | | | 54,953 | | | 47,360 | | | 3.57 | % |
| IG Intermediateco LLC | | | | | | | | | | | | | | | | | | | | |
| Infogain Corporation | | | | | | | | | | | | | | | | | | | | |
| Business Services | | First lien (2)(15) | | SOFR(M) | | 5.75% | | 10.17% | | 07/2021 | | 07/2028 | | 18,898 | | | 18,780 | | | 18,545 | | | |
| | First lien (8)(15) | | SOFR(M) | | 5.75% | | 10.17% | | 07/2022 | | 07/2028 | | 7,923 | | | 7,849 | | | 7,775 | | | |
| | First lien (3)(15)(18) - Drawn | | SOFR(M) | | 5.75% | | 10.17% | | 07/2021 | | 07/2026 | | 1,068 | | | 1,060 | | | 1,048 | | | |
| | Subordinated (3)(15) | | SOFR(Q) | | 8.25% | | 12.93% | | 07/2022 | | 07/2029 | | 17,245 | | | 17,039 | | | 16,846 | | | |
| | | | | | | | | | | | | | | | 44,728 | | | 44,214 | | | 3.33 | % |
| Brave Parent Holdings, Inc. | | | | | | | | | | | | | | | | | | | | |
| Software | | Second lien (5)(15) | | SOFR(M) | | 7.50% | | 11.88% | | 04/2018 | | 04/2026 | | 22,500 | | | 22,443 | | | 21,798 | | | |
| | Second lien (2)(15) | | SOFR(M) | | 7.50% | | 11.88% | | 04/2018 | | 04/2026 | | 16,624 | | | 16,540 | | | 16,104 | | | |
| | Second lien (8)(15) | | SOFR(M) | | 7.50% | | 11.88% | | 04/2018 | | 04/2026 | | 6,000 | | | 5,970 | | | 5,813 | | | |
| | | | | | | | | | | | | | | | 44,953 | | | 43,715 | | | 3.30 | % |
| Deca Dental Holdings LLC | | | | | | | | | | | | | | | | | | | | |
| Healthcare | | First lien (2)(15) | | L(Q) | | 5.75% | | 10.48% | | 08/2021 | | 08/2028 | | 37,860 | | | 37,541 | | | 36,232 | | | |
| | First lien (3)(15)(18) - Drawn | | L(Q) | | 5.75% | | 10.48% | | 08/2021 | | 08/2028 | | 3,985 | | | 3,950 | | | 3,814 | | | |
| | First lien (3)(15)(18) - Drawn | | L(Q) | | 5.75% | | 10.48% | | 08/2021 | | 08/2027 | | 2,623 | | | 2,597 | | | 2,510 | | | |
| | | | | | | | | | | | | | | | 44,088 | | | 42,556 | | | 3.21 | % |
| Recorded Future, Inc. | | | | | | | | | | | | | | | | | | | | |
| Software | | First lien (8)(15) | | L(Q) | | 5.25% | | 9.98% | | 08/2019 | | 07/2025 | | 24,469 | | | 24,351 | | | 24,263 | | | |
| | First lien (2)(15) | | L(Q) | | 5.25% | | 9.98% | | 03/2021 | | 07/2025 | | 12,652 | | | 12,589 | | | 12,546 | | | |
| | | | | | | | | | | | | | | | 36,940 | | | 36,809 | | | 2.78 | % |
| Auctane Inc. (fka Stamps.com Inc.) | | | | | | | | | | | | | | | | | | | | |
| Software | | First lien (8)(15) | | L(M) | | 5.75% | | 10.13% | | 10/2021 | | 10/2028 | | 22,069 | | | 21,880 | | | 21,694 | | | |
| | First lien (2)(15) | | L(M) | | 5.75% | | 10.13% | | 10/2021 | | 10/2028 | | 14,925 | | | 14,797 | | | 14,671 | | | |
| | | | | | | | | | | | | | | | 36,677 | | | 36,365 | | | 2.74 | % |
| | | | | | | | | | | | | | | | | | | | |
| | | | | | | | | | | | | | | | | | | | |
The accompanying notes are an integral part of these consolidated financial statements.
119
New Mountain Finance Corporation
Consolidated Schedule of Investments (Continued)
December 31, 2022
(in thousands, except shares)
| | | | | | | | | | | | | | | | | | | | | | | | | | | | | | | | | | | | | | | | | | | | | | | | | | | | | | | | | | | | | | |
| Portfolio Company, Location and Industry(1) | | Type of
Investment | | Reference | | Spread | | Interest Rate (19) | | Acquisition Date | | Maturity/Expiration
Date | | Principal
Amount,
Par Value
or Shares (17) | | Cost | | Fair Value | | Percent of
Net
Assets |
| Avalara, Inc. | | | | | | | | | | | | | | | | | | | | |
| Software | | First lien (8)(15) | | SOFR(Q) | | 7.25% | | 11.83% | | 10/2022 | | 10/2028 | | $ | 22,500 | | | $ | 22,226 | | | $ | 22,307 | | | |
| | First lien (2)(15) | | SOFR(Q) | | 7.25% | | 11.83% | | 10/2022 | | 10/2028 | | 12,880 | | | 12,723 | | | 12,769 | | | |
| | | | | | | | | | | | | | | | 34,949 | | | 35,076 | | | 2.64 | % |
| OEC Holdco, LLC (22) | | | | | | | | | | | | | | | | | | | | |
| OEConnection LLC | | | | | | | | | | | | | | | | | | | | |
| Software | | Second lien (2)(15) | | SOFR(M) | | 7.00% | | 11.42% | | 12/2021 | | 09/2027 | | 23,406 | | | 23,206 | | | 22,687 | | | |
| | Second lien (2)(15) | | SOFR(M) | | 7.00% | | 11.42% | | 09/2019 | | 09/2027 | | 12,044 | | | 11,963 | | | 11,674 | | | |
| | | | | | | | | | | | | | | | 35,169 | | | 34,361 | | | 2.59 | % |
| Diamond Parent Holdings Corp. (35) | | | | | | | | | | | | | | | | | | | | |
| Diligent Corporation | | | | | | | | | | | | | | | | | | | | |
| Software | | First lien (2)(15) | | L(M) | | 5.75% | | 10.13% | | 03/2021 | | 08/2025 | | 17,583 | | | 17,528 | | | 17,371 | | | |
| | First lien (2)(15) | | L(M) | | 5.75% | | 10.13% | | 03/2021 | | 08/2025 | | 9,805 | | | 9,774 | | | 9,688 | | | |
| | First lien (3)(15) | | L(M) | | 6.25% | | 10.63% | | 12/2018 | | 08/2025 | | 5,827 | | | 5,807 | | | 5,827 | | | |
| | First lien (3)(15)(18) - Drawn | | L(M) | | 6.25% | | 10.63% | | 03/2021 | | 08/2025 | | 1,087 | | | 1,082 | | | 1,087 | | | |
| | | | | | | | | | | | | | | | 34,191 | | | 33,973 | | | 2.56 | % |
| IG Investments Holdings, LLC | | | | | | | | | | | | | | | | | | | | |
| Business Services | | First lien (2)(15) | | L(M) | | 6.00% | | 10.38% | | 09/2021 | | 09/2028 | | 29,134 | | | 28,884 | | | 28,731 | | | |
| | First lien (2)(15) | | L(M) | | 6.00% | | 10.38% | | 02/2022 | | 09/2028 | | 4,257 | | | 4,238 | | | 4,198 | | | |
| | First lien (3)(15)(18) - Drawn | | L(M) | | 6.00% | | 10.39% | | 09/2021 | | 09/2027 | | 919 | | | 910 | | | 906 | | | |
| | | | | | | | | | | | | | | | 34,032 | | | 33,835 | | | 2.55 | % |
| Foreside Financial Group, LLC | | | | | | | | | | | | | | | | | | | | |
| Business Services | | First lien (2)(15) | | L(M) | | 5.50% | | 9.88% | | 05/2022 | | 09/2027 | | 31,968 | | | 31,678 | | | 31,648 | | | |
| | First lien (3)(15) | | L(M) | | 5.50% | | 9.88% | | 05/2022 | | 09/2027 | | 2,072 | | | 2,052 | | | 2,051 | | | |
| | | | | | | | | | | | | | | | 33,730 | | | 33,699 | | | 2.54 | % |
| MRI Software LLC | | | | | | | | | | | | | | | | | | | | |
| Software | | First lien (5)(15) | | L(Q) | | 5.50% | | 10.23% | | 01/2020 | | 02/2026 | | 21,879 | | | 21,817 | | | 21,383 | | | |
| | First lien (2)(15) | | L(Q) | | 5.50% | | 10.23% | | 03/2021 | | 02/2026 | | 4,615 | | | 4,606 | | | 4,511 | | | |
| | First lien (2)(15) | | L(Q) | | 5.50% | | 10.23% | | 01/2020 | | 02/2026 | | 3,173 | | | 3,163 | | | 3,101 | | | |
| | First lien (3)(15) | | L(Q) | | 5.50% | | 10.23% | | 03/2021 | | 02/2026 | | 3,664 | | | 3,656 | | | 3,581 | | | |
| | First lien (3)(15) | | L(Q) | | 5.50% | | 10.23% | | 01/2020 | | 02/2026 | | 810 | | | 807 | | | 791 | | | |
| | | | | | | | | | | | | | | | 34,049 | | | 33,367 | | | 2.52 | % |
| Anaplan, Inc. | | | | | | | | | | | | | | | | | | | | |
| Software | | First lien (2)(15) | | SOFR(M) | | 6.50% | | 10.82% | | 06/2022 | | 06/2029 | | 33,618 | | | 33,300 | | | 33,282 | | | 2.51 | % |
| | | | | | | | | | | | | | | | | | | | |
| | | | | | | | | | | | | | | | | | | | |
The accompanying notes are an integral part of these consolidated financial statements.
120
New Mountain Finance Corporation
Consolidated Schedule of Investments (Continued)
December 31, 2022
(in thousands, except shares)
| | | | | | | | | | | | | | | | | | | | | | | | | | | | | | | | | | | | | | | | | | | | | | | | | | | | | | | | | | | | | | |
| Portfolio Company, Location and Industry(1) | | Type of
Investment | | Reference | | Spread | | Interest Rate (19) | | Acquisition Date | | Maturity/Expiration
Date | | Principal
Amount,
Par Value
or Shares (17) | | Cost | | Fair Value | | Percent of
Net
Assets |
| Granicus, Inc. | | | | | | | | | | | | | | | | | | | | |
| Software | | First lien (4)(15) | | L(M)* | | 5.50% + 1.50%/PIK | | 11.14% | | 01/2021 | | 01/2027 | | $ | 15,405 | | | $ | 15,320 | | | $ | 15,405 | | | |
| | First lien (8)(15) | | L(M)* | | 5.50% + 1.50%/PIK | | 11.14% | | 01/2021 | | 01/2027 | | 5,959 | | | 5,925 | | | 5,959 | | | |
| | First lien (2)(15) | | L(M)* | | 5.50% + 1.50%/PIK | | 11.14% | | 01/2021 | | 01/2027 | | 5,877 | | | 5,845 | | | 5,877 | | | |
| | First lien (2)(15) | | L(M) | | 6.00% | | 10.14% | | 04/2021 | | 01/2027 | | 4,579 | | | 4,540 | | | 4,579 | | | |
| | First lien (3)(15)(18) - Drawn | | L(M) | | 6.50% | | 10.69% | | 01/2021 | | 01/2027 | | 810 | | | 804 | | | 810 | | | |
| | | | | | | | | | | | | | | | 32,434 | | | 32,630 | | | 2.46 | % |
| EAB Global, Inc. | | | | | | | | | | | | | | | | | | | | |
| Education | | Second lien (2)(15) | | L(Q) | | 6.50% | | 10.69% | | 08/2021 | | 08/2029 | | 33,452 | | | 33,017 | | | 32,392 | | | 2.44 | % |
| DCA Investment Holding, LLC | | | | | | | | | | | | | | | | | | | | |
| Healthcare | | First lien (2)(15) | | SOFR(S) | | 6.41% | | 10.39% | | 03/2021 | | 04/2028 | | 19,660 | | | 19,546 | | | 19,278 | | | |
| | First lien (2)(15) | | SOFR(S) | | 6.41% | | 10.39% | | 02/2022 | | 04/2028 | | 7,046 | | | 7,014 | | | 6,909 | | | |
| | First lien (3)(15) | | SOFR(S) | | 6.41% | | 10.39% | | 03/2021 | | 04/2028 | | 3,273 | | | 3,252 | | | 3,209 | | | |
| | First lien (3)(15)(18) - Drawn | | SOFR(S) | | 6.41% | | 10.39% | | 03/2021 | | 04/2028 | | 2,836 | | | 2,823 | | | 2,781 | | | |
| | | | | | | | | | | | | | | | 32,635 | | | 32,177 | | | 2.43 | % |
| KAMC Holdings, Inc. | | | | | | | | | | | | | | | | | | | | |
| Business Services | | Second lien (2)(15) | | L(Q) | | 8.00% | | 12.65% | | 08/2019 | | 08/2027 | | 18,750 | | | 18,657 | | | 15,938 | | | |
| | Second lien (8)(15) | | L(Q) | | 8.00% | | 12.65% | | 08/2019 | | 08/2027 | | 18,750 | | | 18,657 | | | 15,937 | | | |
| | | | | | | | | | | | | | | | 37,314 | | | 31,875 | | | 2.40 | % |
| OA Topco, L.P. (40) | | | | | | | | | | | | | | | | | | | | |
| OA Buyer, Inc. | | | | | | | | | | | | | | | | | | | | |
| Healthcare | | First lien (2)(15) | | L(M) | | 5.75% | | 10.13% | | 12/2021 | | 12/2028 | | 27,989 | | | 27,742 | | | 27,763 | | | |
| | First lien (2)(15) | | L(M) | | 5.75% | | 10.13% | | 05/2022 | | 12/2028 | | 1,772 | | | 1,755 | | | 1,757 | | | |
| | | | | | | | | | | | | | | | 29,497 | | | 29,520 | | | 2.23 | % |
| TigerConnect, Inc. | | | | | | | | | | | | | | | | | | | | |
| Healthcare | | First lien (8)(15) | | SOFR(Q)* | | 3.63% + 3.63%/PIK | | 11.49% | | 02/2022 | | 02/2028 | | 29,868 | | | 29,604 | | | 29,151 | | | |
| | First lien (2)(15)(18) - Drawn | | SOFR(Q)* | | 3.63% + 3.63%/PIK | | 11.49% | | 02/2022 | | 02/2028 | | 277 | | | 277 | | | 270 | | | |
| | | | | | | | | | | | | | | | 29,881 | | | 29,421 | | | 2.22 | % |
| Wealth Enhancement Group, LLC | | | | | | | | | | | | | | | | | | | | |
| Financial Services | | First lien (2)(15) | | SOFR(S) | | 6.00% | | 10.00% | | 08/2021 | | 10/2027 | | 18,949 | | | 18,896 | | | 18,827 | | | |
| | First lien (2)(15) | | SOFR(S) | | 6.00% | | 9.41% | | 01/2022 | | 10/2027 | | 1,254 | | | 1,243 | | | 1,246 | | | |
| | First lien (3)(15)(18) - Drawn | | SOFR(S) | | 6.00% | | 10.31% | | 05/2022 | | 10/2027 | | 7,478 | | | 7,481 | | | 7,430 | | | |
| | First lien (2)(15) | | SOFR(S) | | 6.00% | | 10.46% | | 01/2022 | | 10/2027 | | 841 | | | 833 | | | 835 | | | |
| | | | | | | | | | | | | | | | 28,453 | | | 28,338 | | | 2.14 | % |
| | | | | | | | | | | | | | | | | | | | |
| | | | | | | | | | | | | | | | | | | | |
The accompanying notes are an integral part of these consolidated financial statements.
121
New Mountain Finance Corporation
Consolidated Schedule of Investments (Continued)
December 31, 2022
(in thousands, except shares)
| | | | | | | | | | | | | | | | | | | | | | | | | | | | | | | | | | | | | | | | | | | | | | | | | | | | | | | | | | | | | | |
| Portfolio Company, Location and Industry(1) | | Type of
Investment | | Reference | | Spread | | Interest Rate (19) | | Acquisition Date | | Maturity/Expiration
Date | | Principal
Amount,
Par Value
or Shares (17) | | Cost | | Fair Value | | Percent of
Net
Assets |
| Fortis Solutions Group, LLC | | | | | | | | | | | | | | | | | | | | |
| Packaging | | First lien (2)(15) | | L(Q) | | 5.50% | | 10.23% | | 10/2021 | | 10/2028 | | $ | 17,529 | | | $ | 17,374 | | | $ | 17,119 | | | |
| | First lien (8)(15) | | L(Q) | | 5.50% | | 10.23% | | 10/2021 | | 10/2028 | | 10,195 | | | 10,108 | | | 9,957 | | | |
| | First lien (3)(15) | | L(Q) | | 5.50% | | 10.23% | | 10/2021 | | 10/2028 | | 875 | | | 866 | | | 855 | | | |
| | First lien (3)(15)(18) - Drawn | | L(S) | | 5.50% | | 9.67% | | 10/2021 | | 10/2027 | | 381 | | | 378 | | | 372 | | | |
| | | | | | | | | | | | | | | | 28,726 | | | 28,303 | | | 2.13 | % |
| Foundational Education Group, Inc. | | | | | | | | | | | | | | | | | | | | |
| Education | | Second lien (5)(15) | | SOFR(Q) | | 6.50% | | 11.34% | | 08/2021 | | 08/2029 | | 22,500 | | | 22,401 | | | 20,810 | | | |
| | Second lien (2)(15) | | SOFR(Q) | | 6.50% | | 11.34% | | 08/2021 | | 08/2029 | | 7,009 | | | 6,987 | | | 6,483 | | | |
| | | | | | | | | | | | | | | | 29,388 | | | 27,293 | | | 2.06 | % |
| Syndigo LLC | | | | | | | | | | | | | | | | | | | | |
| Software | | Second lien (4)(15) | | L(S) | | 8.00% | | 13.21% | | 12/2020 | | 12/2028 | | 22,500 | | | 22,363 | | | 21,067 | | | |
| | Second lien (2)(15) | | L(S) | | 8.00% | | 13.21% | | 02/2022 | | 12/2028 | | 5,697 | | | 5,710 | | | 5,334 | | | |
| | | | | | | | | | | | | | | | 28,073 | | | 26,401 | | | 1.99 | % |
| AmeriVet Partners Management, Inc. | | | | | | | | | | | | | | | | | | | | |
| Consumer Services | | First lien (2)(15) | | SOFR(Q) | | 5.50% | | 10.23% | | 02/2022 | | 02/2028 | | 22,321 | | | 22,223 | | | 21,875 | | | |
| | First lien (2)(15) | | SOFR(Q) | | 5.50% | | 10.23% | | 02/2022 | | 02/2028 | | 4,024 | | | 4,004 | | | 3,943 | | | |
| | | | | | | | | | | | | | | | 26,227 | | | 25,818 | | | 1.95 | % |
| NMC Crimson Holdings, Inc. | | | | | | | | | | | | | | | | | | | | |
| Healthcare | | First lien (8)(15) | | L(Q) | | 6.00% | | 9.74% | | 03/2021 | | 03/2028 | | 19,259 | | | 19,033 | | | 19,124 | | | |
| | First lien (2)(15) | | L(Q) | | 6.00% | | 9.74% | | 03/2021 | | 03/2028 | | 4,913 | | | 4,855 | | | 4,879 | | |
| | First lien (3)(15)(18) - Drawn | | L(M) | | 6.00% | | 10.39% | | 03/2021 | | 03/2028 | | 1,635 | | | 1,611 | | | 1,624 | | | |
| | | | | | | | | | | | | | | | 25,499 | | | 25,627 | | | 1.93 | % |
| VT Topco, Inc. | | | | | | | | | | | | | | | | | | | | |
| Business Services | | Second lien (2)(15) | | L(M) | | 6.75% | | 11.13% | | 07/2021 | | 07/2026 | | 16,183 | | | 16,137 | | | 15,711 | | | |
| | Second lien (4)(15) | | L(M) | | 6.75% | | 11.13% | | 08/2018 | | 07/2026 | | 10,000 | | | 9,987 | | | 9,708 | | | |
| | | | | | | | | | | | | | | | 26,124 | | | 25,419 | | | 1.92 | % |
| HS Purchaser, LLC / Help/Systems Holdings, Inc. | | | | | | | | | | | | | | | | | | | | |
| Software | | Second lien (5)(15) | | SOFR(Q) | | 6.75% | | 10.94% | | 11/2019 | | 11/2027 | | 22,500 | | | 22,417 | | | 21,409 | | | |
| | Second lien (2)(15) | | SOFR(Q) | | 6.75% | | 10.94% | | 11/2019 | | 11/2027 | | 4,208 | | | 4,179 | | | 4,004 | | | |
| | | | | | | | | | | | | | | | 26,596 | | | 25,413 | | | 1.92 | % |
| DOCS, MSO, LLC | | | | | | | | | | | | | | | | | | | | |
| Healthcare | | First lien (8)(15) | | SOFR(S) | | 5.75% | | 10.54% | | 06/2022 | | 06/2028 | | 18,760 | | | 18,760 | | | 18,246 | | | |
| | First lien (4)(15) | | SOFR(S) | | 5.75% | | 10.54% | | 06/2022 | | 06/2028 | | 7,025 | | | 7,025 | | | 6,833 | | | |
| | | | | | | | | | | | | | | | 25,785 | | | 25,079 | | | 1.89 | % |
| | | | | | | | | | | | | | | | | | | | |
| | | | | | | | | | | | | | | | | | | | |
The accompanying notes are an integral part of these consolidated financial statements.
122
New Mountain Finance Corporation
Consolidated Schedule of Investments (Continued)
December 31, 2022
(in thousands, except shares)
| | | | | | | | | | | | | | | | | | | | | | | | | | | | | | | | | | | | | | | | | | | | | | | | | | | | | | | | | | | | | | |
| Portfolio Company, Location and Industry(1) | | Type of
Investment | | Reference | | Spread | | Interest Rate (19) | | Acquisition Date | | Maturity/Expiration
Date | | Principal
Amount,
Par Value
or Shares (17) | | Cost | | Fair Value | | Percent of
Net
Assets |
| CRCI Longhorn Holdings, Inc. | | | | | | | | | | | | | | | | | | | | |
| Business Services | | Second lien (3)(15) | | L(M) | | 7.25% | | 11.63% | | 08/2018 | | 08/2026 | | $ | 18,266 | | | $ | 18,229 | | | $ | 17,409 | | | |
| | Second lien (8)(15) | | L(M) | | 7.25% | | 11.63% | | 08/2018 | | 08/2026 | | 7,500 | | | 7,485 | | | 7,148 | | | |
| | | | | | | | | | | | | | | | 25,714 | | | 24,557 | | | 1.85 | % |
| ACI Parent Inc. (36) | | | | | | | | | | | | | | | | | | | | |
| ACI Group Holdings, Inc. | | | | | | | | | | | | | | | | | | | | |
| Healthcare | | First lien (2)(15) | | L(M)* | | 4.50% + 1.25%/PIK | | 10.13% | | 08/2021 | | 08/2028 | | 22,082 | | | 21,898 | | | 21,338 | | | |
| | First lien (3)(15)(18) - Drawn | | L(M)* | | 4.50% + 1.25%/PIK | | 10.13% | | 08/2021 | | 08/2028 | | 2,840 | | | 2,813 | | | 2,744 | | | |
| | First lien (3)(15)(18) - Drawn | | L(M) | | 5.50% | | 9.88% | | 08/2021 | | 08/2027 | | 259 | | | 256 | | | 250 | | | |
| | | | | | | | | | | | | | | | 24,967 | | | 24,332 | | | 1.83 | % |
| Idera, Inc. | | | | | | | | | | | | | | | | | | | | |
| Software | | Second lien (4)(15) | | L(Q) | | 6.75% | | 10.50% | | 06/2019 | | 03/2029 | | 22,500 | | | 22,243 | | | 21,168 | | | |
| | Second lien (3)(15) | | L(Q) | | 6.75% | | 10.50% | | 04/2021 | | 03/2029 | | 3,000 | | | 2,986 | | | 2,822 | | | |
| | | | | | | | | | | | | | | | 25,229 | | | 23,990 | | | 1.81 | % |
| Bullhorn, Inc. | | | | | | | | | | | | | | | | | | | | |
| Software | | First lien (2)(15) | | L(Q) | | 5.75% | | 10.48% | | 09/2019 | | 09/2026 | | 16,659 | | | 16,586 | | | 16,659 | | | |
| | First lien (2)(15) | | L(Q) | | 5.75% | | 10.48% | | 10/2021 | | 09/2026 | | 3,442 | | | 3,435 | | | 3,442 | | | |
| | First lien (2)(15) | | L(Q) | | 5.75% | | 10.48% | | 09/2019 | | 09/2026 | | 771 | | | 766 | | | 771 | | | |
| | First lien (3)(15)(18) - Drawn | | L(Q) | | 5.75% | | 10.48% | | 09/2019 | | 09/2026 | | 392 | | | 389 | | | 392 | | | |
| | First lien (2)(15) | | L(Q) | | 5.75% | | 10.48% | | 09/2019 | | 09/2026 | | 345 | | | 344 | | | 345 | | | |
| | First lien (2)(15) | | L(Q) | | 5.75% | | 10.48% | | 09/2019 | | 09/2026 | | 275 | | | 274 | | | 275 | | | |
| | | | | | | | | | | | | | | | 21,794 | | | 21,884 | | | 1.65 | % |
| Convey Health Solutions, Inc. | | | | | | | | | | | | | | | | | | | | |
| Healthcare | | First lien (4)(15) | | SOFR(Q) | | 5.25% | | 9.93% | | 09/2019 | | 09/2026 | | 19,215 | | | 19,091 | | | 18,639 | | | |
| | First lien (4)(15) | | SOFR(Q) | | 5.25% | | 9.93% | | 02/2022 | | 09/2026 | | 3,208 | | | 3,169 | | | 3,112 | | | |
| | | | | | | | | | | | | | | | 22,260 | | | 21,751 | | | 1.64 | % |
| Spring Education Group, Inc (fka SSH Group Holdings, Inc.) | | | | | | | | | | | | | | | | | | | | |
| Education | | Second lien (2)(15) | | L(Q) | | 8.25% | | 12.98% | | 07/2018 | | 07/2026 | | 21,959 | | | 21,928 | | | 21,324 | | | 1.61 | % |
| TMK Hawk Parent, Corp. | | | | | | | | | | | | | | | | | | | | |
| Distribution & Logistics | | First lien (2)(15) | | L(Q) | | 3.50% | | 8.26% | | 06/2019 | | 08/2024 | | 16,395 | | | 15,474 | | | 10,657 | | | |
| | First lien (8)(15) | | L(Q) | | 3.50% | | 8.26% | | 10/2019 | | 08/2024 | | 15,813 | | | 14,687 | | | 10,277 | | | |
| | | | | | | | | | | | | | | | 30,161 | | | 20,934 | | | 1.58 | % |
| Cardinal Parent, Inc. | | | | | | | | | | | | | | | | | | | | |
| Software | | First lien (4)(15) | | L(Q) | | 4.50% | | 9.23% | | 10/2020 | | 11/2027 | | 11,974 | | | 11,908 | | | 11,490 | | | |
| | Second lien (4)(15) | | L(Q) | | 7.75% | | 12.46% | | 11/2020 | | 11/2028 | | 9,767 | | | 9,689 | | | 9,432 | | | |
| | | | | | | | | | | | | | | | 21,597 | | | 20,922 | | | 1.58 | % |
| | | | | | | | | | | | | | | | | | | | |
| | | | | | | | | | | | | | | | | | | | |
The accompanying notes are an integral part of these consolidated financial statements.
123
New Mountain Finance Corporation
Consolidated Schedule of Investments (Continued)
December 31, 2022
(in thousands, except shares)
| | | | | | | | | | | | | | | | | | | | | | | | | | | | | | | | | | | | | | | | | | | | | | | | | | | | | | | | | | | | | | |
| Portfolio Company, Location and Industry(1) | | Type of
Investment | | Reference | | Spread | | Interest Rate (19) | | Acquisition Date | | Maturity/Expiration
Date | | Principal
Amount,
Par Value
or Shares (17) | | Cost | | Fair Value | | Percent of
Net
Assets |
| Notorious Topco, LLC | | | | | | | | | | | | | | | | | | | | |
| Consumer Products | | First lien (8)(15) | | SOFR(Q) | | 6.75% | | 10.99% | | 11/2021 | | 11/2027 | | $ | 10,051 | | | $ | 9,987 | | | $ | 9,882 | | | |
| | First lien (8)(15) | | SOFR(Q) | | 6.75% | | 10.99% | | 05/2022 | | 11/2027 | | 9,925 | | | 9,857 | | | 9,758 | | | |
| | First lien (3)(15)(18) - Drawn | | SOFR(Q) | | 6.75% | | 10.99% | | 11/2021 | | 11/2027 | | 876 | | | 873 | | | 861 | | | |
| | First lien (3)(15)(18) - Drawn | | SOFR(Q) | | 6.75% | | 10.99% | | 11/2021 | | 05/2027 | | 147 | | | 146 | | | 145 | | | |
| | | | | | | | | | | | | | | | 20,863 | | | 20,646 | | | 1.56 | % |
| YLG Holdings, Inc. | | | | | | | | | | | | | | | | | | | | |
| Business Services | | First lien (5)(15) | | L(S) | | 5.00% | | 9.93% | | 11/2019 | | 10/2025 | | 17,861 | | | 17,815 | | | 17,393 | | | |
| | First lien (5)(15) | | L(S) | | 5.00% | | 9.93% | | 11/2019 | | 10/2025 | | 2,326 | | | 2,319 | | | 2,265 | | | |
| | First lien (5)(15)(18) - Drawn | | L(S) | | 5.00% | | 9.90% | | 10/2021 | | 10/2025 | | 495 | | | 506 | | | 482 | | | |
| | | | | | | | | | | | | | | | 20,640 | | | 20,140 | | | 1.52 | % |
| AAC Lender Holdings, LLC (33) | | | | | | | | | | | | | | | | | | | | |
| American Achievement Corporation (aka AAC Holding Corp.) | | | | | | | | | | | | | | | | | | | | |
| Education | | First lien (2)(15) | | L(M)(42)* | | 5.75%/PIK + 0.50% | | 10.38% | | 09/2015 | | 09/2026 | | 28,829 | | | 28,787 | | | 20,599 | | | |
| | First lien (3)(15) | | L(M)(42)* | | 13.50%/PIK + 0.50% | | 18.13% | | 06/2021 | | 09/2026 | | 1,527 | | | 1,527 | | | — | | | |
| | Subordinated (3)(15) | | L(Q)(42)* | | 1.00%/PIK | | 4.75% | | 03/2021 | | 09/2026 | | 5,230 | | | — | | | — | | | |
| | | | | | | | | | | | | | | | 30,314 | | | 20,599 | | | 1.55 | % |
| New Trojan Parent, Inc. | | | | | | | | | | | | | | | | | | | | |
| Healthcare | | Second lien (2)(15) | | L(M) | | 7.25% | | 11.63% | | 01/2021 | | 01/2029 | | 26,762 | | | 26,653 | | | 20,101 | | | 1.52 | % |
| Xactly Corporation | | | | | | | | | | | | | | | | | | | | |
| Software | | First lien (4)(15) | | L(Q) | | 7.25% | | 11.99% | | 07/2017 | | 07/2023 | | 19,047 | | | 19,030 | | | 19,047 | | | |
| | First lien (3)(15)(18) - Drawn | | L(M) | | 7.25% | | 11.59% | | 07/2017 | | 07/2023 | | 992 | | | 982 | | | 992 | | | |
| | | | | | | | | | | | | | | | 20,012 | | | 20,039 | | | 1.51 | % |
| Ansira Holdings, Inc. | | | | | | | | | | | | | | | | | | | | |
| Business Services | | First lien (8)(15) | | L(Q)(42)* | | 6.50%/PIK | | 10.91% | | 12/2016 | | 12/2024 | | 32,953 | | | 33,059 | | | 14,829 | | | |
| | First lien (3)(15) | | L(Q)(42)* | | 6.50%/PIK | | 11.15% | | 12/2016 | | 12/2024 | | 8,316 | | | 8,308 | | | 3,742 | | | |
| | First lien (3)(15)(18) - Drawn | | SOFR(Q)* | | 2.00% + 8.00%/PIK | | 14.42% | | 11/2022 | | 12/2024 | | 313 | | | 313 | | | 313 | | | |
| | | | | | | | | | | | | | | | 41,680 | | | 18,884 | | | 1.42 | % |
| Bluefin Holding, LLC | | | | | | | | | | | | | | | | | | | | |
| Software | | First lien (3)(15)(18) - Drawn | | L(S) | | 5.75% | | 9.93% | | 09/2019 | | 09/2024 | | 1,212 | | | 1,194 | | | 1,177 | | | |
| | Second lien (8)(15) | | L(Q) | | 7.75% | | 12.48% | | 09/2019 | | 09/2027 | | 18,000 | | | 18,000 | | | 17,338 | | | |
| | | | | | | | | | | | | | | | 19,194 | | | 18,515 | | | 1.40 | % |
| | | | | | | | | | | | | | | | | | | | |
| | | | | | | | | | | | | | | | | | | | |
The accompanying notes are an integral part of these consolidated financial statements.
124
New Mountain Finance Corporation
Consolidated Schedule of Investments (Continued)
December 31, 2022
(in thousands, except shares)
| | | | | | | | | | | | | | | | | | | | | | | | | | | | | | | | | | | | | | | | | | | | | | | | | | | | | | | | | | | | | | |
| Portfolio Company, Location and Industry(1) | | Type of
Investment | | Reference | | Spread | | Interest Rate (19) | | Acquisition Date | | Maturity/Expiration
Date | | Principal
Amount,
Par Value
or Shares (17) | | Cost | | Fair Value | | Percent of
Net
Assets |
| Trinity Air Consultants Holdings Corporation | | | | | | | | | | | | | | | | | | | | |
| Business Services | | First lien (2)(15) | | L(S) | | 5.25% | | 10.18% | | 06/2021 | | 06/2027 | | $ | 15,382 | | | $ | 15,260 | | | $ | 15,257 | | | |
| | First lien (2)(15)(18) - Drawn | | L(S) | | 5.25% | | 9.40% | | 06/2021 | | 06/2027 | | 2,889 | | | 2,863 | | | 2,865 | | | |
| | | | | | | | | | | | | | | | 18,123 | | | 18,122 | | | 1.37 | % |
| DG Investment Intermediate Holdings 2, Inc. | | | | | | | | | | | | | | | | | | | | |
| Business Services | | Second lien (3) | | SOFR(M) | | 6.75% | | 11.07% | | 03/2021 | | 03/2029 | | 20,313 | | | 20,270 | | | 18,053 | | | 1.36 | % |
| FS WhiteWater Holdings, LLC (38) | | | | | | | | | | | | | | | | | | | | |
| FS WhiteWater Borrower, LLC | | | | | | | | | | | | | | | | | | | | |
| Consumer Services | | First lien (5)(15) | | L(Q) | | 5.75% | | 10.48% | | 12/2021 | | 12/2027 | | 10,395 | | | 10,306 | | | 10,110 | | | |
| | First lien (5)(15) | | L(Q) | | 5.75% | | 10.48% | | 12/2021 | | 12/2027 | | 3,489 | | | 3,456 | | | 3,393 | | | |
| | First lien (5)(15) | | L(Q) | | 5.75% | | 10.48% | | 12/2021 | | 12/2027 | | 3,467 | | | 3,437 | | | 3,372 | | | |
| | First lien (3)(15)(18) - Drawn | | L(Q) | | 5.75% | | 10.50% | | 12/2021 | | 12/2027 | | 490 | | | 485 | | | 477 | | | |
| | First lien (3)(15)(18) - Drawn | | L(Q) | | 6.00% | | 10.53% | | 07/2022 | | 12/2027 | | 589 | | | 635 | | | 584 | | | |
| | | | | | | | | | | | | | | | 18,319 | | | 17,936 | | | 1.35 | % |
| Pioneer Topco I, L.P. (39) | | | | | | | | | | | | | | | | | | | | |
| Pioneer Buyer I, LLC | | | | | | | | | | | | | | | | | | | | |
| Software | | First lien (8)(15) | | L(Q)* | | 7.00%/PIK | | 11.73% | | 11/2021 | | 11/2028 | | 14,900 | | | 14,782 | | | 14,706 | | | |
| | First lien (8)(15) | | L(Q)* | | 7.00%/PIK | | 11.73% | | 03/2022 | | 11/2028 | | 2,042 | | | 2,025 | | | 2,016 | | | |
| | | | | | | | | | | | | | | | 16,807 | | | 16,722 | | | 1.26 | % |
| Coyote Buyer, LLC | | | | | | | | | | | | | | | | | | | | |
| Specialty Chemicals & Materials | | First lien (5)(15) | | L(Q) | | 6.00% | | 10.41% | | 03/2020 | | 02/2026 | | 13,795 | | | 13,755 | | | 13,795 | | | |
| | First lien (5)(15) | | L(Q) | | 8.00% | | 12.73% | | 10/2020 | | 08/2026 | | 2,482 | | | 2,466 | | | 2,482 | | | |
| | | | | | | | | | | | | | | | 16,221 | | | 16,277 | | | 1.23 | % |
| The Kleinfelder Group, Inc. | | | | | | | | | | | | | | | | | | | | |
| Business Services | | First lien (4)(15) | | L(Q) | | 5.25% | | 9.98% | | 12/2018 | | 11/2024 | | 16,533 | | | 16,503 | | | 16,241 | | | 1.22 | % |
| Kele Holdco, Inc. | | | | | | | | | | | | | | | | | | | | |
| Distribution & Logistics | | First lien (5)(15) | | L(M) | | 5.25% | | 9.42% | | 02/2020 | | 02/2026 | | 15,788 | | | 15,742 | | | 15,788 | | | 1.19 | % |
| MED Parentco, LP | | | | | | | | | | | | | | | | | | | | |
| Healthcare | | Second lien (8) | | L(M) | | 8.25% | | 12.63% | | 08/2019 | | 08/2027 | | 20,857 | | | 20,752 | | | 15,726 | | | 1.19 | % |
| Daxko Acquisition Corporation | | | | | | | | | | | | | | | | | | | | |
| Software | | First lien (8)(15) | | L(M) | | 5.50% | | 9.88% | | 10/2021 | | 10/2028 | | 13,144 | | | 13,031 | | | 12,776 | | | |
| | First lien (2)(15) | | L(M) | | 5.50% | | 9.88% | | 10/2021 | | 10/2028 | | 1,107 | | | 1,097 | | | 1,076 | | | |
| | First lien (3)(15)(18) - Drawn | | P(Q) | | 4.50% | | 12.00% | | 10/2021 | | 10/2027 | | 33 | | | 33 | | | 32 | | | |
| | | | | | | | | | | | | | | | 14,161 | | | 13,884 | | | 1.05 | % |
| | | | | | | | | | | | | | | | | | | | |
| | | | | | | | | | | | | | | | | | | | |
The accompanying notes are an integral part of these consolidated financial statements.
125
New Mountain Finance Corporation
Consolidated Schedule of Investments (Continued)
December 31, 2022
(in thousands, except shares)
| | | | | | | | | | | | | | | | | | | | | | | | | | | | | | | | | | | | | | | | | | | | | | | | | | | | | | | | | | | | | | |
| Portfolio Company, Location and Industry(1) | | Type of
Investment | | Reference | | Spread | | Interest Rate (19) | | Acquisition Date | | Maturity/Expiration
Date | | Principal
Amount,
Par Value
or Shares (17) | | Cost | | Fair Value | | Percent of
Net
Assets |
| CFS Management, LLC | | | | | | | | | | | | | | | | | | | | |
| Healthcare | | First lien (2)(15) | | SOFR(Q)* | | 6.25% + 0.75%/PIK | | 11.84% | | 08/2019 | | 07/2024 | | $ | 11,392 | | | $ | 11,372 | | | $ | 10,637 | | | |
| | First lien (2)(15) | | SOFR(Q)* | | 6.25% + 0.75%/PIK | | 11.84% | | 08/2019 | | 07/2024 | | 3,393 | | | 3,386 | | | 3,168 | | | |
| | | | | | | | | | | | | | | | 14,758 | | | 13,805 | | | 1.04 | % |
| Castle Management Borrower LLC | | | | | | | | | | | | | | | | | | | | |
| Business Services | | First lien (8)(15) | | L(Q) | | 2.19% | | 3.19% | | 05/2018 | | 02/2025 | | 14,288 | | | 14,269 | | | 13,605 | | | 1.03 | % |
| Alegeus Technologies Holdings Corp. | | | | | | | | | | | | | | | | | | | | |
| Healthcare | | First lien (8)(15) | | L(A) | | 8.25% | | 10.95% | | 09/2018 | | 09/2024 | | 13,444 | | | 13,421 | | | 13,444 | | | 1.01 | % |
| Calabrio, Inc. | | | | | | | | | | | | | | | | | | | | |
| Software | | First lien (5)(15) | | L(Q) | | 7.00% | | 11.73% | | 04/2021 | | 04/2027 | | 12,347 | | | 12,277 | | | 12,347 | | | |
| | First lien (3)(15)(18) - Drawn | | L(Q) | | 7.00% | | 11.75% | | 04/2021 | | 04/2027 | | 850 | | | 843 | | | 850 | | | |
| | | | | | | | | | | | | | | | 13,120 | | | 13,197 | | | 1.00 | % |
| IMO Investor Holdings, Inc. | | | | | | | | | | | | | | | | | | | | |
| Healthcare | | First lien (2)(15) | | SOFR(S) | | 6.00% | | 10.62% | | 05/2022 | | 05/2029 | | 12,974 | | | 12,854 | | | 12,845 | | | |
| | First lien (3)(15)(18) - Drawn | | SOFR(S) | | 6.00% | | 10.61% | | 05/2022 | | 05/2028 | | 294 | | | 291 | | | 291 | | | |
| | | | | | | | | | | | | | | | 13,145 | | | 13,136 | | | 0.99 | % |
| FR Arsenal Holdings II Corp. | | | | | | | | | | | | | | | | | | | | |
| Business Services | | First lien (2)(15) | | L(M)* | | 7.50% + 2.00%/PIK | | 13.88% | | 09/2016 | | 01/2023 | | 14,582 | | | 14,579 | | | 13,123 | | | 0.99 | % |
| Apptio, Inc. | | | | | | | | | | | | | | | | | | | | |
| Software | | First lien (8)(15) | | L(Q) | | 6.00% | | 9.94% | | 01/2019 | | 01/2025 | | 5,703 | | | 5,658 | | | 5,703 | | | |
| | First lien (2)(15) | | L(Q) | | 6.00% | | 9.94% | | 01/2019 | | 01/2025 | | 5,500 | | | 5,456 | | | 5,500 | | | |
| | First lien (3)(15)(18) - Drawn | | L(Q) | | 6.00% | | 9.94% | | 01/2019 | | 01/2025 | | 1,240 | | | 1,215 | | | 1,240 | | | |
| | | | | | | | | | | | | | | | 12,329 | | | 12,443 | | | 0.94 | % |
| Transcendia Holdings, Inc. | | | | | | | | | | | | | | | | | | | | |
| Packaging | | Second lien (8)(15) | | L(M) | | 8.00% | | 12.38% | | 06/2017 | | 05/2025 | | 14,500 | | | 14,423 | | | 12,418 | | | 0.94 | % |
| USRP Holdings, Inc. | | | | | | | | | | | | | | | | | | | | |
| Business Services | | First lien (2)(15) | | L(Q) | | 5.50% | | 10.23% | | 07/2021 | | 07/2027 | | 11,311 | | | 11,222 | | | 10,945 | | | |
| | First lien (3)(15) | | L(Q) | | 5.50% | | 10.23% | | 07/2021 | | 07/2027 | | 1,473 | | | 1,460 | | | 1,425 | | | |
| | | | | | | | | | | | | | | | 12,682 | | | 12,370 | | | 0.93 | % |
| CHA Holdings, Inc. | | | | | | | | | | | | | | | | | | | | |
| Business Services | | Second lien (4)(15) | | L(Q) | | 8.75% | | 13.48% | | 04/2018 | | 04/2026 | | 7,012 | | | 6,976 | | | 6,923 | | | |
| | Second lien (3)(15) | | L(Q) | | 8.75% | | 13.48% | | 04/2018 | | 04/2026 | | 4,453 | | | 4,430 | | | 4,396 | | | |
| | | | | | | | | | | | | | | | 11,406 | | | 11,319 | | | 0.85 | % |
| | | | | | | | | | | | | | | | | | | | |
| | | | | | | | | | | | | | | | | | | | |
The accompanying notes are an integral part of these consolidated financial statements.
126
New Mountain Finance Corporation
Consolidated Schedule of Investments (Continued)
December 31, 2022
(in thousands, except shares)
| | | | | | | | | | | | | | | | | | | | | | | | | | | | | | | | | | | | | | | | | | | | | | | | | | | | | | | | | | | | | | |
| Portfolio Company, Location and Industry(1) | | Type of
Investment | | Reference | | Spread | | Interest Rate (19) | | Acquisition Date | | Maturity/Expiration
Date | | Principal
Amount,
Par Value
or Shares (17) | | Cost | | Fair Value | | Percent of
Net
Assets |
| Specialtycare, Inc. | | | | | | | | | | | | | | | | | | | | |
| Healthcare | | First lien (2)(15) | | L(Q) | | 5.75% | | 9.49% | | 06/2021 | | 06/2028 | | $ | 10,458 | | | $ | 10,341 | | | $ | 10,019 | | | |
| | First lien (3)(15)(18) - Drawn | | L(M) | | 4.00% | | 8.29% | | 06/2021 | | 06/2026 | | 212 | | | 209 | | | 204 | | | |
| | First lien (3)(15)(18) - Drawn | | L(Q) | | 5.75% | | 9.76% | | 06/2021 | | 06/2028 | | 79 | | | 75 | | | 75 | | | |
| | | | | | | | | | | | | | | | 10,625 | | | 10,298 | | | 0.78 | % |
| Quartz Holding Company | | | | | | | | | | | | | | | | | | | | |
| Software | | Second lien (3)(15) | | L(M) | | 8.00% | | 12.38% | | 04/2019 | | 04/2027 | | 10,000 | | | 9,877 | | | 9,802 | | | 0.74 | % |
| CG Group Holdings, LLC | | | | | | | | | | | | | | | | | | | | |
| Specialty Chemicals & Materials | | First lien (2)(15) | | L(Q)* | | 5.25% + 2.00%/PIK | | 11.98% | | 07/2021 | | 07/2027 | | 8,317 | | | 8,244 | | | 7,411 | | | |
| | First lien (3)(15)(18) - Drawn | | L(M)* | | 5.25% + 2.00%/PIK | | 11.63% | | 07/2021 | | 07/2026 | | 916 | | | 906 | | | 817 | | | |
| | | | | | | | | | | | | | | | 9,150 | | | 8,228 | | | 0.62 | % |
| PPVA Black Elk (Equity) LLC | | | | | | | | | | | | | | | | | | | | |
| Business Services | | Subordinated (3)(15) | | — | | — | | — | | 05/2013 | | — | | 14,500 | | | 14,500 | | | 7,995 | | | 0.60 | % |
| KPSKY Acquisition Inc. | | | | | | | | | | | | | | | | | | | | |
| Business Services | | First lien (8)(15) | | L(M) | | 5.50% | | 9.89% | | 10/2021 | | 10/2028 | | 6,968 | | | 6,908 | | | 6,662 | | | |
| | First lien (2)(15) | | P(Q) | | 4.50% | | 12.00% | | 10/2021 | | 10/2028 | | 801 | | | 794 | | | 766 | | | |
| | First lien (2)(15)(18) - Drawn | | P(Q) | | 4.50% | | 12.00% | | 06/2022 | | 10/2028 | | 145 | | | 144 | | | 139 | | | |
| | | | | | | | | | | | | | | | 7,846 | | | 7,567 | | | 0.57 | % |
| TRC Companies L.L.C. (fka Energize Holdco LLC) | | | | | | | | | | | | | | | | | | | | |
| Business Services | | Second lien (2)(15) | | L(M) | | 6.75% | | 11.13% | | 11/2021 | | 12/2029 | | 7,950 | | | 7,914 | | | 7,488 | | | 0.56 | % |
| DS Admiral Bidco, LLC | | | | | | | | | | | | | | | | | | | | |
| Software | | First lien (2) | | SOFR(M) | | 7.00% | | 11.51% | | 12/2022 | | 12/2029 | | 7,547 | | | 7,434 | | | 7,434 | | | 0.56 | % |
| Vectra Co. | | | | | | | | | | | | | | | | | | | | |
| Business Products | | Second lien (8)(15) | | L(M) | | 7.25% | | 11.63% | | 02/2018 | | 03/2026 | | 10,788 | | | 10,769 | | | 7,004 | | | 0.53 | % |
| Community Brands ParentCo, LLC | | | | | | | | | | | | | | | | | | | | |
| Software | | First lien (2)(15) | | SOFR(M) | | 5.75% | | 10.17% | | 02/2022 | | 02/2028 | | 7,163 | | | 7,100 | | | 6,928 | | | 0.52 | % |
| Safety Borrower Holdings LLC | | | | | | | | | | | | | | | | | | | | |
| Software | | First lien (2)(15) | | L(S) | | 5.25% | | 10.41% | | 09/2021 | | 09/2027 | | 6,975 | | | 6,946 | | | 6,861 | | | 0.52 | % |
| Sun Acquirer Corp. | | | | | | | | | | | | | | | | | | | | |
| Consumer Services | | First lien (2)(15) | | L(M) | | 5.75% | | 10.13% | | 09/2021 | | 09/2028 | | 3,985 | | | 3,956 | | | 3,917 | | | |
| | First lien (2)(15)(18) - Drawn | | L(M) | | 5.75% | | 10.13% | | 09/2021 | | 09/2028 | | 2,791 | | | 2,757 | | | 2,744 | | | |
| | | | | | | | | | | | | | | | 6,713 | | | 6,661 | | | 0.50 | % |
| PPV Intermediate Holdings, LLC | | | | | | | | | | | | | | | | | | | | |
| Consumer Services | | First lien (4)(15) | | SOFR(M) | | 5.75% | | 9.12% | | 08/2022 | | 08/2029 | | 6,629 | | | 6,565 | | | 6,500 | | | |
| | First lien (3)(15)(18) - Drawn | | SOFR(Q) | | 5.75% | | 10.03% | | 08/2022 | | 08/2029 | | 131 | | | 134 | | | 129 | | | |
| | | | | | | | | | | | | | | | 6,699 | | | 6,629 | | | 0.50 | % |
| | | | | | | | | | | | | | | | | | | | |
| | | | | | | | | | | | | | | | | | | | |
The accompanying notes are an integral part of these consolidated financial statements.
127
New Mountain Finance Corporation
Consolidated Schedule of Investments (Continued)
December 31, 2022
(in thousands, except shares)
| | | | | | | | | | | | | | | | | | | | | | | | | | | | | | | | | | | | | | | | | | | | | | | | | | | | | | | | | | | | | | |
| Portfolio Company, Location and Industry(1) | | Type of
Investment | | Reference | | Spread | | Interest Rate (19) | | Acquisition Date | | Maturity/Expiration
Date | | Principal
Amount,
Par Value
or Shares (17) | | Cost | | Fair Value | | Percent of
Net
Assets |
| Appriss Health Holdings, Inc. (23) | | | | | | | | | | | | | | | | | | | | |
| Appriss Health, LLC | | | | | | | | | | | | | | | | | | | | |
| Healthcare | | First lien (8)(15) | | L(M) | | 7.25% | | 11.54% | | 05/2021 | | 05/2027 | | $ | 6,234 | | | $ | 6,186 | | | $ | 6,234 | | | 0.47 | % |
| Pye-Barker Fire & Safety, LLC | | | | | | | | | | | | | | | | | | | | |
| Business Services | | First lien (2)(15) | | L(Q) | | 5.50% | | 10.23% | | 11/2021 | | 11/2027 | | 5,161 | | | 5,115 | | | 5,014 | | | |
| | First lien (3)(15)(18) - Drawn | | L(Q) | | 5.50% | | 10.23% | | 11/2021 | | 11/2024 | | 422 | | | 418 | | | 410 | | | |
| | | | | | | | | | | | | | | | 5,533 | | | 5,424 | | | 0.41 | % |
| ADG, LLC | | | | | | | | | | | | | | | | | | | | |
| Healthcare | | Second lien (3)(15) | | L(M)* | | 10.00%/PIK | | 14.38% | | 10/2016 | | 03/2024 | | 7,430 | | | 7,413 | | | 4,984 | | | 0.38 | % |
| Virtusa Corporation | | | | | | | | | | | | | | | | | | | | |
| Software | | Subordinated (3) | | FIXED(S) | | 7.13% | | 7.13% | | 10/2022 | | 12/2028 | | 5,000 | | | 3,824 | | | 3,817 | | | 0.29 | % |
| Education Management Corporation (20) | | | | | | | | | | | | | | | | | | | | |
| Education Management II LLC | | | | | | | | | | | | | | | | | | | | |
| Education | | First lien (2) | | P(M)(42) | | 7.50% | | 13.00% | | 01/2015 | | 07/2020 | | 300 | | | 292 | | | — | | | |
| | First lien (3) | | P(M)(42) | | 7.50% | | 13.00% | | 01/2015 | | 07/2020 | | 169 | | | 165 | | | — | | | |
| | First lien (2) | | P(Q)(42) | | 6.50% | | 9.75% | | 01/2015 | | 07/2020 | | 205 | | | 199 | | | — | | | |
| | First lien (3) | | P(Q)(42) | | 6.50% | | 9.75% | | 01/2015 | | 07/2020 | | 115 | | | 112 | | | — | | | |
| | First lien (2) | | P(Q)(42) | | 8.50% | | 11.75% | | 01/2015 | | 07/2020 | | 139 | | | 115 | | | — | | | |
| | First lien (3) | | P(Q)(42) | | 8.50% | | 11.75% | | 01/2015 | | 07/2020 | | 79 | | | 65 | | | — | | | |
| | First lien (2) | | P(Q)(42) | | 8.50% | | 11.75% | | 01/2015 | | 07/2020 | | 4 | | | 3 | | | — | | | |
| | First lien (3) | | P(Q)(42) | | 8.50% | | 11.75% | | 01/2015 | | 07/2020 | | 2 | | | 2 | | | — | | | |
| | | | | | | | | | | | | | | | 953 | | | — | | | — | % |
| PPVA Fund, L.P. | | | | | | | | | | | | | | | | | | | | |
| Business Services | | Collateralized Financing (42)(43) | | — | | — | | — | | 11/2014 | | — | | — | | | — | | | — | | | — | % |
| Total Funded Debt Investments - United States | | | | | | | | | | | | | | | | $ | 2,194,600 | | | $ | 2,081,746 | | | 156.97 | % |
| Funded Debt Investments - Netherlands | | | | | | | | | | | | | | | | | | | | |
| Tahoe Finco, LLC** | | | | | | | | | | | | | | | | | | | | |
| Information Technology | | First lien (2)(15) | | L(M) | | 6.00% | | 10.29% | | 10/2021 | | 09/2028 | | $ | 35,000 | | | $ | 34,700 | | | $ | 34,436 | | | |
| | First lien (8)(15) | | L(M) | | 6.00% | | 10.29% | | 10/2021 | | 09/2028 | | 24,189 | | | 23,982 | | | 23,800 | | | |
| | | | | | | | | | | | | | | | 58,682 | | | 58,236 | | | 4.39 | % |
| Total Funded Debt Investments - Netherlands | | | | | | | | | | | | | | | | $ | 58,682 | | | $ | 58,236 | | | 4.39 | % |
| Funded Debt Investments - United Kingdom | | | | | | | | | | | | | | | | | | | | |
| Aston FinCo S.a r.l. / Aston US Finco, LLC** | | | | | | | | | | | | | | | | | | | | |
| Software | | Second lien (8)(15) | | L(M) | | 8.25% | | 12.63% | | 10/2019 | | 10/2027 | | $ | 34,459 | | | $ | 34,271 | | | $ | 34,356 | | | 2.59 | % |
| | | | | | | | | | | | | | | | | | | | |
| | | | | | | | | | | | | | | | | | | | |
The accompanying notes are an integral part of these consolidated financial statements.
128
New Mountain Finance Corporation
Consolidated Schedule of Investments (Continued)
December 31, 2022
(in thousands, except shares)
| | | | | | | | | | | | | | | | | | | | | | | | | | | | | | | | | | | | | | | | | | | | | | | | | | | | | | | | | | | | | | |
| Portfolio Company, Location and Industry(1) | | Type of
Investment | | Reference | | Spread | | Interest Rate (19) | | Acquisition Date | | Maturity/Expiration
Date | | Principal
Amount,
Par Value
or Shares (17) | | Cost | | Fair Value | | Percent of
Net
Assets |
| Integro Parent Inc. | | | | | | | | | | | | | | | | | | | | |
| Business Services | | First lien (2)(15) | | SOFR(Q)* | | 12.25%/PIK | | 16.83% | | 10/2015 | | 05/2023 | | $ | 4,187 | | | $ | 4,184 | | | $ | 4,187 | | | |
| | First lien (3)(15) | | SOFR(Q)* | | 12.25%/PIK | | 16.83% | | 06/2018 | | 05/2023 | | 827 | | | 823 | | | 828 | | | |
| | Second lien (3)(15) | | SOFR(Q)(42)* | | 12.25%/PIK | | 16.83% | | 10/2015 | | 10/2023 | | 11,510 | | | 11,109 | | | 8,718 | | | |
| | | | | | | | | | | | | | | | 16,116 | | | 13,733 | | | 1.04 | % |
| Total Funded Debt Investments - United Kingdom | | | | | | | | | | | | | | | | $ | 50,387 | | | $ | 48,089 | | | 3.63 | % |
| Funded Debt Investments - Jersey | | | | | | | | | | | | | | | | | | | | |
| Tennessee Bidco Limited ** | | | | | | | | | | | | | | | | | | | | |
| Business Services | | First lien (3)(15)(16) | | SONIA(D) | | 7.00% | | 10.95% | | 08/2021 | | 08/2028 | | £ | 12,879 | | | $ | 17,634 | | | $ | 15,562 | | | |
| | First lien (3)(15)(16) | | SONIA(D) | | 7.00% | | 10.95% | | 08/2021 | | 08/2028 | | £ | 10,538 | | | 13,133 | | | 12,734 | | | |
| | First lien (3)(15) | | L(S) | | 7.00% | | 10.38% | | 08/2021 | | 08/2028 | | $ | 10,184 | | | 10,055 | | | 10,184 | | | |
| | First lien (3)(15) | | L(S) | | 7.00% | | 11.78% | | 08/2021 | | 08/2028 | | $ | 6,246 | | | 6,162 | | | 6,246 | | | |
| | First lien (3)(15)(16) | | EURIBOR(S) | | 7.00% | | 7.63% | | 08/2021 | | 08/2028 | | € | 708 | | | 714 | | | 757 | | | |
| | | | | | | | | | | | | | | | 47,698 | | | 45,483 | | | 3.43 | % |
| Total Funded Debt Investments - Jersey | | | | | | | | | | | | | | | | $ | 47,698 | | | $ | 45,483 | | | 3.43 | % |
| Funded Debt Investments - Australia | | | | | | | | | | | | | | | | | | | | |
| Atlas AU Bidco Pty Ltd** | | | | | | | | | | | | | | | | | | | | |
| Business Services | | First lien (2) | | SOFR(M) | | 7.25% | | 11.48% | | 12/2022 | | 12/2029 | | $ | 3,454 | | | $ | 3,402 | | | $ | 3,402 | | | 0.26 | % |
| Total Funded Debt Investments - Australia | | | | | | | | | | | | | | | | $ | 3,402 | | | $ | 3,402 | | | 0.26 | % |
| Total Funded Debt Investments | | | | | | | | | | | | | | | | $ | 2,354,769 | | | $ | 2,236,956 | | | 168.68 | % |
| Equity - United States | | | | | | | | | | | | | | | | | | | | |
| Dealer Tire Holdings, LLC (30) | | | | | | | | | | | | | | | | | | | | |
| Distribution & Logistics | | Preferred shares (3)(15) | | — | | — | | — | | 09/2021 | | — | | 56,271 | | | $ | 65,202 | | | $ | 65,688 | | | 4.95 | % |
| Symplr Software Intermediate Holdings, Inc. (31) | | | | | | | | | | | | | | | | | | | | |
| Healthcare | | Preferred shares (4)(15) | | — | | — | | — | | 11/2018 | | — | | 7,500 | | | 11,986 | | | 11,396 | | | |
| | Preferred shares (3)(15) | | — | | — | | — | | 11/2018 | | — | | 2,586 | | | 4,132 | | | 3,929 | | | |
| | | | | | | | | | | | | | | | 16,118 | | | 15,325 | | | 1.16 | % |
| Knockout Intermediate Holdings I Inc. (41) | | | | | | | | | | | | | | | | | | | | |
| Software | | Preferred shares (3)(15) | | — | | — | | — | | 06/2022 | | — | | 15,150 | | | 14,961 | | | 14,661 | | | 1.11 | % |
| ACI Parent Inc. (36) | | | | | | | | | | | | | | | | | | | | |
| Healthcare | | Preferred shares (3)(15) | | — | | — | | — | | 08/2021 | | — | | 12,500 | | | 14,605 | | | 14,068 | | | 1.06 | % |
| Project Essential Super Parent, Inc. (34) | | | | | | | | | | | | | | | | | | | | |
| Software | | Preferred shares (3)(15) | | — | | — | | — | | 04/2021 | | — | | 10,000 | | | 11,885 | | | 11,569 | | | 0.87 | % |
| | | | | | | | | | | | | | | | | | | | |
| | | | | | | | | | | | | | | | | | | | |
The accompanying notes are an integral part of these consolidated financial statements.
129
New Mountain Finance Corporation
Consolidated Schedule of Investments (Continued)
December 31, 2022
(in thousands, except shares)
| | | | | | | | | | | | | | | | | | | | | | | | | | | | | | | | | | | | | | | | | | | | | | | | | | | | | | | | | | | | | | |
| Portfolio Company, Location and Industry(1) | | Type of
Investment | | Reference | | Spread | | Interest Rate (19) | | Acquisition Date | | Maturity/Expiration
Date | | Principal
Amount,
Par Value
or Shares (17) | | Cost | | Fair Value | | Percent of
Net
Assets |
| Diamond Parent Holdings Corp. (35) | | | | | | | | | | | | | | | | | | | | |
| Diligent Preferred Issuer, Inc. | | | | | | | | | | | | | | | | | | | | |
| Software | | Preferred shares (3)(15) | | — | | — | | — | | 04/2021 | | — | | 10,000 | | | $ | 11,518 | | | $ | 11,304 | | | 0.85 | % |
| OEC Holdco, LLC (22) | | | | | | | | | | | | | | | | | | | | |
| Software | | Preferred shares (12)(15) | | — | | — | | — | | 12/2021 | | — | | 7,214 | | | 7,565 | | | 7,214 | | | 0.54 | % |
| HB Wealth Management, LLC (37) | | | | | | | | | | | | | | | | | | | | |
| Financial Services | | Preferred shares (11)(15) | | — | | — | | — | | 09/2021 | | — | | 48,303 | | | 4,794 | | | 5,126 | | | 0.39 | % |
| FS WhiteWater Holdings, LLC (38) | | | | | | | | | | | | | | | | | | | | |
| Consumer Services | | Ordinary shares (5)(15) | | — | | — | | — | | 12/2021 | | — | | 50,000 | | | 5,000 | | | 4,686 | | | 0.35 | % |
| Appriss Health Holdings, Inc. (23) | | | | | | | | | | | | | | | | | | | | |
| Appriss Health Intermediate Holdings, Inc. | | | | | | | | | | | | | | | | | | | | |
| Healthcare | | Preferred shares (3)(15) | | — | | — | | — | | 05/2021 | | — | | 2,333 | | | 2,755 | | | 2,628 | | | 0.20 | % |
| OA Topco, L.P. (40) | | | | | | | | | | | | | | | | | | | | |
| Healthcare | | Ordinary shares (3)(15) | | — | | — | | — | | 12/2021 | | — | | 2,000,000 | | | 2,000 | | | 2,000 | | | 0.15 | % |
| Pioneer Topco I, L.P. (39) | | | | | | | | | | | | | | | | | | | | |
| Software | | Ordinary shares (13)(15) | | — | | — | | — | | 11/2021 | | — | | 199,980 | | | 1,999 | | | 1,631 | | | 0.12 | % |
| Ancora Acquisition LLC | | | | | | | | | | | | | | | | | | | | |
| Education | | Preferred shares (9)(15) | | — | | — | | — | | 08/2013 | | — | | 372 | | | 83 | | | 158 | | | 0.01 | % |
| Education Management Corporation (20) | | | | | | | | | | | | | | | | | | | | |
| Education | | Preferred shares (2) | | — | | — | | — | | 01/2015 | | — | | 3,331 | | | 200 | | | — | | | |
| | Preferred shares (3) | | — | | — | | — | | 01/2015 | | — | | 1,879 | | | 113 | | | — | | | |
| | Ordinary shares (2) | | — | | — | | — | | 01/2015 | | — | | 2,994,065 | | | 100 | | | — | | | |
| | Ordinary shares (3) | | — | | — | | — | | 01/2015 | | — | | 1,688,976 | | | 56 | | | — | | | |
| | | | | | | | | | | | | | | | 469 | | | — | | | — | % |
| AAC Lender Holdings, LLC (33) | | | | | | | | | | | | | | | | | | | | |
| Education | | Ordinary shares (3)(15) | | — | | — | | — | | 03/2021 | | — | | 758 | | | — | | | — | | | — | % |
| Total Shares - United States | | | | | | | | | | | | | | | | $ | 158,954 | | | $ | 156,058 | | | 11.77 | % |
| Equity - Hong Kong | | | | | | | | | | | | | | | | | | | | |
| Bach Special Limited (Bach Preference Limited)** | | | | | | | | | | | | | | | | | | | | |
| Education | | Preferred shares (3)(15)(29) | | — | | — | | — | | 09/2017 | | — | | 108,620 | | | $ | 10,782 | | | $ | 10,748 | | | 0.81 | % |
| Total Shares - Hong Kong | | | | | | | | | | | | | | | | $ | 10,782 | | | $ | 10,748 | | | 0.81 | % |
| Total Shares | | | | | | | | | | | | | | | | $ | 169,736 | | | $ | 166,806 | | | 12.58 | % |
| Total Funded Investments | | | | | | | | | | | | | | | | $ | 2,524,505 | | | $ | 2,403,762 | | | 181.25 | % |
| | | | | | | | | | | | | | | | | | | | |
| | | | | | | | | | | | | | | | | | | | |
The accompanying notes are an integral part of these consolidated financial statements.
130
New Mountain Finance Corporation
Consolidated Schedule of Investments (Continued)
December 31, 2022
(in thousands, except shares)
| | | | | | | | | | | | | | | | | | | | | | | | | | | | | | | | | | | | | | | | | | | | | | | | | | | | | | | | | | | | | | |
| Portfolio Company, Location and Industry(1) | | Type of
Investment | | Reference | | Spread | | Interest Rate (19) | | Acquisition Date | | Maturity/Expiration
Date | | Principal
Amount,
Par Value
or Shares (17) | | Cost | | Fair Value | | Percent of
Net
Assets |
| Unfunded Debt Investments - United States | | | | | | | | | | | | | | | | | | | | |
| Ansira Holdings, Inc | | | | | | | | | | | | | | | | | | | | |
| Business Services | | First lien (3)(15)(18) - Undrawn | | — | | — | | — | | 11/2022 | | 11/2024 | | $ | 1,161 | | | $ | — | | | $ | — | | | — | % |
| AAC Lender Holdings, LLC (33) | | | | | | | | | | | | | | | | | | | | |
| American Achievement Corporation (aka AAC Holding Corp.) | | | | | | | | | | | | | | | | | | | | |
| Education | | First lien (3)(15)(18) - Undrawn | | — | | — | | — | | 01/2021 | | 09/2026 | | 2,652 | | | — | | | — | | | — | % |
| Bullhorn, Inc. | | | | | | | | | | | | | | | | | | | | |
| Software | | First lien (3)(15)(18) - Undrawn | | — | | — | | — | | 09/2019 | | 09/2026 | | 460 | | | (3) | | | — | | | — | % |
| Appriss Health Holdings, Inc. (23) | | | | | | | | | | | | | | | | | | | | |
| Appriss Health, LLC | | | | | | | | | | | | | | | | | | | | |
| Healthcare | | First lien (3)(15)(18) - Undrawn | | — | | — | | — | | 05/2021 | | 05/2027 | | 417 | | | (4) | | | — | | | — | % |
| Coyote Buyer, LLC | | | | | | | | | | | | | | | | | | | | |
| Specialty Chemicals & Materials | | First lien (3)(15)(18) - Undrawn | | — | | — | | — | | 03/2020 | | 02/2025 | | 1,013 | | | (5) | | | — | | | — | % |
| Calabrio, Inc. | | | | | | | | | | | | | | | | | | | | |
| Software | | First lien (3)(15)(18) - Undrawn | | — | | — | | — | | 04/2021 | | 04/2027 | | 637 | | | (5) | | | — | | | — | % |
| Kele Holdco, Inc. | | | | | | | | | | | | | | | | | | | | |
| Distribution & Logistics | | First lien (3)(15)(18) - Undrawn | | — | | — | | — | | 02/2020 | | 02/2026 | | 1,799 | | | (9) | | | — | | | — | % |
| Granicus, Inc. | | | | | | | | | | | | | | | | | | | | |
| Software | | First lien (3)(15)(18) - Undrawn | | — | | — | | — | | 01/2021 | | 01/2027 | | 1,604 | | | (12) | | | — | | | — | % |
| Diamond Parent Holdings Corp. (35) | | | | | | | | | | | | | | | | | | | | |
| Diligent Corporation | | | | | | | | | | | | | | | | | | | | |
| Software | | First lien (3)(15)(18) - Undrawn | | — | | — | | — | | 03/2021 | | 08/2025 | | 2,537 | | | (13) | | | — | | | — | % |
| Apptio, Inc. | | | | | | | | | | | | | | | | | | | | |
| Software | | First lien (3)(15)(18) - Undrawn | | — | | — | | — | | 01/2019 | | 01/2025 | | 827 | | | (17) | | | — | | | — | % |
| Associations, Inc. | | | | | | | | | | | | | | | | | | | | |
| Business Services | | First lien (3)(15)(18) - Undrawn | | — | | — | | — | | 07/2021 | | 07/2027 | | 3,543 | | | (18) | | | — | | | — | % |
| | | | | | | | | | | | | | | | | | | | |
| | | | | | | | | | | | | | | | | | | | |
The accompanying notes are an integral part of these consolidated financial statements.
131
New Mountain Finance Corporation
Consolidated Schedule of Investments (Continued)
December 31, 2022
(in thousands, except shares)
| | | | | | | | | | | | | | | | | | | | | | | | | | | | | | | | | | | | | | | | | | | | | | | | | | | | | | | | | | | | | | |
| Portfolio Company, Location and Industry(1) | | Type of
Investment | | Reference | | Spread | | Interest Rate (19) | | Acquisition Date | | Maturity/Expiration
Date | | Principal
Amount,
Par Value
or Shares (17) | | Cost | | Fair Value | | Percent of
Net
Assets |
| Safety Borrower Holdings LLC | | | | | | | | | | | | | | | | | | | | |
| Software | | First lien (3)(15)(18) - Undrawn | | — | | — | | — | | 09/2021 | | 09/2027 | | $ | 512 | | | $ | (3) | | | $ | (8) | | | (0.00)% |
| Bluefin Holding, LLC | | | | | | | | | | | | | | | | | | | | |
| Software | | First lien (3)(15)(18) - Undrawn | | — | | — | | — | | 09/2019 | | 09/2024 | | 303 | | | (5) | | | (9) | | | (0.00)% |
| Sun Acquirer Corp. | | | | | | | | | | | | | | | | | | | | |
| Consumer Services | | First lien (3)(15)(18) - Undrawn | | — | | — | | — | | 09/2021 | | 09/2027 | | 559 | | | (5) | | | (9) | | | |
| | First lien (2)(15)(18) - Undrawn | | — | | — | | — | | 09/2021 | | 09/2023 | | 152 | | | (1) | | | (3) | | | |
| | | | | | | | | | | | | | | | (6) | | | (12) | | | (0.00)% |
| Pye-Barker Fire & Safety, LLC | | | | | | | | | | | | | | | | | | | | |
| Business Services | | First lien (3)(15)(18) - Undrawn | | — | | — | | — | | 11/2021 | | 11/2024 | | 483 | | | (5) | | | (14) | | | (0.00)% |
| IG Investments Holdings, LLC | | | | | | | | | | | | | | | | | | | | |
| Business Services | | First lien (3)(15)(18) - Undrawn | | — | | — | | — | | 09/2021 | | 09/2027 | | 1,379 | | | (14) | | | (19) | | | (0.00)% |
| Notorious Topco, LLC | | | | | | | | | | | | | | | | | | | | |
| Consumer Products | | First lien (3)(15)(18) - Undrawn | | — | | — | | — | | 11/2021 | | 11/2023 | | 587 | | | (7) | | | (10) | | | |
| | First lien (3)(15)(18) - Undrawn | | — | | — | | — | | 11/2021 | | 05/2027 | | 734 | | | (6) | | | (12) | | | |
| | | | | | | | | | | | | | | | (13) | | | (22) | | | (0.00)% |
| PPV Intermediate Holdings, LLC | | | | | | | | | | | | | | | | | | | | |
| Consumer Services | | First lien (3)(15)(18) - Undrawn | | — | | — | | — | | 08/2022 | | 08/2029 | | 355 | | | (7) | | | (7) | | | |
| | First lien (4)(15)(18) - Undrawn | | — | | — | | — | | 08/2022 | | 08/2024 | | 885 | | | — | | | (17) | | | |
| | | | | | | | | | | | | | | | (7) | | | (24) | | | (0.00)% |
| CG Group Holdings, LLC | | | | | | | | | | | | | | | | | | | | |
| Specialty Chemicals & Materials | | First lien (3)(15)(18) - Undrawn | | — | | — | | — | | 07/2021 | | 07/2026 | | 226 | | | (3) | | | (25) | | | (0.00)% |
| Recorded Future, Inc. | | | | | | | | | | | | | | | | | | | | |
| Software | | First lien (3)(15)(18) - Undrawn | | — | | — | | — | | 08/2019 | | 07/2025 | | 2,981 | | | (20) | | | (25) | | | (0.00)% |
| USRP Holdings, Inc. | | | | | | | | | | | | | | | | | | | | |
| Business Services | | First lien (3)(15)(18) - Undrawn | | — | | — | | — | | 07/2021 | | 07/2027 | | 893 | | | (9) | | | (29) | | | (0.00)% |
| | | | | | | | | | | | | | | | | | | | |
| | | | | | | | | | | | | | | | | | | | |
The accompanying notes are an integral part of these consolidated financial statements.
132
New Mountain Finance Corporation
Consolidated Schedule of Investments (Continued)
December 31, 2022
(in thousands, except shares)
| | | | | | | | | | | | | | | | | | | | | | | | | | | | | | | | | | | | | | | | | | | | | | | | | | | | | | | | | | | | | | |
| Portfolio Company, Location and Industry(1) | | Type of
Investment | | Reference | | Spread | | Interest Rate (19) | | Acquisition Date | | Maturity/Expiration
Date | | Principal
Amount,
Par Value
or Shares (17) | | Cost | | Fair Value | | Percent of
Net
Assets |
| OA Topco, L.P. (40) | | | | | | | | | | | | | | | | | | | | |
| OA Buyer, Inc. | | | | | | | | | | | | | | | | | | | | |
| Healthcare | | First lien (3)(15)(18) - Undrawn | | — | | — | | — | | 12/2021 | | 12/2028 | | $ | 3,600 | | | $ | (36) | | | $ | (29) | | | (0.00)% |
| Avalara, Inc. | | | | | | | | | | | | | | | | | | | | |
| Software | | First lien (3)(15)(18) - Undrawn | | — | | — | | — | | 10/2022 | | 10/2028 | | 3,538 | | | (44) | | | (30) | | | (0.00)% |
| Trinity Air Consultants Holdings Corporation | | | | | | | | | | | | | | | | | | | | |
| Business Services | | First lien (3)(15)(18) - Undrawn | | — | | — | | — | | 06/2021 | | 06/2027 | | 1,501 | | | (15) | | | (12) | | | |
| | First lien (2)(15)(18) - Undrawn | | — | | — | | — | | 06/2021 | | 06/2023 | | 2,364 | | | — | | | (19) | | | |
| | | | | | | | | | | | | | | | (15) | | | (31) | | | (0.00)% |
| Pioneer Topco I, L.P. (39) | | | | | | | | | | | | | | | | | | | | |
| Pioneer Buyer I, LLC | | | | | | | | | | | | | | | | | | | | |
| Software | | First lien (3)(15)(18) - Undrawn | | — | | — | | — | | 11/2021 | | 11/2027 | | 2,446 | | | (24) | | | (32) | | | (0.00)% |
| iCIMS, Inc. | | | | | | | | | | | | | | | | | | | | |
| Software | | First lien (8)(15)(18) - Undrawn | | — | | — | | — | | 08/2022 | | 08/2024 | | 11,763 | | | — | | | — | | | |
| | First lien (3)(15)(18) - Undrawn | | — | | — | | — | | 08/2022 | | 08/2028 | | 4,218 | | | (37) | | | (37) | | | |
| | | | | | | | | | | | | | | | (37) | | | (37) | | | (0.00)% |
| Daxko Acquisition Corporation | | | | | | | | | | | | | | | | | | | | |
| Software | | First lien (3)(15)(18) - Undrawn | | — | | — | | — | | 10/2021 | | 10/2023 | | 524 | | | — | | | (15) | | | |
| | First lien (3)(15)(18) - Undrawn | | — | | — | | — | | 10/2021 | | 10/2027 | | 953 | | | (10) | | | (27) | | | |
| | | | | | | | | | | | | | | | (10) | | | (42) | | | (0.00)% |
| Community Brands ParentCo, LLC | | | | | | | | | | | | | | | | | | | | |
| Software | | First lien (3)(15)(18) - Undrawn | | — | | — | | — | | 02/2022 | | 02/2028 | | 425 | | | (4) | | | (14) | | | |
| | First lien (3)(15)(18) - Undrawn | | — | | — | | — | | 02/2022 | | 02/2024 | | 849 | | | — | | | (28) | | | |
| | | | | | | | | | | | | | | | (4) | | | (42) | | | (0.00)% |
| IMO Investor Holdings, Inc. | | | | | | | | | | | | | | | | | | | | |
| Healthcare | | First lien (3)(15)(18) - Undrawn | | — | | — | | — | | 05/2022 | | 05/2028 | | 1,254 | | | (13) | | | (13) | | | |
| | First lien (3)(15)(18) - Undrawn | | — | | — | | — | | 05/2022 | | 05/2024 | | 3,097 | | | — | | | (31) | | | |
| | | | | | | | | | | | | | | | (13) | | | (44) | | | (0.00)% |
| | | | | | | | | | | | | | | | | | | | |
| | | | | | | | | | | | | | | | | | | | |
The accompanying notes are an integral part of these consolidated financial statements.
133
New Mountain Finance Corporation
Consolidated Schedule of Investments (Continued)
December 31, 2022
(in thousands, except shares)
| | | | | | | | | | | | | | | | | | | | | | | | | | | | | | | | | | | | | | | | | | | | | | | | | | | | | | | | | | | | | | |
| Portfolio Company, Location and Industry(1) | | Type of
Investment | | Reference | | Spread | | Interest Rate (19) | | Acquisition Date | | Maturity/Expiration
Date | | Principal
Amount,
Par Value
or Shares (17) | | Cost | | Fair Value | | Percent of
Net
Assets |
| KPSKY Acquisition Inc. | | | | | | | | | | | | | | | | | | | | |
| Business Services | | First lien (2)(15)(18) - Undrawn | | — | | — | | — | | 06/2022 | | 06/2024 | | $ | 1,022 | | | $ | — | | | $ | (45) | | | (0.00)% |
| GC Waves Holdings, Inc. | | | | | | | | | | | | | | | | | | | | |
| Financial Services | | First lien (2)(15)(18) - Undrawn | | — | | — | | — | | 04/2022 | | 04/2024 | | 757 | | | — | | | (9) | | | |
| | First lien (3)(15)(18) - Undrawn | | — | | — | | — | | 10/2019 | | 08/2026 | | 2,963 | | | (22) | | | (36) | | | |
| | | | | | | | | | | | | | | | (22) | | | (45) | | | (0.00)% |
| Specialtycare, Inc. | | | | | | | | | | | | | | | | | | | | |
| Healthcare | | First lien (3)(15)(18) - Undrawn | | — | | — | | — | | 06/2021 | | 06/2026 | | 347 | | | (5) | | | (15) | | | |
| | First lien (3)(15)(18) - Undrawn | | — | | — | | — | | 06/2021 | | 06/2023 | | 868 | | | — | | | (36) | | | |
| | | | | | | | | | | | | | | | (5) | | | (51) | | | (0.00)% |
| Infogain Corporation | | | | | | | | | | | | | | | | | | | | |
| Business Services | | First lien (3)(15)(18) - Undrawn | | — | | — | | — | | 07/2021 | | 07/2026 | | 2,759 | | | (21) | | | (52) | | | (0.00)% |
| GS Acquisitionco, Inc. | | | | | | | | | | | | | | | | | | | | |
| Software | | First lien (3)(15)(18) - Undrawn | | — | | — | | — | | 08/2019 | | 05/2026 | | 5,917 | | | (36) | | | (53) | | | (0.00)% |
| NMC Crimson Holdings, Inc. | | | | | | | | | | | | | | | | | | | | |
| Healthcare | | First lien (3)(15)(18) - Undrawn | | — | | — | | — | | 03/2021 | | 03/2023 | | 9,029 | | | — | | | (63) | | | (0.00)% |
| Wealth Enhancement Group, LLC | | | | | | | | | | | | | | | | | | | | |
| Financial Services | | First lien (3)(15)(18) - Undrawn | | — | | — | | — | | 08/2021 | | 10/2027 | | 2,040 | | | (6) | | | (13) | | | |
| | First lien (3)(15)(18) - Undrawn | | — | | — | | — | | 05/2022 | | 05/2024 | | 8,327 | | | (21) | | | (53) | | | |
| | | | | | | | | | | | | | | | (27) | | | (66) | | | (0.00)% |
| DCA Investment Holding, LLC | | | | | | | | | | | | | | | | | | | | |
| Healthcare | | First lien (3)(15)(18) - Undrawn | | — | | — | | — | | 03/2021 | | 03/2023 | | 450 | | | — | | | (9) | | | |
| | First lien (3)(18) - Undrawn | | — | | — | | — | | 12/2022 | | 12/2024 | | 3,936 | | | — | | | (59) | | | |
| | | | | | | | | | | | | | | | — | | | (68) | | | (0.01) | % |
| Foreside Financial Group, LLC | | | | | | | | | | | | | | | | | | | | |
| Business Services | | First lien (3)(15)(18) - Undrawn | | — | | — | | — | | 05/2022 | | 09/2027 | | 2,095 | | | (21) | | | (21) | | | |
| | First lien (3)(15)(18) - Undrawn | | — | | — | | — | | 05/2022 | | 05/2024 | | 4,907 | | | — | | | (49) | | | |
| | | | | | | | | | | | | | | | (21) | | | (70) | | | (0.01) | % |
| | | | | | | | | | | | | | | | | | | | |
| | | | | | | | | | | | | | | | | | | | |
The accompanying notes are an integral part of these consolidated financial statements.
134
New Mountain Finance Corporation
Consolidated Schedule of Investments (Continued)
December 31, 2022
(in thousands, except shares)
| | | | | | | | | | | | | | | | | | | | | | | | | | | | | | | | | | | | | | | | | | | | | | | | | | | | | | | | | | | | | | |
| Portfolio Company, Location and Industry(1) | | Type of
Investment | | Reference | | Spread | | Interest Rate (19) | | Acquisition Date | | Maturity/Expiration
Date | | Principal
Amount,
Par Value
or Shares (17) | | Cost | | Fair Value | | Percent of
Net
Assets |
| FS WhiteWater Holdings, LLC (38) | | | | | | | | | | | | | | | | | | | | |
| FS WhiteWater Borrower, LLC | | | | | | | | | | | | | | | | | | | | |
| Consumer Services | | First lien (3)(15)(18) - Undrawn | | — | | — | | — | | 12/2021 | | 12/2027 | | $ | 910 | | | $ | (9) | | | $ | (25) | | | |
| | First lien (3)(15)(18) - Undrawn | | — | | — | | — | | 07/2022 | | 12/2024 | | 5,165 | | | (52) | | | (52) | | | |
| | | | | | | | | | | | | | | | (61) | | | (77) | | | (0.01) | % |
| Knockout Intermediate Holdings I Inc. (41) | | | | | | | | | | | | | | | | | | | | |
| Kaseya Inc. | | | | | | | | | | | | | | | | | | | | |
| Software | | First lien (3)(15)(18) - Undrawn | | — | | — | | — | | 06/2022 | | 06/2024 | | 3,851 | | | — | | | (56) | | | |
| | First lien (3)(15)(18) - Undrawn | | — | | — | | — | | 06/2022 | | 06/2029 | | 3,851 | | | (29) | | | (56) | | | |
| | | | | | | | | | | | | | | | (29) | | | (112) | | | (0.01) | % |
| TigerConnect, Inc. | | | | | | | | | | | | | | | | | | | | |
| Healthcare | | First lien (2)(15)(18) - Undrawn | | — | | — | | — | | 02/2022 | | 02/2023 | | 955 | | | — | | | (23) | | | |
| | First lien (3)(15)(18) - Undrawn | | — | | — | | — | | 02/2022 | | 02/2028 | | 4,267 | | | (43) | | | (102) | | | |
| | | | | | | | | | | | | | | | (43) | | | (125) | | | (0.01) | % |
| MRI Software LLC | | | | | | | | | | | | | | | | | | | | |
| Software | | First lien (3)(15)(18) - Undrawn | | — | | — | | — | | 01/2020 | | 02/2026 | | 2,002 | | | (10) | | | (45) | | | |
| | First lien (3)(15)(18) - Undrawn | | — | | — | | — | | 02/2022 | | 08/2023 | | 4,074 | | | — | | | (92) | | | |
| | | | | | | | | | | | | | | | (10) | | | (137) | | | (0.01) | % |
| YLG Holdings, Inc. | | | | | | | | | | | | | | | | | | | | |
| Business Services | | First lien (5)(15)(18) - Undrawn | | — | | — | | — | | 10/2021 | | 10/2023 | | 1,584 | | | (16) | | | (41) | | | |
| | First lien (3)(15)(18) - Undrawn | | — | | — | | — | | 11/2019 | | 10/2025 | | 3,968 | | | (20) | | | (104) | | | |
| | | | | | | | | | | | | | | | (36) | | | (145) | | | (0.01) | % |
| Fortis Solutions Group, LLC | | | | | | | | | | | | | | | | | | | | |
| Packaging | | First lien (3)(15)(18) - Undrawn | | — | | — | | — | | 10/2021 | | 10/2023 | | 81 | | | — | | | (2) | | | |
| | First lien (3)(15)(18) - Undrawn | | — | | — | | — | | 10/2021 | | 10/2027 | | 2,479 | | | (25) | | | (58) | | | |
| | First lien (3)(15)(18) - Undrawn | | — | | — | | — | | 06/2022 | | 06/2024 | | 4,886 | | | — | | | (114) | | | |
| | | | | | | | | | | | | | | | (25) | | | (174) | | | (0.01) | % |
| | | | | | | | | | | | | | | | | | | | |
| | | | | | | | | | | | | | | | | | | | |
The accompanying notes are an integral part of these consolidated financial statements.
135
New Mountain Finance Corporation
Consolidated Schedule of Investments (Continued)
December 31, 2022
(in thousands, except shares)
| | | | | | | | | | | | | | | | | | | | | | | | | | | | | | | | | | | | | | | | | | | | | | | | | | | | | | | | | | | | | | |
| Portfolio Company, Location and Industry(1) | | Type of
Investment | | Reference | | Spread | | Interest Rate (19) | | Acquisition Date | | Maturity/Expiration
Date | | Principal
Amount,
Par Value
or Shares (17) | | Cost | | Fair Value | | Percent of
Net
Assets |
| ACI Parent Inc. (36) | | | | | | | | | | | | | | | | | | | | |
| ACI Group Holdings, Inc. | | | | | | | | | | | | | | | | | | | | |
| Healthcare | | First lien (3)(15)(18) - Undrawn | | — | | — | | — | | 08/2021 | | 08/2027 | | $ | 2,095 | | | $ | (21) | | | $ | (71) | | | |
| | First lien (3)(15)(18) - Undrawn | | — | | — | | — | | 08/2021 | | 08/2023 | | 5,386 | | | — | | | (181) | | | |
| | | | | | | | | | | | | | | | (21) | | | (252) | | | (0.02) | % |
| Paw Midco, Inc. | | | | | | | | | | | | | | | | | | | | |
| AAH Topco, LLC | | | | | | | | | | | | | | | | | | | | |
| Consumer Services | | First lien (3)(15)(18) - Undrawn | | — | | — | | — | | 12/2021 | | 12/2027 | | 3,659 | | | (37) | | | (45) | | | |
| | First lien (4)(15)(18) - Undrawn | | — | | — | | — | | 01/2022 | | 12/2023 | | 4,231 | | | (42) | | | (52) | | | |
| | First lien (3)(15)(18) - Undrawn | | — | | — | | — | | 12/2021 | | 12/2023 | | 13,041 | | | (130) | | | (162) | | | |
| | | | | | | | | | | | | | | | (209) | | | (259) | | | (0.02) | % |
| AmeriVet Partners Management, Inc. | | | | | | | | | | | | | | | | | | | | |
| Consumer Services | | First lien (3)(15)(18) - Undrawn | | — | | — | | — | | 02/2022 | | 02/2028 | | 1,969 | | | (10) | | | (39) | | | |
| | First lien (3)(15)(18) - Undrawn | | — | | — | | — | | 02/2022 | | 02/2024 | | 11,718 | | | — | | | (234) | | | |
| | | | | | | | | | | | | | | | (10) | | | (273) | | | (0.02) | % |
| DOCS, MSO, LLC | | | | | | | | | | | | | | | | | | | | |
| Healthcare | | First lien (3)(15)(18) - Undrawn | | — | | — | | — | | 06/2022 | | 06/2028 | | 2,405 | | | — | | | (66) | | | |
| | First lien (4)(15)(18) - Undrawn | | — | | — | | — | | 06/2022 | | 06/2024 | | 2,457 | | | — | | | (67) | | | |
| | First lien (3)(15)(18) - Undrawn | | — | | — | | — | | 06/2022 | | 06/2024 | | 6,561 | | | — | | | (180) | | | |
| | | | | | | | | | | | | | | | — | | | (313) | | | (0.02) | % |
| Deca Dental Holdings LLC | | | | | | | | | | | | | | | | | | | | |
| Healthcare | | First lien (3)(15)(18) - Undrawn | | — | | — | | — | | 08/2021 | | 08/2027 | | 404 | | | (4) | | | (17) | | | |
| | First lien (3)(15)(18) - Undrawn | | — | | — | | — | | 08/2021 | | 08/2023 | | 9,080 | | | — | | | (390) | | | |
| | | | | | | | | | | | | | | | (4) | | | (407) | | | (0.03) | % |
| Total Unfunded Debt Investments - United States | | | | | | | | | | | | | | | | $ | (934) | | | $ | (3,261) | | | (0.25) | % |
| Unfunded Debt Investments - Netherlands | | | | | | | | | | | | | | | | | | | | |
| Tahoe Finco, LLC** | | | | | | | | | | | | | | | | | | | | |
| Information Technology | | First lien (3)(15)(18) - Undrawn | | — | | — | | — | | 10/2021 | | 10/2027 | | $ | 4,439 | | | $ | (44) | | | $ | (71) | | | (0.01) | % |
| Total Unfunded Debt Investments - Netherlands | | | | | | | | | | | | | | | | $ | (44) | | | $ | (71) | | | (0.01) | % |
| | | | | | | | | | | | | | | | | | | | |
| | | | | | | | | | | | | | | | | | | | |
The accompanying notes are an integral part of these consolidated financial statements.
136
New Mountain Finance Corporation
Consolidated Schedule of Investments (Continued)
December 31, 2022
(in thousands, except shares)
| | | | | | | | | | | | | | | | | | | | | | | | | | | | | | | | | | | | | | | | | | | | | | | | | | | | | | | | | | | | | | |
| Portfolio Company, Location and Industry(1) | | Type of
Investment | | Reference | | Spread | | Interest Rate (19) | | Acquisition Date | | Maturity/Expiration
Date | | Principal
Amount,
Par Value
or Shares (17) | | Cost | | Fair Value | | Percent of
Net
Assets |
| Unfunded Debt Investments - Australia | | | | | | | | | | | | | | | | | | | | |
| Atlas AU Bidco Pty Ltd** | | | | | | | | | | | | | | | | | | | | |
| Business Services | | First lien (3)(18) - Undrawn | | — | | — | | — | | 12/2022 | | 12/2028 | | $ | 320 | | | $ | (5) | | | $ | (5) | | | — | % |
| Total Unfunded Debt Investments - Australia | | | | | | | | | | | | | | | | $ | (5) | | | $ | (5) | | | — | % |
| Total Unfunded Debt Investments | | | | | | | | | | | | | | | | $ | (983) | | | $ | (3,337) | | | (0.25) | % |
| Total Non-Controlled/Non-Affiliated Investments | | | | | | | | | | | | | | | | $ | 2,523,522 | | | $ | 2,400,425 | | | 181.00 | % |
| Non-Controlled/Affiliated Investments (44) | | | | | | | | | | | | | | | | | | | | |
| Funded Debt Investments - United States | | | | | | | | | | | | | | | | | | | | |
| TVG-Edmentum Holdings, LLC (24) | | | | | | | | | | | | | | | | | | | | |
| Edmentum Ultimate Holdings, LLC | | | | | | | | | | | | | | | | | | | | |
| Education | | Subordinated (3)(15) | | FIXED(Q)* | | 6.50% + 6.50%/PIK | | 13.00% | | 12/2020 | | 01/2027 | | $ | 16,473 | | | $ | 16,362 | | | $ | 16,473 | | | 1.24 | % |
| Sierra Hamilton Holdings Corporation | | | | | | | | | | | | | | | | | | | | |
| Energy | | Second lien (3)(15) | | FIXED(Q)(42)* | | 15.00%/PIK | | 15.00% | | 09/2019 | | 09/2023 | | 5 | | | 5 | | | — | | | — | % |
| Permian Holdco 3, Inc. | | | | | | | | | | | | | | | | | | | | |
| Permian Trust | | | | | | | | | | | | | | | | | | | | |
| Energy | | First lien (10)(15) | | FIXED(Q)(42)* | | 10.00%/PIK | | 10.00% | | 03/2021 | | — | | 247 | | | — | | | — | | | |
| | First lien (3)(15) | | L(M)(42)* | | 10.00%/PIK | | 11.00% | | 07/2020 | | — | | 3,409 | | | — | | | — | | | |
| | | | | | | | | | | | | | | | — | | | — | | | — | % |
| Total Funded Debt Investments - United States | | | | | | | | | | | | | | | | $ | 16,367 | | | $ | 16,473 | | | 1.24 | % |
| Equity - United States | | | | | | | | | | | | | | | | | | | | |
| TVG-Edmentum Holdings, LLC | | | | | | | | | | | | | | | | | | | | |
| Education | | Ordinary shares (3)(15) | | — | | — | | — | | 12/2020 | | — | | 48,899 | | | $ | 56,821 | | | $ | 110,314 | | | 8.32 | % |
| Sierra Hamilton Holdings Corporation | | | | | | | | | | | | | | | | | | | | |
| Energy | | Ordinary shares (2)(15) | | — | | — | | — | | 07/2017 | | — | | 25,000,000 | | | 11,501 | | | 3,599 | | | |
| | Ordinary shares (3)(15) | | — | | — | | — | | 07/2017 | | — | | 2,786,000 | | | 1,282 | | | 401 | | | |
| | | | | | | | | | | | | | | | 12,783 | | | 4,000 | | | 0.30 | % |
| Total Shares - United States | | | | | | | | | | | | | | | | $ | 69,604 | | | $ | 114,314 | | | 8.62 | % |
| Total Non-Controlled/Affiliated Investments | | | | | | | | | | | | | | | | $ | 85,971 | | | $ | 130,787 | | | 9.86 | % |
| | | | | | | | | | | | | | | | | | | | |
| | | | | | | | | | | | | | | | | | | | |
The accompanying notes are an integral part of these consolidated financial statements.
137
New Mountain Finance Corporation
Consolidated Schedule of Investments (Continued)
December 31, 2022
(in thousands, except shares)
| | | | | | | | | | | | | | | | | | | | | | | | | | | | | | | | | | | | | | | | | | | | | | | | | | | | | | | | | | | | | | |
| Portfolio Company, Location and Industry(1) | | Type of
Investment | | Reference | | Spread | | Interest Rate (19) | | Acquisition Date | | Maturity/Expiration
Date | | Principal
Amount,
Par Value
or Shares (17) | | Cost | | Fair Value | | Percent of
Net
Assets |
| Controlled Investments (45) | | | | | | | | | | | | | | | | | | | | |
| Funded Debt Investments - United States | | | | | | | | | | | | | | | | | | | | |
| New Benevis Topco, LLC (32) | | | | | | | | | | | | | | | | | | | | |
| New Benevis Holdco, Inc. | | | | | | | | | | | | | | | | | | | | |
| Healthcare | | First lien (2)(15) | | L(Q)* | | 2.50% + 7.00%/PIK | | 14.23% | | 10/2020 | | 04/2025 | | $ | 35,541 | | | $ | 35,541 | | | $ | 35,541 | | | |
| | First lien (8)(15) | | L(Q)* | | 2.50% + 7.00%/PIK | | 14.23% | | 10/2020 | | 04/2025 | | 8,720 | | | 8,720 | | | 8,720 | | | |
| | First lien (3)(15) | | L(Q)* | | 2.50% + 7.00%/PIK | | 14.23% | | 10/2020 | | 04/2025 | | 4,282 | | | 4,282 | | | 4,282 | | | |
| | Subordinated (3)(15) | | FIXED(M)* | | 12.00%/PIK | | 12.00% | | 10/2020 | | 10/2025 | | 18,687 | | | 16,874 | | | 14,950 | | | |
| | | | | | | | | | | | | | | | 65,417 | | | 63,493 | | | 4.79 | % |
| UniTek Global Services, Inc. | | | | | | | | | | | | | | | | | | | | |
| Business Services | | First lien (2)(15) | | SOFR(S)* | | 5.50% + 2.00%/PIK | | 10.76% | | 06/2018 | | 08/2024 | | 22,367 | | | 21,885 | | | 22,367 | | | |
| | First lien (2)(15) | | SOFR(S)* | | 5.50% + 2.00%/PIK | | 10.76% | | 06/2018 | | 08/2024 | | 3,949 | | | 3,855 | | | 3,949 | | | |
| | Second lien (3)(15) | | FIXED(Q)* | | 15.00%/PIK | | 15.00% | | 12/2020 | | 02/2025 | | 11,575 | | | 11,574 | | | 10,384 | | | |
| | Second lien (3)(15) | | FIXED(Q)* | | 15.00%/PIK | | 15.00% | | 07/2022 | | 02/2025 | | 5,131 | | | 5,131 | | | 4,603 | | | |
| | | | | | | | | | | | | | | | 42,445 | | | 41,303 | | | 3.11 | % |
| New Permian Holdco, Inc. | | | | | | | | | | | | | | | | | | | | |
| New Permian Holdco, L.L.C. | | | | | | | | | | | | | | | | | | | | |
| Energy | | First lien (3)(15) | | FIXED(M)* | | 18.00%/PIK | | 18.00% | | 10/2020 | | 12/2024 | | 21,779 | | | 21,779 | | | 21,779 | | | |
| | First lien (3)(15)(18) - Drawn | | L(M)* | | 9.00%/PIK | | 13.12% | | 10/2020 | | 12/2024 | | 9,785 | | | 9,785 | | | 9,785 | | | |
| | | | | | | | | | | | | | | | 31,564 | | | 31,564 | | | 2.38 | % |
| NHME Holdings Corp. (28) | | | | | | | | | | | | | | | | | | | | |
| National HME, Inc. | | | | | | | | | | | | | | | | | | | | |
| Healthcare | | Second lien (3)(15) | | FIXED(Q)(42)* | | 12.00%/PIK | | 12.00% | | 11/2018 | | 05/2024 | | 13,013 | | | 12,583 | | | 5,381 | | | |
| | Second lien (3)(15) | | FIXED(Q)(42)* | | 12.00%/PIK | | 12.00% | | 11/2018 | | 05/2024 | | 14,500 | | | 12,693 | | | — | | | |
| | | | | | | | | | | | | | | | 25,276 | | | 5,381 | | | 0.41 | % |
| Total Funded Debt Investments - United States | | | | | | | | | | | | | | | | $ | 164,702 | | | $ | 141,741 | | | 10.69 | % |
| Equity - United States | | | | | | | | | | | | | | | | | | | | |
| NMFC Senior Loan Program III LLC** | | | | | | | | | | | | | | | | | | | | |
| Investment Fund | | Membership interest (3)(15) | | — | | — | | — | | 05/2018 | | — | | — | | | $ | 140,000 | | | $ | 140,000 | | | 10.56 | % |
| NMFC Senior Loan Program IV LLC** | | | | | | | | | | | | | | | | | | | | |
| Investment Fund | | Membership interest (3)(15) | | — | | — | | — | | 05/2021 | | — | | — | | | 112,400 | | | 112,400 | | | 8.48 | % |
| | | | | | | | | | | | | | | | | | | | |
| | | | | | | | | | | | | | | | | | | | |
The accompanying notes are an integral part of these consolidated financial statements.
138
New Mountain Finance Corporation
Consolidated Schedule of Investments (Continued)
December 31, 2022
(in thousands, except shares)
| | | | | | | | | | | | | | | | | | | | | | | | | | | | | | | | | | | | | | | | | | | | | | | | | | | | | | | | | | | | | | |
| Portfolio Company, Location and Industry(1) | | Type of
Investment | | Reference | | Spread | | Interest Rate (19) | | Acquisition Date | | Maturity/Expiration
Date | | Principal
Amount,
Par Value
or Shares (17) | | Cost | | Fair Value | | Percent of
Net
Assets |
| NM NL Holdings, L.P.** | | | | | | | | | | | | | | | | | | | | |
| Net Lease | | Membership interest (7)(15) | | — | | — | | — | | 06/2018 | | — | | — | | | $ | 76,370 | | | $ | 94,305 | | | 7.11 | % |
| New Benevis Topco, LLC (32) | | | | | | | | | | | | | | | | | | | | |
| Healthcare | | Ordinary shares (2)(15) | | — | | — | | — | | 10/2020 | | — | | 269,027 | | | 27,154 | | | 34,490 | | | |
| | Ordinary shares (8)(15) | | — | | — | | — | | 10/2020 | | — | | 66,007 | | | 6,662 | | | 8,462 | | | |
| | Ordinary shares (3)(15) | | — | | — | | — | | 10/2020 | | — | | 60,068 | | | 6,106 | | | 7,701 | | | |
| | | | | | | | | | | | | | | | 39,922 | | | 50,653 | | | 3.82 | % |
| QID TRH Holdings LLC (21) | | | | | | | | | | | | | | | | | | | | |
| Haven Midstream Holdings LLC(21) | | | | | | | | | | | | | | | | | | | | |
| Specialty Chemicals & Materials | | Ordinary shares (14)(15) | | — | | — | | — | | 10/2021 | | — | | 80 | | | — | | | 35,679 | | | |
| | Profit Interest (6)(15) | | — | | — | | — | | 10/2021 | | — | | 5 | | | — | | | 109 | | | |
| | | | | | | | | | | | | | | | — | | | 35,788 | | | 2.70 | % |
| New Permian Holdco, Inc. | | | | | | | | | | | | | | | | | | | | |
| Energy | | Ordinary shares (3)(15) | | — | | — | | — | | 10/2020 | | — | | 100 | | | 11,155 | | | 26,000 | | | 1.96 | % |
| UniTek Global Services, Inc. | | | | | | | | | | | | | | | | | | | | |
| Business Services | | Preferred shares (3)(15)(27) | | — | | — | | — | | 08/2018 | | — | | 15,434,113 | | | 15,434 | | | 11,626 | | | |
| | Preferred shares (3)(15)(27) | | — | | — | | — | | 08/2019 | | — | | 9,173,217 | | | 9,173 | | | 7,670 | | | |
| | Preferred shares (3)(15)(26)(42) | | — | | — | | — | | 06/2017 | | — | | 19,795,435 | | | 19,795 | | | 6,491 | | | |
| | Preferred shares (2)(15)(25)(42) | | — | | — | | — | | 01/2015 | | — | | 29,326,545 | | | 26,946 | | | — | | | |
| | Preferred shares (3)(15)(25)(42) | | — | | — | | — | | 01/2015 | | — | | 8,104,462 | | | 7,447 | | | — | | | |
| | Ordinary shares (2)(15) | | — | | — | | — | | 01/2015 | | — | | 2,096,477 | | | 1,926 | | | — | | | |
| | Ordinary shares (3)(15) | | — | | — | | — | | 01/2015 | | — | | 1,993,749 | | | 533 | | | — | | | |
| | | | | | | | | | | | | | | | 81,254 | | | 25,787 | | | 1.94 | % |
| NM CLFX LP | | | | | | | | | | | | | | | | | | | | |
| Net Lease | | Membership interest (7)(15) | | — | | — | | — | | 10/2017 | | — | | — | | | 12,538 | | | 16,172 | | | 1.22 | % |
| NM YI, LLC | | | | | | | | | | | | | | | | | | | | |
| Net Lease | | Membership interest (7)(15) | | — | | — | | — | | 09/2019 | | — | | — | | | 6,272 | | | 9,481 | | | 0.71 | % |
| NM GP Holdco, LLC** | | | | | | | | | | | | | | | | | | | | |
| Net Lease | | Membership interest (7)(15) | | — | | — | | — | | 06/2018 | | — | | — | | | 861 | | | 1,028 | | | 0.08 | % |
| NHME Holdings Corp.(28) | | | | | | | | | | | | | | | | | | | | |
| Healthcare | | Ordinary shares (3)(15) | | — | | — | | — | | 11/2018 | | — | | 640,000 | | | 4,000 | | | — | | | — | % |
| NM GLCR LP | | | | | | | | | | | | | | | | | | | | |
| Net Lease | | Membership interest (7)(15) | | — | | — | | — | | 02/2018 | | — | | — | | | — | | | — | | | — | % |
| | | | | | | | | | | | | | | | | | | | |
| | | | | | | | | | | | | | | | | | | | |
The accompanying notes are an integral part of these consolidated financial statements.
139
New Mountain Finance Corporation
Consolidated Schedule of Investments (Continued)
December 31, 2022
(in thousands, except shares)
| | | | | | | | | | | | | | | | | | | | | | | | | | | | | | | | | | | | | | | | | | | | | | | | | | | | | | | | | | | | | | |
| Portfolio Company, Location and Industry(1) | | Type of
Investment | | Reference | | Spread | | Interest Rate (19) | | Acquisition Date | | Maturity/Expiration
Date | | Principal
Amount,
Par Value
or Shares (17) | | Cost | | Fair Value | | Percent of
Net
Assets |
| NM APP US LLC | | | | | | | | | | | | | | | | | | | | |
| Net Lease | | Membership interest (7)(15) | | — | | — | | — | | 09/2016 | | — | | — | | | $ | — | | | $ | — | | | — | % |
| NM DRVT LLC | | | | | | | | | | | | | | | | | | | | |
| Net Lease | | Membership interest (7)(15) | | — | | — | | — | | 11/2016 | | — | | — | | | — | | | — | | | — | % |
| NM JRA LLC | | | | | | | | | | | | | | | | | | | | |
| Net Lease | | Membership interest (7)(15) | | — | | — | | — | | 08/2016 | | — | | — | | | — | | | — | | | — | % |
| NM KRLN LLC | | | | | | | | | | | | | | | | | | | | |
| Net Lease | | Membership interest (7)(15) | | — | | — | | — | | 11/2016 | | — | | — | | | — | | | — | | | — | % |
| Total Shares - United States | | | | | | | | | | | | | | | | $ | 484,772 | | | $ | 511,614 | | | 38.58 | % |
| Equity - Canada | | | | | | | | | | | | | | | | | | | | |
| NM APP Canada Corp.** | | | | | | | | | | | | | | | | | | | | |
| Net Lease | | Membership interest (7)(15) | | — | | — | | — | | 09/2016 | | — | | — | | | $ | — | | | $ | — | | | — | % |
| Total Shares - Canada | | | | | | | | | | | | | | | | $ | — | | | $ | — | | | — | % |
| Total Shares | | | | | | | | | | | | | | | | $ | 484,772 | | | $ | 511,614 | | | 38.58 | % |
| Warrants - United States | | | | | | | | | | | | | | | | | | | | |
| UniTek Global Services, Inc. | | | | | | | | | | | | | | | | | | | | |
| Business Services | | Warrants (3)(15) | | — | | — | | — | | 12/2020 | | 02/2025 | | 13,305 | | | $ | — | | | $ | 36,680 | | | 2.77 | % |
| NHME Holdings Corp. (28) | | | | | | | | | | | | | | | | | | | | |
| Healthcare | | Warrants (3)(15) | | — | | — | | — | | 11/2018 | | — | | 160,000 | | | 1,000 | | | — | | | — | % |
| Total Warrants - United States | | | | | | | | | | | | | | | | $ | 1,000 | | | $ | 36,680 | | | 2.77 | % |
| Total Funded Investments | | | | | | | | | | | | | | | | $ | 650,474 | | | $ | 690,035 | | | 52.03 | % |
| Unfunded Debt Investments - United States | | | | | | | | | | | | | | | | | | | | |
| New Permian Holdco, Inc. | | | | | | | | | | | | | | | | | | | | |
| New Permian Holdco, L.L.C. | | | | | | | | | | | | | | | | | | | | |
| Energy | | First lien (3)(15)(18) - Undrawn | | — | | — | | — | | 10/2020 | | 12/2024 | | $ | 1,577 | | | $ | — | | | $ | — | | | — | % |
| Haven Midstream Holdings LLC (21) | | | | | | | | | | | | | | | | | | | | |
| Haven Midstream LLC | | | | | | | | | | | | | | | | | | | | |
| Specialty Chemicals & Materials | | First lien (3)(15)(18) - Undrawn | | — | | — | | — | | 12/2021 | | 10/2026 | | 8,000 | | | — | | | — | | | — | % |
| Total Unfunded Debt Investments - United States | | | | | | | | | | | | | | | | — | | | — | | | — | % |
| Total Controlled Investments | | | | | | | | | | | | | | | | $ | 650,474 | | | $ | 690,035 | | | 52.03 | % |
| Total Investments | | | | | | | | | | | | | | | | $ | 3,259,967 | | | $ | 3,221,247 | | | 242.89 | % |
| | | | | | | | | | | | | | | | | | | | |
(1)New Mountain Finance Corporation (the "Company") generally acquires its investments in private transactions exempt from registration under the Securities Act of 1933, as amended (the "Securities Act"). These investments are generally subject to certain limitations on resale, and may be deemed to be "restricted securities" under the Securities Act.
(2)Investment is pledged as collateral for the Holdings Credit Facility, a revolving credit facility among the Company, as the Collateral Manager, New Mountain Finance Holdings, L.L.C. ("NMF Holdings") as the Borrower, Wells Fargo Securities, LLC, as the Administrative Agent and Wells Fargo Bank, National Association, as the Lender and Collateral Custodian. See Note 7. Borrowings, for details.
(3)Investment is pledged as collateral for the NMFC Credit Facility, a revolving credit facility among the Company as the Borrower and Goldman Sachs Bank USA as the Administrative Agent and the Collateral Agent and Goldman Sachs Bank USA, Morgan Stanley Bank, N.A., Stifel Bank & Trust and MUFG Union Bank, N.A. as Lenders. See Note 7. Borrowings, for details.
(4)Investment is held in New Mountain Finance SBIC, L.P.
The accompanying notes are an integral part of these consolidated financial statements.
140
New Mountain Finance Corporation
Consolidated Schedule of Investments (Continued)
December 31, 2022
(in thousands, except shares)
(5)Investment is held in New Mountain Finance SBIC II, L.P.
(6)Investment is held in NMF QID NGL Holdings, Inc.
(7)Investment is held in New Mountain Net Lease Corporation.
(8)Investment is pledged as collateral for the DB Credit Facility, a revolving credit facility among New Mountain Finance DB, L.L.C as the Borrower and Deutsche Bank AG, New York Branch as the Facility Agent. See Note 7. Borrowings, for details.
(9)Investment is held in NMF Ancora Holdings, Inc.
(10)Investment is held in NMF Permian Holdings, LLC.
(11)Investment is held in NMF HB, Inc.
(12)Investment is held in NMF OEC, Inc.
(13)Investment is held in NMF Pioneer, Inc.
(14)Investment is held in NMF TRM, LLC.
(15)The fair value of the Company's investment is determined using unobservable inputs that are significant to the overall fair value measurement. See Note 4. Fair Value, for details.
(16)Investment is denominated in foreign currency and is translated into U.S. dollars as of the valuation date. As of December 31, 2022, the par value U.S. dollar equivalent of the first lien term loan, and drawn first lien term loan is $15,562 and $13,941, respectively. See Note 2. Summary of Significant Accounting Policies, for details.
(17)Par amount is denominated in United States Dollar unless otherwise noted, British Pound ("£") and/or Euro ("€").
(18)Par value amounts represent the drawn or undrawn (as indicated in type of investment) portion of revolving credit facilities or delayed draws. Cost amounts represent the cash received at settlement date net of the impact of paydowns and cash paid for drawn revolvers or delayed draws.
(19)All interest is payable in cash unless otherwise indicated. A majority of the variable rate debt investments bear interest at a rate that may be determined by reference to the London Interbank Offered Rate (L), the Prime Rate (P), the Sterling Overnight Interbank Average Rate (SONIA), Secured Overnight Financing Rate (SOFR), Euro Interbank Offered Rate (EURIBOR) and the alternative base rate (Base) and which resets daily (D), weekly (W), monthly (M), quarterly (Q), semi-annually (S) or annually (A). For each investment the current interest rate provided reflects the rate in effect as of December 31, 2022.
(20)The Company holds investments in Education Management Corporation and one related entity of Education Management Corporation. The Company holds series A-1 convertible preferred stock and common stock in Education Management Corporation and holds tranche A first lien term loans and a tranche B first lien term loan in Education Management II LLC, which is an indirect subsidiary of Education Management Corporation.
(21)The Company holds investments in multiple entities of Haven Midstream Holdings LLC. The Company holds 4.6% of the Class B profits interest in QID NGL, LLC (which at closing represented 97% of the ownership in the class B units in QID TRH Holdings, LLC), class A common units of Haven Midstream Holdings LLC., and holds a first lien revolver in Haven Midstream Holdings LLC.
(22)The Company holds preferred equity in OEC Holdco, LLC, and two second lien term loans in OEConnection LLC, a wholly-owned subsidiary of OEC Holdco, LLC. The preferred equity is entitled to receive prefenential dividends of 11.00% per annum.
(23)The Company holds investments in two wholly-owned subsidiaries of Appriss Health Holdings, Inc. The company holds a first lien term loan and a first lien revolver in Appriss Health, LLC, and preferred equity in Appriss Health Intermediate Holdings, Inc. The preferred equity is entitled to receive preferential dividends at a rate of 11.00% per annum.
(24)The Company holds ordinary shares in TVG-Edmentum Holdings, LLC, and subordinated notes in Edmentum Ultimate Holdings, LLC, a wholly-owned subsidiary of TVG-Edmentum Holdings, LLC. The ordinary shares are entitled to receive cumulative preferential dividends at a rate of 12.0% per annum.
(25)The Company holds preferred equity in UniTek Global Services, Inc. that is entitled to receive cumulative preferential dividends at a rate of 13.5% per annum payable in additional shares.
(26)The Company holds preferred equity in UniTek Global Services, Inc. that is entitled to receive cumulative preferential dividends at a rate of 19.0% per annum payable in additional shares.
(27)The Company holds preferred equity in UniTek Global Services, Inc. that is entitled to received cumulative preferential dividends at a rate of 20.0% per annum payable in additional shares.
(28)The Company holds ordinary shares and warrants in NHME Holdings Corp., as well as a Tranche A Term Loan and Tranche B Term Loan in National HME, Inc., a whollyowned subsidiary of NHME Holdings Corp.
(29)The Company holds preferred equity in Bach Special Limited (Bach Preference Limited) that is entitled to receive cumulative preferential dividends at a rate of 12.25% per annum payable in additional shares.
(30)The Company holds preferred equity in Dealer Tire Holdings, LLC that is entitled to receive cumulative preferential dividends at a rate of 7.00% per annum.
(31)The Company holds preferred equity in Symplr Software Intermediate Holdings, Inc. that is entitled to receive cumulative preferential dividends at a rate of L + 10.50% per annum.
The accompanying notes are an integral part of these consolidated financial statements.
141
New Mountain Finance Corporation
Consolidated Schedule of Investments (Continued)
December 31, 2022
(in thousands, except shares)
(32)The Company holds ordinary shares in New Benevis Topco, LLC, and holds first lien last out term loans and subordinated notes in New Benevis Holdco Inc., a wholly-owned subsidiary of New Benevis Topco, LLC.
(33)The Company holds ordinary shares in AAC Lender Holdings, LLC and a first lien term loan, first lien revolver and subordinated notes in American Achievement Corporation, a partially-owned subsidiary of AAC Lender Holdings, LLC.
(34)The Company holds preferred equity in Project Essential Super Parent, LLC that is entitled to receive cumulative preferential dividends at a rate of L + 9.50% per annum.
(35)The Company holds investments in two wholly-owned subsidiary of Diamond Parent Holdings Corp. The Company holds three first lien term loans and a first lien revolver in Diligent Corporation and preferred equity in Diligent Preferred Issuer Inc. The preferred equity in Diligent Preferred Issuer Inc. is entitled to receive cumulative preferential dividends at a rate 10.50% per annum.
(36)The Company holds investments in ACI Parent Inc. and a wholly-owned subsidiary of ACI Parent Inc. The Company holds a first lien term loan, a first lien delayed draw and a first lien revolver in ACI Group Holdings, Inc. and preferred equity in ACI Parent Inc. The preferred equity in ACI Parent Inc. is entitled to receive cumulative preferential dividends at a rate of 11.75% per annum.
(37)The Company holds preferred equity in HB Wealth Management, LLC that is entitled to receive cumulative preferential dividends at a rate of 4.00% per annum.
(38)The Company holds ordinary shares in FS WhiteWater Holdings, LLC, and a first lien term loan, a first lien revolver, and two first lien delayed draws in FS WhiteWater Borrower, LLC, a partially-owned subsidiary of FS WhiteWater Holdings, LLC.
(39)The Company holds ordinary shares in Pioneer Topco I, L.P., and a first lien term loan and a first lien revolver in Pioneer Buyer I, LLC, a wholly-owned subsidiary of Pioneer Topco I, L.P.
(40)The Company holds ordinary shares in OA Topco, L.P., and a first lien term loan and a first lien revolver in OA Buyer, Inc., a wholly-owned subsidiary of OA Topco, L.P.
(41)The Company holds preferred equity in Knockout Intermediate Holdings I Inc. and a first lien term loan, a first lien revolver and a first lien delayed draw in Kaseya, Inc., a wholly-owned subsidiary of Knockout Intermediate Holdings I Inc. The preferred equity is entitled to received cumulative preferential dividends at a rate of 11.75% per annum.
(42)Investment or a portion of the investment is on non-accrual status. See Note 3. Investments, for details.
(43)The Company holds one security purchased under a collateralized agreement to resell on its Consolidated Statement of Assets and Liabilities with a cost basis of $30,000 and a fair value of $16,539 as of December 31, 2022. See Note 2. Summary of Significant Accounting Policies, for details.
(44)Denotes investments in which the Company is an “Affiliated Person”, as defined in the Investment Company Act of 1940, as amended (the "1940 Act"), due to owning or holding the power to vote 5.0% or more of the outstanding voting securities of the investment but not controlling the company. Fair value as of December 31, 2022 and December 31, 2021 along with transactions during the year ended December 31, 2022 in which the issuer was a non-controlled/affiliated investment is as follows:
| | | | | | | | | | | | | | | | | | | | | | | | | | | | | | | | | | | | | | | | | | | | | | | | | | | | | | | | |
| Portfolio Company | | Fair Value at December 31, 2021 | | Gross
Additions (A) | | Gross
Redemptions
(B) | | Net Change In Unrealized Appreciation (Depreciation) | | Fair Value at December 31, 2022 | | Net Realized Gains (Losses) | | Interest
Income | | Dividend
Income | | Other
Income |
| Permian Holdco 3, Inc. / Permian Trust | | $ | — | | | $ | — | | | $ | — | | | $ | — | | | $ | — | | | $ | — | | | $ | — | | | $ | — | | | $ | — | |
| Sierra Hamilton Holdings Corporation | | 4,000 | | | — | | | — | | | — | | | 4,000 | | | — | | | — | | | — | | | — | |
| TVG-Edmentum Holdings, LLC / Edmentum Ultimate Holdings, LLC | | 130,775 | | | 5,168 | | | — | | | (9,156) | | | 126,787 | | | — | | | 2,105 | | | 4,109 | | | 250 | |
| Total Non-Controlled/Affiliated Investments | | $ | 134,775 | | | $ | 5,168 | | | $ | — | | | $ | (9,156) | | | $ | 130,787 | | | $ | — | | | $ | 2,105 | | | $ | 4,109 | | | $ | 250 | |
(A)Gross additions include increases in the cost basis of investments resulting from new portfolio investments, payment-in-kind (“PIK”) interest or dividends, the amortization of discounts, reorganizations or restructurings and the movement at fair value of an existing portfolio company into this category from a different category.
(B)Gross reductions include decreases in the cost basis of investments resulting from principal collections related to investment repayments or sales, reorganizations or restructurings and the movement of an existing portfolio company out of this category into a different category.
The accompanying notes are an integral part of these consolidated financial statements.
142
New Mountain Finance Corporation
Consolidated Schedule of Investments (Continued)
December 31, 2022
(in thousands, except shares)
(45) Denotes investments in which the Company is in “Control”, as defined in the 1940 Act, due to owning or holding the power to vote more than 25.0% of the outstanding voting securities of the investment. Fair value as of December 31, 2022 and December 31, 2021 along with transactions during the year ended December 31, 2022 in which the issuer was a controlled investment, is as follows:
| | | | | | | | | | | | | | | | | | | | | | | | | | | | | | | | | | | | | | | | | | | | | | | | | | | | | | | | |
| Portfolio Company | | Fair Value at December 31, 2021 | | Gross
Additions
(A) | | Gross
Redemptions
(B) | | Net Change In
Unrealized
Appreciation
(Depreciation) | | Fair Value at December 31, 2022 | | Net Realized Gains (Losses) | | Interest
Income | | Dividend
Income | | Other
Income |
| Edmentum Inc. | | $ | — | | | $ | — | | | $ | — | | | $ | — | | | $ | — | | | $ | 54 | | | $ | — | | | $ | — | | | $ | — | |
| National HME, Inc./NHME Holdings Corp. | | 27,347 | | | (8,161) | | | — | | | (13,805) | | | 5,381 | | | — | | | (9,661) | | | — | | | (1,500) | |
| New Benevis Topco, LLC / New Benevis Holdco, Inc. | | 109,595 | | | 5,914 | | | — | | | (1,363) | | | 114,146 | | | — | | | 8,057 | | | — | | | 1,500 | |
| New Permian Holdco, Inc. / New Permian Holdco, L.L.C. | | 34,759 | | | 7,805 | | | — | | | 15,000 | | | 57,564 | | | — | | | 4,504 | | | — | | | 511 | |
| NM APP CANADA CORP | | 9,422 | | | — | | | (7,345) | | | (2,077) | | | — | | | 4,212 | | | — | | | 620 | | | 713 | |
| NM APP US LLC | | 14,891 | | | — | | | (5,080) | | | (9,811) | | | — | | | 4,489 | | | — | | | 255 | | | 483 | |
| NM CLFX LP | | 24,676 | | | — | | | — | | | (8,504) | | | 16,172 | | | — | | | — | | | 1,596 | | | — | |
| NM DRVT LLC | | 7,984 | | | — | | | (5,152) | | | (2,832) | | | — | | | 3,439 | | | — | | | 173 | | | 475 | |
| NM JRA LLC | | 3,996 | | | — | | | (2,043) | | | (1,953) | | | — | | | 2,049 | | | — | | | 72 | | | 188 | |
| NM GLCR LP | | 50,687 | | | — | | | (14,750) | | | (35,937) | | | — | | | 35,713 | | | — | | | 400 | | | 2,150 | |
| NM KRLN LLC | | 244 | | | 97 | | | (9,319) | | | 8,978 | | | — | | | (9,318) | | | — | | | — | | | — | |
| NM NL Holdings, L.P. | | 107,870 | | | 53 | | | (10,885) | | | (2,733) | | | 94,305 | | | — | | | — | | | 8,453 | | | — | |
| NM GP Holdco, LLC | | 1,197 | | | 1 | | | (138) | | | (32) | | | 1,028 | | | — | | | — | | | 94 | | | — | |
| NM YI LLC | | 8,286 | | | — | | | — | | | 1,195 | | | 9,481 | | | — | | | — | | | 828 | | | — | |
| | | | | | | | | | | | | | | | | | |
| | | | | | | | | | | | | | | | | | |
| NMFC Senior Loan Program III LLC | | 140,000 | | | — | | | — | | | — | | | 140,000 | | | — | | | — | | | 17,485 | | | — | |
| NMFC Senior Loan Program IV LLC | | 112,400 | | | — | | | — | | | — | | | 112,400 | | | — | | | — | | | 13,173 | | | — | |
| Haven Midstream LLC / Haven Midstream Holdings LLC / QID TRH Holdings LLC | | 34,821 | | | 3,865 | | | (38,685) | | | 35,787 | | | 35,788 | | | 12,802 | | | 6,316 | | | — | | | 1,902 | |
| UniTek Global Services, Inc. | | 67,635 | | | 13,378 | | | (1,549) | | | 24,306 | | | 103,770 | | | — | | | 4,738 | | | 4,363 | | | 724 | |
| Total Controlled Investments | | $ | 755,810 | | | $ | 22,952 | | | $ | (94,946) | | | $ | 6,219 | | | $ | 690,035 | | | $ | 53,440 | | | $ | 13,954 | | | $ | 47,512 | | | $ | 7,146 | |
(A)Gross additions include increases in the cost basis of investments resulting from new portfolio investments, PIK interest or dividends, the amortization of discounts, reorganizations or restructurings and the movement of an existing portfolio company into this category from a different category.
(B)Gross redemptions include decreases in the cost basis of investments resulting from principal collections related to investment repayments or sales, reorganizations or restructurings and the movement of an existing portfolio company out of this category into a different category.
* All or a portion of interest contains PIK interest.
** Indicates assets that the Company deems to be “non-qualifying assets” under Section 55(a) of the 1940 Act. Qualifying assets must represent at least 70.0% of the Company’s total assets at the time of acquisition of any additional non-qualifying assets. As of December 31, 2022, 15.3% of the Company’s total assets are represented by investments at fair value that are considered non-qualifying assets.
The accompanying notes are an integral part of these consolidated financial statements.
143
New Mountain Finance Corporation
Consolidated Schedule of Investments (Continued)
December 31, 2022
| | | | | |
| | December 31, 2022 |
| Investment Type | Percent of Total
Investments at Fair Value |
| First lien | 54.45 | % |
| Second lien | 17.42 | % |
| Subordinated | 2.38 | % |
| Equity and other | 25.75 | % |
| Total investments | 100.00 | % |
| | | | | |
| | December 31, 2022 |
| Industry Type | Percent of Total
Investments at Fair Value |
| Software | 27.85 | % |
| Business Services | 18.39 | % |
| Healthcare | 17.01 | % |
| Investment Funds (includes investments in joint ventures) | 7.84 | % |
| Education | 7.43 | % |
| Consumer Services | 3.85 | % |
| Net Lease | 3.76 | % |
| Distribution & Logistics | 3.18 | % |
| Financial Services | 2.98 | % |
| Energy | 1.91 | % |
| Specialty Chemicals & Materials | 1.87 | % |
| Information Technology | 1.81 | % |
| Packaging | 1.26 | % |
| Consumer Products | 0.64 | % |
| Business Products | 0.22 | % |
| Total investments | 100.00 | % |
| | | | | |
| | December 31, 2022 |
| Interest Rate Type | Percent of Total
Investments at Fair Value |
| Floating rates | 88.53 | % |
| Fixed rates | 11.47 | % |
| Total investments | 100.00 | % |
The accompanying notes are an integral part of these consolidated financial statements.
144
Notes to the Consolidated Financial Statements of
New Mountain Finance Corporation
December 31, 2023
(in thousands, except share data)
Note 1. Formation and Business Purpose
New Mountain Finance Corporation (“NMFC” or the “Company”) is a Delaware corporation that was originally incorporated on June 29, 2010 and completed its initial public offering ("IPO") on May 19, 2011. NMFC is a closed-end, non-diversified management investment company that has elected to be regulated as a business development company (“BDC”) under the Investment Company Act of 1940, as amended (the “1940 Act”). NMFC has elected to be treated, and intends to comply with the requirements to continue to qualify annually, as a regulated investment company (“RIC”) under Subchapter M of the Internal Revenue Code of 1986, as amended (the “Code”). Since NMFC’s IPO, and through December 31, 2023, NMFC has raised approximately $966,859 in net proceeds from additional offerings of its common stock.
New Mountain Finance Advisers BDC, L.L.C. (the “Investment Adviser”) is a wholly-owned subsidiary of New Mountain Capital Group, L.P. (together with New Mountain Capital, L.L.C. and its affiliates, "New Mountain Capital") whose ultimate owners include Steven B. Klinsky, other current and former New Mountain Capital professionals and related vehicles and a minority investor. New Mountain Capital is a global investment firm with approximately $50 billion of assets under management and a track record of investing in the middle market. New Mountain Capital focuses on investing in defensive growth companies across its private equity, credit and net lease investment strategies. The Investment Adviser manages the Company's day-to-day operations and provides it with investment advisory and management services. The Investment Adviser also manages other funds that may have investment mandates that are similar, in whole or in part, to the Company's. New Mountain Finance Administration, L.L.C. (the "Administrator”), a wholly-owned subsidiary of New Mountain Capital, provides the administrative services necessary to conduct the Company's day-to-day operations.
The Company has established the following wholly-owned direct and indirect subsidiaries:
•New Mountain Finance Holdings, L.L.C. ("NMF Holdings") and New Mountain Finance DB, L.L.C. ("NMFDB"), whose assets are used to secure NMF Holdings’ credit facility and NMFDB’s credit facility, respectively;
•New Mountain Finance SBIC, L.P. ("SBIC I") and New Mountain Finance SBIC II, L.P. ("SBIC II"), who have received licenses from the U.S. Small Business Administration ("SBA") to operate as small business investment companies ("SBICs") under Section 301(c) of the Small Business Investment Act of 1958, as amended (the "1958 Act"), and their general partners, New Mountain Finance SBIC G.P., L.L.C. ("SBIC I GP"), and New Mountain Finance SBIC II G.P., L.L.C. ("SBIC II GP"), respectively;
•NMF Ancora Holdings, Inc. ("NMF Ancora"), NMF QID NGL Holdings, Inc. ("NMF QID"), NMF YP Holdings, Inc. ("NMF YP"), NMF Permian Holdings, LLC ("NMF Permian"), NMF HB, Inc. ("NMF HB"), NMF TRM, LLC ("NMF TRM"), NMF Pioneer, Inc. ("NMF Pioneer") and NMF OEC, Inc. ("NMF OEC"), which are treated as corporations for U.S. federal income tax purposes and are intended to facilitate our compliance with the requirements to be treated as a RIC under the Code by holding equity or equity related investments in portfolio companies organized as limited liability companies (or other forms of pass-through entities); the Company consolidates these corporations for accounting purposes but the corporations are not consolidated for U.S. federal income tax purposes and may incur U.S. federal income tax expense as a result of their ownership of the portfolio companies; and
•New Mountain Finance Servicing, L.L.C. ("NMF Servicing"), which serves as the administrative agent on certain investment transactions.
New Mountain Net Lease Corporation ("NMNLC") is a majority-owned consolidated subsidiary of the Company, which acquires commercial real estate properties that are subject to "triple net" leases and has elected to be treated, and intends to comply with the requirements to continue to qualify annually, as a real estate investment trust, or REIT, within the meaning of Section 856(a) of the Code.
NMFC is a BDC focused on providing direct lending solutions to U.S. upper middle market companies backed by private equity sponsors. The Company’s investment objective is to generate current income and capital appreciation through the sourcing and origination of senior secured loans and select junior capital positions, to growing businesses in defensive industries that offer attractive risk-adjusted returns. The Company’s investment approach leverages the deep sector knowledge and operating resources of New Mountain Capital.
Senior secured loans may include traditional first lien loans or unitranche loans. The Company invests a significant portion of its portfolio in unitranche loans, which are loans that combine both senior and subordinated debt, generally in a first-lien position. Because unitranche loans combine characteristics of senior and subordinated debt, they have risks similar to the
risks associated with secured debt and subordinated debt. Certain unitranche loan investments may include “last-out” positions, which generally heighten the risk of loss. In some cases, the Company’s investments may also include equity interests.
NMFC primarily invests in senior secured debt of U.S. sponsor-backed, middle market companies. We define middle market companies as those with annual earnings before interest, taxes, depreciation, and amortization ("EBITDA") of $10 million to $200 million. The Company focuses on defensive growth businesses that generally exhibit the following characteristics: (i) acyclicality, (ii) sustainable secular growth drivers, (iii) niche market dominance and high barriers to competitive entry, (iv) recurring revenue and strong free cash flow, (v) flexible cost structures and (vi) seasoned management teams.
Similar to the Company, the investment objective of SBIC I and SBIC II is to generate current income and capital appreciation under the investment criteria used by the Company. However, SBIC I and SBIC II investments must be in SBA eligible small businesses. The Company’s portfolio may be concentrated in a limited number of industries. As of December 31, 2023, the Company’s top five industry concentrations were software, business services, healthcare, investment funds (which includes the Company's investments in its joint ventures) and education.
Note 2. Summary of Significant Accounting Policies
Basis of accounting—The Company’s consolidated financial statements have been prepared in conformity with accounting principles generally accepted in the United States (“GAAP”). The Company is an investment company following accounting and reporting guidance in Accounting Standards Codification Topic 946, Financial Services—Investment Companies (“ASC 946”). The Company consolidates its wholly-owned direct and indirect subsidiaries: NMF Holdings, NMFDB, NMF Servicing, SBIC I, SBIC I GP, SBIC II, SBIC II GP, NMF Ancora, NMF QID, NMF YP, NMF Permian, NMF HB, NMF TRM, NMF Pioneer and NMF OEC and its majority-owned consolidated subsidiary: NMNLC. For majority-owned consolidated subsidiaries, the third-party equity interest is referred to as non-controlling interest. The net income attributable to non-controlling interests for such subsidiaries is presented as “Net increase (decrease) in net assets resulting from operations related to non-controlling interest” in the Company’s Consolidated Statements of Operations. The portion of shareholders' equity that is attributable to non-controlling interests for such subsidiaries is presented as “Non-controlling interest”, a component of total equity, on the Company’s Consolidated Statements of Assets and Liabilities.
The Company’s consolidated financial statements reflect all adjustments and reclassifications which, in the opinion of management, are necessary for the fair presentation of the results of operations and financial condition for all periods presented. All intercompany transactions have been eliminated. Revenues are recognized when earned and expenses when incurred. The financial results of the Company’s portfolio investments are not consolidated in the financial statements.
The Company’s consolidated financial statements are prepared in accordance with GAAP and pursuant to the requirements for reporting on Form 10-K and Article 6 or 10 of Regulation S-X. In the opinion of management, all adjustments, consisting solely of normal recurring accruals considered necessary for the fair presentation of financial statements have been included.
Investments—The Company applies fair value accounting in accordance with GAAP. Fair value is the amount that would be received to sell an asset or paid to transfer a liability in an orderly transaction between market participants at the measurement date. Investments are reflected on the Company’s Consolidated Statements of Assets and Liabilities at fair value, with changes in unrealized gains and losses resulting from changes in fair value reflected in the Company’s Consolidated Statements of Operations as “Net change in unrealized appreciation (depreciation) of investments” and realizations on portfolio investments reflected in the Company’s Consolidated Statements of Operations as “Net realized gains (losses) on investments”.
The Company values its assets on a quarterly basis, or more frequently if required under the 1940 Act. In all cases, the Company’s board of directors is ultimately and solely responsible for determining the fair value of the portfolio investments on a quarterly basis in good faith, including investments that are not publicly traded, those whose market prices are not readily available and any other situation where its portfolio investments require a fair value determination. Security transactions are accounted for on a trade date basis. The Company’s quarterly valuation procedures are set forth in more detail below:
(1)Investments for which market quotations are readily available on an exchange are valued at such market quotations based on the closing price indicated from independent pricing services.
(2)Investments for which indicative prices are obtained from various pricing services and/or brokers or dealers are valued through a multi-step valuation process, as described below, to determine whether the quote(s) obtained is representative of fair value in accordance with GAAP.
a.Bond quotes are obtained through independent pricing services. Internal reviews are performed by the investment professionals of the Investment Adviser to ensure that the quote obtained is representative of fair value in
accordance with GAAP and, if so, the quote is used. If the Investment Adviser is unable to sufficiently validate the quote(s) internally and if the investment’s par value or its fair value exceeds the materiality threshold, the investment is valued similarly to those assets with no readily available quotes (see (3) below); and
b.For investments other than bonds, the Company looks at the number of quotes readily available and performs the following procedures:
i.Investments for which two or more quotes are received from a pricing service are valued using the mean of the mean of the bid and ask of the quotes obtained. The Company will evaluate the reasonableness of the quote, and if the quote is determined to not be representative of fair value, the Company will use one or more of the methodologies outlined below to determine fair value; and
ii.Investments for which one quote is received from a pricing service are validated internally. The investment professionals of the Investment Adviser analyze the market quotes obtained using an array of valuation methods (further described below) to validate the fair value. If the Investment Adviser is unable to sufficiently validate the quote internally and if the investment’s par value or its fair value exceeds the materiality threshold, the investment is valued similarly to those assets with no readily available quotes (see (3) below).
(3)Investments for which quotations are not readily available through exchanges, pricing services, brokers, or dealers are valued through a multi-step valuation process:
a.Each portfolio company or investment is initially valued by the investment professionals of the Investment Adviser responsible for the credit monitoring;
b.Preliminary valuation conclusions will then be documented and discussed with the Company’s senior management;
c.If an investment falls into (3) above for four consecutive quarters and if the investment’s par value or its fair value exceeds the materiality threshold, then at least once each fiscal year, the valuation for each portfolio investment for which the Company does not have a readily available market quotation will be reviewed by an independent valuation firm engaged by the Company’s board of directors; and
d.When deemed appropriate by the Company’s management, an independent valuation firm may be engaged to review and value investment(s) of a portfolio company, without any preliminary valuation being performed by the Investment Adviser. The investment professionals of the Investment Adviser will review and validate the value provided.
For investments in revolving credit facilities and delayed draw commitments, the cost basis of the funded investments purchased is offset by any costs/netbacks received for any unfunded portion on the total balance committed. The fair value is also adjusted for the price appreciation or depreciation on the unfunded portion. As a result, the purchase of a commitment not completely funded may result in a negative fair value until it is called and funded.
The values assigned to investments are based upon available information and do not necessarily represent amounts which might ultimately be realized, since such amounts depend on future circumstances and cannot be reasonably determined until the individual positions are liquidated. Due to the inherent uncertainty of determining the fair value of investments that do not have a readily available market value, the fair value of the Company’s investments may fluctuate from period to period and the fluctuations could be material.
See Note 3. Investments, for further discussion relating to investments.
New Mountain Net Lease Corporation
NMNLC was formed to acquire commercial real estate properties that are subject to "triple net" leases. NMNLC's investments are disclosed on the Company's Consolidated Schedule of Investments as of December 31, 2023.
On March 30, 2020, an affiliate of the Investment Adviser purchased directly from NMNLC 105,030 shares of NMNLC’s common stock at a price of $107.73 per share, which represented the net asset value per share of NMNLC at the date of purchase, for an aggregate purchase price of approximately $11,315. Immediately thereafter, NMNLC redeemed 105,030 shares of its common stock held by NMFC in exchange for a promissory note with a principal amount of $11,315 and a 7.0% interest rate, which was repaid by NMNLC to NMFC on March 31, 2020.
Below is certain summarized property information for NMNLC as of December 31, 2023: | | | | | | | | | | | | | | | | | | | | | | | | | | | | | | | | |
| | | | Lease | | | | Total | | Fair Value as of |
| Portfolio Company | | Tenant | | Expiration Date | | Location | | Square Feet | | December 31, 2023 |
| NM NL Holdings LP / NM GP Holdco LLC | | Various | | Various | | Various | | Various | | $ | 97,119 | |
| NM CLFX LP | | Victor Equipment Company | | 8/31/2033 | | TX | | 423 | | 11,731 | |
| NM YI, LLC | | Young Innovations, Inc. | | 10/31/2039 | | IL / MO | | 212 | | 9,550 | |
| | | | | | | | | | $ | 118,400 | |
(1)Excludes residual value in NM APP Canada Corp. due to tax withholding. As of December 31, 2023, NM APP Canada Corp. had a fair value of $7.
Collateralized agreements or repurchase financings—The Company follows the guidance in Accounting Standards Codification Topic 860, Transfers and Servicing—Secured Borrowing and Collateral (“ASC 860”), when accounting for transactions involving the purchases of securities under collateralized agreements to resell (resale agreements). These transactions are treated as collateralized financing transactions and are recorded at their contracted resale or repurchase amounts, as specified in the respective agreements. Interest on collateralized agreements is accrued and recognized over the life of the transaction and included in interest income. As of December 31, 2023 and December 31, 2022, the Company held one collateralized agreement to resell with a cost basis of $30,000 and $30,000, respectively, and a fair value of $16,500 and $16,539, respectively. The collateralized agreement to resell is on non-accrual. The collateralized agreement to resell is guaranteed by a private hedge fund, PPVA Fund, L.P. The private hedge fund is currently in liquidation under the laws of the Cayman Islands. Pursuant to the terms of the collateralized agreement, the private hedge fund was obligated to repurchase the collateral from the Company at the par value of the collateralized agreement. The private hedge fund has breached its agreement to repurchase the collateral under the collateralized agreement. The default by the private hedge fund did not release the collateral to the Company, and therefore, the Company does not have full rights and title to the collateral. A claim has been filed with the Cayman Islands joint official liquidators to resolve this matter. The joint official liquidators have recognized the Company’s contractual rights under the collateralized agreement. The Company continues to exercise its rights under the collateralized agreement and continues to monitor the liquidation process of the private hedge fund. The fair value of the collateralized agreement to resell is reflective of the increased risk of the position.
Cash and cash equivalents—Cash and cash equivalents include cash and short-term, highly liquid investments. The Company defines cash equivalents as securities that are readily convertible into known amounts of cash and so near maturity that there is insignificant risk of changes in value. These securities have original maturities of three months or less. The Company did not hold any cash equivalents as of December 31, 2023 and December 31, 2022.
Revenue recognition
Sales and paydowns of investments: Realized gains and losses on investments are determined on the specific identification method.
Interest and dividend income: Interest income, including amortization of premium and discount using the effective interest method, is recorded on the accrual basis and periodically assessed for collectability. Interest income also includes interest earned from cash on hand. Upon the prepayment of a loan or debt security, any prepayment penalties are recorded as part of interest income. The Company has loans and certain preferred equity investments in the portfolio that contain a payment-in-kind (“PIK”) interest or dividend provision. PIK interest and dividends are accrued and recorded as income at the contractual rates, if deemed collectible. The PIK interest and dividends are added to the principal or share balances on the capitalization dates and are generally due at maturity or when redeemed by the issuer. For the years ended December 31, 2023, December 31, 2022 and December 31, 2021, the Company recognized PIK and non-cash interest from investments of $33,594, $17,326 and $23,343, respectively, and PIK and non-cash dividends from investments of $27,409, $22,543 and $19,485, respectively.
Dividend income on common equity is recorded on the record date for private portfolio companies or on the ex-dividend date for publicly traded portfolio companies. Dividend income on preferred securities is recorded as dividend income on an accrual basis to the extent that such amounts are deemed collectible.
Non-accrual income: Investments are placed on non-accrual status when principal or interest payments are past due for 30 days or more and when there is reasonable doubt that principal or interest will be collected. Accrued cash and un-capitalized PIK interest or dividends are reversed when an investment is placed on non-accrual status. Previously capitalized PIK interest or dividends are not reversed when an investment is placed on non-accrual status. Interest or dividend payments received on non-accrual investments may be recognized as income or applied to principal depending upon management’s judgment of the
ultimate collectability. Non-accrual investments are restored to accrual status when past due principal and interest is paid and, in management’s judgment, are likely to remain current.
Other income: Other income represents delayed compensation, consent or amendment fees, revolver fees, structuring fees, upfront fees and other miscellaneous fees received and are typically non-recurring in nature. Delayed compensation is income earned from counterparties on trades that do not settle within a set number of business days after the trade date. Other income may also include fees from bridge loans. The Company may from time to time enter into bridge financing commitments, an obligation to provide interim financing to a counterparty until permanent credit can be obtained. These commitments are short-term in nature and may expire unfunded. A fee is received by the Company for providing such commitments. Structuring fees and upfront fees are recognized as income when earned, usually when paid at the closing of the investment, and are non-refundable.
Interest and other financing expenses—Interest and other financing fees are recorded on an accrual basis by the Company. See Note 7. Borrowings, for details.
Deferred financing costs—The deferred financing costs of the Company consist of capitalized expenses related to the origination and amending of the Company’s borrowings. The Company amortizes these costs into expense over the stated life of the related borrowing. See Note 7. Borrowings, for details.
Deferred offering costs—The Company's deferred offering costs consist of fees and expenses incurred in connection with equity offerings and the filing of shelf registration statements. Upon the issuance of shares, offering costs are charged as a direct reduction to net assets. Deferred offering costs are included in other assets on the Company's Consolidated Statements of Assets and Liabilities.
Income taxes—The Company has elected to be treated, and intends to comply with the requirements to qualify annually, as a RIC under Subchapter M of the Code. As a RIC, the Company is not subject to U.S. federal income tax on the portion of taxable income and gains timely distributed to its stockholders.
To continue to qualify and be subject to tax treatment as a RIC, the Company is required to meet certain income and asset diversification tests in addition to timely distributing at least 90.0% of its investment company taxable income, as defined by the Code. Since U.S. federal income tax regulations differ from GAAP, distributions in accordance with tax regulations may differ from net investment income and realized gains recognized for financial reporting purposes.
Differences between taxable income and the results of operations for financial reporting purposes may be permanent or temporary in nature. Permanent differences are reclassified among capital accounts in the financial statements to reflect their tax character. Differences in classification may also result from the treatment of short-term gains as ordinary income for U.S. federal income tax purposes.
For U.S. federal income tax purposes, distributions paid to stockholders of the Company are reported as ordinary income, return of capital, long term capital gains or a combination thereof.
The Company will be subject to a 4.0% nondeductible U.S. federal excise tax on certain undistributed income unless the Company distributes, in a timely manner as required by the Code, an amount at least equal to the sum of (1) 98.0% of its respective net ordinary income earned for the calendar year and (2) 98.2% of its respective capital gain net income for the one-year period ending October 31 in the calendar year.
Certain consolidated subsidiaries of the Company are subject to U.S. federal and state income taxes. These taxable entities are not consolidated for U.S. federal income tax purposes and may generate income tax liabilities or assets from permanent and temporary differences in the recognition of items for financial reporting and U.S. federal income tax purposes.
For the year ended December 31, 2023, the Company recognized a total income tax expense of approximately $1,762 for the Company's consolidated subsidiaries. For the year ended December 31, 2023, the Company recorded current income tax expense of approximately $418 and deferred income tax provision of approximately $1,344. For the year ended December 31, 2022, the Company recognized a total income tax expense of approximately $9,299 for the Company's consolidated subsidiaries. For the year ended December 31, 2022, the Company recorded current income tax expense of approximately $825 and deferred income tax provision of approximately $8,474. For the year ended December 31, 2021, the Company recognized a total income tax expense of approximately $232 for the Company's consolidated subsidiaries. For the year ended December 31, 2021, the Company recorded current income tax expense of approximately $118 and deferred income tax provision of approximately $114.
As of December 31, 2023 and December 31, 2022, the Company had $594 of deferred tax assets and $8,487 of deferred tax liabilities, respectively, primarily relating to deferred taxes attributable to certain differences between the computation of income for U.S. federal income tax purposes as compared to GAAP.
Based on its analysis, the Company has determined that there were no uncertain income tax positions that do not meet the more likely than not threshold as defined by Accounting Standards Codification Topic 740, Income Taxes ("ASC 740") through December 31, 2023. The 2020 through 2023 tax years remain subject to examination by the U.S. federal, state, and local tax authorities.
Distributions—Distributions to common stockholders of the Company are recorded on the record date as set by the board of directors. The Company intends to make distributions to its stockholders that will be sufficient to enable the Company to maintain its status as a RIC. The Company intends to distribute approximately all of its net investment income (see Note 5. Agreements, for details) on a quarterly basis and substantially all of its taxable income on an annual basis, except that the Company may retain certain net capital gains for reinvestment.
The Company has adopted a dividend reinvestment plan that provides for reinvestment of any distributions declared on behalf of its stockholders, unless a stockholder elects to receive cash.
The Company applies the following in implementing the dividend reinvestment plan. If the price at which newly issued shares are to be credited to stockholders' accounts is equal to or greater than 110.0% of the last determined net asset value of the shares, the Company will use only newly issued shares to implement its dividend reinvestment plan. Under such circumstances, the number of shares to be issued to a stockholder is determined by dividing the total dollar amount of the distribution payable to such stockholder by the market price per share of the Company's common stock on NASDAQ Global Select Market ("NASDAQ") on the distribution payment date. Market price per share on that date will be the closing price for such shares on NASDAQ or, if no sale is reported for such day, the average of their electronically reported bid and ask prices.
If the price at which newly issued shares are to be credited to stockholders' accounts is less than 110.0% of the last determined net asset value of the shares, the Company will either issue new shares or instruct the plan administrator to purchase shares in the open market to satisfy the additional shares required. Shares purchased in open market transactions by the plan administrator will be allocated to a stockholder based on the average purchase price, excluding any brokerage charges or other charges, of all shares of common stock purchased in the open market. The number of shares of the Company's common stock to be outstanding after giving effect to payment of the distribution cannot be established until the value per share at which additional shares will be issued has been determined and elections of the Company's stockholders have been tabulated.
Stock repurchase program—On February 4, 2016, the Company's board of directors authorized a program for the purpose of repurchasing up to $50,000 worth of the Company's common stock (the "Repurchase Program"). Under the Repurchase Program, the Company was permitted, but was not obligated, to repurchase its outstanding common stock in the open market from time to time provided that it complied with the Company's code of ethics and the guidelines specified in Rule 10b-18 of the Securities Exchange Act of 1934, as amended (the "Exchange Act"), including certain price, market volume and timing constraints. In addition, any repurchases were conducted in accordance with the 1940 Act. On December 8, 2023, the Company's board of directors extended the Company's Repurchase Program and the Company expects the Repurchase Program to be in place until the earlier of December 31, 2024 or until $50,000 of its outstanding shares of common stock have been repurchased. During the years ended December 31, 2023 and December 31, 2022, the Company did not repurchase any shares of the Company's common stock. The Company previously repurchased $2,948 outstanding shares of its common stock under the Repurchase Program.
Earnings per share—The Company's earnings per share ("EPS") amounts have been computed based on the weighted-average number of shares of common stock outstanding for the period. Basic EPS is computed by dividing net increase (decrease) in net assets resulting from operations by the weighted average number of shares of common stock outstanding during the period of computation. Diluted EPS is computed by dividing net increase (decrease) in net assets resulting from operations by the weighted average number of shares of common stock assuming all potential shares had been issued, and its related net impact to net assets accounted for, and the additional shares of common stock were dilutive. Diluted EPS reflects the potential dilution, using the as-if-converted method for convertible debt, which could occur if all potentially dilutive securities were exercised.
Foreign securities—The accounting records of the Company are maintained in U.S. dollars. Investment securities denominated in foreign currencies are translated into U.S. dollars based on the rate of exchange of such currencies on the date of valuation. Purchases and sales of investment securities and income and expense items denominated in foreign currencies are translated into U.S. dollars based on the rate of exchange of such currencies on the respective dates of the transactions. The Company isolates that portion of the results of operations resulting from changes in foreign exchange rates on investments from the fluctuations arising from changes in market prices of securities held. Such fluctuations are included with "Net change in unrealized appreciation (depreciation)" and "Net realized gains (losses)" in the Company's Consolidated Statements of Operations.
Investments denominated in foreign currencies may be negatively affected by movements in the rate of exchange between the U.S. dollar and such foreign currencies. This movement is beyond the control of the Company and cannot be predicted.
Use of estimates—The preparation of the Company's consolidated financial statements in conformity with GAAP requires management to make estimates and assumptions that affect the reported amounts of assets and liabilities at the date of the Company's consolidated financial statements and the reported amounts of revenues and expenses during the reporting periods. Changes in the economic environment, financial markets, and other metrics used in determining these estimates could cause actual results to differ from the estimates used, and the differences could be material.
Note 3. Investments
At December 31, 2023, the Company’s investments consisted of the following:
Investment Cost and Fair Value by Type | | | | | | | | | | | |
| | Cost | | Fair Value |
| First lien | $ | 1,709,247 | | | $ | 1,683,952 | |
| Second lien | 472,930 | | | 424,513 | |
| Subordinated | 100,236 | | | 90,948 | |
| Equity and other | 755,795 | | | 811,909 | |
| Total investments | $ | 3,038,208 | | | $ | 3,011,322 | |
Investment Cost and Fair Value by Industry | | | | | | | | | | | |
| | Cost | | Fair Value |
| Software | $ | 815,065 | | | $ | 809,401 | |
| Business Services | 561,492 | | | 539,926 | |
| Healthcare | 516,086 | | | 477,854 | |
| Investment Funds (includes investments in joint ventures) | 252,400 | | | 252,400 | |
| Education | 188,851 | | | 211,550 | |
| Consumer Services | 192,796 | | | 192,501 | |
| Net Lease | 95,782 | | | 118,407 | |
| Distribution & Logistics | 118,212 | | | 110,721 | |
| Financial Services | 104,330 | | | 105,138 | |
| Energy | 61,108 | | | 65,170 | |
| Packaging | 43,181 | | | 36,007 | |
| Specialty Chemicals & Materials | 25,329 | | | 28,452 | |
| Business Products | 22,630 | | | 22,628 | |
| Food & Beverage | 20,370 | | | 22,055 | |
| Consumer Products | 20,576 | | | 19,112 | |
| Total investments | $ | 3,038,208 | | | $ | 3,011,322 | |
At December 31, 2022, the Company's investments consisted of the following:
Investment Cost and Fair Value by Type | | | | | | | | | | | |
| | Cost | | Fair Value |
| First lien | $ | 1,816,091 | | | $ | 1,753,967 | |
| Second lien | 632,990 | | | 561,207 | |
| Subordinated | 85,774 | | | 76,659 | |
| Equity and other | 725,112 | | | 829,414 | |
| Total investments | $ | 3,259,967 | | | $ | 3,221,247 | |
Investment Cost and Fair Value by Industry | | | | | | | | | | | |
| | Cost | | Fair Value |
| Software | $ | 916,259 | | | $ | 897,008 | |
| Business Services | 661,079 | | | 592,868 | |
| Healthcare | 586,311 | | | 548,383 | |
| Investment Funds (includes investments in joint ventures) | 252,400 | | | 252,400 | |
| Education | 200,117 | | | 239,301 | |
| Consumer Services | 126,392 | | | 123,880 | |
| Net Lease | 96,041 | | | 120,986 | |
| Distribution & Logistics | 111,096 | | | 102,410 | |
| Financial Services | 96,021 | | | 95,839 | |
| Energy | 55,507 | | | 61,564 | |
| Specialty Chemicals & Materials | 25,363 | | | 60,268 | |
| Information Technology | 58,638 | | | 58,165 | |
| Packaging | 43,124 | | | 40,547 | |
| Consumer Products | 20,850 | | | 20,624 | |
| Business Products | 10,769 | | | 7,004 | |
| Total investments | $ | 3,259,967 | | | $ | 3,221,247 | |
As of December 31, 2023, the Company's aggregate principal amount of its second lien term loan in Integro Parent Inc. ("Integro") was $13,657. During the second quarter of 2022, the Company placed an aggregate principal amount of $4,780 of its second lien position on non-accrual status, that was subsequently taken off non-accrual status in the third quarter of 2023. As of December 31, 2023, the Company's position in Integro had total unearned interest income of $352 for the year then ended.
During the second quarter of 2022, the Company placed its second lien position in National HME, Inc. ("National HME") on non-accrual status. As of December 31, 2023, the Company's second lien position in National HME had an aggregate cost basis of $7,872, an aggregate fair value of $3,000. During the fourth quarter of 2022, the Company reversed $11,236 of previously recorded PIK interest in National HME and $1,500 of previously recorded other income in NHME Holdings Corp. as the Company believes this PIK interest and other income will ultimately not be collectible.
As of December 31, 2023, the Company's aggregate principal amount of its subordinated position and first lien term loans in American Achievement Corporation ("AAC") was $5,230 and $31,406, respectively. During the first quarter of 2021, the Company placed an aggregate principal amount of $5,230 of its subordinated position on non-accrual status. During the third quarter of 2021, the Company placed an initial aggregate principal amount of $13,479 of its first lien term loans on non-accrual status. During the third quarter of 2023, the Company placed the remaining aggregate principal amount of $17,927 of its first lien term loans on non-accrual status. As of December 31, 2023, the Company's positions in AAC on non-accrual status had an aggregate cost basis of $31,369, an aggregate fair value of $20,586 and total unearned interest income of $3,353 for the year then ended.
During the first quarter of 2020, the Company placed its junior preferred shares in UniTek Global Services, Inc. ("UniTek") on non-accrual status. As of December 31, 2023, the Company's junior preferred shares in UniTek had an aggregate
cost basis of $34,393, an aggregate fair value of $0 and total unearned dividend income of $7,657 for the year then ended. During the third quarter of 2021, the Company placed an aggregate amount of $19,795 of its investment in the senior preferred shares of UniTek on non-accrual status. As of December 31, 2023, the Company's senior preferred shares in UniTek had an aggregate cost basis of $19,795, an aggregate fair value of approximately $4,210 and total unearned dividend income of approximately $5,606 for the year then ended.
During the fourth quarter of 2023, the Company placed its second lien term loan in Transcendia Holdings, Inc. ("Transcendia") on non-accrual status. As of December 31, 2023, the Company's second lien term loan in Transcendia had an aggregate cost basis of $14,445, an aggregate fair value of $7,250 and total unearned interest income of $520 for the year then ended.
As of December 31, 2023, the Company had unfunded commitments on revolving credit facilities and bridge facilities of $112,803 and $0, respectively. As of December 31, 2023, the Company had unfunded commitments in the form of delayed draws or other future funding commitments of $43,948. The unfunded commitments on revolving credit facilities and delayed draws are disclosed on the Company's Consolidated Schedule of Investments as of December 31, 2023.
As of December 31, 2022, the Company had unfunded commitments on revolving credit facilities and bridge facilities of $100,315 and $0, respectively. As of December 31, 2022, the Company had unfunded commitments in the form of delayed draws or other future funding commitments of $123,748. The unfunded commitments on revolving credit facilities and delayed draws are disclosed on the Company's Consolidated Schedule of Investments as of December 31, 2022.
PPVA Black Elk (Equity) LLC
On May 3, 2013, the Company entered into a collateralized securities purchase and put agreement (the “SPP Agreement”) with a private hedge fund. Under the SPP Agreement, the Company purchased twenty million Class E Preferred Units of Black Elk Energy Offshore Operations, LLC (“Black Elk”) for $20,000 with a corresponding obligation of the private hedge fund, PPVA Black Elk (Equity) LLC, to repurchase the preferred units for $20,000 plus other amounts due under the SPP Agreement. The majority owner of Black Elk was the private hedge fund. In August 2014, the Company received a payment of $20,540, the full amount due under the SPP Agreement.
In August 2017, a trustee (the “Trustee”) for Black Elk informed the Company that the Trustee intended to assert a fraudulent conveyance claim (the “Claim”) against the Company and one of its affiliates seeking the return of the $20,540 repayment. Black Elk filed a Chapter 11 bankruptcy petition pursuant to the U.S. Bankruptcy Code in August 2015. The Trustee alleged that individuals affiliated with the private hedge fund conspired with Black Elk and others to improperly use proceeds from the sale of certain Black Elk assets to repay, in August 2014, the private hedge fund’s obligation to the Company under the SPP Agreement. The Company was unaware of these claims at the time the repayment was received. The private hedge fund is currently in liquidation under the laws of the Cayman Islands.
On December 22, 2017, the Company settled the Trustee’s $20,540 Claim for $16,000 and filed a claim with the Cayman Islands joint official liquidators of the private hedge fund for $16,000 that is owed to the Company under the SPP Agreement. The SPP Agreement was restored and is in effect since repayment has not been made. The Company continues to exercise its rights under the SPP Agreement and continues to monitor the liquidation process of the private hedge fund. During the year ended December 31, 2018, the Company received a $1,500 payment from its insurance carrier in respect to the settlement. As of December 31, 2023, the SPP Agreement has a cost basis of $14,500 and a fair value of $7,975, which is reflective of the higher inherent risk in this transaction.
NMFC Senior Loan Program III LLC
NMFC Senior Loan Program III LLC ("SLP III") was formed as a Delaware limited liability company and commenced operations on April 25, 2018. SLP III is structured as a private joint venture investment fund between the Company and SkyKnight Income II, LLC (“SkyKnight II”) and operates under a limited liability company agreement (the "SLP III Agreement"). The purpose of the joint venture is to invest primarily in senior secured loans issued by portfolio companies within the Company's core industry verticals. These investments are typically broadly syndicated first lien loans. All investment decisions must be unanimously approved by the board of managers of SLP III, which has equal representation from the Company and SkyKnight II. SLP III has a five year investment period and will continue in existence until April 25, 2025. The investment period may be extended for up to one year pursuant to certain terms of the SLP III Agreement.
SLP III is capitalized with equity contributions which are called from its members, on a pro-rata basis based on their equity commitments, as transactions are completed. Any decision by SLP III to call down on capital commitments requires approval by the board of managers of SLP III. As of December 31, 2023, the Company and SkyKnight II have committed and contributed $140,000 and $35,000, respectively, of equity to SLP III. The Company’s investment in SLP III is disclosed on the Company’s Consolidated Schedule of Investments as of December 31, 2023 and December 31, 2022.
On May 2, 2018, SLP III entered into its revolving credit facility with Citibank, N.A., which matures on January 8, 2026. Effective July 8, 2021, the reinvestment period was extended to July 8, 2024. As of the amendment on June 23, 2023, during the reinvestment period, the credit facility bears interest at a rate of the Secured Overnight Financing Rate ("SOFR") plus 1.80%, and after the reinvestment period it will bear interest at a rate of SOFR plus 2.10%. Prior to the amendment on June 23, 2023, the facility bore interest at a rate of London Interbank Offered Rate ("LIBOR") plus 1.60% per annum during the reinvestment period and LIBOR plus 1.90% per annum after the reinvestment period. Effective November 23, 2020, SLP III's revolving credit facility has a maximum borrowing capacity of $525,000. As of December 31, 2023 and December 31, 2022, SLP III had total investments with an aggregate fair value of approximately $636,560 and $639,327, respectively, and debt outstanding under its credit facility of $453,200 and $512,100, respectively. As of December 31, 2023 and December 31, 2022, none of SLP III's investments were on non-accrual. Additionally, as of December 31, 2023 and December 31, 2022, SLP III had unfunded commitments in the form of delayed draws of $1,127 and $2,948, respectively.
Below is a summary of SLP III's portfolio, along with a listing of the individual investments in SLP III's portfolio as of December 31, 2023 and December 31, 2022 : | | | | | | | | | | | | | | | | |
| | December 31, 2023 | | December 31, 2022 | | |
| First lien investments (1) | | $ | 657,208 | | | $ | 690,017 | | | |
| Weighted average interest rate on first lien investments (2) | | 9.79 | % | | 8.51 | % | | |
| Number of portfolio companies in SLP III | | 87 | | | 83 | | | |
| Largest portfolio company investment (1) | | $ | 17,883 | | | $ | 18,197 | | | |
| Total of five largest portfolio company investments (1) | | $ | 79,458 | | | $ | 85,948 | | | |
(1)Reflects principal amount or par value of investment.
(2)Computed as the all in interest rate in effect on accruing investments divided by the total principal amount of investments.
The following table is a listing of the individual investments in SLP III's portfolio as of December 31, 2023:
| | | | | | | | | | | | | | | | | | | | | | | | | | | | | | | | | | | | | | | | | | | | | | | | | | |
| Portfolio Company and Type of Investment | | Industry | | Reference | | Spread | | Interest Rate (1) | | Maturity Date | | Principal Amount or Par Value | | Cost | | Fair
Value (2) |
| | | | | | | | | | | | | | | | |
| Funded Investments - First lien | | | | | | | | | | | | | | | | |
| ADMI Corp. (aka Aspen Dental) | | Healthcare | | SOFR(M) | | 3.75% | | 9.22% | | 12/2027 | | $ | 2,376 | | | $ | 2,368 | | | $ | 2,261 | |
| AG Parent Holdings, LLC | | Healthcare | | SOFR(Q) | | 5.00% | | 10.65% | | 07/2026 | | 7,294 | | | 7,279 | | | 7,174 | |
| Aretec Group, Inc. (fka RCS Capital Corporation) | | Financial Services | | SOFR(M) | | 4.50% | | 9.96% | | 08/2030 | | 6,626 | | | 6,480 | | | 6,634 | |
| Artera Services, LLC | | Distribution & Logistics | | SOFR(Q) | | 3.50% | | 8.95% | | 03/2025 | | 5,273 | | | 5,259 | | | 4,968 | |
| Ascensus Group Holdings, Inc. | | Business Services | | SOFR(M) | | 3.50% | | 8.97% | | 08/2028 | | 2,817 | | | 2,806 | | | 2,817 | |
| AssuredPartners, Inc | | Insurance Services | | SOFR(M) | | 3.75% | | 9.22% | | 02/2027 | | 1,975 | | | 1,921 | | | 1,986 | |
| Aston FinCo S.a r.l. | | Software | | SOFR(M) | | 4.25% | | 9.72% | | 10/2026 | | 5,775 | | | 5,749 | | | 4,929 | |
| athenahealth Group Inc. | | Healthcare | | SOFR(M) | | 3.25% | | 8.61% | | 02/2029 | | 6,843 | | | 6,612 | | | 6,828 | |
| BCPE Empire Holdings, Inc. | | Distribution & Logistics | | SOFR(M) | | 4.75% | | 10.11% | | 12/2028 | | 7,458 | | | 7,390 | | | 7,490 | |
| Bella Holding Company, LLC | | Healthcare | | SOFR(M) | | 3.75% | | 9.21% | | 05/2028 | | 962 | | | 955 | | | 956 | |
| Boxer Parent Company Inc. | | Software | | SOFR(M) | | 4.25% | | 9.60% | | 12/2028 | | 11,883 | | | 11,764 | | | 11,992 | |
| Bracket Intermediate Holding Corp. | | Healthcare | | SOFR(Q) | | 5.00% | | 10.45% | | 05/2028 | | 14,253 | | | 13,870 | | | 14,280 | |
| Brown Group Holding, LLC | | Distribution & Logistics | | SOFR(Q) | | 3.75% | | 9.13% | | 07/2029 | | 3,989 | | | 3,905 | | | 4,006 | |
| Cardinal Parent, Inc. | | Software | | SOFR(Q) | | 4.50% | | 10.00% | | 11/2027 | | 9,821 | | | 9,646 | | | 9,048 | |
| CE Intermediate I, LLC | | Software | | SOFR(Q) | | 3.50% | | 9.02% | | 11/2028 | | 10,810 | | | 10,754 | | | 10,729 | |
| CentralSquare Technologies, LLC | | Software | | SOFR(Q) | | 3.75% | | 9.25% | | 08/2025 | | 14,250 | | | 14,240 | | | 13,817 | |
| CHA Holdings, Inc. | | Business Services | | SOFR(M) | | 4.50% | | 10.15% | | 04/2025 | | 947 | | | 947 | | | 947 | |
| Cloudera, Inc. | | Software | | SOFR(M) | | 3.75% | | 9.21% | | 10/2028 | | 5,692 | | | 5,553 | | | 5,654 | |
| CommerceHub, Inc. | | Software | | SOFR(Q) | | 4.00% | | 9.54% | | 12/2027 | | 5,658 | | | 5,641 | | | 5,378 | |
| CommerceHub, Inc. | | Software | | SOFR(Q) | | 6.25% | | 11.79% | | 12/2027 | | 3,960 | | | 3,548 | | | 3,960 | |
| Confluent Health, LLC | | Healthcare | | SOFR(M) | | 4.00% | | 9.47% | | 11/2028 | | 10,962 | | | 10,919 | | | 10,771 | |
| Confluent Medical Technologies, Inc. | | Healthcare | | SOFR(Q) | | 3.75% | | 9.10% | | 02/2029 | | 6,878 | | | 6,851 | | | 6,878 | |
| Convey Health Solutions, Inc. | | Healthcare | | SOFR(Q) | | 5.25% | | 10.74% | | 09/2026 | | 12,838 | | | 12,559 | | | 11,483 | |
| Cornerstone OnDemand, Inc. | | Software | | SOFR(M) | | 3.75% | | 9.22% | | 10/2028 | | 3,527 | | | 3,514 | | | 3,432 | |
| Covenant Surgical Partners, Inc. | | Healthcare | | SOFR(Q) | | 4.00% | | 9.38% | | 07/2026 | | 9,583 | | | 9,545 | | | 7,539 | |
| Covenant Surgical Partners, Inc. | | Healthcare | | SOFR(Q) | | 4.00% | | 9.38% | | 07/2026 | | 2,000 | | | 1,989 | | | 1,573 | |
| CRCI Longhorn Holdings, Inc. | | Business Services | | SOFR(M) | | 3.50% | | 8.96% | | 08/2025 | | 14,213 | | | 14,194 | | | 14,261 | |
| CVET Midco 2, L.P. | | Software | | SOFR(Q) | | 5.00% | | 10.35% | | 10/2029 | | 9,905 | | | 9,483 | | | 9,909 | |
| Dealer Tire Financial, LLC | | Distribution & Logistics | | SOFR(M) | | 4.50% | | 9.86% | | 12/2027 | | 9,628 | | | 9,617 | | | 9,680 | |
| DG Investment Intermediate Holdings 2, Inc. | | Business Services | | SOFR(M) | | 3.75% | | 9.22% | | 03/2028 | | 7,313 | | | 7,293 | | | 7,263 | |
| Discovery Purchaser Corporation | | Specialty Chemicals & Materials | | SOFR(Q) | | 4.38% | | 9.77% | | 10/2029 | | 7,029 | | | 6,538 | | | 6,943 | |
| Dispatch Acquisition Holdings, LLC | | Industrial Services | | SOFR(Q) | | 4.25% | | 9.75% | | 03/2028 | | 15,448 | | | 15,105 | | | 14,550 | |
| EAB Global, Inc. | | Education | | SOFR(M) | | 3.50% | | 8.97% | | 08/2028 | | 3,960 | | | 3,929 | | | 3,958 | |
| Eagle Parent Corp. | | Business Services | | SOFR(Q) | | 4.25% | | 9.60% | | 04/2029 | | 7,468 | | | 7,346 | | | 7,403 | |
| Eisner Advisory Group LLC | | Financial Services | | SOFR(M) | | 5.25% | | 10.72% | | 07/2028 | | 2,190 | | | 2,113 | | | 2,195 | |
| eResearchTechnology, Inc. | | Healthcare | | SOFR(M) | | 4.50% | | 9.96% | | 02/2027 | | 3,632 | | | 3,631 | | | 3,632 | |
| EyeCare Partners, LLC | | Healthcare | | SOFR(Q) | | 3.75% | | 9.39% | | 02/2027 | | 12,210 | | | 12,202 | | | 6,114 | |
| Foundational Education Group, Inc. | | Education | | SOFR(Q) | | 4.25% | | 9.89% | | 08/2028 | | 9,601 | | | 9,508 | | | 9,601 | |
| Groundworks, LLC | | Consumer Services | | SOFR(Q) | | 6.50% | | 11.90% | | 03/2030 | | 1,432 | | | 1,395 | | | 1,419 | |
| Heartland Dental, LLC | | Healthcare | | SOFR(M) | | 5.00% | | 10.36% | | 04/2028 | | 14,178 | | | 13,668 | | | 14,160 | |
| Help/Systems Holdings, Inc. | | Software | | SOFR(Q) | | 4.00% | | 9.48% | | 11/2026 | | 17,883 | | | 17,795 | | | 17,048 | |
| Higginbotham Insurance Agency, Inc. | | Business Services | | SOFR(M) | | 5.50% | | 10.96% | | 11/2028 | | 8,987 | | | 8,938 | | | 8,987 | |
| HighTower Holding, LLC | | Financial Services | | SOFR(Q) | | 4.00% | | 9.64% | | 04/2028 | | 4,729 | | | 4,697 | | | 4,720 | |
| Houghton Mifflin Harcourt Company | | Education | | SOFR(M) | | 5.25% | | 10.71% | | 04/2029 | | 8,151 | | | 7,898 | | | 8,009 | |
| Hub International Limited | | Insurance Services | | SOFR(Q) | | 4.25% | | 9.66% | | 06/2030 | | 6,426 | | | 6,363 | | | 6,463 | |
| Hunter Holdco 3 Limited | | Healthcare | | SOFR(Q) | | 4.25% | | 9.70% | | 08/2028 | | 3,000 | | | 2,978 | | | 2,998 | |
| Idera, Inc. | | Software | | SOFR(Q) | | 3.75% | | 9.28% | | 03/2028 | | 15,642 | | | 15,633 | | | 15,584 | |
| | | | | | | | | | | | | | | | |
| | | | | | | | | | | | | | | | | | | | | | | | | | | | | | | | | | | | | | | | | | | | | | | | | | |
| Portfolio Company and Type of Investment | | Industry | | Reference | | Spread | | Interest Rate (1) | | Maturity Date | | Principal Amount or Par Value | | Cost | | Fair
Value (2) |
| | | | | | | | | | | | | | | | |
| Kestra Advisor Services Holdings A, Inc. | | Financial Services | | SOFR(Q) | | 4.25% | | 9.70% | | 06/2026 | | $ | 11,811 | | | $ | 11,778 | | | $ | 11,841 | |
| LI Group Holdings, Inc. | | Software | | SOFR(M) | | 3.50% | | 8.97% | | 03/2028 | | 3,749 | | | 3,743 | | | 3,763 | |
| LSCS Holdings, Inc. | | Healthcare | | SOFR(M) | | 4.50% | | 9.97% | | 12/2028 | | 7,491 | | | 7,462 | | | 7,407 | |
| Marcel Bidco LLC (Marcel Bidco GmbH) | | Software | | SOFR(M) | | 4.50% | | 9.13% | | 11/2030 | | 2,837 | | | 2,795 | | | 2,856 | |
| Maverick Bidco Inc. | | Software | | SOFR(Q) | | 3.75% | | 9.28% | | 05/2028 | | 3,920 | | | 3,907 | | | 3,875 | |
| Maverick Bidco Inc. | | Software | | SOFR(Q) | | 4.25% | | 9.89% | | 05/2028 | | 2,488 | | | 2,377 | | | 2,463 | |
| Maverick Bidco Inc. | | Software | | SOFR(Q) | | 5.00% | | 10.47% | | 05/2028 | | 1,985 | | | 1,904 | | | 1,962 | |
| Mavis Tire Express Services Topco Corp. | | Retail | | SOFR(M) | | 4.00% | | 9.47% | | 05/2028 | | 4,131 | | | 4,118 | | | 4,144 | |
| MED ParentCo, LP | | Healthcare | | SOFR(M) | | 4.25% | | 9.72% | | 08/2026 | | 12,458 | | | 12,407 | | | 12,361 | |
| MH Sub I, LLC (Micro Holding Corp.) | | Business Services | | SOFR(M) | | 4.25% | | 9.61% | | 05/2028 | | 3,558 | | | 3,479 | | | 3,505 | |
| Netsmart, Inc. | | Healthcare | | SOFR(M) | | 3.75% | | 9.22% | | 10/2027 | | 3,900 | | | 3,900 | | | 3,913 | |
| Nielsen Consumer Inc. | | Business Services | | SOFR(M) | | 6.25% | | 11.61% | | 03/2028 | | 14,925 | | | 13,402 | | | 14,639 | |
| OMNIA Partners, LLC | | Business Services | | SOFR(Q) | | 4.25% | | 9.63% | | 07/2030 | | 5,919 | | | 5,862 | | | 5,960 | |
| Optiv Parent Inc. | | Business Services | | SOFR(Q) | | 5.25% | | 10.63% | | 07/2026 | | 6,585 | | | 6,396 | | | 6,308 | |
| Osaic Holdings, Inc. | | Financial Services | | SOFR(M) | | 4.50% | | 9.86% | | 08/2028 | | 9,650 | | | 9,559 | | | 9,693 | |
| Osmosis Buyer Limited | | Food & Beverage | | SOFR(M) | | 3.75% | | 9.09% | | 07/2028 | | 2,494 | | | 2,457 | | | 2,499 | |
| Osmosis Buyer Limited | | Food & Beverage | | SOFR(M) | | 4.25% | | 9.60% | | 07/2028 | | 2,405 | | | 2,333 | | | 2,418 | |
| Pearls (Netherlands) Bidco B.V. | | Specialty Chemicals & Materials | | SOFR(Q) | | 3.75% | | 9.13% | | 02/2029 | | 1,710 | | | 1,707 | | | 1,698 | |
| Peraton Corp. | | Federal Services | | SOFR(M) | | 3.75% | | 9.21% | | 02/2028 | | 4,147 | | | 4,133 | | | 4,161 | |
| Physician Partners, LLC | | Healthcare | | SOFR(Q) | | 4.00% | | 9.53% | | 12/2028 | | 4,231 | | | 4,197 | | | 4,010 | |
| Planview Parent, Inc. | | Software | | SOFR(Q) | | 4.00% | | 9.61% | | 12/2027 | | 10,721 | | | 10,528 | | | 10,669 | |
| Premise Health Holding Corp. | | Healthcare | | SOFR(Q) | | 3.75% | | 9.25% | | 07/2025 | | 7,328 | | | 7,319 | | | 7,200 | |
| Project Alpha Intermediate Holding, Inc. | | Software | | SOFR(M) | | 4.75% | | 10.11% | | 10/2030 | | 13,745 | | | 13,474 | | | 13,859 | |
| Project Ruby Ultimate Parent Corp. | | Healthcare | | SOFR(M) | | 5.75% | | 11.22% | | 03/2028 | | 4,938 | | | 4,817 | | | 5,018 | |
| Project Ruby Ultimate Parent Corp. | | Healthcare | | SOFR(M) | | 3.25% | | 8.72% | | 03/2028 | | 4,308 | | | 4,293 | | | 4,310 | |
| RealPage, Inc. | | Software | | SOFR(M) | | 3.00% | | 8.47% | | 04/2028 | | 4,305 | | | 4,298 | | | 4,288 | |
| Renaissance Holding Corp. | | Education | | SOFR(M) | | 4.75% | | 10.11% | | 04/2030 | | 6,612 | | | 6,429 | | | 6,644 | |
| RLG Holdings, LLC | | Packaging | | SOFR(M) | | 4.25% | | 9.72% | | 07/2028 | | 5,727 | | | 5,707 | | | 5,403 | |
| RxB Holdings, Inc. | | Healthcare | | SOFR(M) | | 4.50% | | 9.97% | | 12/2027 | | 6,339 | | | 6,247 | | | 6,327 | |
| RxB Holdings, Inc. | | Healthcare | | SOFR(M) | | 5.25% | | 10.61% | | 12/2027 | | 3,669 | | | 3,586 | | | 3,669 | |
| Sierra Enterprises, LLC | | Food & Beverage | | SOFR(Q) | | 2.50% + 4.25% PIK | | 12.13% | | 05/2027 | | 2,484 | | | 2,483 | | | 2,304 | |
| Snap One Holdings Corp. | | Distribution & Logistics | | SOFR(Q) | | 4.50% | | 10.00% | | 12/2028 | | 6,556 | | | 6,506 | | | 6,425 | |
| Spring Education Group, Inc. | | Education | | SOFR(Q) | | 4.50% | | 9.85% | | 10/2030 | | 12,349 | | | 12,198 | | | 12,390 | |
| Storable, Inc. | | Software | | SOFR(M) | | 3.50% | | 8.86% | | 04/2028 | | 3,785 | | | 3,779 | | | 3,782 | |
| Symplr Software, Inc. | | Healthcare | | SOFR(Q) | | 4.50% | | 9.98% | | 12/2027 | | 15,560 | | | 15,470 | | | 13,978 | |
| Syndigo LLC | | Software | | SOFR(M) | | 4.50% | | 9.97% | | 12/2027 | | 14,588 | | | 14,519 | | | 14,588 | |
| Therapy Brands Holdings LLC | | Software | | SOFR(M) | | 4.00% | | 9.47% | | 05/2028 | | 4,058 | | | 4,043 | | | 3,763 | |
| Thermostat Purchaser III, Inc. | | Business Services | | SOFR(Q) | | 4.50% | | 10.04% | | 08/2028 | | 6,560 | | | 6,535 | | | 6,475 | |
| TMF Sapphire Bidco B.V. | | Business Services | | SOFR(Q) | | 5.00% | | 10.41% | | 05/2028 | | 2,667 | | | 2,616 | | | 2,685 | |
| TRC Companies LLC | | Business Services | | SOFR(M) | | 3.75% | | 9.22% | | 12/2028 | | 13,525 | | | 13,470 | | | 13,548 | |
| UKG Inc. | | Software | | SOFR(Q) | | 4.50% | | 9.99% | | 05/2026 | | 4,975 | | | 4,880 | | | 5,004 | |
| USI, Inc. | | Financial Services | | SOFR(Q) | | 3.00% | | 8.35% | | 11/2029 | | 2,446 | | | 2,403 | | | 2,456 | |
| Valcour Packaging, LLC | | Packaging | | SOFR(M) | | 3.75% | | 9.21% | | 10/2028 | | 4,459 | | | 4,449 | | | 3,552 | |
| WatchGuard Technologies, Inc. | | Software | | SOFR(M) | | 5.25% | | 10.60% | | 07/2029 | | 5,237 | | | 4,944 | | | 5,045 | |
| Waystar Technologies, Inc. | | Healthcare | | SOFR(M) | | 4.00% | | 9.47% | | 10/2026 | | 3,983 | | | 3,978 | | | 4,003 | |
| | | | | | | | | | | | | | | | |
| | | | | | | | | | | | | | | | |
| | | | | | | | | | | | | | | | | | | | | | | | | | | | | | | | | | | | | | | | | | | | | | | | | | |
| Portfolio Company and Type of Investment | | Industry | | Reference | | Spread | | Interest Rate (1) | | Maturity Date | | Principal Amount or Par Value | | Cost | | Fair
Value (2) |
| | | | | | | | | | | | | | | | |
| Wrench Group LLC | | Consumer Services | | SOFR(Q) | | 4.00% | | 9.61% | | 04/2026 | | $ | 7,743 | | | $ | 7,732 | | | $ | 7,772 | |
| Wrench Group LLC | | Consumer Services | | SOFR(Q) | | 4.50% | | 9.95% | | 04/2026 | | 5,473 | | | 5,386 | | | 5,495 | |
| Zest Acquisition Corp. | | Healthcare | | SOFR(M) | | 5.50% | | 10.86% | | 02/2028 | | 4,072 | | | 3,926 | | | 3,999 | |
| Total Funded Investments | | | | | | | | | | | | $ | 656,081 | | | $ | 646,319 | | | $ | 636,554 | |
| Unfunded Investments - First lien | | | | | | | | | | | | | | | | |
| Groundworks, LLC | | Consumer Services | | — | | — | | — | | 09/2024 | | $ | 65 | | | $ | (1) | | | $ | (1) | |
| OMNIA Partners, LLC | | Business Services | | — | | — | | — | | 01/2024 | | 556 | | | (3) | | | 4 | |
| Osmosis Buyer Limited | | Food & Beverage | | — | | — | | — | | 07/2028 | | 506 | | | — | | | 3 | |
| Total Unfunded Investments | | | | | | | | | | | | $ | 1,127 | | | $ | (4) | | | $ | 6 | |
| Total Investments | | | | | | | | | | | | $ | 657,208 | | | $ | 646,315 | | | $ | 636,560 | |
(1)All interest is payable in cash unless otherwise indicated. All of the variable rate debt investments bear interest at a rate that may be determined by reference to the Secured Overnight Financing Rate (SOFR). For each investment, the current interest rate provided reflects the rate in effect as of December 31, 2023.
(2)Represents the fair value in accordance with Accounting Standards Codification Topic 820, Fair Value Measurement and Disclosures ("ASC 820"). The Company's board of directors does not determine the fair value of the investments held by SLP III.
The following table is a listing of the individual investments in SLP III's portfolio as of December 31, 2022:
| | | | | | | | | | | | | | | | | | | | | | | | | | | | | | | | | | | | | | | | | | | | | | | | | | |
| Portfolio Company and Type of Investment | | Industry | | Reference | | Spread | | Interest Rate (1) | | Maturity Date | | Principal Amount or Par Value | | Cost | | Fair
Value (2) |
| | | | | | | | | | | | | | | | |
| Funded Investments - First lien | | | | | | | | | | | | | | | | |
| ADMI Corp. (aka Aspen Dental) | | Healthcare | | L(M) | | 3.75% | | 8.13% | | 12/2027 | | $ | 2,400 | | | $ | 2,391 | | | $ | 2,194 | |
| Advisor Group Holdings, Inc. | | Financial Services | | L(M) | | 4.50% | | 8.88% | | 07/2026 | | 9,700 | | | 9,672 | | | 9,512 | |
| AG Parent Holdings, LLC | | Healthcare | | L(M) | | 5.00% | | 9.38% | | 07/2026 | | 12,125 | | | 12,092 | | | 11,769 | |
| Artera Services, LLC | | Distribution & Logistics | | L(Q) | | 3.50% | | 8.23% | | 03/2025 | | 6,838 | | | 6,806 | | | 5,624 | |
| AssuredPartners, Inc. | | Insurance Services | | SOFR(M) | | 4.25% | | 8.57% | | 02/2027 | | 1,995 | | | 1,926 | | | 1,985 | |
| Aston FinCo S.a.r.l. / Aston US Finco, LLC | | Software | | L(M) | | 4.25% | | 8.63% | | 10/2026 | | 5,835 | | | 5,801 | | | 4,989 | |
| athenahealth Group Inc. | | Healthcare | | SOFR(M) | | 3.50% | | 7.82% | | 02/2029 | | 6,912 | | | 6,644 | | | 6,258 | |
| BCPE Empire Holdings, Inc. | | Distribution & Logistics | | L(M) | | 4.00% | | 8.38% | | 06/2026 | | 4,258 | | | 4,235 | | | 4,141 | |
| BCPE Empire Holdings, Inc. | | Distribution & Logistics | | SOFR(M) | | 4.63% | | 9.05% | | 06/2026 | | 3,257 | | | 3,156 | | | 3,205 | |
| Bella Holding Company, LLC | | Healthcare | | L(M) | | 3.75% | | 8.13% | | 05/2028 | | 2,238 | | | 2,220 | | | 2,123 | |
| Bluefin Holding, LLC | | Software | | L(Q) | | 5.75% | | 10.48% | | 09/2026 | | 9,700 | | | 9,617 | | | 9,418 | |
| Bluefin Holding, LLC | | Software | | L(Q) | | 5.75% | | 10.48% | | 09/2026 | | 2,562 | | | 2,530 | | | 2,488 | |
| Bracket Intermediate Holding Corp. | | Healthcare | | L(Q) | | 4.25% | | 7.99% | | 09/2025 | | 14,362 | | | 14,333 | | | 13,689 | |
| Brave Parent Holdings, Inc. | | Software | | L(M) | | 4.00% | | 8.38% | | 04/2025 | | 4,266 | | | 4,260 | | | 4,145 | |
| Brown Group Holding, LLC | | Distribution & Logistics | | SOFR(Q) | | 3.75% | | 7.91% | | 07/2029 | | 7,045 | | | 6,875 | | | 7,033 | |
| Cano Health, LLC | | Healthcare | | SOFR(M) | | 4.00% | | 8.42% | | 11/2027 | | 9,508 | | | 9,476 | | | 7,642 | |
| Cardinal Parent, Inc. | | Software | | L(Q) | | 4.50% | | 9.23% | | 11/2027 | | 9,922 | | | 9,709 | | | 9,522 | |
| CE Intermediate I, LLC | | Software | | L(Q) | | 4.00% | | 8.59% | | 11/2028 | | 10,920 | | | 10,854 | | | 10,388 | |
| CentralSquare Technologies, LLC | | Software | | L(Q) | | 3.75% | | 8.48% | | 08/2025 | | 14,400 | | | 14,385 | | | 12,488 | |
| CHA Holdings, Inc. | | Business Services | | L(Q) | | 4.50% | | 9.23% | | 04/2025 | | 957 | | | 957 | | | 945 | |
| CommerceHub, Inc. | | Software | | SOFR(S) | | 4.00% | | 8.78% | | 12/2027 | | 5,717 | | | 5,695 | | | 5,274 | |
| Confluent Health, LLC | | Healthcare | | L(M) | | 4.00% | | 8.38% | | 11/2028 | | 11,962 | | | 11,909 | | | 10,212 | |
| Confluent Health, LLC | | Healthcare | | L(M) | | 4.00% | | 8.38% | | 11/2028 | | 1,499 | | | 1,492 | | | 1,280 | |
| Confluent Medical Technologies, Inc. | | Healthcare | | SOFR(Q) | | 3.75% | | 8.33% | | 02/2029 | | 6,947 | | | 6,916 | | | 6,617 | |
| Convey Health Solutions, Inc. | | Healthcare | | SOFR(Q) | | 5.25% | | 9.93% | | 09/2026 | | 12,967 | | | 12,598 | | | 12,578 | |
| Cornerstone OnDemand, Inc. | | Software | | L(M) | | 3.75% | | 8.13% | | 10/2028 | | 4,511 | | | 4,492 | | | 4,049 | |
| Covenant Surgical Partners, Inc. | | Healthcare | | L(Q) | | 4.00% | | 8.41% | | 07/2026 | | 2,000 | | | 1,984 | | | 1,710 | |
| Covenant Surgical Partners, Inc. | | Healthcare | | L(Q) | | 4.00% | | 8.41% | | 07/2026 | | 9,680 | | | 9,628 | | | 8,276 | |
| CRCI Longhorn Holdings, Inc. | | Business Services | | L(M) | | 3.50% | | 7.77% | | 08/2025 | | 14,363 | | | 14,333 | | | 13,597 | |
| CVET Midco 2, L.P. | | Software | | SOFR(Q) | | 5.00% | | 9.58% | | 10/2029 | | 6,965 | | | 6,556 | | | 6,539 | |
| DG Investment Intermediate Holdings 2, Inc. | | Business Services | | SOFR(M) | | 3.75% | | 8.13% | | 03/2028 | | 7,388 | | | 7,364 | | | 7,088 | |
| Dealer Tire Financial, LLC | | Distribution & Logistics | | SOFR(M) | | 4.50% | | 8.82% | | 12/2027 | | 9,725 | | | 9,690 | | | 9,628 | |
| Discovery Purchaser Corporation | | Specialty Chemicals & Materials | | SOFR(Q) | | 4.38% | | 7.97% | | 10/2029 | | 7,100 | | | 6,543 | | | 6,499 | |
| Dispatch Acquisition Holdings, LLC | | Industrial Services | | L(Q) | | 4.25% | | 8.98% | | 03/2028 | | 15,606 | | | 15,196 | | | 13,265 | |
| Drilling Info Holdings, Inc. | | Business Services | | L(M) | | 4.25% | | 8.63% | | 07/2025 | | 18,197 | | | 18,159 | | | 17,560 | |
| EAB Global, Inc. | | Education | | L(M) | | 3.50% | | 7.88% | | 08/2028 | | 3,212 | | | 3,199 | | | 3,098 | |
| Energize Holdco LLC | | Business Services | | L(M) | | 3.75% | | 8.13% | | 12/2028 | | 12,488 | | | 12,433 | | | 11,863 | |
| eResearchTechnology, Inc. | | Healthcare | | L(M) | | 4.50% | | 8.88% | | 02/2027 | | 7,271 | | | 7,247 | | | 6,459 | |
| EyeCare Partners, LLC | | Healthcare | | L(Q) | | 3.75% | | 8.48% | | 02/2027 | | 14,611 | | | 14,599 | | | 12,431 | |
| Foundational Education Group, Inc. | | Education | | SOFR(Q) | | 3.75% | | 8.59% | | 08/2028 | | 9,405 | | | 9,326 | | | 8,840 | |
| Greenway Health, LLC | | Healthcare | | L(Q) | | 3.75% | | 8.48% | | 02/2024 | | 14,219 | | | 14,221 | | | 9,971 | |
| Heartland Dental, LLC | | Healthcare | | L(M) | | 3.75% | | 8.13% | | 04/2025 | | 18,160 | | | 18,126 | | | 16,847 | |
| Help/Systems Holdings, Inc. | | Software | | SOFR(Q) | | 4.00% | | 8.19% | | 11/2026 | | 18,068 | | | 17,953 | | | 16,335 | |
| Higginbotham Insurance Agency, Inc. | | Business Services | | L(M) | | 5.25% | | 9.63% | | 11/2026 | | 9,079 | | | 9,018 | | | 8,972 | |
| HighTower Holding, LLC | | Financial Services | | L(Q) | | 4.00% | | 8.28% | | 04/2028 | | 4,778 | | | 4,739 | | | 4,402 | |
| Houghton Mifflin Harcourt Company | | Education | | SOFR(M) | | 5.25% | | 9.67% | | 04/2029 | | 5,652 | | | 5,493 | | | 5,394 | |
| Idera, Inc. | | Software | | L(Q) | | 3.75% | | 7.50% | | 03/2028 | | 15,803 | | | 15,792 | | | 14,944 | |
| | | | | | | | | | | | | | | | |
| | | | | | | | | | | | | | | | |
| | | | | | | | | | | | | | | | | | | | | | | | | | | | | | | | | | | | | | | | | | | | | | | | | | |
| Portfolio Company and Type of Investment | | Industry | | Reference | | Spread | | Interest Rate (1) | | Maturity Date | | Principal Amount or Par Value | | Cost | | Fair
Value (2) |
| | | | | | | | | | | | | | | | |
| Kestra Advisor Services Holdings A, Inc. | | Financial Services | | L(Q) | | 4.25% | | 8.98% | | 06/2026 | | $ | 11,935 | | | $ | 11,889 | | | $ | 11,572 | |
| LI Group Holdings, Inc. | | Software | | L(M) | | 3.75% | | 8.13% | | 03/2028 | | 4,573 | | | 4,565 | | | 4,493 | |
| LSCS Holdings, Inc. | | Healthcare | | L(M) | | 4.50% | | 8.88% | | 12/2028 | | 7,567 | | | 7,534 | | | 7,236 | |
| Mamba Purchaser, Inc. | | Healthcare | | L(M) | | 3.50% | | 7.89% | | 10/2028 | | 5,730 | | | 5,706 | | | 5,486 | |
| Maverick Bidco Inc. | | Software | | L(Q) | | 3.75% | | 8.16% | | 05/2028 | | 3,960 | | | 3,945 | | | 3,763 | |
| Maverick Bidco Inc. | | Software | | SOFR(Q) | | 5.00% | | 9.28% | | 05/2028 | | 2,000 | | | 1,905 | | | 1,901 | |
| Mavis Tire Express Services Topco Corp. | | Retail | | SOFR(M) | | 4.00% | | 8.50% | | 05/2028 | | 4,174 | | | 4,157 | | | 3,993 | |
| MED ParentCo, LP | | Healthcare | | L(M) | | 4.25% | | 8.63% | | 08/2026 | | 12,588 | | | 12,520 | | | 10,800 | |
| Mercury Borrower, Inc. | | Business Services | | L(Q) | | 3.50% | | 8.25% | | 08/2028 | | 4,179 | | | 4,160 | | | 3,996 | |
| MH Sub I, LLC (Micro Holding Corp.) | | Software | | L(M) | | 3.75% | | 8.13% | | 09/2024 | | 10,695 | | | 10,677 | | | 10,406 | |
| Mitnick Corporate Purchaser, Inc. | | Software | | SOFR(Q) | | 4.75% | | 8.94% | | 05/2029 | | 4,655 | | | 4,633 | | | 4,373 | |
| National Intergovernmental Purchasing Alliance Company | | Business Services | | SOFR(Q) | | 3.50% | | 8.08% | | 05/2025 | | 8,485 | | | 8,483 | | | 8,416 | |
| Navex Topco, Inc. | | Software | | L(M) | | 3.25% | | 7.64% | | 09/2025 | | 10,887 | | | 10,841 | | | 10,811 | |
| Netsmart, Inc. | | Healthcare | | L(M) | | 4.00% | | 8.38% | | 10/2027 | | 3,940 | | | 3,940 | | | 3,805 | |
| Outcomes Group Holdings, Inc. | | Healthcare | | L(Q) | | 3.25% | | 7.98% | | 10/2025 | | 3,331 | | | 3,327 | | | 3,237 | |
| Pearls (Netherlands) Bidco B.V. | | Specialty Chemicals & Materials | | SOFR(Q) | | 3.75% | | 7.84% | | 02/2029 | | 1,728 | | | 1,724 | | | 1,682 | |
| Peraton Corp. | | Federal Services | | L(M) | | 3.75% | | 8.13% | | 02/2028 | | 7,235 | | | 7,206 | | | 7,082 | |
| PetVet Care Centers, LLC (fka Pearl Intermediate Parent LLC) | | Consumer Services | | L(M) | | 3.50% | | 7.88% | | 02/2025 | | 4,573 | | | 4,570 | | | 4,321 | |
| Physician Partners, LLC | | Healthcare | | SOFR(M) | | 4.00% | | 8.42% | | 12/2028 | | 5,627 | | | 5,575 | | | 5,383 | |
| Planview Parent, Inc. | | Software | | L(Q) | | 4.00% | | 8.73% | | 12/2027 | | 10,832 | | | 10,598 | | | 10,109 | |
| Premise Health Holding Corp. | | Healthcare | | L(S) | | 3.75% | | 7.92% | | 07/2025 | | 7,405 | | | 7,390 | | | 7,183 | |
| Project Ruby Ultimate Parent Corp. | | Healthcare | | L(M) | | 3.25% | | 7.63% | | 03/2028 | | 4,352 | | | 4,335 | | | 4,124 | |
| Project Ruby Ultimate Parent Corp. | | Healthcare | | SOFR(M) | | 5.75% | | 10.07% | | 03/2028 | | 4,988 | | | 4,844 | | | 4,838 | |
| RealPage, Inc. | | Software | | L(M) | | 3.00% | | 7.38% | | 04/2028 | | 10,159 | | | 10,139 | | | 9,687 | |
| RLG Holdings, LLC | | Packaging | | L(M) | | 4.00% | | 8.38% | | 07/2028 | | 5,785 | | | 5,761 | | | 5,462 | |
| Sierra Enterprises, LLC | | Food & Beverage | | L(Q) | | 4.00% | | 8.41% | | 11/2024 | | 2,381 | | | 2,380 | | | 1,661 | |
| Snap One Holdings Corp. | | Distribution & Logistics | | L(M) | | 4.50% | | 8.88% | | 12/2028 | | 6,622 | | | 6,564 | | | 6,093 | |
| Sovos Brands Intermediate, Inc. | | Food & Beverage | | L(Q) | | 3.50% | | 7.91% | | 06/2028 | | 9,429 | | | 9,410 | | | 9,225 | |
| Spring Education Group, Inc. (fka SSH Group Holdings, Inc.) | | Education | | L(Q) | | 4.00% | | 8.73% | | 07/2025 | | 11,933 | | | 11,921 | | | 11,692 | |
| Storable, Inc. | | Software | | SOFR(M) | | 3.50% | | 7.98% | | 04/2028 | | 3,823 | | | 3,816 | | | 3,657 | |
| Symplr Software, Inc. | | Healthcare | | SOFR(Q) | | 4.50% | | 8.69% | | 12/2027 | | 15,720 | | | 15,610 | | | 13,205 | |
| Syndigo LLC | | Software | | L(M) | | 4.50% | | 8.84% | | 12/2027 | | 14,738 | | | 14,655 | | | 14,340 | |
| Therapy Brands Holdings LLC | | Software | | L(M) | | 4.00% | | 8.35% | | 05/2028 | | 4,099 | | | 4,082 | | | 3,853 | |
| Thermostat Purchaser III, Inc. | | Business Services | | L(Q) | | 4.50% | | 9.23% | | 08/2028 | | 6,003 | | | 5,978 | | | 5,800 | |
| USI, Inc. (fka Compass Investors Inc.) | | Insurance Services | | SOFR(Q) | | 3.75% | | 8.33% | | 11/2029 | | 5,486 | | | 5,377 | | | 5,441 | |
| Valcour Packaging, LLC | | Packaging | | L(S) | | 3.75% | | 7.98% | | 10/2028 | | 4,504 | | | 4,492 | | | 3,772 | |
| VT Topco, Inc. | | Business Services | | L(M) | | 3.75% | | 8.13% | | 08/2025 | | 31 | | | 31 | | | 30 | |
| VT Topco, Inc. | | Business Services | | L(M) | | 3.50% | | 7.88% | | 08/2025 | | 2,729 | | | 2,729 | | | 2,647 | |
| VT Topco, Inc. | | Business Services | | L(M) | | 3.75% | | 8.13% | | 08/2025 | | 838 | | | 835 | | | 815 | |
| WatchGuard Technologies, Inc. | | Software | | SOFR(M) | | 5.25% | | 9.57% | | 07/2029 | | 5,290 | | | 4,957 | | | 5,075 | |
| Waystar Technologies, Inc. | | Healthcare | | L(M) | | 4.00% | | 8.38% | | 10/2026 | | 4,025 | | | 4,018 | | | 3,972 | |
| WP CityMD Bidco LLC | | Healthcare | | L(M) | | 3.25% | | 7.63% | | 12/2028 | | 4,148 | | | 4,123 | | | 4,145 | |
| Wrench Group LLC | | Consumer Services | | L(Q) | | 4.00% | | 8.73% | | 04/2026 | | 7,824 | | | 7,809 | | | 7,565 | |
| YI, LLC | | Healthcare | | L(M) | | 4.00% | | 8.38% | | 11/2024 | | 9,490 | | | 9,487 | | | 9,174 | |
| Total Funded Investments | | | | | | | | | | | | $ | 687,069 | | | $ | 681,338 | | | $ | 639,607 | |
| | | | | | | | | | | | | | | | |
| | | | | | | | | | | | | | | | |
| | | | | | | | | | | | | | | | | | | | | | | | | | | | | | | | | | | | | | | | | | | | | | | | | | |
| Portfolio Company and Type of Investment | | Industry | | Reference | | Spread | | Interest Rate (1) | | Maturity Date | | Principal Amount or Par Value | | Cost | | Fair
Value (2) |
| | | | | | | | | | | | | | | | |
| Unfunded Investments - First lien | | | | | | | | | | | | | | | | |
| athenahealth Group Inc. | | Healthcare | | — | | — | | — | | 01/2024 | | $ | 847 | | | $ | (44) | | | $ | (80) | |
| Confluent Health, LLC | | Healthcare | | — | | — | | — | | 11/2023 | | 1,139 | | | (6) | | | (167) | |
| Thermostat Purchaser III, Inc. | | Business Services | | — | | — | | — | | 08/2023 | | 937 | | | — | | | (32) | |
| VT Topco, Inc. | | Business Services | | — | | — | | — | | 08/2023 | | 25 | | | — | | | (1) | |
| Total Unfunded Investments | | | | | | | | | | | | $ | 2,948 | | | $ | (50) | | | $ | (280) | |
| Total Investments | | | | | | | | | | | | $ | 690,017 | | | $ | 681,288 | | | $ | 639,327 | |
(1)All interest is payable in cash unless otherwise indicated. A majority of the variable rate debt investments bear interest at a rate that may be determined by reference to the LIBOR (L), the Prime Rate (P), Secured Overnight Financing Rate (SOFR) and the alternative base rate (Base). For each investment, the current interest rate provided reflects the rate in effect as of December 31, 2022.
(2)Represents the fair value in accordance with ASC 820. The Company's board of directors does not determine the fair value of the investments held by SLP III.
Below is certain summarized financial information for SLP III as of December 31, 2023 and December 31, 2022 and for the years ended December 31, 2023, December 31, 2022 and December 31, 2021: | | | | | | | | | | | | | |
| Selected Balance Sheet Information: | December 31, 2023 | | December 31, 2022 | | |
Investments at fair value (cost of $646,315 and $681,288, respectively) | $ | 636,560 | | | $ | 639,327 | | | |
| Cash and other assets | 21,443 | | | 17,149 | | | |
| | | | | |
| Total assets | $ | 658,003 | | | $ | 656,476 | | | |
| | | | | |
| Credit facility | $ | 453,200 | | | $ | 512,100 | | | |
Deferred financing costs (net of accumulated amortization of $5,650 and $4,840, respectively) | (943) | | | (1,695) | | | |
| Payable for unsettled securities purchased | 23,881 | | | — | | | |
| Distribution payable | 6,672 | | | 5,688 | | | |
| Other liabilities | 7,862 | | | 6,492 | | | |
| Total liabilities | 490,672 | | | 522,585 | | | |
| | | | | |
| Members' capital | $ | 167,331 | | | $ | 133,891 | | | |
| Total liabilities and members' capital | $ | 658,003 | | | $ | 656,476 | | | |
| | | | | | | | | | | | | | | | | | | |
| Year Ended December 31, |
| Selected Statement of Operations Information: | 2023 | | 2022 | | 2021 | | |
| Interest income | $ | 64,921 | | | $ | 41,382 | | | $ | 31,240 | | | |
| Other income | 502 | | | 774 | | | 573 | | | |
| Total investment income | 65,423 | | | 42,156 | | | 31,813 | | | |
| | | | | | | |
| Interest and other financing expenses | 35,336 | | | 19,274 | | | 10,624 | | | |
| Other expenses | 1,143 | | | 863 | | | 804 | | | |
| | | | | | | |
| | | | | | | |
| Net expenses | 36,479 | | | 20,137 | | | 11,428 | | | |
| Net investment income | 28,944 | | | 22,019 | | | 20,385 | | | |
| | | | | | | |
| Net realized (losses) gains on investments | (2,663) | | | (247) | | | 572 | | | |
| Net change in unrealized appreciation (depreciation) of investments | 32,206 | | | (42,366) | | | 6,360 | | | |
| Net increase (decrease) in members' capital | $ | 58,487 | | | $ | (20,594) | | | $ | 27,317 | | | |
For the years ended December 31, 2023, December 31, 2022 and December 31, 2021, the Company earned approximately $20,038, $17,485 and $16,712, respectively, of dividend income related to SLP III, which is included in
dividend income. As of December 31, 2023 and December 31, 2022 approximately $5,338 and $4,550, respectively, of dividend income related to SLP III was included in interest and dividend receivable.
The Company has determined that SLP III is an investment company under ASC 946; however, in accordance with such guidance the Company will generally not consolidate its investment in a company other than a wholly-owned investment company subsidiary. Furthermore, ASC 810 concludes that in a joint venture where both members have equal decision making authority, it is not appropriate for one member to consolidate the joint venture since neither has control. Accordingly, the Company does not consolidate SLP III.
NMFC Senior Loan Program IV LLC
NMFC Senior Loan Program IV LLC ("SLP IV") was formed as a Delaware limited liability company on April 6, 2021, and commenced operations on May 5, 2021. SLP IV is structured as a private joint venture investment fund between the Company and SkyKnight Income Alpha, LLC ("SkyKnight Alpha") and operates under the First Amended and Restated Limited Liability Company Agreement of NMFC Senior Loan Program IV LLC, dated May 5, 2021 (the "SLP IV Agreement"). Upon the effectiveness of the SLP IV Agreement, the members contributed their respective membership interests in NMFC Senior Loan Program I LLC ("SLP I") and NMFC Senior Loan Program II LLC ("SLP II") to SLP IV. Immediately following the contribution of their membership interests, SLP I and SLP II became wholly-owned subsidiaries of SLP IV. The purpose of the joint venture is to invest primarily in senior secured loans issued by portfolio companies within the Company's core industry verticals. These investments are typically broadly syndicated first lien loans. All investment decisions must be unanimously approved by the board of managers of SLP IV, which has equal representation from the Company and SkyKnight Alpha. SLP IV has a five year investment period and will continue in existence until May 5, 2028. The investment period may be extended for up to one year pursuant to certain terms of the SLP IV Agreement.
SLP IV is capitalized with equity contributions which were transferred and contributed from its members. As of December 31, 2023 and December 31, 2022, the Company and SkyKnight Alpha have transferred and contributed $112,400 and $30,600, respectively, of their membership interests in SLP I and SLP II to SLP IV. The Company’s investment in SLP IV is disclosed on the Company’s Consolidated Schedule of Investments as of December 31, 2023 and December 31, 2022.
On May 5, 2021, SLP IV entered into a $370,000 revolving credit facility with Wells Fargo Bank, National Association which matures on May 5, 2026. As of the amendment on April 28, 2023, the facility bears interest at a rate of SOFR plus 1.70%. Prior to the amendment on April 28, 2023, the facility bore interest at a rate of LIBOR plus 1.60% per annum. As of December 31, 2023 and December 31, 2022, SLP IV had total investments with an aggregate fair value of approximately $467,886 and $473,762, respectively, and debt outstanding under its credit facility of $306,537 and $365,537, respectively. As of December 31, 2023, none of SLP IV’s investments were on non-accrual. Additionally, as of December 31, 2023 and December 31, 2022, SLP IV had unfunded commitments in the form of delayed draws of $792 and $1,973, respectively.
Below is a summary of SLP IV's consolidated portfolio, along with a listing of the individual investments in SLP IV's consolidated portfolio as of December 31, 2023 and December 31, 2022:
| | | | | | | | | | | | | | |
| | December 31, 2023 | | December 31, 2022 |
| First lien investments (1) | | $ | 482,776 | | | $ | 510,372 | |
| Weighted average interest rate on first lien investments (2) | | 9.81 | % | | 8.54 | % |
| Number of portfolio companies in SLP IV | | 78 | | | 74 | |
| Largest portfolio company investment (1) | | $ | 17,400 | | | $ | 21,982 | |
| Total of five largest portfolio company investments (1) | | $ | 67,838 | | | $ | 93,734 | |
(1)Reflects principal amount or par value of investment.
(2)Computed as the all in interest rate in effect on accruing investments divided by the total principal amount of investments.
The following table is a listing of the individual investments in SLP IV's consolidated portfolio as of December 31, 2023:
| | | | | | | | | | | | | | | | | | | | | | | | | | | | | | | | | | | | | | | | | | | | | | | | | | |
| Portfolio Company and Type of Investment | | Industry | | Reference | | Spread | | Interest Rate (1) | | Maturity Date | | Principal Amount or Par Value | | Cost | | Fair
Value (2) |
| | | | | | | | | | | | | | | | |
| Funded Investments - First lien | | | | | | | | | | | | | | | | |
| ADG, LLC | | Healthcare | | SOFR(Q) | | 1.00% + 3.00%/PIK | | 9.54% | | 09/2026 | | $ | 17,400 | | | $ | 17,394 | | | $ | 14,967 | |
| ADMI Corp. (aka Aspen Dental) | | Healthcare | | SOFR(M) | | 3.75% | | 9.22% | | 12/2027 | | 1,833 | | | 1,827 | | | 1,744 | |
| Aretec Group, Inc. (fka RCS Capital Corporation) | | Financial Services | | SOFR(M) | | 4.50% | | 9.96% | | 08/2030 | | 4,804 | | | 4,700 | | | 4,810 | |
| Artera Services, LLC | | Distribution & Logistics | | SOFR(Q) | | 3.50% | | 8.95% | | 03/2025 | | 4,068 | | | 4,057 | | | 3,832 | |
| Ascensus Group Holdings, Inc. | | Business Services | | SOFR(M) | | 3.50% | | 8.97% | | 08/2028 | | 4,171 | | | 4,156 | | | 4,171 | |
| athenahealth Group Inc. | | Healthcare | | SOFR(M) | | 3.25% | | 8.61% | | 02/2029 | | 2,373 | | | 2,364 | | | 2,368 | |
| Barracuda Parent, LLC | | Software | | SOFR(Q) | | 4.50% | | 9.88% | | 08/2029 | | 4,950 | | | 4,824 | | | 4,851 | |
| Bayou Intermediate II, LLC | | Healthcare | | SOFR(Q) | | 4.50% | | 10.15% | | 08/2028 | | 8,940 | | | 8,899 | | | 8,549 | |
| BCPE Empire Holdings, Inc. | | Distribution & Logistics | | SOFR(M) | | 4.75% | | 10.11% | | 12/2028 | | 4,353 | | | 4,313 | | | 4,371 | |
| Bella Holding Company, LLC | | Healthcare | | SOFR(M) | | 3.75% | | 9.21% | | 05/2028 | | 753 | | | 751 | | | 748 | |
| Bleriot US Bidco Inc. | | Federal Services | | SOFR(Q) | | 4.00% | | 9.61% | | 10/2028 | | 3,900 | | | 3,882 | | | 3,921 | |
| Boxer Parent Company Inc. | | Software | | SOFR(M) | | 4.25% | | 9.60% | | 12/2028 | | 8,987 | | | 8,897 | | | 9,070 | |
| Bracket Intermediate Holding Corp. | | Healthcare | | SOFR(Q) | | 5.00% | | 10.45% | | 05/2028 | | 4,394 | | | 4,275 | | | 4,402 | |
| Brown Group Holding, LLC | | Distribution & Logistics | | SOFR(Q) | | 3.75% | | 9.13% | | 07/2029 | | 5,370 | | | 5,255 | | | 5,393 | |
| CE Intermediate I, LLC | | Software | | SOFR(Q) | | 3.50% | | 9.02% | | 11/2028 | | 8,095 | | | 8,052 | | | 8,035 | |
| CentralSquare Technologies, LLC | | Software | | SOFR(Q) | | 3.75% | | 9.25% | | 08/2025 | | 14,250 | | | 14,240 | | | 13,817 | |
| CHA Holdings, Inc. | | Business Services | | SOFR(M) | | 4.50% | | 10.15% | | 04/2025 | | 10,692 | | | 10,682 | | | 10,692 | |
| CHA Holdings, Inc. | | Business Services | | SOFR(M) | | 4.50% | | 9.97% | | 04/2025 | | 1,963 | | | 1,961 | | | 1,963 | |
| Cloudera, Inc. | | Software | | SOFR(M) | | 3.75% | | 9.21% | | 10/2028 | | 4,308 | | | 4,202 | | | 4,279 | |
| Confluent Health, LLC | | Healthcare | | SOFR(M) | | 4.00% | | 9.47% | | 11/2028 | | 7,338 | | | 7,309 | | | 7,210 | |
| Confluent Medical Technologies, Inc. | | Healthcare | | SOFR(Q) | | 3.75% | | 9.10% | | 02/2029 | | 6,878 | | | 6,851 | | | 6,877 | |
| Convey Health Solutions, Inc. | | Healthcare | | SOFR(Q) | | 5.25% | | 10.74% | | 09/2026 | | 4,938 | | | 4,830 | | | 4,417 | |
| Cornerstone OnDemand, Inc. | | Software | | SOFR(M) | | 3.75% | | 9.22% | | 10/2028 | | 2,519 | | | 2,510 | | | 2,452 | |
| CVET Midco 2, L.P. | | Software | | SOFR(Q) | | 5.00% | | 10.35% | | 10/2029 | | 6,656 | | | 6,481 | | | 6,659 | |
| Dealer Tire Financial, LLC | | Distribution & Logistics | | SOFR(M) | | 4.50% | | 9.86% | | 12/2027 | | 10,559 | | | 10,538 | | | 10,617 | |
| Discovery Purchaser Corporation | | Specialty Chemicals & Materials | | SOFR(Q) | | 4.38% | | 9.77% | | 10/2029 | | 5,346 | | | 4,972 | | | 5,280 | |
| Dispatch Acquisition Holdings, LLC | | Industrial Services | | SOFR(Q) | | 4.25% | | 9.75% | | 03/2028 | | 9,774 | | | 9,686 | | | 9,206 | |
| EAB Global, Inc. | | Education | | SOFR(M) | | 3.50% | | 8.97% | | 08/2028 | | 4,369 | | | 4,340 | | | 4,367 | |
| Eagle Parent Corp. | | Business Services | | SOFR(Q) | | 4.25% | | 9.60% | | 04/2029 | | 7,481 | | | 7,369 | | | 7,415 | |
| Eisner Advisory Group LLC | | Financial Services | | SOFR(M) | | 5.25% | | 10.72% | | 07/2028 | | 1,689 | | | 1,630 | | | 1,694 | |
| eResearchTechnology, Inc. | | Healthcare | | SOFR(M) | | 4.50% | | 9.96% | | 02/2027 | | 2,190 | | | 2,179 | | | 2,190 | |
| EyeCare Partners, LLC | | Healthcare | | SOFR(Q) | | 3.75% | | 9.39% | | 11/2028 | | 9,825 | | | 9,807 | | | 4,932 | |
| Foundational Education Group, Inc. | | Education | | SOFR(Q) | | 4.25% | | 9.89% | | 08/2028 | | 8,453 | | | 8,344 | | | 8,453 | |
| Geo Parent Corporation | | Business Services | | SOFR(S) | | 5.25% | | 10.80% | | 12/2028 | | 9,634 | | | 9,479 | | | 9,634 | |
| Heartland Dental, LLC | | Healthcare | | SOFR(M) | | 5.00% | | 10.36% | | 04/2028 | | 7,605 | | | 7,332 | | | 7,596 | |
| Help/Systems Holdings, Inc. | | Software | | SOFR(Q) | | 4.00% | | 9.48% | | 11/2026 | | 9,707 | | | 9,687 | | | 9,254 | |
| Houghton Mifflin Harcourt Company | | Education | | SOFR(M) | | 5.25% | | 10.71% | | 04/2029 | | 6,310 | | | 6,116 | | | 6,200 | |
| Hub International Limited | | Insurance Services | | SOFR(Q) | | 4.25% | | 9.66% | | 06/2030 | | 2,754 | | | 2,728 | | | 2,770 | |
| Hunter Holdco 3 Limited | | Healthcare | | SOFR(Q) | | 4.25% | | 9.70% | | 08/2028 | | 3,949 | | | 3,921 | | | 3,947 | |
| Idera, Inc. | | Software | | SOFR(Q) | | 3.75% | | 9.28% | | 03/2028 | | 9,130 | | | 9,079 | | | 9,096 | |
| Kestra Advisor Services Holdings A, Inc. | | Financial Services | | SOFR(Q) | | 4.25% | | 9.70% | | 06/2026 | | 5,374 | | | 5,344 | | | 5,387 | |
| LSCS Holdings, Inc. | | Healthcare | | SOFR(M) | | 4.50% | | 9.97% | | 12/2028 | | 8,582 | | | 8,551 | | | 8,485 | |
| Mandolin Technology Intermediate Holdings, Inc. | | Software | | SOFR(Q) | | 3.75% | | 9.25% | | 07/2028 | | 9,800 | | | 9,765 | | | 8,942 | |
| Marcel Bidco LLC (Marcel Bidco GmbH) | | Software | | SOFR(M) | | 4.50% | | 9.13% | | 11/2030 | | 2,039 | | | 2,009 | | | 2,053 | |
| Maverick Bidco Inc. | | Software | | SOFR(Q) | | 3.75% | | 9.28% | | 05/2028 | | 7,841 | | | 7,814 | | | 7,750 | |
| | | | | | | | | | | | | | | | |
| | | | | | | | | | | | | | | | |
| | | | | | | | | | | | | | | | | | | | | | | | | | | | | | | | | | | | | | | | | | | | | | | | | | |
| Portfolio Company and Type of Investment | | Industry | | Reference | | Spread | | Interest Rate (1) | | Maturity Date | | Principal Amount or Par Value | | Cost | | Fair
Value (2) |
| | | | | | | | | | | | | | | | |
| Maverick Bidco Inc. | | Software | | SOFR(Q) | | 5.00% | | 10.47% | | 05/2028 | | $ | 1,985 | | | $ | 1,904 | | | $ | 1,962 | |
| Mavis Tire Express Services Topco Corp. | | Retail | | SOFR(M) | | 4.00% | | 9.47% | | 05/2028 | | 8,263 | | | 8,235 | | | 8,288 | |
| MH Sub I, LLC (Micro Holding Corp.) | | Business Services | | SOFR(M) | | 4.25% | | 9.61% | | 05/2028 | | 4,783 | | | 4,677 | | | 4,711 | |
| Netsmart, Inc. | | Healthcare | | SOFR(M) | | 3.75% | | 9.22% | | 10/2027 | | 6,825 | | | 6,825 | | | 6,848 | |
| Nielsen Consumer Inc. | | Business Services | | SOFR(M) | | 6.25% | | 11.61% | | 03/2028 | | 9,950 | | | 8,943 | | | 9,759 | |
| OEConnection LLC | | Software | | SOFR(M) | | 4.00% | | 9.46% | | 09/2026 | | 4,039 | | | 4,020 | | | 4,037 | |
| OMNIA Partners, LLC | | Business Services | | SOFR(Q) | | 4.25% | | 9.63% | | 07/2030 | | 4,566 | | | 4,523 | | | 4,598 | |
| Optiv Parent Inc. | | Business Services | | SOFR(Q) | | 5.25% | | 10.63% | | 07/2026 | | 5,080 | | | 4,934 | | | 4,866 | |
| Osaic Holdings, Inc. | | Financial Services | | SOFR(M) | | 4.50% | | 9.86% | | 08/2028 | | 11,518 | | | 11,410 | | | 11,569 | |
| Osmosis Buyer Limited | | Food & Beverage | | SOFR(M) | | 3.75% | | 9.09% | | 07/2028 | | 2,494 | | | 2,457 | | | 2,499 | |
| Osmosis Buyer Limited | | Food & Beverage | | SOFR(M) | | 4.25% | | 9.60% | | 07/2028 | | 1,726 | | | 1,674 | | | 1,735 | |
| Pearls (Netherlands) Bidco B.V. | | Specialty Chemicals & Materials | | SOFR(Q) | | 3.75% | | 9.13% | | 02/2029 | | 1,319 | | | 1,317 | | | 1,310 | |
| Physician Partners, LLC | | Healthcare | | SOFR(Q) | | 4.00% | | 9.53% | | 12/2028 | | 3,197 | | | 3,173 | | | 3,031 | |
| Premise Health Holding Corp. | | Healthcare | | SOFR(Q) | | 3.75% | | 9.25% | | 07/2025 | | 1,926 | | | 1,923 | | | 1,892 | |
| Project Alpha Intermediate Holding, Inc. | | Software | | SOFR(M) | | 4.75% | | 10.11% | | 10/2030 | | 9,880 | | | 9,684 | | | 9,962 | |
| RealPage, Inc. | | Software | | SOFR(M) | | 3.00% | | 8.47% | | 04/2028 | | 1,371 | | | 1,368 | | | 1,366 | |
| Renaissance Holding Corp. | | Education | | SOFR(M) | | 4.75% | | 10.11% | | 04/2030 | | 5,101 | | | 4,959 | | | 5,126 | |
| RxB Holdings, Inc. | | Healthcare | | SOFR(M) | | 4.50% | | 9.97% | | 12/2027 | | 7,363 | | | 7,338 | | | 7,349 | |
| Sierra Enterprises, LLC | | Food & Beverage | | SOFR(Q) | | 2.50% + 4.25%/PIK | | 12.13% | | 05/2027 | | 4,352 | | | 4,345 | | | 4,036 | |
| Snap One Holdings Corp. | | Distribution & Logistics | | SOFR(Q) | | 4.50% | | 10.00% | | 12/2028 | | 8,498 | | | 8,433 | | | 8,328 | |
| Spring Education Group, Inc. | | Education | | SOFR(Q) | | 4.50% | | 9.85% | | 10/2030 | | 9,526 | | | 9,408 | | | 9,558 | |
| STATS Intermediate Holdings, LLC | | Business Services | | SOFR(Q) | | 7.25% | | 12.88% | | 07/2026 | | 2,271 | | | 2,203 | | | 2,271 | |
| Storable, Inc. | | Software | | SOFR(M) | | 3.50% | | 8.86% | | 04/2028 | | 3,920 | | | 3,904 | | | 3,918 | |
| Symplr Software, Inc. | | Healthcare | | SOFR(Q) | | 4.50% | | 9.98% | | 12/2027 | | 3,726 | | | 3,719 | | | 3,347 | |
| Syndigo LLC | | Software | | SOFR(M) | | 4.50% | | 9.97% | | 12/2027 | | 9,660 | | | 9,648 | | | 9,660 | |
| Therapy Brands Holdings LLC | | Software | | SOFR(M) | | 4.00% | | 9.47% | | 05/2028 | | 5,969 | | | 5,947 | | | 5,536 | |
| Thermostat Purchaser III, Inc. | | Business Services | | SOFR(Q) | | 4.50% | | 10.04% | | 08/2028 | | 4,686 | | | 4,668 | | | 4,625 | |
| TRC Companies LLC | | Business Services | | SOFR(M) | | 3.75% | | 9.22% | | 12/2028 | | 9,574 | | | 9,536 | | | 9,590 | |
| USIC Holdings, Inc. | | Business Services | | SOFR(Q) | | 3.50% | | 9.11% | | 05/2028 | | 2,971 | | | 2,963 | | | 2,952 | |
| Valcour Packaging, LLC | | Packaging | | SOFR(M) | | 3.75% | | 9.21% | | 10/2028 | | 3,244 | | | 3,236 | | | 2,584 | |
| VT Topco, Inc. | | Business Services | | SOFR(M) | | 4.25% | | 9.61% | | 08/2030 | | 7,289 | | | 7,218 | | | 7,335 | |
| WatchGuard Technologies, Inc. | | Software | | SOFR(M) | | 5.25% | | 10.60% | | 07/2029 | | 4,040 | | | 3,814 | | | 3,892 | |
| Wrench Group LLC | | Consumer Services | | SOFR(Q) | | 4.00% | | 9.61% | | 04/2026 | | 9,371 | | | 9,337 | | | 9,406 | |
| Zest Acquisition Corp. | | Healthcare | | SOFR(M) | | 5.50% | | 10.86% | | 02/2028 | | 3,142 | | | 3,039 | | | 3,085 | |
| Zone Climate Services, Inc. | | Business Services | | SOFR(Q) | | 5.25% | | 10.80% | | 03/2028 | | 9,850 | | | 9,702 | | | 9,824 | |
| Zone Climate Services, Inc. | | Business Services | | SOFR(Q) | | 5.25% | | 10.80% | | 03/2028 | | 2,165 | | | 2,133 | | | 2,160 | |
| Total Funded Investments | | | | | | | | | | | | $ | 481,984 | | | $ | 476,019 | | | $ | 467,881 | |
| Unfunded Investments - First lien | | | | | | | | | | | | | | | | |
| OMNIA Partners, LLC | | Business Services | | — | | | — | | — | | 01/2024 | | $ | 429 | | | $ | (2) | | | $ | 3 | |
| Osmosis Buyer Limited | | Food & Beverage | | — | | | — | | — | | 07/2028 | | 363 | | | — | | | 2 | |
| Total Unfunded Investments | | | | | | | | | | | | $ | 792 | | | $ | (2) | | | $ | 5 | |
| Total Investments | | | | | | | | | | | | $ | 482,776 | | | $ | 476,017 | | | $ | 467,886 | |
(1)All interest is payable in cash unless otherwise indicated. All of the variable rate debt investments bear interest at a rate that may be determined by reference to the Secured Overnight Financing Rate (SOFR). For each investment, the current interest rate provided reflects the rate in effect as of December 31, 2023.
(2)Represents the fair value in accordance with ASC 820. The Company's board of directors does not determine the fair value of the investments held by SLP IV.
The following table is a listing of the individual investments in SLP IV's consolidated portfolio as of December 31, 2022:
| | | | | | | | | | | | | | | | | | | | | | | | | | | | | | | | | | | | | | | | | | | | | | | | | | |
| Portfolio Company and Type of Investment | | Industry | | Reference | | Spread | | Interest Rate (1) | | Maturity Date | | Principal Amount or Par Value | | Cost | | Fair
Value (2) |
| | | | | | | | | | | | | | | | |
| Funded Investments - First lien | | | | | | | | | | | | | | | | |
| ADG, LLC | | Healthcare | | L (M) | | 4.75% + 0.50%/PIK | | 9.69% | | 09/2023 | | $ | 16,335 | | | $ | 16,315 | | | $ | 15,674 | |
| ADMI Corp. (aka Aspen Dental) | | Healthcare | | L (M) | | 3.75% | | 8.13% | | 12/2027 | | 1,852 | | | 1,844 | | | 1,693 | |
| Advisor Group Holdings, Inc. | | Financial Services | | L (M) | | 4.50% | | 8.88% | | 07/2026 | | 11,577 | | | 11,513 | | | 11,353 | |
| Artera Services, LLC | | Distribution & Logistics | | L (Q) | | 3.50% | | 8.23% | | 03/2025 | | 5,275 | | | 5,251 | | | 4,339 | |
| athenahealth Group Inc. | | Healthcare | | SOFR (M) | | 3.50% | | 7.82% | | 02/2029 | | 2,397 | | | 2,387 | | | 2,171 | |
| Barracuda Parent, LLC | | Software | | SOFR (Q) | | 4.50% | | 8.59% | | 08/2029 | | 5,000 | | | 4,856 | | | 4,822 | |
| Bayou Intermediate II, LLC | | Healthcare | | L (Q) | | 4.50% | | 8.96% | | 08/2028 | | 8,607 | | | 8,571 | | | 8,305 | |
| Bella Holding Company, LLC | | Healthcare | | L (M) | | 3.75% | | 8.13% | | 05/2028 | | 1,751 | | | 1,746 | | | 1,661 | |
| Bleriot US Bidco Inc. | | Federal Services | | L (Q) | | 4.00% | | 8.73% | | 10/2026 | | 3,940 | | | 3,940 | | | 3,907 | |
| Bracket Intermediate Holding Corp. | | Healthcare | | L (Q) | | 4.25% | | 7.99% | | 09/2025 | | 4,427 | | | 4,418 | | | 4,220 | |
| Brave Parent Holdings, Inc. | | Software | | L (M) | | 4.00% | | 8.38% | | 04/2025 | | 2,345 | | | 2,342 | | | 2,278 | |
| Brown Group Holding, LLC | | Distribution & Logistics | | SOFR (Q) | | 3.75% | | 7.91% | | 07/2029 | | 5,424 | | | 5,293 | | | 5,416 | |
| Cano Health, LLC | | Healthcare | | SOFR (M) | | 4.00% | | 8.42% | | 11/2027 | | 7,478 | | | 7,473 | | | 6,011 | |
| CE Intermediate I, LLC | | Software | | L (Q) | | 4.00% | | 8.59% | | 11/2028 | | 8,178 | | | 8,127 | | | 7,779 | |
| CentralSquare Technologies, LLC | | Software | | P (Q) | | 3.75% | | 8.48% | | 08/2025 | | 14,400 | | | 14,385 | | | 12,488 | |
| Certara Holdco, Inc. | | Healthcare | | L (M) | | 3.50% | | 7.88% | | 08/2026 | | 3,900 | | | 3,893 | | | 3,849 | |
| CHA Holdings, Inc. | | Business Services | | L (Q) | | 4.50% | | 9.23% | | 04/2025 | | 1,984 | | | 1,979 | | | 1,960 | |
| CHA Holdings, Inc. | | Business Services | | L (Q) | | 4.50% | | 9.23% | | 04/2025 | | 10,806 | | | 10,788 | | | 10,679 | |
| Confluent Health, LLC | | Healthcare | | L (M) | | 4.00% | | 8.68% | | 11/2028 | | 999 | | | 991 | | | 853 | |
| Confluent Health, LLC | | Healthcare | | L (M) | | 4.00% | | 8.38% | | 11/2028 | | 8,014 | | | 7,979 | | | 6,842 | |
| Confluent Medical Technologies, Inc. | | Healthcare | | SOFR (Q) | | 3.75% | | 8.33% | | 02/2029 | | 6,948 | | | 6,916 | | | 6,617 | |
| Convey Health Solutions, Inc. | | Healthcare | | SOFR (Q) | | 5.25% | | 9.83% | | 09/2026 | | 4,988 | | | 4,846 | | | 4,838 | |
| Cornerstone OnDemand, Inc. | | Software | | L (M) | | 3.75% | | 8.13% | | 10/2028 | | 3,222 | | | 3,209 | | | 2,892 | |
| CVET Midco 2, L.P. | | Software | | SOFR (Q) | | 5.00% | | 9.58% | | 10/2029 | | 2,687 | | | 2,529 | | | 2,522 | |
| Dealer Tire Financial, LLC | | Distribution & Logistics | | SOFR (M) | | 4.50% | | 8.82% | | 12/2027 | | 10,666 | | | 10,640 | | | 10,559 | |
| Discovery Purchaser Corporation | | Specialty Chemicals & Materials | | SOFR (Q) | | 4.38% | | 7.97% | | 10/2029 | | 5,400 | | | 4,976 | | | 4,943 | |
| Dispatch Acquisition Holdings, LLC | | Industrial Services | | L (Q) | | 4.25% | | 8.98% | | 03/2028 | | 9,875 | | | 9,769 | | | 8,393 | |
| Drilling Info Holdings, Inc. | | Business Services | | L (M) | | 4.25% | | 8.63% | | 07/2025 | | 20,288 | | | 20,251 | | | 19,578 | |
| EAB Global, Inc. | | Education | | L (M) | | 3.50% | | 7.88% | | 08/2028 | | 6,422 | | | 6,395 | | | 6,193 | |
| Emerald 2 Limited | | Business Services | | L (Q) | | 3.25% | | 7.98% | | 07/2028 | | 441 | | | 440 | | | 437 | |
| Energize Holdco LLC | | Business Services | | L (M) | | 3.75% | | 8.13% | | 12/2028 | | 9,000 | | | 8,961 | | | 8,550 | |
| eResearchTechnology, Inc. | | Healthcare | | L (M) | | 4.50% | | 8.88% | | 02/2027 | | 4,384 | | | 4,357 | | | 3,895 | |
| EyeCare Partners, LLC | | Healthcare | | L (Q) | | 3.75% | | 8.48% | | 11/2028 | | 9,925 | | | 9,904 | | | 8,445 | |
| Foundational Education Group, Inc. | | Education | | SOFR (Q) | | 3.75% | | 8.59% | | 08/2028 | | 6,435 | | | 6,381 | | | 6,048 | |
| Geo Parent Corporation | | Business Services | | SOFR (Q) | | 5.25% | | 9.44% | | 12/2025 | | 9,709 | | | 9,499 | | | 9,470 | |
| Greenway Health, LLC | | Healthcare | | L (Q) | | 3.75% | | 8.48% | | 02/2024 | | 20,729 | | | 20,710 | | | 14,536 | |
| Heartland Dental, LLC | | Healthcare | | L (M) | | 3.75% | | 8.13% | | 04/2025 | | 3,535 | | | 3,529 | | | 3,280 | |
| Heartland Dental, LLC | | Healthcare | | L (M) | | 4.00% | | 8.39% | | 04/2025 | | 6,206 | | | 6,186 | | | 5,785 | |
| Help/Systems Holdings, Inc. | | Software | | SOFR (Q) | | 4.00% | | 8.19% | | 11/2026 | | 9,808 | | | 9,782 | | | 8,867 | |
| Houghton Mifflin Harcourt Company | | Education | | SOFR (M) | | 5.25% | | 9.67% | | 04/2029 | | 4,037 | | | 3,926 | | | 3,854 | |
| Hunter Holdco 3 Limited | | Healthcare | | L (Q) | | 4.25% | | 8.98% | | 08/2028 | | 3,949 | | | 3,916 | | | 3,886 | |
| Idera, Inc. | | Software | | L (Q) | | 3.75% | | 7.50% | | 03/2028 | | 9,224 | | | 9,162 | | | 8,723 | |
| Kestra Advisor Services Holdings A, Inc. | | Financial Services | | L (Q) | | 4.25% | | 8.98% | | 06/2026 | | 5,430 | | | 5,389 | | | 5,265 | |
| LSCS Holdings, Inc. | | Healthcare | | L (M) | | 4.50% | | 8.88% | | 12/2028 | | 8,669 | | | 8,634 | | | 8,290 | |
| Mamba Purchaser, Inc. | | Healthcare | | L (M) | | 3.50% | | 7.89% | | 10/2028 | | 4,092 | | | 4,075 | | | 3,919 | |
| Mandolin Technology Intermediate Holdings, Inc. | | Software | | L (Q) | | 3.75% | | 8.16% | | 07/2028 | | 9,900 | | | 9,859 | | | 9,281 | |
| Maverick Bidco Inc. | | Software | | SOFR (Q) | | 5.00% | | 9.28% | | 05/2028 | | 2,000 | | | 1,905 | | | 1,901 | |
| Maverick Bidco Inc. | | Software | | L (Q) | | 3.75% | | 8.16% | | 05/2028 | | 7,921 | | | 7,889 | | | 7,527 | |
| | | | | | | | | | | | | | | | | | | | | | | | | | | | | | | | | | | | | | | | | | | | | | | | | | |
| Portfolio Company and Type of Investment | | Industry | | Reference | | Spread | | Interest Rate (1) | | Maturity Date | | Principal Amount or Par Value | | Cost | | Fair
Value (2) |
| | | | | | | | | | | | | | | | |
| Mavis Tire Express Services Topco Corp. | | Retail | | SOFR (M) | | 4.00% | | 8.50% | | 05/2028 | | $ | 8,348 | | | $ | 8,314 | | | $ | 7,985 | |
| Mercury Borrower, Inc. | | Business Services | | L (Q) | | 3.50% | | 8.25% | | 08/2028 | | 6,188 | | | 6,162 | | | 5,917 | |
| MH Sub I, LLC (Micro Holding Corp.) | | Software | | L (M) | | 3.75% | | 8.13% | | 09/2024 | | 7,818 | | | 7,805 | | | 7,606 | |
| National Intergovernmental Purchasing Alliance Company | | Business Services | | SOFR (Q) | | 3.50% | | 8.08% | | 05/2025 | | 1,319 | | | 1,320 | | | 1,308 | |
| Netsmart, Inc. | | Healthcare | | L (M) | | 4.00% | | 8.38% | | 10/2027 | | 6,894 | | | 6,895 | | | 6,658 | |
| OEConnection LLC | | Software | | SOFR (M) | | 4.00% | | 8.42% | | 09/2026 | | 4,081 | | | 4,056 | | | 3,899 | |
| Pearls (Netherlands) Bidco B.V. | | Specialty Chemicals & Materials | | SOFR (Q) | | 3.75% | | 7.84% | | 02/2029 | | 1,333 | | | 1,330 | | | 1,298 | |
| PetVet Care Centers, LLC (fka Pearl Intermediate Parent LLC) | | Consumer Services | | L (M) | | 3.50% | | 7.88% | | 02/2025 | | 7,975 | | | 7,962 | | | 7,537 | |
| Physician Partners, LLC | | Healthcare | | SOFR (M) | | 4.00% | | 8.42% | | 12/2028 | | 4,252 | | | 4,214 | | | 4,068 | |
| Premise Health Holding Corp. | | Healthcare | | L (S) | | 3.75% | | 7.92% | | 07/2025 | | 1,946 | | | 1,942 | | | 1,888 | |
| Project Boost Purchaser, LLC | | Business Services | | L (M) | | 3.50% | | 7.88% | | 05/2026 | | 2,463 | | | 2,458 | | | 2,377 | |
| RealPage, Inc. | | Software | | L (M) | | 3.00% | | 7.38% | | 04/2028 | | 3,628 | | | 3,617 | | | 3,460 | |
| RLG Holdings, LLC | | Packaging | | L (M) | | 4.00% | | 8.38% | | 07/2028 | | 4,719 | | | 4,700 | | | 4,456 | |
| Sierra Enterprises, LLC | | Food & Beverage | | L (Q) | | 4.00% | | 8.41% | | 11/2024 | | 4,172 | | | 4,164 | | | 2,910 | |
| Snap One Holdings Corp. | | Distribution & Logistics | | L (M) | | 4.50% | | 8.88% | | 12/2028 | | 8,584 | | | 8,509 | | | 7,898 | |
| Sovos Brands Intermediate, Inc. | | Food & Beverage | | L (Q) | | 3.50% | | 7.91% | | 06/2028 | | 8,290 | | | 8,273 | | | 8,110 | |
| STATS Intermediate Holdings, LLC | | Business Services | | SOFR (Q) | | 7.25% | | 11.52% | | 07/2026 | | 2,294 | | | 2,204 | | | 2,202 | |
| Storable, Inc. | | Software | | SOFR (M) | | 3.50% | | 7.98% | | 04/2028 | | 3,960 | | | 3,940 | | | 3,788 | |
| Symplr Software, Inc. | | Healthcare | | SOFR (Q) | | 4.50% | | 8.69% | | 12/2027 | | 3,765 | | | 3,756 | | | 3,163 | |
| Syndigo LLC | | Software | | L (M) | | 4.50% | | 8.84% | | 12/2027 | | 9,760 | | | 9,744 | | | 9,497 | |
| Therapy Brands Holdings LLC | | Software | | L (M) | | 4.00% | | 8.35% | | 05/2028 | | 6,030 | | | 6,004 | | | 5,668 | |
| Thermostat Purchaser III, Inc. | | Business Services | | L (Q) | | 4.50% | | 9.23% | | 08/2028 | | 4,288 | | | 4,270 | | | 4,143 | |
| USIC Holdings, Inc. | | Business Services | | L (M) | | 3.50% | | 7.88% | | 05/2028 | | 3,801 | | | 3,788 | | | 3,638 | |
| Valcour Packaging, LLC | | Packaging | | L (S) | | 3.75% | | 7.98% | | 10/2028 | | 3,276 | | | 3,268 | | | 2,744 | |
| Virtusa Corporation | | Information Technology | | SOFR (M) | | 3.75% | | 8.17% | | 02/2029 | | 2,281 | | | 2,260 | | | 2,208 | |
| VT Topco, Inc. | | Business Services | | L (M) | | 3.75% | | 6.16% | | 08/2025 | | 308 | | | 306 | | | 293 | |
| VT Topco, Inc. | | Business Services | | L (M) | | 3.75% | | 8.13% | | 08/2025 | | 8,378 | | | 8,350 | | | 8,154 | |
| WatchGuard Technologies, Inc. | | Software | | SOFR (M) | | 5.25% | | 9.57% | | 07/2029 | | 4,081 | | | 3,824 | | | 3,915 | |
| Wrench Group LLC | | Consumer Services | | L (Q) | | 4.00% | | 8.73% | | 04/2026 | | 9,469 | | | 9,421 | | | 9,155 | |
| YI, LLC | | Healthcare | | L (M) | | 4.00% | | 8.38% | | 11/2024 | | 21,982 | | | 21,975 | | | 21,251 | |
| Zone Climate Services, Inc. | | Business Services | | SOFR (S) | | 4.75% | | 8.62% | | 03/2028 | | 9,950 | | | 9,773 | | | 9,791 | |
| Zone Climate Services, Inc. | | Business Services | | SOFR (S) | | 4.75% | | 8.64% | | 03/2028 | | 2,187 | | | 2,149 | | | 2,152 | |
| Total Funded Investments | | | | | | | | | | | | $ | 508,399 | | | $ | 504,879 | | | $ | 473,931 | |
| Unfunded Investments - First lien | | | | | | | | | | | | | | | | |
| athenahealth Group Inc. | | Healthcare | | — | | — | | — | | 01/2024 | | $ | 294 | | | $ | — | | | $ | (28) | |
| Confluent Health, LLC | | Healthcare | | — | | — | | — | | 11/2023 | | 759 | | | (4) | | | (111) | |
| Thermostat Purchaser III, Inc. | | Business Services | | — | | — | | — | | 08/2023 | | 669 | | | — | | | (23) | |
| VT Topco, Inc. | | Business Services | | — | | — | | — | | 08/2023 | | 251 | | | — | | | (7) | |
| Total Unfunded Investments | | | | | | | | | | | | $ | 1,973 | | | $ | (4) | | | $ | (169) | |
| Total Investments | | | | | | | | | | | | $ | 510,372 | | | $ | 504,875 | | | $ | 473,762 | |
(1)All interest is payable in cash unless otherwise indicated. A majority of the variable rate debt investments bear interest at a rate that may be determined by reference to the LIBOR (L), the Prime Rate (P), Secured Overnight Financing Rate (SOFR) and the alternative base rate (Base). For each investment, the current interest rate provided reflects the rate in effect as of December 31, 2022.
(2)Represents the fair value in accordance with ASC 820. The Company's board of directors does not determine the fair value of the investments held by SLP IV.
Below is certain summarized consolidated financial information for SLP IV as of December 31, 2023 and December 31, 2022 and for the year ended December 31, 2023, December 31, 2022 and for the period from May 5, 2021 through December 31, 2021:
| | | | | | | | | | | |
| Selected Consolidated Balance Sheet Information: | December 31, 2023 | | December 31, 2022 |
Investments at fair value (cost of $476,017 and $504,875, respectively) | $ | 467,886 | | | $ | 473,762 | |
| Cash and other assets | 16,227 | | | 12,853 | |
| Receivable from unsettled securities sold | 1,445 | | | — | |
| Total assets | $ | 485,558 | | | $ | 486,615 | |
| | | |
| Credit facility | $ | 306,537 | | | $ | 365,537 | |
Deferred financing costs (net of accumulated amortization of $1,599 and $997, respectively) | (1,414) | | | (2,008) | |
| Payable for unsettled securities purchased | 31,322 | | | — | |
| Distribution payable | 5,220 | | | 4,648 | |
| Other liabilities | 6,676 | | | 5,410 | |
| Total liabilities | 348,341 | | | 373,587 | |
| | | |
| Members' capital | $ | 137,217 | | | $ | 113,028 | |
| Total liabilities and members' capital | $ | 485,558 | | | $ | 486,615 | |
| | | | | | | | | | | | | | | | | | | |
| Selected Consolidated Statement of Operations Information: | Year Ended | | |
| December 31, 2023 | | December 31, 2022 | | December 31, 2021(1) | | |
| Interest income | $ | 48,082 | | | $ | 31,017 | | | $ | 14,821 | | | |
| Other income | 498 | | | 561 | | | 234 | | | |
| Total investment income | 48,580 | | | 31,578 | | | 15,055 | | | |
| | | | | | | |
| Interest and other financing expenses | 24,860 | | | 13,580 | | | 4,163 | | | |
| Other expenses | 958 | | | 757 | | | 773 | | | |
| Total expenses | 25,818 | | | 14,337 | | | 4,936 | | | |
| | | | | | | |
| | | | | | | |
| Net investment income | 22,762 | | | 17,241 | | | 10,119 | | | |
| | | | | | | |
| Net realized (losses) gains on investments | (1,857) | | | (164) | | | 183 | | | |
| Net change in unrealized appreciation (depreciation) of investments | 22,982 | | | (31,018) | | | 5,033 | | | |
| Net increase (decrease) in members' capital | $ | 43,887 | | | $ | (13,941) | | | $ | 15,335 | | | |
(1)Reflects the results of operations for the period from May 5, 2021 through December 31, 2021.
For the year ended December 31, 2023, December 31, 2022 and for the period from May 5, 2021 through December 31, 2021, the Company earned approximately, $15,483 and $13,173 and $7,767 of dividend income related to SLP IV, respectively, which is included in dividend income. As of December 31, 2023 and December 31, 2022, approximately $4,103 and $3,653, respectively of dividend income related to SLP IV was included in interest and dividend receivable.
The Company has determined that SLP IV is an investment company under ASC 946; in accordance with such guidance the Company will generally not consolidate its investment in a company other than a wholly-owned investment company subsidiary. Furthermore, ASC 810 concludes that in a joint venture where both members have equal decision making authority, it is not appropriate for one member to consolidate the joint venture since neither has control. Accordingly, the Company does not consolidate SLP IV.
Unconsolidated Significant Subsidiaries
In accordance with Regulation S-X Rules 3-09 and 4-08(g), the Company evaluates its unconsolidated controlled portfolio companies to determine if any are "significant subsidiaries." This determination is made based upon an analysis performed, pursuant to which the Company must determine if any of its portfolio companies are considered a "significant subsidiary" as defined by Rule 1-02(w) of Regulation S-X under this rule. As of December 31, 2023, the Company did not have any portfolio companies that were deemed to be a "significant subsidiary."
Investment Risk Factors—First and second lien debt that the Company invests in is almost entirely rated below investment grade or may be unrated. Debt investments rated below investment grade are often referred to as "leveraged loans", "high yield" or "junk" debt investments, and may be considered "high risk" compared to debt investments that are rated investment grade. These debt investments are considered speculative because of the credit risk of the issuers. Such issuers are considered more likely than investment grade issuers to default on their payments of interest and principal, and such risk of default could reduce the net asset value and income distributions of the Company. In addition, some of the Company's debt investments will not fully amortize during their lifetime, which could result in a loss or a substantial amount of unpaid principal and interest due upon maturity. First and second lien debt may also lose significant market value before a default occurs. Furthermore, an active trading market may not exist for these first and second lien debt investments. This illiquidity may make it more difficult to value the debt.
Subordinated debt is generally subject to similar risks as those associated with first and second lien debt, except that such debt is subordinated in payment and/or lower in lien priority. Subordinated debt is subject to the additional risk that the cash flow of the borrower and the property securing the debt, if any, may be insufficient to meet scheduled payments after giving effect to the senior secured and unsecured obligations of the borrower.
The Company may directly invest in the equity of private companies or, in some cases, equity investments could be made in connection with a debt investment. Equity investments may or may not fluctuate in value, resulting in recognized realized gains or losses upon disposition.
Note 4. Fair Value
Pursuant to Rule 2a-5, a market quotation is readily available for purposes of Section 2(a)(41) of the 1940 Act with respect to a security only when that “quotation is a quoted price (unadjusted) in active markets for identical investments that the fund can access at the measurement date, provided that a quotation will not be readily available if it is not reliable.” Fair value is the amount that would be received to sell an asset or paid to transfer a liability in an orderly transaction between market participants at the measurement date. ASC 820 establishes a fair value hierarchy that prioritizes and ranks the inputs to valuation techniques used in measuring investments at fair value. The hierarchy classifies the inputs used in measuring fair value into three levels as follows:
Level I—Quoted prices (unadjusted) are available in active markets for identical investments and the Company has the ability to access such quotes as of the reporting date. The type of investments which would generally be included in Level I include active exchange-traded equity securities and exchange-traded derivatives. As required by ASC 820, the Company, to the extent that it holds such investments, does not adjust the quoted price for these investments, even in situations where the Company holds a large position and a sale could reasonably impact the quoted price.
Level II—Pricing inputs are observable for the investments, either directly or indirectly, as of the reporting date, but are not the same as those used in Level I. Level II inputs include the following:
•Quoted prices for similar assets or liabilities in active markets;
•Quoted prices for identical or similar assets or liabilities in non-active markets (examples include corporate and municipal bonds, which trade infrequently);
•Pricing models whose inputs are observable for substantially the full term of the asset or liability (examples include most over-the-counter derivatives, including foreign exchange forward contracts); and
•Pricing models whose inputs are derived principally from or corroborated by observable market data through correlation or other means for substantially the full term of the asset or liability.
Level III—Pricing inputs are unobservable for the investment and include situations where there is little, if any, market activity for the investment.
The inputs used to measure fair value may fall into different levels. In all instances when the inputs fall within different levels of the hierarchy, the level within which the fair value measurement is categorized is based on the lowest level of
input that is significant to the fair value measurement in its entirety. As such, a Level III fair value measurement may include inputs that are both observable and unobservable. Gains and losses for such assets categorized within the Level III table below may include changes in fair value that are attributable to both observable inputs and unobservable inputs.
The inputs into the determination of fair value require significant judgment or estimation by management and consideration of factors specific to each investment. A review of the fair value hierarchy classifications is conducted on a quarterly basis. Changes in the observability of valuation inputs may result in the transfer of certain investments within the fair value hierarchy from period to period.
The following table summarizes the levels in the fair value hierarchy that the Company’s portfolio investments fall into as of December 31, 2023: | | | | | | | | | | | | | | | | | | | | | | | |
| | Total | | Level I | | Level II | | Level III |
| First lien | $ | 1,683,952 | | | $ | — | | | $ | 46,063 | | | $ | 1,637,889 | |
| Second lien | 424,513 | | | — | | | 18,333 | | | 406,180 | |
| Subordinated | 90,948 | | | — | | | 8,077 | | | 82,871 | |
| Equity and other | 811,909 | | | — | | | — | | | 811,909 | |
| Total investments | $ | 3,011,322 | | | $ | — | | | $ | 72,473 | | | $ | 2,938,849 | |
The following table summarizes the levels in the fair value hierarchy that the Company's portfolio investments fall into as of December 31, 2022: | | | | | | | | | | | | | | | | | | | | | | | |
| | Total | | Level I | | Level II | | Level III |
| First lien | $ | 1,753,967 | | | $ | — | | | $ | — | | | $ | 1,753,967 | |
| Second lien | 561,207 | | | — | | | 81,139 | | | 480,068 | |
| Subordinated | 76,659 | | | — | | | 3,817 | | | 72,842 | |
| Equity and other | 829,414 | | | — | | | — | | | 829,414 | |
| Total investments | $ | 3,221,247 | | | $ | — | | | $ | 84,956 | | | $ | 3,136,291 | |
The following table summarizes the changes in fair value of Level III portfolio investments for the year ended December 31, 2023, as well as the portion of appreciation (depreciation) included in income attributable to unrealized appreciation (depreciation) related to those assets and liabilities still held by the Company at December 31, 2023: | | | | | | | | | | | | | | | | | | | | | | | | | | | | | |
| | Total | | First Lien | | Second Lien | | Subordinated | | Equity and
other |
| Fair value, December 31, 2022 | $ | 3,136,291 | | | $ | 1,753,967 | | | $ | 480,068 | | | $ | 72,842 | | | $ | 829,414 | |
| Total gains or losses included in earnings: | | | | | | | | | |
| Net realized (losses) gains on investments | (33,048) | | | (41,767) | | | (24,627) | | | — | | | 33,346 | |
| Net change in unrealized appreciation (depreciation) of investments | 17,017 | | | 41,311 | | | 24,005 | | | (112) | | | (48,187) | |
| Purchases, including capitalized PIK and revolver fundings(1) | 349,003 | | | 302,949 | | | 4,484 | | | 10,141 | | | 31,429 | |
| Proceeds from sales and paydowns of investments(1) | (582,011) | | | (407,081) | | | (140,837) | | | — | | | (34,093) | |
| Transfers into Level III(2) | 63,087 | | | — | | | 63,087 | | | — | | | — | |
| Transfers out of Level III(2) | (11,490) | | | (11,490) | | | — | | | — | | | — | |
| Fair value, December 31, 2023 | $ | 2,938,849 | | | $ | 1,637,889 | | | $ | 406,180 | | | $ | 82,871 | | | $ | 811,909 | |
| Unrealized (depreciation) appreciation for the period relating to those Level III assets that were still held by the Company at the end of the period: | $ | (34,144) | | | $ | 12,890 | | | $ | 1,625 | | | $ | (4) | | | $ | (48,655) | |
(1)Includes non-cash reorganizations and restructurings.
(2)As of December 31, 2023, portfolio investments were transferred into Level III from Level II and out of Level III into Level II at fair value as of the beginning of the period in which the reclassification occurred.
The following table summarizes the changes in fair value of Level III portfolio investments for the year ended December 31, 2022, as well as the portion of appreciation (depreciation) included in income attributable to unrealized appreciation (depreciation) related to those assets and liabilities still held by the Company at December 31, 2022: | | | | | | | | | | | | | | | | | | | | | | | | | | | | | |
| | Total | | First Lien | | Second Lien | | Subordinated | | Equity and
other |
| Fair value, December 31, 2021 | $ | 2,843,456 | | | $ | 1,635,143 | | | $ | 319,120 | | | $ | 50,742 | | | $ | 838,451 | |
| Total gains or losses included in earnings: | | | | | | | | | |
| Net realized gains on investments | 52,934 | | | 12,351 | | | — | | | — | | | 40,583 | |
| Net change in unrealized (depreciation) appreciation of investments | (70,607) | | | (33,350) | | | (42,375) | | | (4,318) | | | 9,436 | |
| Purchases, including capitalized PIK and revolver fundings | 693,202 | | | 621,319 | | | 9,187 | | | 26,418 | | | 36,278 | |
| Proceeds from sales and paydowns of investments | (604,861) | | | (493,579) | | | (15,948) | | | — | | | (95,334) | |
| Transfers into Level III(1) | 222,167 | | | 12,083 | | | 210,084 | | | — | | | — | |
| | | | | | | | | |
| Fair value, December 31, 2022 | $ | 3,136,291 | | | $ | 1,753,967 | | | $ | 480,068 | | | $ | 72,842 | | | $ | 829,414 | |
| Unrealized (depreciation) appreciation for the period relating to those Level III assets that were still held by the Company at the end of the period: | $ | (30,244) | | | $ | (36,175) | | | $ | (42,817) | | | $ | (4,318) | | | $ | 53,066 | |
(1)As of December 31, 2022, portfolio investments were transferred into Level III from Level II at fair value as of the beginning of the period in which the reclassification occurred.
Except as noted in the tables above, there were no other transfers in or out of Level I, II or III during the years ended December 31, 2023 and December 31, 2022. Transfers into Level III occur as quotations obtained through pricing services are deemed not representative of fair value as of the balance sheet date and such assets are internally valued. As quotations obtained through pricing services are substantiated through additional market sources, investments are transferred out of Level III. In addition, transfers out of Level III and transfers into Level III occur based on the increase or decrease in the availability of certain observable inputs.
The Company invests in revolving credit facilities. These investments are categorized as Level III investments as these assets are not actively traded and their fair values are often implied by the term loans of the respective portfolio companies.
The Company generally uses the following framework when determining the fair value of investments where there are little, if any, market activity or observable pricing inputs. The Company typically determines the fair value of its performing debt investments utilizing an income approach. Additional consideration is given using a market based approach, as well as reviewing the overall underlying portfolio company's performance and associated financial risks. The following outlines additional details on the approaches considered:
Company Performance, Financial Review, and Analysis: Prior to investment, as part of its due diligence process, the Company evaluates the overall performance and financial stability of the portfolio company. Post investment, the Company analyzes each portfolio company's current operating performance and relevant financial trends versus prior year and budgeted results, including, but not limited to, factors affecting its revenue and earnings before interest, taxes, depreciation, and amortization ("EBITDA") growth, margin trends, liquidity position, covenant compliance and changes to its capital structure. The Company also attempts to identify and subsequently track any developments at the portfolio company, within its customer or vendor base or within the industry or the macroeconomic environment, generally, that may alter any material element of its original investment thesis. This analysis is specific to each portfolio company. The Company leverages the knowledge gained from its original due diligence process, augmented by this subsequent monitoring, to continually refine its outlook for each of its portfolio companies and ultimately form the valuation of its investment in each portfolio company. When an external event such as a purchase transaction, public offering or subsequent sale occurs, the Company will consider the pricing indicated by the external event to corroborate the private valuation.
For debt investments, the Company may employ the Market Based Approach (as described below) to assess the total enterprise value of the portfolio company, in order to evaluate the enterprise value coverage of the Company’s debt investment. For equity investments or in cases where the Market Based Approach implies a lack of enterprise value coverage for the debt investment, the Company may additionally employ a discounted cash flow analysis based on the free cash flows of the portfolio company to assess the total enterprise value.
After enterprise value coverage is demonstrated for the Company’s debt investments through the method(s) above, the Income Based Approach (as described below) may be employed to estimate the fair value of the investment.
Market Based Approach: The Company may estimate the total enterprise value of each portfolio company by utilizing EBITDA or revenue multiples of publicly traded comparable companies and comparable transactions. The Company considers numerous factors when selecting the appropriate companies whose trading multiples are used to value its portfolio companies. These factors include, but are not limited to, the type of organization, similarity to the business being valued, and relevant risk factors, as well as size, profitability and growth expectations. The Company may apply an average of various relevant comparable company EBITDA or revenue multiples to the portfolio company's latest twelve month ("LTM") EBITDA or revenue or projected EBITDA or revenue to calculate the enterprise value of the portfolio company. Significant increases or decreases in the EBITDA or revenue multiple will result in an increase or decrease in enterprise value, which may result in an increase or decrease in the fair value estimate of the investment. In applying the market based approach as of December 31, 2023 and December 31, 2022, the Company used the relevant EBITDA or revenue multiple ranges set forth in the table below to determine the enterprise value of its portfolio companies. The Company believes these were reasonable ranges in light of current comparable company trading levels and the specific portfolio companies involved.
Income Based Approach: The Company also may use a discounted cash flow analysis to estimate the fair value of the investment. Projected cash flows represent the relevant security's contractual interest, fee and principal payments plus the assumption of full principal recovery at the investment's expected maturity date. These cash flows are discounted at a rate established utilizing a combination of a yield calibration approach and a comparable investment approach. The yield calibration approach incorporates changes in the credit quality (as measured by relevant statistics) of the portfolio company, as compared to changes in the yield associated with comparable credit quality market indices, between the date of origination and the valuation date. The comparable investment approach utilizes an average yield-to maturity of a selected set of high-quality, liquid investments to determine a comparable investment discount rate. Significant increases or decreases in the discount rate would result in a decrease or increase in the fair value measurement. In applying the income based approach as of December 31, 2023 and December 31, 2022, the Company used the discount ranges set forth in the table below to value investments in its portfolio companies.
The unobservable inputs used in the fair value measurement of the Company's Level III investments as of December 31, 2023 were as follows: | | | | | | | | | | | | | | | | | | | | | | | | | | | | | | | | | | | |
| | | | | | | | Range |
| Type | Fair Value as of December 31, 2023 | | Approach | | Unobservable Input | | Low | | High | | Weighted
Average (1) |
| First lien | $ | 1,559,300 | | | Market & income approach | | EBITDA multiple | | 5.0x | | 24.0x | | 15.1x |
| | | | | Revenue multiple | | 5.0x | | 19.5x | | 10.6x |
| | | | | Discount rate | | 8.6 | % | | 22.0 | % | | 10.2 | % |
| | | | | | | | | | | |
| 78,589 | | | Other | | N/A(2) | | N/A | | N/A | | N/A |
| Second lien | 403,180 | | | Market & income approach | | EBITDA multiple | | 7.0x | | 20.0x | | 14.4x |
| | | | | | | | | | | |
| | | | | Discount rate | | 9.2 | % | | 30.0 | % | | 12.1 | % |
| | | | | | | | | | | |
| 3,000 | | | Other | | N/A(2) | | N/A | | N/A | | N/A |
| Subordinated | 82,871 | | | Market & income approach | | EBITDA multiple | | 8.0x | | 22.0x | | 16.0x |
| | | | | | | | | | | |
| | | | | Discount rate | | 12.9 | % | | 20.9 | % | | 11.9 | % |
| | | | | | | | | | | |
| Equity and other | 430,828 | | | Market & income approach | | EBITDA multiple | | 5.5x | | 34.0x | | 12.6x |
| | | | | Revenue multiple | | 9.0x | | 11.0x | | 10.0x |
| | | | | Discount rate | | 9.8 | % | | 43.1 | % | | 12.2 | % |
| 370,807 | | | Income approach | | Discount rate | | 6.4 | % | | 12.6 | % | | 10.1 | % |
| | | | | | | | | | | |
| | | | | | | | | | | |
| | | | | | | | | | | |
| 10,274 | | | Other | | N/A(2) | | N/A | | N/A | | N/A |
| $ | 2,938,849 | | | | | | | | | | | |
(1)Unobservable inputs were weighted by the relative fair value of the investments.
(2)Fair value was determined based on transaction pricing or recent acquisition or sale as the best measure of fair value with no material changes in operations of the related portfolio company since the transaction date.
The unobservable inputs used in the fair value measurement of the Company's Level III investments as of December 31, 2022 were as follows: | | | | | | | | | | | | | | | | | | | | | | | | | | | | | | | | | | | |
| | | | | | | | Range |
| Type | Fair Value as of December 31, 2022 | | Approach | | Unobservable Input | | Low | | High | | Weighted
Average (1) |
| First lien | $ | 1,663,116 | | | Market & income approach | | EBITDA multiple | | 4.8x | | 38.0x | | 15.3x |
| | | | | Revenue multiple | | 5.0x | | 19.5x | | 9.5x |
| | | | | Discount rate | | 8.3 | % | | 29.4 | % | | 11.1 | % |
| | | | | | | | | | | |
| 90,851 | | | Other | | N/A(2) | | N/A | | N/A | | N/A |
| Second lien | 471,350 | | | Market & income approach | | EBITDA multiple | | 8.2x | | 32.0x | | 15.2x |
| | | | | | | | | | | |
| | | | | Discount rate | | 11.2 | % | | 47.1 | % | | 13.7 | % |
| | | | | | | | | | | |
| 8,718 | | | Other | | N/A(2) | | N/A | | N/A | | N/A |
| Subordinated | 72,842 | | | Market & income approach | | EBITDA multiple | | 8.0x | | 23.5x | | 16.3x |
| | | | | | | | | | | |
| | | | | Discount rate | | 13.5 | % | | 29.7 | % | | 17.0 | % |
| | | | | | | | | | | |
| Equity and other | 793,468 | | Market & income approach | | EBITDA multiple | | 4.8x | | 26.5x | | 13.0x |
| | | | | Revenue multiple | | 10.5x | | 19.5x | | 14.6x |
| | | | | Discount rate | | 6.4 | % | | 44.0 | % | | 13.0 | % |
| | | | | | | | | | | |
| | | | | | | | | | | |
| | | | | | | | | | | |
| | | | | | | | | | | |
| 35,946 | | | Other | | N/A(2) | | N/A | | N/A | | N/A |
| $ | 3,136,291 | | | | | | | | | | | |
(1)Unobservable inputs were weighted by the relative fair value of the investments.
(2)Fair value was determined based on transaction pricing or recent acquisition or sale as the best measure of fair value with no material changes in operations of the related portfolio company since the transaction date.
The carrying value of the collateralized agreement approximates fair value as of December 31, 2023 and is considered a Level III investment. The fair value of other financial assets and liabilities approximates their carrying value based on the short-term nature of these items.
The Holdings Credit Facility, 2019A Unsecured Notes, 2021A Unsecured Notes, 2022A Unsecured Notes, SBA-guaranteed debentures, DB Credit Facility, NMFC Credit Facility and NMNLC Credit Facility II are considered Level III investments. The fair value of the 2022 Convertible Notes and the 8.250% Unsecured Notes are based on quoted prices and are considered Level II investments. See Note 7. Borrowings, for details.
The following are the principal amounts and fair values of the Company’s borrowings as of December 31, 2023 and December 31, 2022. Fair value is estimated by discounting remaining payments using applicable current market rates, which take into account changes in the Company’s marketplace credit ratings or market quotes, if available.
| | | | | | | | | | | | | | | | | | | | | | | | | | | | | |
| | As of | |
| | | December 31, 2023 | | December 31, 2022 | |
| | Principal Amount | | Fair Value | | Principal Amount | | Fair Value | |
| Holdings Credit Facility | | $ | 515,063 | | | $ | 511,511 | | | $ | 618,963 | | | $ | 604,971 | | |
| Unsecured Notes | | 506,500 | | | 490,200 | | | 531,500 | | | 499,551 | | |
| SBA-guaranteed debentures | | 300,000 | | | 259,811 | | | 300,000 | | | 250,442 | | |
| Convertible Notes | | 260,000 | | | 264,706 | | | 316,816 | | | 317,071 | | |
| DB Credit Facility | | 186,400 | | | 184,506 | | | 186,400 | | | 183,734 | | |
| NMFC Credit Facility (1) | | 36,813 | | | 36,507 | | | 40,359 | | | 39,699 | | |
| NMNLC Credit Facility II | | 2,853 | | | 2,846 | | | 3,785 | | | 3,775 | | |
| Total Borrowings | | $ | 1,807,629 | | | $ | 1,750,087 | | | $ | 1,997,823 | | | $ | 1,899,243 | | |
(1) As of December 31, 2023, the principal amount of the NMFC Credit Facility was $36,813, which included £22,850 denominated in GBP and €700 denominated in EUR that has been converted to U.S. dollars. As of December 31, 2023, the fair value of the NMFC Credit Facility was $36,507, which included £22,660 denominated in GBP and €694
denominated in EUR that has been converted to U.S. dollars. As of December 31, 2022, the principal amount of the NMFC Credit Facility was $40,359, which included £22,850 denominated in GBP and €700 denominated in EUR that has been converted to U.S. dollars. As of December 31, 2022, the fair value of the NMFC Credit Facility was $39,699, which included £22,476 denominated in GBP and €689 denominated in EUR that has been converted to U.S. dollars.
Fair value risk factors—The Company seeks investment opportunities that offer the possibility of attaining substantial capital appreciation. Certain events particular to each industry in which the Company's portfolio companies conduct their operations, as well as general economic, political and public health conditions, may have a significant negative impact on the operations and profitability of the Company's investments and/or on the fair value of the Company's investments. The Company's investments are subject to the risk of non-payment of scheduled interest or principal, resulting in a reduction in income to the Company and their corresponding fair valuations. Also, there may be risk associated with the concentration of investments in one geographic region or in certain industries. These events are beyond the control of the Company and cannot be predicted. Furthermore, the ability to liquidate investments and realize value is subject to uncertainties.
Note 5. Agreements
The Company entered into an investment advisory and management agreement (the “Investment Management Agreement”) with the Investment Adviser, which was most recently re-approved by the Company's board of directors on January 30, 2024, at an in-person meeting, for a period of 12 months commencing on March 1, 2024. Under the Investment Management Agreement, the Investment Adviser manages the day-to-day operations of, and provides investment advisory services to, the Company. For providing these services, the Investment Adviser receives a fee from the Company, consisting of two components—a base management fee and an incentive fee. On November 1, 2021, the Company entered into Amendment No. 1 to the Investment Management Agreement (“Amendment No. 1”). As described below, the sole purpose of Amendment No. 1 was to reduce the base management fee from 1.75% of the Company’s gross assets to 1.4% of the Company’s gross assets.
Pursuant to Amendment No. 1, the base management fee is calculated at an annual rate of 1.4% of the Company's gross assets, which equals the Company's total assets on the Consolidated Statements of Assets and Liabilities, less cash and cash equivalents. Prior to Amendment No. 1, pursuant to the Investment Management Agreement, the base management fee was calculated at an annual rate of 1.75% of the Company's gross assets, which equaled the Company's total assets on the Consolidated Statements of Assets and Liabilities, less (i) the borrowings under the New Mountain Finance SPV Funding, L.L.C. Loan and Security Agreement, as amended and restated, dated October 27, 2010 (the "SLF Credit Facility") and (ii) cash and cash equivalents. The base management fee is payable quarterly in arrears, and is calculated based on the average value of the Company's gross assets, which equals the Company's total assets, as determined in accordance with GAAP, less cash and cash equivalents at the end of each of the two most recently completed calendar quarters, and appropriately adjusted on a pro rata basis for any equity capital raises or repurchases during the current calendar quarter. The Company has not invested, and currently is not invested, in derivatives. To the extent the Company invests in derivatives in the future, the Company will use the actual value of the derivatives, as reported on the Consolidated Statements of Assets and Liabilities, for purposes of calculating its base management fee.
Effective as of and for the quarter ended March 31, 2021 through the quarter ending December 31, 2024, the Investment Adviser entered into a fee waiver agreement (the "Fee Waiver Agreement"), amended on August 7, 2023, pursuant to which the Investment Adviser will waive base management fees in order to reach a target base management fee of 1.25% on gross assets (the “Reduced Base Management Fee”). The Fee Waiver Agreement was most recently extended for a period of one year through the quarter ending December 31, 2024 by the Investment Adviser on August 7, 2023. The Investment Adviser cannot recoup management fees that the Investment Adviser has previously waived. For the years ended December 31, 2023, December 31, 2022 and December 31, 2021, management fees waived were approximately $4,117, $4,402 and $13,104, respectively.
The incentive fee consists of two parts. The first part is calculated and payable quarterly in arrears and equals 20.0% of the Company's “Pre-Incentive Fee Net Investment Income” for the immediately preceding quarter, subject to a “preferred return”, or “hurdle”, and a “catch-up” feature. "Pre-Incentive Fee Net Investment Income" means interest income, dividend income and any other income (including any other fees (other than fees for providing managerial assistance), such as commitment, origination, structuring, upfront, diligence and consulting fees or other fees that the Company receives from portfolio companies) accrued during the calendar quarter, minus the Company's operating expenses for the quarter (including the base management fee, expenses payable under an administration agreement, as amended and restated (the “Administration Agreement”), with the Administrator, and any interest expense and distributions paid on any issued and outstanding preferred stock (of which there were none as of December 31, 2023), but excluding the incentive fee). Pre-Incentive Fee Net Investment Income includes, in the case of investments with a deferred interest feature (such as original issue discount, debt instruments with PIK interest and zero coupon securities), accrued income that the Company has not yet received in cash. Pre-Incentive Fee
Net Investment Income does not include any realized capital gains, realized capital losses or unrealized capital appreciation or depreciation.
Pre-Incentive Fee Net Investment Income, expressed as a rate of return on the value of the Company's net assets at the end of the immediately preceding calendar quarter, will be compared to a "hurdle rate" of 2.0% per quarter (8.0% annualized), subject to a "catch-up" provision measured as of the end of each calendar quarter. The hurdle rate is appropriately pro-rated for any partial periods. The calculation of the Company's incentive fee with respect to the Pre-Incentive Fee Net Investment Income for each quarter is as follows:
•No incentive fee is payable to the Investment Adviser in any calendar quarter in which the Company's Pre-Incentive Fee Net Investment Income does not exceed the hurdle rate of 2.0% (the "preferred return" or "hurdle").
•100.0% of the Company's Pre-Incentive Fee Net Investment Income with respect to that portion of such Pre-Incentive Fee Net Investment Income, if any, that exceeds the hurdle rate but is less than or equal to 2.5% in any calendar quarter (10.0% annualized) is payable to the Investment Adviser. This portion of the Company's Pre-Incentive Fee Net Investment Income (which exceeds the hurdle rate but is less than or equal to 2.5%) is referred to as the "catch-up". The catch-up provision is intended to provide the Investment Adviser with an incentive fee of 20.0% on all of the Company's Pre-Incentive Fee Net Investment Income as if a hurdle rate did not apply when the Company's Pre-Incentive Fee Net Investment Income exceeds 2.5% in any calendar quarter.
•20.0% of the amount of the Company's Pre-Incentive Fee Net Investment Income, if any, that exceeds 2.5% in any calendar quarter (10.0% annualized) is payable to the Investment Adviser once the hurdle is reached and the catch-up is achieved.
For the years ended December 31, 2023, December 31, 2022 and December 31, 2021 no incentive fees were waived by the Investment Adviser.
The second part of the incentive fee will be determined and payable in arrears as of the end of each calendar year (or upon termination of the Investment Management Agreement) and will equal 20.0% of the Company's realized capital gains, if any, on a cumulative basis from inception through the end of each calendar year, computed net of all realized capital losses and unrealized capital depreciation on a cumulative basis, less the aggregate amount of any previously paid capital gain incentive fee.
In accordance with GAAP, the Company accrues a hypothetical capital gains incentive fee based upon the cumulative net realized capital gains and realized capital losses and the cumulative net unrealized capital appreciation and unrealized capital depreciation on investments held at the end of each period. Actual amounts paid to the Investment Adviser are consistent with the Investment Management Agreement and are based only on actual realized capital gains computed net of all realized capital losses and unrealized capital depreciation on a cumulative basis from inception through the end of each calendar year.
The following table summarizes the management fees and incentive fees incurred by the Company for the years ended December 31, 2023, December 31, 2022 and December 31, 2021. | | | | | | | | | | | | | | | | | |
| | Year Ended December 31, |
| | 2023 | | 2022 | | 2021 |
| Management fee | $ | 45,610 | | | $ | 46,617 | | | $ | 52,960 | |
| Less: management fee waiver | (4,117) | | | (4,402) | | | (13,104) | |
| Total management fee | 41,493 | | | 42,215 | | | 39,856 | |
| Incentive fee, excluding accrued capital gains incentive fees | $ | 38,303 | | | $ | 29,901 | | | $ | 29,710 | |
| | | | | |
| | | | | |
| Accrued capital gains incentive fees(1) | $ | — | | | $ | — | | | $ | — | |
(1)As of December 31, 2023, December 31, 2022 and December 31, 2021, no actual capital gains incentive fee was owed under the Investment Management Agreement by the Company, as cumulative net realized capital gains did not exceed cumulative unrealized capital depreciation.
The Company has entered into the Administration Agreement with the Administrator under which the Administrator provides administrative services. The Administration Agreement was most recently re-approved by the board of directors on January 30, 2024 for a period of 12 months commencing on March 1, 2024. The Administrator maintains, or oversees the maintenance of, the Company’s consolidated financial records, prepares reports filed with the SEC, generally monitors the payment of the Company's expenses and oversees the performance of administrative and professional services rendered by others. The Company reimburses the Administrator for the Company's allocable portion of overhead and other expenses incurred by the Administrator in performing its obligations to the Company under the Administration Agreement. Pursuant to
the Administration Agreement and further restricted by the Company, the Administrator may, in its own discretion, submit to the Company for reimbursement some or all of the expenses that the Administrator has incurred on behalf of the Company during any quarterly period. As a result, the amount of expenses for which the Company will have to reimburse the Administrator may fluctuate in future quarterly periods and there can be no assurance given as to when, or if, the Administrator may determine to limit the expenses that the Administrator submits to the Company for reimbursement in the future. However, it is expected that the Administrator will continue to support part of the expense burden of the Company in the near future and may decide to not calculate and charge through certain overhead related amounts as well as continue to cover some of the indirect costs. The Administrator cannot recoup any expenses that the Administrator has previously waived. For the years ended December 31, 2023, December 31, 2022 and December 31, 2021, approximately $2,341, $2,459 and $2,827, respectively, of indirect administrative expenses were included in administrative expenses of which $0, $238 and $244, respectively, were waived by the Administrator. As of December 31, 2023 and December 31, 2022, $682 and $605, respectively, of indirect administrative expenses were included in payable to affiliates. For the years ended December 31, 2023, December 31, 2022 and December 31, 2021, the reimbursement to the Administrator represented approximately 0.07%, 0.07% and 0.08%, respectively, of the Company's gross assets.
The Company, the Investment Adviser and the Administrator have also entered into a Trademark License Agreement, as amended, with New Mountain Capital, pursuant to which New Mountain Capital has agreed to grant the Company, the Investment Adviser and the Administrator a non-exclusive, royalty-free license to use the "New Mountain" and the "New Mountain Finance" names, as well as the NMF logo. Under the Trademark License Agreement, as amended, subject to certain conditions, the Company, the Investment Adviser and the Administrator will have a right to use the "New Mountain" and "New Mountain Finance" names, as well as the NMF logo, for so long as the Investment Adviser or one of its affiliates remains the investment adviser of the Company. Other than with respect to this limited license, the Company, the Investment Adviser and the Administrator will have no legal right to the "New Mountain" or the "New Mountain Finance" names, as well as the NMF logo.
In addition, pursuant to an exemptive order issued by the SEC on April 8, 2020 and applicable to all BDCs through December 31, 2020 (the “Temporary Relief), the Company was permitted, subject to the satisfaction of certain conditions, to complete follow-on investments in its existing portfolio companies with certain affiliates that are private funds if such private funds did not hold an investment in such existing portfolio company. Without the Temporary Relief, such private funds would not be able to participate in such co-investments with the Company unless the private funds had previously acquired securities of the portfolio company in a co-investment transaction with the Company. Although the Temporary Relief expired on December 31, 2020, the SEC’s Division of Investment Management had indicated that until March 31, 2022, it would not recommend enforcement action, to the extent that any BDC with an existing co-investment order continued to engage in certain transactions described in the Temporary Relief, pursuant to the same terms and conditions described therein. The Temporary Relief is no longer effective; however, on August 30, 2022, the Company received an Order from the SEC that amended its existing Exemptive Order to permit the Company to complete follow-on investments in its existing portfolio companies with certain affiliates that are private funds if such private funds do not hold an investment in such existing portfolio company, subject to certain conditions.
Note 6. Related Parties
The Company has entered into a number of business relationships with affiliated or related parties.
The Company has entered into the Investment Management Agreement with the Investment Adviser, a wholly-owned subsidiary of New Mountain Capital. Therefore, New Mountain Capital is entitled to any profits earned by the Investment Adviser, which includes any fees payable to the Investment Adviser under the terms of the Investment Management Agreement, less expenses incurred by the Investment Adviser in performing its services under the Investment Management Agreement.
The Company has entered into the Fee Waiver Agreement with the Investment Adviser, pursuant to which the Investment Adviser agreed to voluntarily reduce the base management fees payable to the Investment Adviser by the Company under the Investment Management Agreement beginning with the quarter ended March 31, 2021 through the quarter ended December 31, 2022. Subsequently, the Company and the Investment Adviser extended the term of the Fee Waiver Agreement to be effective through the quarter ending December 31, 2024. See Note 5. Agreements, for details.
The Company has entered into the Administration Agreement with the Administrator, a wholly-owned subsidiary of New Mountain Capital. The Administrator arranges office space for the Company and provides office equipment and administrative services necessary to conduct their respective day-to-day operations pursuant to the Administration Agreement. The Company reimburses the Administrator for the allocable portion of overhead and other expenses incurred by it in performing its obligations to the Company under the Administration Agreement, which includes the fees and expenses
associated with performing administrative, finance and compliance functions, and the compensation of the Company's chief financial officer and chief compliance officer and their respective staffs.
The Company, the Investment Adviser and the Administrator have entered into a royalty-free Trademark License Agreement, as amended, with New Mountain Capital, pursuant to which New Mountain Capital has agreed to grant the Company, the Investment Adviser and the Administrator a non-exclusive, royalty-free license to use the name "New Mountain" and "New Mountain Finance", as well as the NMF logo.
The Company has adopted a formal code of ethics that governs the conduct of its officers and directors. These officers and directors also remain subject to the duties imposed by the 1940 Act and the Delaware General Corporation Law.
The Investment Adviser and its affiliates may also manage other funds in the future that may have investment mandates that are similar, in whole or in part, to the Company’s investment mandates. The Investment Adviser and its affiliates may determine that an investment is appropriate for the Company or for one or more of those other funds. In such event, depending on the availability of such investment and other appropriate factors, the Investment Adviser or its affiliates may determine that the Company should invest side-by-side with one or more other funds. Any such investments will be made only to the extent permitted by applicable law and interpretive positions of the SEC and its staff and consistent with the Investment Adviser’s allocation procedures. On October 8, 2019, the SEC issued an exemptive order (the “Exemptive Order”), which superseded a prior order issued on December 18, 2017, which permits the Company to co-invest in portfolio companies with certain funds or entities managed by the Investment Adviser or its affiliates in certain negotiated transactions where co-investing would otherwise be prohibited under the 1940 Act, subject to the conditions of the Exemptive Order. Pursuant to the Exemptive Order, the Company is permitted to co-invest with its affiliates if a “required majority” (as defined in Section 57(o) of the 1940 Act) of the Company's independent directors make certain conclusions in connection with a co-investment transaction, including, but not limited to, that (1) the terms of the potential co-investment transaction, including the consideration to be paid, are reasonable and fair to the Company and its stockholders and do not involve overreaching in respect of the Company or its stockholders on the part of any person concerned, and (2) the potential co-investment transaction is consistent with the interests of the Company's stockholders and is consistent with its then-current investment objective and strategies. The Exemptive Order was amended on August 30, 2022 to permit the Company to complete follow-on investments in its existing portfolio companies with certain affiliates that are private funds if such private funds do not hold an investment in such existing portfolio company, subject to certain conditions.
On March 30, 2020, an affiliate of the Investment Adviser purchased directly from NMNLC 105,030 shares of NMNLC’s common stock at a price of $107.73 per share, which represented the net asset value per share of NMNLC at the date of purchase, for an aggregate purchase price of approximately $11,315. Immediately thereafter, NMNLC redeemed 105,030 shares of its common stock held by the Company in exchange for a promissory note with a principal amount of $11,315 and a 7.0% interest rate, which was repaid by NMNLC to the Company on March 31, 2020.
On March 30, 2020, the Company entered into an unsecured revolving credit facility with NMF Investments III, L.L.C., an affiliate of the Investment Adviser, with a $30,000 maximum amount of revolver borrowings available and a maturity date of December 31, 2022. On May 4, 2020, the Company entered into an Amended and Restated Uncommitted Revolving Loan Agreement with NMF Investments III, L.L.C., which increased the maximum amounts of revolving borrowings available thereunder from $30,000 to $50,000. On December 17, 2021, the Company entered into Amendment No. 1 to the Amended and Restated Uncommitted Revolving Loan Agreement with NMF Investments III, L.L.C., which lowered the interest rate and extended the maturity date from December 31, 2022 to December 31, 2024. On October 31, 2023, we entered into a Second Amended and Restated Uncommitted Revolving Loan Agreement with NMF Investments III, L.L.C., which increased the maximum amounts of revolving borrowings thereunder from $50,000 to $100,000, extended the maturity date from December 31, 2024 to December 31, 2027 and changed the interest rate to the Applicable Federal Rate. Refer to Note 7. Borrowings for discussion of the Unsecured Management Company Revolver (defined below).
Note 7. Borrowings
On June 8, 2018 the Company's shareholders approved the application of the modified asset coverage requirements set forth in Section 61(a) of the 1940 Act, which resulted in the reduction of the minimum asset coverage ratio applicable to the Company from 200.0% to 150.0% as of June 9, 2018 (which means the Company can borrow $2 for every $1 of its equity). As a result of the Company's exemptive relief received on November 5, 2014, the Company is permitted to exclude its SBA-guaranteed debentures from the 150.0% asset coverage ratio that the Company is required to maintain under the 1940 Act. The agreements governing the NMFC Credit Facility, the Convertible Notes (as defined below) and the Unsecured Notes (as defined below) contain certain covenants and terms, including a requirement that the Company not exceed a debt-to-equity ratio of 1.65 to 1.00 at the time of incurring additional indebtedness and a requirement that the Company not exceed a secured debt ratio of 0.70 to 1.00 at any time. As of December 31, 2023, the Company’s asset coverage ratio was 187.54%.
Holdings Credit Facility—On October 24, 2017, the Company entered into the Third Amended and Restated Loan and Security Agreement (as amended from time to time, the "Loan and Security Agreement") among the Company, as the Collateral Manager, NMF Holdings, as the Borrower, Wells Fargo Securities, LLC, as the Administrative Agent and Wells Fargo Bank, National Association, as the Lender and Collateral Custodian (the "Holdings Credit Facility"). As of the most recent amendment on October 26, 2023, the maturity date of the Holdings Credit Facility is October 26, 2028 and the maximum facility amount is the lesser of $800,000 and the actual commitments of the lenders to make advances as of such date.
As of December 31, 2023, the maximum amount of revolving borrowings available under the Holdings Credit Facility is $730,000. Under the Holdings Credit Facility, NMF Holdings is permitted to borrow up to 35.0%, 45.0%, 55.0%, 67.5% or 70.0% of the purchase price of pledged assets, subject to approval by Wells Fargo Bank, National Association. The Holdings Credit Facility is non-recourse to the Company and is collateralized by all of the investments of NMF Holdings on an investment by investment basis. All fees associated with the origination, amending or upsizing of the Holdings Credit Facility are capitalized on the Company's Consolidated Statement of Assets and Liabilities and charged against income as other financing expenses over the life of the Holdings Credit Facility. The Holdings Credit Facility contains certain customary affirmative and negative covenants and events of default. In addition, the Holdings Credit Facility requires the Company to maintain a minimum asset coverage ratio of 150.0%. The covenants are generally not tied to mark to market fluctuations in the prices of NMF Holdings investments, but rather to the performance of the underlying portfolio companies.
As of the amendment on October 26, 2023, the Holdings Credit Facility bears interest at a rate of SOFR plus 2.50% per annum for Broadly Syndicated Loans (as defined in the Eighth Amendment to the Loan and Security Agreement). From April 28, 2023 to October 25, 2023, the Holdings Credit Facility bore interest at a rate of SOFR plus 1.70% for Broadly Syndicated Loans (as defined in the Seventh Amendment to the Loan and Security Agreement) and SOFR plus 2.20% per annum for all other investments. From April 20, 2021 to April 27, 2023, the Holdings Credit Facility bore interest at a rate of LIBOR plus 1.60% per annum for Broadly Syndicated Loans (as defined in the Fifth Amendment to the Loan and Security Agreement) and LIBOR plus 2.10% per annum for all other investments. From September 30, 2020 to April 19, 2021, the Holdings Credit Facility bore interest at a rate of LIBOR plus 2.00% per annum for Broadly Syndicated Loans (as defined in the Fourth Amendment Loan and Security Agreement) and LIBOR plus 2.50% per annum for all other investments. The Holdings Credit Facility also charges a non-usage fee, based on the unused facility amount multiplied by the Non-Usage Fee Rate (as defined in the Ninth Amendment to the Loan and Security Agreement).
The following table summarizes the interest expense, non-usage fees and amortization of financing costs incurred on the Holdings Credit Facility for the years ended December 31, 2023, December 31, 2022 and December 31, 2021. | | | | | | | | | | | | | | | | | |
| | Year Ended December 31, |
| | 2023 | | 2022 | | 2021 |
| Interest expense | $ | 41,176 | | | $ | 22,542 | | | $ | 10,210 | |
| Non-usage fee | $ | 760 | | | $ | 743 | | | $ | 1,282 | |
| Amortization of financing costs | $ | 1,912 | | | $ | 2,956 | | | $ | 2,852 | |
| Weighted average interest rate | 7.0 | % | | 3.9 | % | | 2.1 | % |
| Effective interest rate | 7.6 | % | | 4.5 | % | | 3.0 | % |
| Average debt outstanding | $ | 577,759 | | | $ | 581,367 | | | $ | 478,016 | |
As of December 31, 2023, December 31, 2022 and December 31, 2021, the outstanding balance on the Holdings Credit Facility was $515,063, $618,963 and $545,263, respectively, and NMF Holdings was in compliance with the applicable covenants of the Holdings Credit Facility on such dates.
NMFC Credit Facility—The Amended and Restated Senior Secured Revolving Credit Agreement, (as amended from time to time, and together with the related guarantee and security agreement, the "RCA"), dated June 4, 2021, among the Company, as the Borrower, Goldman Sachs Bank USA, as the Administrative Agent and Collateral Agent, and Goldman Sachs Bank USA, Morgan Stanley Bank, N.A., Stifel Bank & Trust and MUFG Union Bank, N.A., as Lenders (the "NMFC Credit Facility"), is structured as a senior secured revolving credit facility. The NMFC Credit Facility is guaranteed by certain of the Company's domestic subsidiaries and proceeds from the NMFC Credit Facility may be used for general corporate purposes, including the funding of portfolio investments. As of the amendment on June 4, 2021, the maturity date of the NMFC Credit Facility is June 4, 2026.
As of December 31, 2023, the maximum amount of revolving borrowings available under the NMFC Credit Facility was $198,500. The Company is permitted to borrow at various advance rates depending on the type of portfolio investment, as outlined in the RCA. All fees associated with the origination and amending of the NMFC Credit Facility are capitalized on the Company's Consolidated Statement of Assets and Liabilities and charged against income as other financing expenses over the
life of the NMFC Credit Facility. The NMFC Credit Facility contains certain customary affirmative and negative covenants and events of default, including certain financial covenants related to asset coverage and liquidity and other maintenance covenants.
As of the amendment on June 29, 2023, the NMFC Credit Facility generally bears interest at a rate of SOFR plus any applicable credit spread adjustment, SONIA or EURIBOR plus 2.10% per annum or the prime rate plus 1.10% per annum, and charges a commitment fee, based on the unused facility amount multiplied by 0.375% per annum (as defined in the RCA). From June 4, 2021 to June 28, 2023, the NMFC Credit Facility generally bore interest at a rate of LIBOR, SONIA or EURIBOR plus 2.10% per annum or the prime rate plus 1.10% per annum, and charged a commitment fee, based on the unused facility amount multiplied by 0.375% per annum (as defined in the RCA). Prior to June 4, 2021, the NMFC Credit Facility bore interest at a rate of LIBOR plus 2.50% per annum or the prime rate plus 1.50% per annum, and charged a commitment fee based on the unused facility amount multiplied by 0.375% per annum (as defined in the RCA).
The following table summarizes the interest expense, non-usage fees and amortization of financing costs incurred on the NMFC Credit Facility for the years ended December 31, 2023, December 31, 2022 and December 31, 2021. | | | | | | | | | | | | | | | | | |
| | Year Ended December 31, |
| | 2023 | | 2022 | | 2021 |
| Interest expense | $ | 7,380 | | | $ | 4,608 | | | $ | 3,171 | |
| Non-usage fee | $ | 363 | | | $ | 247 | | | $ | 213 | |
| Amortization of financing costs | $ | 216 | | | $ | 229 | | | $ | 199 | |
| Weighted average interest rate | 7.1 | % | | 3.5 | % | | 2.4 | % |
| Effective interest rate | 7.7 | % | | 3.8 | % | | 2.7 | % |
| Average debt outstanding | $ | 103,244 | | | $ | 133,053 | | | $ | 132,685 | |
As of December 31, 2023, the outstanding balance on the NMFC Credit Facility was $36,813, which included £22,850 denominated in British Pound Sterling ("GBP") and €700 denominated in Euro ("EUR") that has been converted to U.S. dollars. As of December 31, 2022, the outstanding balance on the NMFC Credit Facility was $40,359, which included £22,850 denominated in GBP and €700 denominated in EUR that has been converted to U.S. dollars. As of December 31, 2021, the outstanding balance on the NMFC Credit Facility was $127,192, which included £16,400 denominated in GBP that has been converted to U.S. dollars. NMFC was in compliance with the applicable covenants of the NMFC Credit Facility on such dates.
Unsecured Management Company Revolver—The Uncommitted Revolving Loan Agreement (the "Uncommitted Revolving Loan Agreement"), dated March 30, 2020, by and between the Company, as the Borrower, and NMF Investments III, L.L.C., as Lender, an affiliate of the Investment Adviser (the "Unsecured Management Company Revolver"), is structured as a discretionary unsecured revolving credit facility. The proceeds from the Unsecured Management Company Revolver may be used for general corporate purposes, including the funding of portfolio investments. As of the amendment on October 31, 2023, the maturity date of the Unsecured Management Company Revolver is December 31, 2027.
As of the amendment on October 31, 2023, the Unsecured Management Company Revolver bears an interest at the Applicable Federal Rate. As of December 17, 2021 through the amendment on October 31, 2023, the Unsecured Management Company Revolver bore interest at a rate of 4.00% per annum. Prior to December 17, 2021, the Unsecured Management Company Revolver bore interest at a rate of 7.00% per annum (as defined in the Uncommitted Revolving Loan Agreement). On October 31, 2023, we entered into a Second Amended and Restated Uncommitted Revolving Loan Agreement with NMF Investments III, L.L.C., which increased the maximum amount of revolving borrowings available thereunder from $50,000 to $100,000. As of December 31, 2023, the maximum amount of revolving borrowings available under the Unsecured Management Company Revolver was $100,000 and no borrowings were outstanding. For the years ended December 31, 2023, December 31, 2022 and December 31, 2021, amortization of financing costs were $2, $14 and $11, respectively.
DB Credit Facility—The Loan Financing and Servicing Agreement (the "LFSA") dated December 14, 2018 and as amended from time to time, among NMFDB as the borrower, Deutsche Bank AG, New York Branch ("Deutsche Bank") as the facility agent, Lender and other agent from time to time party thereto and U.S. Bank National Association, as collateral agent and collateral custodian (the "DB Credit Facility"), is structured as a secured revolving credit facility. As of the amendment on October 31, 2023, the maturity date of the DB Credit Facility is March 25, 2027.
As of December 31, 2023, the maximum amount of revolving borrowings available under the DB Credit Facility was $280,000. The Company is permitted to borrow at various advance rates depending on the type of portfolio investment, as outlined in the LFSA. The DB Credit Facility is non-recourse to the Company and is collateralized by all of the investments of NMFDB on an investment by investment basis. All fees associated with the origination and amending of the DB Credit Facility are capitalized on the Company's Consolidated Statement of Assets and Liabilities and charged against income as other financing expenses over the life of the DB Credit Facility. The DB Credit Facility contains certain customary affirmative and
negative covenants and events of default. The covenants are generally not tied to mark to market fluctuations in the prices of NMFDB investments, but rather to the performance of the underlying portfolio companies.
The advances under the DB Credit Facility accrue interest at a per annum rate equal to the Applicable Margin plus the lender's Cost of Funds Rate. Prior to March 25, 2021, the Applicable Margin was equal to 2.60% during the Revolving Period, increased by 0.20% per annum after the Revolving Period and then increased by 2.00% during an Event of Default (as defined in the LFSA). From March 25, 2021 to June 29, 2023, the Applicable Margin was equal to 2.35% during the Revolving Period, increased by 0.20% per annum after the Revolving Period and then increased by 2.00% during an Event of Default. From June 29, 2023 to October 31, 2023, the Applicable Margin was equal to 2.61% during the Revolving Period, increased by 0.20% per annum after the Revolving period and then increased by 2.00% per annum during an Event of Default. As of the amendment on October 31, 2023, the Applicable Margin is equal to 2.55% during the Revolving Period, increases by 0.20% per annum after the Revolving period and shall be increased by 2.00% per annum during an Even of Default. The "Cost of Funds Rate" for a conduit lender is the lower of its commercial paper rate and the Base Rate plus 0.50%, and for any other lender is the Base Rate. Effective June 29, 2023, the Base Rate is the three-months SOFR Rate. Prior to the amendment on June 29, 2023, the Base Rate was the three-months LIBOR rate. The Company is also charged a non-usage fee, based on the unused facility amount multiplied by the Undrawn Fee Rate (as defined in the LFSA) and a facility agent fee of 0.25% per annum, until the amendment on October 31, 2023, on the total facility amount. As of the amendment on October 31, 2023, the facility agent fee is 0.20% per annum on the total facility amounts.
The following table summarizes the interest expense, non-usage fees and amortization of financing costs incurred on the DB Credit Facility for the years ended December 31, 2023, December 31, 2022 and December 31, 2021. | | | | | | | | | | | | | | | | | |
| | Year Ended December 31, |
| | 2023 | | 2022 | | 2021 |
| Interest expense(1) | $ | 14,964 | | | $ | 9,816 | | | $ | 5,985 | |
| Non-usage fee(1) | $ | 466 | | | $ | 355 | | | $ | 362 | |
| Amortization of financing costs | $ | 1,113 | | | $ | 1,082 | | | $ | 981 | |
| Weighted average interest rate | 7.9 | % | | 4.7 | % | | 2.9 | % |
| Effective interest rate | 8.9 | % | | 5.4 | % | | 3.5 | % |
| Average debt outstanding | $ | 186,422 | | | $ | 209,898 | | | $ | 209,307 | |
(1)Interest expense includes the portion of the facility agent fee applicable to the drawn portion of the DB Credit Facility and non-usage fee includes the portion of the facility agent fee applicable to the undrawn portion of the DB Credit Facility.
As of December 31, 2023, December 31, 2022 and December 31, 2021 the outstanding balance on the DB Credit Facility was $186,400, $186,400 and $244,000, respectively, and NMFDB was in compliance with the applicable covenants of the DB Credit Facility on such dates.
NMNLC Credit Facility II—The Credit Agreement (together with the related guarantee and security agreement, the "NMNLC CA"), dated February 26, 2021, by and between NMNLC, as the Borrower, and City National Bank, as the Lender (the "NMNLC Credit Facility II"), is structured as a senior secured revolving credit facility. As of the amendment on November 1, 2022, NM CLFX LP has been added as a co-borrower and the NMNLC CA will mature on November 1, 2024. The NMNLC Credit Facility II is guaranteed by the Company and proceeds from the NMNLC Credit Facility II are able to be used for refinancing existing loans on properties held.
From December 7, 2021 through November 1, 2022, the NMNLC Credit Facility II bore interest at a rate of the SOFR plus 2.75% per annum with a 0.35% floor, and charged a commitment fee, based on the unused facility amount multiplied by 0.05% per annum (as defined in the NMNLC CA). As of the amendment on November 1, 2022, the NMNLC Credit Facility II bears interest at a rate of SOFR plus 2.25%.
Prior to the amendment on March 16, 2022, the maximum amount of revolving borrowings available under the NMNLC Credit Facility II was $20,000. As of the March 16, 2022 amendment and effective May 1, 2022 through November 1, 2022, the maximum amount of revolving borrowings available under the NMNLC Credit Facility II was $10,000. As of the amendment on November 1, 2022, the maximum amount of revolving borrowings available to all borrowers under the NMNLC Credit Facility II is $27,500, of which $25,408 is outstanding as of December 31, 2023.
The following table summarizes the interest expense, non-usage fees and amortization of financing costs incurred on the NMNLC Credit Facility II for the years ended December 31, 2023, December 31, 2022 and December 31, 2021.
| | | | | | | | | | | | | | | | | |
| | Year Ended December 31, |
| | 2023 | | 2022 | | 2021 |
| Interest expense | $ | 186 | | | $ | 252 | | | $ | 93 | |
| Non-usage fee | $ | 1 | | | $ | 3 | | | $ | 3 | |
| Amortization of financing costs | $ | 87 | | | $ | 58 | | | $ | 83 | |
| Weighted average interest rate | 7.2 | % | | 3.5 | % | | 2.7 | % |
| Effective interest rate | 11.0 | % | | 4.4 | % | | 5.1 | % |
| Average debt outstanding | $ | 2,506 | | | $ | 7,195 | | | $ | 3,501 | |
As of December 31, 2023, December 31, 2022 and December 31, 2021, the outstanding balance on the NMNLC Credit Facility II was $2,853, $3,785 and $15,200, respectively, and NMNLC was in compliance with the applicable covenants of the NMNLC Credit Facility II on such dates.
Convertible Notes
2018 Convertible Notes—On August 20, 2018, the Company closed a registered public offering of $100,000 aggregate principal amount of unsecured convertible notes (the “2018 Convertible Notes”), pursuant to an indenture, dated August 20, 2018, as supplemented by a first supplemental indenture thereto, dated August 20, 2018 (together the “2018A Indenture”). On August 30, 2018, in connection with the registered public offering, the Company issued an additional $15,000 aggregate principal amount of the 2018 Convertible Notes pursuant to the exercise of an overallotment option by the underwriter of the 2018 Convertible Notes. On June 7, 2019, the Company closed a registered public offering of an additional $86,250 aggregate principal amount of the 2018 Convertible Notes. These additional 2018 Convertible Notes constituted a further issuance of, ranked equally in right of payment with, and formed a single series with the $115,000 aggregate principal amount of 2018 Convertible Notes that the Company issued in August 2018.
The 2018 Convertible Notes bore interest at an annual rate of 5.75%, payable semi-annually in arrears on February 15 and August 15 of each year, which commenced on February 15, 2019. The 2018 Convertible Notes matured on August 15, 2023.
On November 4, 2022, the Company launched a tender offer to purchase, upon the terms and subject to the conditions set forth in the Offer to Purchase, dated November 4, 2022, up to $201,250 aggregate principal amount of then outstanding 2018 Convertible Notes for cash in an amount equal to $1,000 per $1,000 principal amount of Notes purchased (exclusive of accrued and unpaid interest on such notes) (the "Tender Offer"). The Tender Offer expired on December 6, 2022. As of the expiration of the Tender Offer, $84,434 aggregate principal amount of the 2018 Convertible Notes were validly tendered and not validly withdrawn pursuant to the Tender Offer. The Company accepted for purchase all of the 2018 Convertible Notes that were validly tendered and not validly withdrawn at the expiration of the Tender Offer. Following settlement of the Tender Offer on December 9, 2022, approximately $116,816 aggregate principal amount of the 2018 Convertible Notes remained outstanding.
On August 15, 2023, the Company's $116,816 aggregate principal amount of 2018 Convertible Notes matured and the Company repaid the outstanding principal and accrued but unpaid interest in cash.
2022 Convertible Notes—On November 2, 2022, the Company closed a private offering of $200,000 aggregate principal amount of unsecured convertible notes (the “2022 Convertible Notes”), pursuant to an indenture, dated August 20, 2018, as supplemented by a third supplemental indenture thereto, dated November 2, 2022 (together the “2018C Indenture”). On March 14, 2023, the Company issued an additional $60,000 aggregate principal amount of the 2022 Convertible Notes. These additional 2022 Convertible Notes constitute a further issuance of, rank equally in right of payment with, and form a single series with the $200,000 aggregate principal amount of the 2022 Convertible Notes that the Company issued in November 2022.
The 2022 Convertible Notes bear interest at an annual rate of 7.50%, payable semi-annually in arrears on April 15 and October 15 of each year, commencing on April 15, 2023. The 2022 Convertible Notes will mature on October 15, 2025 unless earlier converted, repurchased or redeemed pursuant to the terms of the 2018C Indenture. The Company may not redeem the 2022 Convertible Notes prior to July 15, 2025. On or after July 15, 2025, the Company may redeem the 2022 Convertible Notes for cash, in whole or from time to time in part, at our option at a redemption price, subject to an exception for redemption dates occurring after a record date but on or prior to the interest payment date, equal to the sum of (i) 100% of the principal amount of the 2022 Convertible Notes to be redeemed, (ii) accrued and unpaid interest thereon to, but excluding, the redemption date and (iii) a make-whole premium.
The following table summarizes certain key terms related to the convertible features of the Company’s 2022 Convertible Notes as of December 31, 2023. | | | | | | | | |
| | | 2022 Convertible Notes |
| Initial conversion premium | | 14.7 | % |
| Initial conversion rate(1) | | 70.4225 | |
| Initial conversion price | | $ | 14.20 | |
| | |
| Conversion rate at December 31, 2023(1)(2) | | 72.1779 | |
| Conversion price at December 31, 2023(2)(3) | | $ | 13.85 | |
| Last conversion price calculation date | | December 22, 2023 |
(1)Conversion rates denominated in shares of common stock per $1 principal amount of the 2022 Convertible Notes converted.
(2)Represents conversion rate and conversion price, as applicable, taking into account certain de minimis adjustments that will be made on the conversion date.
(3)The conversion price in effect at December 31, 2023 on the 2022 Convertible Notes was last calculated on December 22, 2023.
The conversion rate will be subject to adjustment upon certain events, such as stock splits and combinations, mergers, spin-offs, increases in dividends in excess of $0.30 per share per quarter for the 2022 Convertible Notes and certain changes in control. Certain of these adjustments, including adjustments for increases in dividends, are subject to a conversion price floor of $12.38 per share for the 2022 Convertible Notes. In no event will the total number of shares of common stock issuable upon conversion exceed 80.7754 per $1 principal amount of the 2022 Convertible Notes. The Company has determined that the embedded conversion option in the 2022 Convertible Notes is not required to be separately accounted for as a derivative under GAAP.
The 2022 Convertible Notes are unsecured obligations and rank senior in right of payment to the Company’s existing and future indebtedness, if any, that is expressly subordinated in right of payment to the 2022 Convertible Notes; equal in right of payment to the Company’s existing and future unsecured indebtedness that is not so subordinated; effectively junior in right of payment to any of the Company’s secured indebtedness (including existing unsecured indebtedness that the Company later secures) to the extent of the value of the assets securing such indebtedness; and structurally junior to all existing and future indebtedness (including trade payables) incurred by the Company’s subsidiaries and financing vehicles. As reflected in Note 12. Earnings Per Share, the issuance is considered part of the if-converted method for calculation of diluted earnings per share.
The following table summarizes the interest expense, amortization of financing costs and amortization of premium incurred on the 2018 Convertible Notes and 2022 Convertible Notes (together, the "Convertible Notes") for the years ended December 31, 2023, December 31, 2022 and December 31, 2021. | | | | | | | | | | | | | | | | | |
| | Year Ended December 31, |
| | 2023 | | 2022(1) | | 2021 |
| Interest expense | $ | 22,767 | | | $ | 13,734 | | | $ | 11,572 | |
| Amortization of financing costs | $ | 1,676 | | | $ | 694 | | | $ | 395 | |
| Amortization of premium | $ | (130) | | | $ | (130) | | | $ | (103) | |
| Weighted average interest rate | 7.1 | % | | 6.0 | % | | 5.8 | % |
| Effective interest rate | 7.6 | % | | 6.2 | % | | 5.9 | % |
| Average debt outstanding | $ | 320,494 | | | $ | 228,806 | | | $ | 201,250 | |
(1)For the year ended December 31, 2022, amounts reported include interest and amortization of financing costs related to the 2022 Convertible Notes for the period from November 2, 2022 (issuance of the 2022 Convertible Notes) to December 31, 2022.
As of December 31, 2023, December 31, 2022 and December 31, 2021, the outstanding balance on the 2022 Convertible Notes was $260,000, $200,000 and $0, respectively. As of December 31, 2023, December 31, 2022 and December 31, 2021, the outstanding balance on the 2018 Convertible Notes was $0, $116,816 and $201,250, respectively. The Company was in compliance with the terms of the 2018A Indenture and 2018C Indenture on such dates.
Unsecured Notes
On May 6, 2016, the Company issued $50,000 in aggregate principal amount of five-year unsecured notes (the “2016 Unsecured Notes”), pursuant to a note purchase agreement, dated May 4, 2016, to an institutional investor in a private placement. On September 30, 2016, the Company entered into an amended and restated note purchase agreement (the "NPA") and issued an additional $40,000 in aggregate principal amount of 2016 Unsecured Notes to institutional investors in a private placement. On February 16, 2021, the Company repaid all $90,000 in aggregate principal amount of the issued and outstanding 2016 Unsecured Notes. On June 30, 2017, the Company issued $55,000 in aggregate principal amount of five-year unsecured notes that matured on July 15, 2022 (the "2017A Unsecured Notes"), pursuant to the NPA and a supplement to the NPA. On July 15, 2022, the Company caused notices to be issued to holders of the Company's 2017A Unsecured Notes regarding the exercise of the Company's option to repay all of the Company's $55,000 in aggregate principal amount of issued and outstanding 2017A Unsecured Notes, which was repaid on July 14, 2022. On January 30, 2018, the Company issued $90,000 in aggregate principal amount of five year unsecured notes that matured on January 30, 2023 (the "2018A Unsecured Notes") pursuant to the NPA and a second supplement to the NPA. On January 30, 2023, the Company caused notices to be issued to holders of the Company's 2018A Unsecured Notes regarding the exercise of the Company's option to repay all of the Company's $90,000 in aggregate principal amount of issued and outstanding 2018A Unsecured Notes, which was repaid on January 27, 2023. On July 5, 2018, the Company issued $50,000 in aggregate principal amount of five year unsecured notes that matured on June 28, 2023 (the "2018B Unsecured Notes") pursuant to the NPA and a third supplement to the NPA (the "Third Supplement"). On June 28, 2023, the Company caused notices to be issued to holders of the Company's 2018B Unsecured Notes regarding the exercise of the Company's option to repay all of the Company's $50,000 in aggregate principal amount of issued and outstanding 2018B Unsecured Notes, which was repaid on June 27, 2023. On April 30, 2019, the Company issued $116,500 in aggregate principal amount of five year unsecured notes that mature on April 30, 2024 (the "2019A Unsecured Notes") pursuant to the NPA and a fourth supplement to the NPA (the "Fourth Supplement"). On February 5, 2024, the Company fully repaid $116,500 in aggregate principal amount of issued and outstanding 2019A Unsecured Notes. See Note 15. Subsequent Events, for details. On January 29, 2021, the Company issued $200,000 in aggregate principal amount of five year unsecured notes that mature on January 29, 2026 (the "2021A Unsecured Notes") pursuant to the NPA and a fifth supplement to the NPA (the "Fifth Supplement"). On June 15, 2022, the Company issued $75,000 in aggregate principal amount of five year unsecured notes that mature on June 15, 2027 (the "2022A Unsecured Notes") pursuant to the NPA and a sixth supplement to the NPA (the "Sixth Supplement"). The NPA provides for future issuances of unsecured notes in separate series or tranches.
The 2016 Unsecured Notes bore interest at an annual rate of 5.313%, payable semi-annually on May 15 and November 15 of each year. The 2017A Unsecured Notes bore interest at an annual rate of 4.760%, payable semi-annually on January 15 and July 15 of each year. The 2018A Unsecured Notes bore interest at an annual rate of 4.870%, payable semi-annually on February 15 and August 15 of each year. The 2018B Unsecured Notes bore interest at an annual rate of 5.360%, payable semi-annually on January 15 and July 15 of each year. The 2019A Unsecured Notes bear interest at an annual rate of 5.494%, payable semi-annually on April 15 and October 15 of each year. The 2021A Unsecured Notes bear interest at an annual rate of 3.875%, payable semi-annually in arrears on January 29 and July 29 of each year. The 2022A Unsecured Notes bear interest at an annual rate of 5.900%, payable semi-annually in arrears on June 15 and December 15 of each year, which commenced on December 14, 2022. These interest rates are subject to increase in the event that: (i) subject to certain exceptions, the underlying unsecured notes or the Company ceases to have an investment grade rating or (ii) the aggregate amount of the Company’s unsecured debt falls below $150,000. In each such event, the Company has the option to offer to prepay the underlying unsecured notes at par, in which case holders of the underlying unsecured notes who accept the offer would not receive the increased interest rate. In addition, the Company is obligated to offer to prepay the underlying unsecured notes at par if the Investment Adviser, or an affiliate thereof, ceases to be the Company’s investment adviser or if certain change in control events occur with respect to the Investment Adviser.
The NPA contains customary terms and conditions for unsecured notes issued in a private placement, including, without limitation, an option to offer to prepay all or a portion of the unsecured notes under its governance at par (plus a make-whole amount, if applicable), affirmative and negative covenants such as information reporting, maintenance of the Company’s status as a BDC under the 1940 Act and a RIC under the Code, minimum stockholders’ equity, minimum asset coverage ratio, and prohibitions on certain fundamental changes at the Company or any subsidiary guarantor, as well as customary events of default with customary cure and notice, including, without limitation, nonpayment, misrepresentation in a material respect, breach of covenant, cross-default under other indebtedness of the Company or certain significant subsidiaries, certain judgments and orders, and certain events of bankruptcy. The Third Supplement, Fourth Supplement, Fifth Supplement and Sixth Supplement all include additional financial covenants related to asset coverage as well as other terms.
On November 13, 2023, the Company closed a registered public offering of $115,000 in aggregate principal amount of 8.250% Unsecured Notes that mature on November 15, 2028 (the "8.250% Unsecured Notes", together with the 2019A Unsecured Notes, 2021A Unsecured Notes and 2022A Unsecured Notes, the "Unsecured Notes"), pursuant to a base indenture
and fourth supplemental indenture thereto dated November 13, 2023 (the "Indenture") between us and U.S. Bank Trust Company, National Association (as successor in interest to U.S. Bank National Association), as trustee.
The 8.250% Unsecured Notes bear interest at an annual rate of 8.250%, payable quarterly on February 15, May 15, August 15 and November 15 of each year, beginning on February 15, 2024. The 8.250% Unsecured Notes are listed on NASDAQ Global Select Market and trade under the trading symbol "NMFCZ".
The Company may redeem the 8.250% Unsecured Notes, in whole or in part, at any time, or from time to time, at its option on or after November 15, 2025 at the redemption price of par, plus accrued interest.
No sinking fund provision is provided for the 8.250% Unsecured Notes and holders of the 8.250% Unsecured Notes have no option to have their 8.250% Unsecured Notes repaid prior to the stated maturity date.
The Unsecured Notes are unsecured obligations and rank senior in right of payment to the Company’s existing and future indebtedness, if any, that is expressly subordinated in right of payment to the Unsecured Notes; equal in right of payment to the Company’s existing and future unsecured indebtedness that is not so subordinated; effectively junior in right of payment to any of the Company’s secured indebtedness (including existing unsecured indebtedness that the Company later secures) to the extent of the value of the assets securing such indebtedness; and structurally junior to all existing and future indebtedness (including trade payables) incurred by the Company’s subsidiaries and financing vehicles.
The following table summarizes the interest expense and amortization of financing costs incurred on the Unsecured Notes for the years ended December 31, 2023, December 31, 2022 and December 31, 2021. | | | | | | | | | | | | | | | | | |
| | Year Ended December 31, |
| | 2023(1) | | 2022(2) | | 2021(3) |
| Interest expense | $ | 21,511 | | | $ | 25,033 | | | $ | 24,401 | |
| Amortization of financing costs | $ | 770 | | | $ | 801 | | | $ | 1,864 | |
| Weighted average interest rate | 4.9 | % | | 4.8 | % | | 4.7 | % |
| Effective interest rate | 5.1 | % | | 4.9 | % | | 5.1 | % |
| Average debt outstanding | $ | 438,473 | | | $ | 526,829 | | | $ | 516,611 | |
(1)For the year ended December 31, 2023, amounts reported include interest and amortization of financing costs related to the 8.250% Unsecured Notes for the period from November 13, 2023 (issuance date of the 8.250% Unsecured Notes ) to December 31, 2023.
(2)For the year ended December 31, 2022, amounts reported include interest and amortization of financing costs related to the 2022A Unsecured Notes for the period from June 15, 2022 (issuance date of the 2022A Unsecured Notes) to December 31, 2022.
(3)For the year ended December 31, 2021, amounts reported include interest and amortization of financing costs related to the 2021A Unsecured Notes for the period from January 29, 2021 (issuance date of the 2021A Unsecured Notes) to December 31, 2021.
As of December 31, 2023, December 31, 2022 and December 31, 2021, the outstanding balance on the Unsecured Notes was $506,500, $531,500 and $511,500, respectively, and the Company was in compliance with the terms of the NPA and the Indenture as of such dates, as applicable.
SBA-guaranteed debentures—On August 1, 2014 and August 25, 2017, respectively, SBIC I and SBIC II received licenses from the SBA to operate as SBICs.
These SBIC licenses allow each of SBIC I and SBIC II to obtain leverage by issuing SBA-guaranteed debentures, subject to the issuance of a capital commitment by the SBA and other customary procedures. SBA-guaranteed debentures are non-recourse to the Company, interest only debentures with interest payable semi-annually and have a ten year maturity. The principal amount of SBA-guaranteed debentures is not required to be paid prior to maturity but may be prepaid at any time without penalty. The interest rate of SBA-guaranteed debentures is fixed on a semi-annual basis at a market-driven spread over U.S. Treasury Notes with ten year maturities. The SBA, as a creditor, will have a superior claim to the assets of SBIC I and SBIC II over the Company's stockholders in the event SBIC I and SBIC II are liquidated or the SBA exercises remedies upon an event of default.
The maximum amount of borrowings available under current SBA regulations for a single licensee is $150,000 as long as the licensee has at least $75,000 in regulatory capital, receives a capital commitment from the SBA and has been through an examination by the SBA subsequent to licensing. In June 2018, legislation amended the 1958 Act by increasing the individual leverage limit from $150,000 to $175,000, subject to SBA approvals.
As of December 31, 2023 and December 31, 2022, SBIC I had regulatory capital of $75,000 and $75,000, respectively, and SBA-guaranteed debentures outstanding of $150,000 and $150,000, respectively. As of December 31, 2023 and December 31, 2022, SBIC II had regulatory capital of $75,000 and $75,000, respectively, and $150,000 and $150,000, respectively, of SBA-guaranteed debentures outstanding. The SBA-guaranteed debentures incur upfront fees of 3.435%, which consists of a 1.00% commitment fee and a 2.435% issuance discount, which are amortized over the life of the SBA-guaranteed debentures.
The following table summarizes the Company’s SBA-guaranteed debentures as of December 31, 2023. | | | | | | | | | | | | | | | | | | | | | | | | | | |
| Issuance Date | | Maturity Date | | Debenture Amount | | Interest Rate | | SBA Annual Charge |
| Fixed SBA-guaranteed debentures(1): | | | | | | | | |
| March 25, 2015 | | March 1, 2025 | | $ | 37,500 | | | 2.517 | % | | 0.355 | % |
| September 23, 2015 | | September 1, 2025 | | 37,500 | | | 2.829 | % | | 0.355 | % |
| September 23, 2015 | | September 1, 2025 | | 28,795 | | | 2.829 | % | | 0.742 | % |
| March 23, 2016 | | March 1, 2026 | | 13,950 | | | 2.507 | % | | 0.742 | % |
| September 21, 2016 | | September 1, 2026 | | 4,000 | | | 2.051 | % | | 0.742 | % |
| September 20, 2017 | | September 1, 2027 | | 13,000 | | | 2.518 | % | | 0.742 | % |
| March 21, 2018 | | March 1, 2028 | | 15,255 | | | 3.187 | % | | 0.742 | % |
| Fixed SBA-guaranteed debentures(2): | | | | | | | | |
| September 19, 2018 | | September 1, 2028 | | 15,000 | | | 3.548 | % | | 0.222 | % |
| September 25, 2019 | | September 1, 2029 | | 19,000 | | | 2.283 | % | | 0.222 | % |
| March 25, 2020 | | March 1, 2030 | | 41,000 | | | 2.078 | % | | 0.222 | % |
| March 25, 2020 | | March 1, 2030 | | 24,000 | | | 2.078 | % | | 0.275 | % |
| September 23, 2020 | | September 1, 2030 | | 51,000 | | | 1.034 | % | | 0.275 | % |
| Total SBA-guaranteed debentures | | | | $ | 300,000 | | | | | |
(1)SBA-guaranteed debentures are held by SBIC I.
(2)SBA-guaranteed debentures are held by SBIC II.
Prior to pooling, the SBA guaranteed debentures bear interest at an interim interest rate equal to the Federal Home Loan Bank of Chicago's Fixed Regular Advance Rate (Bank Advance Rate), plus 41 basis points. Once pooled, which occurs in March and September each year, the SBA-guaranteed debentures bear interest at a fixed rate that is set to the current 10-year treasury rate plus a spread at each pooling date.
The following table summarizes the interest expense and amortization of financing costs incurred on the SBA-guaranteed debentures for the years ended December 31, 2023, December 31, 2022 and December 31, 2021. | | | | | | | | | | | | | | | | | |
| | Year Ended December 31, |
| | 2023 | | 2022 | | 2021 |
| Interest expense | $ | 8,104 | | | $ | 8,104 | | | $ | 8,104 | |
| Amortization of financing costs | $ | 1,002 | | | $ | 1,002 | | | $ | 1,002 | |
| Weighted average interest rate | 2.7 | % | | 2.7 | % | | 2.7 | % |
| Effective interest rate | 3.0 | % | | 3.0 | % | | 3.0 | % |
| Average debt outstanding | $ | 300,000 | | | $ | 300,000 | | | $ | 300,000 | |
The SBIC program is designed to stimulate the flow of private investor capital into eligible small businesses, as defined by SBA regulations that, among other things: require SBICs to invest in eligible small businesses and invest at least 25.0% of investment capital in eligible smaller enterprises (as defined by the SBA regulations), place certain limitations on the financing terms of investments, regulate the types of financing provided by an SBIC, prohibit investments in small businesses with certain characteristics or in certain industries and require capitalization thresholds that limit distributions to us. SBICs are subject to an annual periodic examination by an SBA examiner to determine the SBIC's compliance with the relevant SBA regulations and an annual financial audit of its financial statements that are prepared on a basis of accounting other than GAAP (such as ASC 820) by an independent auditor. As of December 31, 2023, December 31, 2022 and December 31, 2021, SBIC I and SBIC II were in compliance with SBA regulatory requirements.
Leverage risk factors—The Company utilizes and may utilize leverage to the maximum extent permitted by the law for investment and other general business purposes. The Company's lenders will have fixed dollar claims on certain assets that are superior to the claims of the Company's common stockholders, and the Company would expect such lenders to seek recovery against these assets in the event of a default. The use of leverage also magnifies the potential for gain or loss on amounts invested. Leverage may magnify interest rate risk (particularly on the Company's fixed-rate investments), which is the risk that the prices of portfolio investments will fall or rise if market interest rates for those types of securities rise or fall. As a result, leverage may cause greater changes in the Company's net asset value. Similarly, leverage may cause a sharper decline in the Company's income than if the Company had not borrowed. Such a decline could negatively affect the Company's ability to make distributions to its stockholders. Leverage is generally considered a speculative investment technique. The Company's ability to service any debt incurred will depend largely on financial performance and will be subject to prevailing economic conditions and competitive pressures.
Note 8. Regulation
The Company has elected to be treated, and intends to comply with the requirements to continue to qualify annually, as a RIC under Subchapter M of the Code. In order to continue to qualify and be subject to tax treatment as a RIC, among other things, the Company is generally required to timely distribute to its stockholders at least 90.0% of its investment company taxable income, as defined by the Code, for each year. The Company, among other things, intends to make and will continue to make the requisite distributions to its stockholders, which will generally relieve the Company from U.S. federal, state, and local income taxes (excluding excise taxes which may be imposed under the Code).
Additionally, as a BDC, the Company must not acquire any assets other than "qualifying assets" as defined in Section 55(a) of the 1940 Act unless, at the time the acquisition is made, at least 70.0% of its total assets are qualifying assets (with certain limited exceptions). In addition, the Company must offer to make available to all "eligible portfolio companies" (as defined in the 1940 Act) significant managerial assistance.
Note 9. Commitments and Contingencies
In the normal course of business, the Company may enter into contracts that contain a variety of representations and warranties and which provide general indemnifications. The Company may also enter into future funding commitments such as revolving credit facilities, bridge financing commitments or delayed draw commitments. As of December 31, 2023, the Company had unfunded commitments on revolving credit facilities of $112,803, no outstanding bridge financing commitments and other future funding commitments of $43,948. As of December 31, 2022, the Company had unfunded commitments on revolving credit facilities of $100,315, no outstanding bridge financing commitments and other future funding commitments of $123,748. The unfunded commitments on revolving credit facilities and delayed draws are disclosed on the Company's Consolidated Schedules of Investments.
The Company also had revolving borrowings available under the Holdings Credit Facility, the DB Credit Facility, the NMFC Credit Facility, the Unsecured Management Company Revolver and the NMNLC Credit Facility II as of December 31, 2023 and December 31, 2022. See Note 7. Borrowings, for details.
The Company may from time to time enter into financing commitment letters. As of December 31, 2023 and December 31, 2022, the Company had commitment letters to purchase investments in the aggregate par amount of $11,105 and $45,634, respectively, which could require funding in the future.
Note 10. Distributions
Differences between taxable income and the results of operations for financial reporting purposes may be permanent or temporary in nature. Permanent differences are reclassified among capital accounts in the financial statements to reflect their tax character. Differences in classification may also result from the treatment of short-term gains as ordinary income for tax purposes. During the years ended December 31, 2023, December 31, 2022 and December 31, 2021, the Company's reclassifications of amounts for book purposes arising from permanent book/tax differences primarily related to return of capital distributions were as follows: | | | | | | | | | | | | | | | | | |
| | Year Ended December 31, |
| | 2023 | | 2022 | | 2021 |
| Undistributed net investment income | $ | (5,367) | | | $ | 33,152 | | | $ | 10,476 | |
| Distributions in excess of net realized gains | 898 | | | (25,449) | | | — | |
| Additional paid-in-capital | 4,469 | | | (7,703) | | | (10,476) | |
For U.S. federal income tax purposes, distributions paid to stockholders of the Company are reported as ordinary income, return of capital, long term capital gains or a combination thereof. The tax character of distributions paid by the
Company for the years ended December 31, 2023, December 31, 2022 and December 31, 2021 were estimated to be as follows: | | | | | | | | | | | | | | | | | |
| | Year Ended December 31, |
| | 2023 | | 2022 | | 2021 |
| Ordinary income (non-qualified) | $ | 140,397 | | | $ | 86,388 | | | $ | 105,963 | |
| Ordinary income (qualified) | 10,340 | | | — | | | — | |
| Capital gains | — | | | 25,449 | | | — | |
| Return of capital | — | | | 10,549 | | | 10,490 | |
| Total | $ | 150,737 | | | $ | 122,386 | | | $ | 116,453 | |
As of December 31, 2023, December 31, 2022 and December 31, 2021, the costs of investments for the Company for tax purposes were $2,927,312, $3,209,491 and $3,114,145, respectively. | | | | | | | | | | | | | | | | | |
| | December 31, 2023(1)(2) | | December 31, 2022(1)(2) | | December 31, 2021(1)(2) |
| Tax cost | $ | 2,927,312 | | | $ | 3,209,491 | | | $ | 3,114,145 | |
| Gross unrealized appreciation on investments | 466,794 | | | 438,214 | | | 343,520 | |
| Gross unrealized depreciation on investments | (366,284) | | | (409,919) | | | (298,616) | |
| Total investments at fair value | $ | 3,027,822 | | | $ | 3,237,786 | | | $ | 3,159,049 | |
(1)Includes securities purchased under collateralized agreement to resell.
(2)Excludes investments attributable to non-controlling interest in NMNLC.
At December 31, 2023, December 31, 2022 and December 31, 2021, the components of distributable earnings on a tax basis differ from the amounts reflected per the Company's Consolidated Statements of Assets and Liabilities by temporary book/tax differences primarily arising from differences between the tax and book basis of the Company's investment in securities held directly as well as through undistributed income.
As of December 31, 2023, December 31, 2022 and December 31, 2021, the Company's components of accumulated earnings (deficit) on a tax basis were as follows: | | | | | | | | | | | | | | | | | |
| | Year Ended December 31, |
| | 2023 | | 2022 | | 2021 |
| Accumulated capital loss carryforwards | $ | (84,427) | | | $ | — | | | $ | (25,837) | |
| Other temporary differences | 6,986 | | | 8,538 | | | 9,722 | |
| Undistributed ordinary income | 4,522 | | | — | | | — | |
| Unrealized depreciation (appreciation) | 60,575 | | | (1,019) | | | 63,585 | |
| Total | $ | (12,344) | | | $ | 7,519 | | | $ | 47,470 | |
The Company is subject to a 4.0% nondeductible U.S. federal excise tax on certain undistributed income unless the Company distributes, in a timely manner as required by the Code, an amount at least equal to the sum of (1) 98.0% of its net ordinary income earned for the calendar year and (2) 98.2% of its capital gain net income for the one-year period ending October 31 in the calendar year. For the year ended December 31, 2023, the Company does not expect to incur any excise taxes. For the years ended December 31, 2022 and December 31, 2021, the Company did not incur any excise taxes.
The following information is hereby provided with respect to distributions declared during the calendar years ended December 31, 2023, December 31, 2022 and December 31, 2021: | | | | | | | | | | | | | | | | | |
| Year Ended December 31, |
| 2023 | | 2022 | | 2021 |
| Distributions per share | $ | 1.49 | | | $ | 1.22 | | | $ | 1.20 | |
| Ordinary dividends | 93.14 | % | | 70.59 | % | | 90.99 | % |
| Long-term capital gains | — | % | | 20.79 | % | | — | % |
| Qualified dividend income | 6.86 | % | | — | % | | — | % |
| Dividends received deduction | 6.86 | % | | — | % | | — | % |
| Interest-related dividends(1) | 88.43 | % | | 64.49 | % | | 74.53 | % |
| Qualified short-term capital gains(1) | — | % | | — | % | | — | % |
| Return of capital | — | % | | 8.62 | % | | 9.01 | % |
(1) Represents the portion of the taxable ordinary dividends eligible for exemption from U.S. withholding tax for
nonresident aliens and foreign corporations.
Dividends and distributions that were reinvested through the Company’s dividend reinvestment plan are treated, for tax purposes, as if they had been paid in cash. Therefore, stockholders who participated in the dividend reinvestment plan should also refer to the information as provided in the table above.
Note 11. Net Assets
The table below illustrates the effect of certain transactions on the net asset accounts of the Company during the years ended December 31, 2023, December 31, 2022 and December 31, 2021: | | | | | | | | | | | | | | | | | | | | | | | | | | | | | | | | | | | | | | | | | | | | | | | | | | | | | | | | | | | | | | | |
| | | | | | | | | | | | | Accumulated Overdistributed Earnings | | | | | | |
| | | Common Stock | | | | | Paid in
Capital in Excess of Par | | | Accumulated
Net Investment
Income | | | Accumulated
Net Realized
Gains (Losses) | | | Net
Unrealized
Appreciation
(Depreciation) | | Total
Net Assets of NMFC | | Non-Controlling Interest in NMNLC | | Total
Net Assets |
| | | Shares | | | Par Amount | | | | | | | | | | | | |
| Net assets at December 31, 2020 | | 96,827,342 | | | | $ | 968 | | | | | | $ | 1,269,671 | | | | $ | 105,981 | | | | $ | (88,250) | | | | $ | (66,495) | | | $ | 1,221,875 | | | $ | 15,014 | | | $ | 1,236,889 | |
| Issuances of common stock | | 1,080,099 | | | | 11 | | | | | | 14,644 | | | | — | | | | — | | | | — | | | 14,655 | | | — | | | 14,655 | |
| | | | | | | | | | | | | | | | | | | | | | | | | |
| | | | | | | | | | | | | | | | | | | | | | | | | |
| Offering costs | | — | | | | — | | | | | | (231) | | | | — | | | — | | — | | | | — | | | (231) | | | — | | | (231) | |
| Distributions declared | | — | | | | — | | | | | | — | | | | (116,453) | | | | — | | | | — | | | (116,453) | | | (1,222) | | | (117,675) | |
| Contributions related to non-controlling interest in NMNLC | | — | | | | — | | | | | | — | | | | — | | | | — | | | | — | | | — | | | 1,792 | | | 1,792 | |
| Net increase (decrease) in net assets resulting from operations | | — | | | | — | | | | | | — | | | | 117,514 | | | | (3,849) | | | | 87,734 | | | 201,399 | | | 5,783 | | | 207,182 | |
| Tax reclassifications related to return of capital distributions (See Note 10) | | — | | | | — | | | | | | (11,288) | | | | 11,288 | | | | — | | | | — | | | — | | | — | | | — | |
| Net assets at December 31, 2021 | | 97,907,441 | | | | $ | 979 | | | | | | $ | 1,272,796 | | | | $ | 118,330 | | | | $ | (92,099) | | | | $ | 21,239 | | | $ | 1,321,245 | | | $ | 21,367 | | | $ | 1,342,612 | |
| Issuances of common stock | | 3,029,585 | | | | 30 | | | | | | 41,074 | | | | — | | | | — | | | | — | | | 41,104 | | | — | | | 41,104 | |
| | | | | | | | | | | | | | | | | | | | | | | | | |
| | | | | | | | | | | | | | | | | | | | | | | | | |
| Offering costs | | — | | | | — | | | | | | (222) | | | | — | | | | — | | | | — | | | (222) | | | — | | | (222) | |
| Distributions declared | | — | | | | — | | | | | | — | | | | (122,386) | | | | — | | | | — | | | (122,386) | | | (9,569) | | | (131,955) | |
| Contributions related to non-controlling interest in NMNLC | | — | | | | — | | | | | | — | | | | — | | | | — | | | | — | | | — | | | 124 | | | 124 | |
| Net increase (decrease) in net assets resulting from operations | | — | | | | — | | | | | | — | | | | 118,497 | | | | 49,476 | | | | (93,241) | | | 74,732 | | | (204) | | | 74,528 | |
| Tax reclassifications related to return of capital distributions (See Note 10) | | — | | | | — | | | | | | (7,703) | | | | 33,152 | | | | (25,449) | | | | — | | | — | | | — | | | — | |
| Net assets at December 31, 2022 | | 100,937,026 | | | | $ | 1,009 | | | | | | $ | 1,305,945 | | | | $ | 147,593 | | | | $ | (68,072) | | | | $ | (72,002) | | | $ | 1,314,473 | | | $ | 11,718 | | | $ | 1,326,191 | |
| Issuances of common stock | | 1,621,833 | | | | 17 | | | | | | 21,224 | | | | — | | | | — | | | | — | | | 21,241 | | | — | | | 21,241 | |
| | | | | | | | | | | | | | | | | | | | | | | | | |
| | | | | | | | | | | | | | | | | | | | | | | | | |
| | | | | | | | | | | | | | | | | | | | | | | | | |
| Offering costs | | — | | | | — | | | | | | (369) | | | | — | | | | — | | | | — | | | (369) | | | — | | | (369) | |
| Distributions declared | | — | | | | — | | | | | | — | | | | (150,737) | | | | — | | | | — | | | (150,737) | | | (693) | | | (151,430) | |
| Contributions related to non-controlling interest in NMNLC | | — | | | | — | | | | | | — | | | | — | | | | — | | | | — | | | — | | | — | | | — | |
| Net increase (decrease) in net assets resulting from operations | | — | | | | — | | | | | | — | | | | 158,918 | | | | (32,841) | | | | 9,266 | | | 135,343 | | | 747 | | | 136,090 | |
| Tax reclassifications related to return of capital distributions (See Note 10) | | — | | | | — | | | | | | 4,469 | | | | (5,367) | | | | 898 | | | | — | | | — | | | — | | | — | |
| Net assets at December 31, 2023 | | 102,558,859 | | | | $ | 1,026 | | | | | | $ | 1,331,269 | | | | $ | 150,407 | | | | $ | (100,015) | | | | $ | (62,736) | | | $ | 1,319,951 | | | $ | 11,772 | | | $ | 1,331,723 | |
On November 3, 2021, the Company entered into an equity distribution agreement, as amended on May 18, 2023 and August 23, 2023 (the “Distribution Agreement”) with B. Riley Securities, Inc. and Raymond James & Associates, Inc. (collectively, the “Agents”). The Distribution Agreement provides that the Company may issue and sell its shares from time to time through the Agents, up to $250,000 worth of its common stock by means of at-the-market ("ATM") offerings.
For the year ended December 31, 2023, the Company sold 1,621,833 shares of common stock under the Distribution Agreement. For the same period, the Company received total accumulated net proceeds of approximately $21,241, including $0 of
offering expenses, from these sales. For the year ended December 31, 2022, the Company sold 2,950,300 shares of common stock under the Distribution Agreement. For the same period, the Company received total accumulated net proceeds of approximately $40,007, including $439 of offering expenses, from these sales. For the year ended December 31, 2021, the Company sold 914,175 shares of common stock under the Distribution Agreement. For the same period, the Company received total accumulated net proceeds of approximately $12,427, including $189 of offering expenses, from these sales.
The Company generally uses net proceeds from these offerings to make investments, to pay down liabilities and for general corporate purposes. As of December 31, 2023, December 31, 2022 and December 31, 2021, shares representing approximately $175,694, $196,938 and $237,384, respectively, of its common stock remain available for issuance and sale under the Distribution Agreement.
Note 12. Earnings Per Share
The following information sets forth the computation of basic and diluted net increase in the Company's net assets per share resulting from operations for the years ended December 31, 2023, December 31, 2022 and December 31, 2021: | | | | | | | | | | | | | | | | | |
| | Year Ended December 31, |
| | 2023 | | 2022 | | 2021 |
| Earnings per share—basic | | | | | |
| Numerator for basic earnings per share: | $ | 135,343 | | | $ | 74,732 | | | $ | 201,399 | |
| Denominator for basic weighted average share: | 101,118,302 | | | 100,202,847 | | | 96,952,959 | |
| Basic earnings per share: | $ | 1.34 | | | $ | 0.75 | | | $ | 2.08 | |
| Earnings per share—diluted(1) | | | | | |
| Numerator for increase in net assets per share | $ | 135,343 | | | $ | 74,732 | | | $ | 201,399 | |
| Adjustment for interest on Convertible Notes and incentive fees, net | 18,214 | | | 10,987 | | | 9,258 | |
| Numerator for diluted earnings per share: | $ | 153,557 | | | $ | 85,719 | | | $ | 210,657 | |
| Denominator for basic weighted average share | 101,118,302 | | | 100,202,847 | | | 96,952,959 | |
| Adjustment for dilutive effect of Convertible Notes | 22,370,580 | | | 15,223,351 | | | 13,257,586 | |
| Denominator for diluted weighted average share | 123,488,882 | | | 115,426,198 | | | 110,210,545 | |
| Diluted earnings per share | $ | 1.24 | | | $ | 0.74 | | | $ | 1.91 | |
(1)In applying the if-converted method, conversion is not assumed for purposes of computing diluted earnings per share if the effect would be anti-dilutive. For the years ended December 31, 2023, December 31, 2022 and December 31, 2021, there was no anti-dilution.
Note 13. Financial Highlights
The following information sets forth the Company's financial highlights for the years ended December 31, 2023, December 31, 2022, December 31, 2021, December 31, 2020 and December 31, 2019. | | | | | | | | | | | | | | | | | | | | | | | | | | | | | |
| | Year Ended December 31, |
| | 2023 | | 2022 | | 2021 | | 2020 | | 2019 |
| Per share data(1): | | | | | | | | | |
| Net asset value at the beginning of the period | $ | 13.02 | | | $ | 13.49 | | | $ | 12.62 | | | $ | 13.26 | | | $ | 13.22 | |
| Net investment income | 1.57 | | | 1.18 | | | 1.21 | | | 1.20 | | | 1.37 | |
| Net realized and unrealized (losses) gains(2) | (0.23) | | | (0.43) | | | 0.86 | | | (0.60) | | | 0.03 | |
| | | | | | | | | |
| | | | | | | | | |
| | | | | | | | | |
| Total net increase | 1.34 | | | 0.75 | | | 2.07 | | | 0.60 | | | 1.40 | |
| Distributions declared to stockholders from net investment income | (1.49) | | | (1.22) | | | (1.20) | | | (1.24) | | | (1.36) | |
| | | | | | | | | |
| Net asset value at the end of the period | $ | 12.87 | | | $ | 13.02 | | | $ | 13.49 | | | $ | 12.62 | | | $ | 13.26 | |
| Per share market value at the end of the period | $ | 12.72 | | | $ | 12.37 | | | $ | 13.70 | | | $ | 11.36 | | | $ | 13.74 | |
| Total return based on market value(3) | 15.48 | % | | (0.56) | % | | 31.91 | % | | (5.24) | % | | 20.45 | % |
| Total return based on net asset value(4) | 10.64 | % | | 5.71 | % | | 16.97 | % | | 5.52 | % | | 10.90 | % |
| Shares outstanding at end of period | 102,558,859 | | | 100,937,026 | | | 97,907,441 | | | 96,827,342 | | | 96,827,342 | |
| Average weighted shares outstanding for the period | 101,118,302 | | | 100,202,847 | | | 96,952,959 | | | 96,827,342 | | | 85,209,378 | |
| Average net assets for the period | $ | 1,323,778 | | | $ | 1,344,266 | | | $ | 1,261,338 | | | $ | 1,168,043 | | | $ | 1,154,615 | |
| Ratio to average net assets: | | | | | | | | | |
| Net investment income | 12.00 | % | | 8.82 | % | | 9.32 | % | | 10.05 | % | | 10.15 | % |
| Total expenses, before waivers/reimbursements | 16.54 | % | | 13.35 | % | | 13.11 | % | | 14.56 | % | | 14.87 | % |
| Total expenses, net of waivers/reimbursements | 16.23 | % | | 13.01 | % | | 12.05 | % | | 13.39 | % | | 13.80 | % |
| Average debt outstanding—Holdings Credit Facility | $ | 577,759 | | | $ | 581,367 | | | $ | 478,016 | | | $ | 526,645 | | | $ | 598,129 | |
| Average debt outstanding—Unsecured Notes (5) | 438,473 | | | 526,829 | | | 516,611 | | | 453,250 | | | 414,949 | |
| Average debt outstanding—Convertible Notes (6) | 320,494 | | | 228,806 | | | 201,250 | | | 201,250 | | | 234,332 | |
| Average debt outstanding—SBA-guaranteed debentures | 300,000 | | | 300,000 | | | 300,000 | | | 285,852 | | | 179,408 | |
| Average debt outstanding—DB Credit Facility | 186,422 | | | 209,898 | | | 209,307 | | | 233,649 | | | 113,967 | |
| Average debt outstanding—NMFC Credit Facility(7) | 103,244 | | | 133,053 | | | 132,685 | | | 155,497 | | | 105,533 | |
| Average debt outstanding—NMNLC Credit Facility II(8) | 2,506 | | | 7,195 | | | 3,501 | | | — | | | — | |
| Average debt outstanding—NMNLC Credit Facility(9) | — | | | — | | | — | | | — | | | 1,471 | |
| Asset coverage ratio(10) | 187.54 | % | | 177.42 | % | | 181.21 | % | | 180.68 | % | | 173.98 | % |
| Portfolio turnover | 8.87 | % | | 18.01 | % | | 35.33 | % | | 15.43 | % | | 11.58 | % |
(1)Per share data is based on weighted average shares outstanding for the respective period (except for distributions declared to stockholders which is based on actual rate per share).
(2)Includes the effect of common stock issuances per share, which for the years ended December 31, 2023, December 31, 2022, December 31, 2021, December 31, 2020 and December 31, 2019 were $0.00, $0.01, $(0.01), $0.00 and $0.08, respectively.
(3)Total return is calculated assuming a purchase of common stock at the opening of the first day of the year and a sale on the closing of the last business day of the period. Dividends and distributions, if any, are assumed for purposes of this calculation, to be reinvested at prices obtained under the Company's dividend reinvestment plan. Total return does not reflect sales load.
(4)Total return is calculated assuming a purchase at net asset value on the opening of the first day of the year and a sale at net asset value on the last day of the period. Dividends and distributions, if any, are assumed for purposes of this calculation, to be reinvested at the net asset value on the last day of the respective quarter. Total return does not reflect sales load.
(5)For the year ended December 31, 2023, average debt outstanding includes the 2018A Unsecured Notes for the period from January 1, 2023 to January 30, 2023 (repayment of the 2018A Unsecured Notes), the 2018B Unsecured Notes for the period from January 1, 2023 to June 28, 2023 (repayment of the 2018B Unsecured Notes) and the 8.250% Unsecured Notes for the period from November 13, 2023 (issuance of the 8.250% Unsecured Notes) to December 31, 2023. For the year ended December 31, 2022, average debt outstanding includes the 2017A Unsecured Notes for the period from January 1, 2022 to July 14, 2022 (repayment of the 2017A Unsecured Notes).
(6)For the year ended December 31, 2023, average debt outstanding includes the 2018 Convertible Notes for the period from January 1, 2023 to August 15, 2023 (repayment of the 2018 Convertible Notes). For the year ended December 31, 2022, average debt outstanding includes the 2022 Convertible Notes for the period from November 2, 2022 (issuance of the 2022 Convertible Notes) to December 31, 2022.
(7)Under the NMFC Credit Facility, the Company may borrow in U.S. dollars or certain other permitted currencies. As of December 31, 2023, the Company had borrowings denominated in GBP of £22,850 and borrowings denominated in EUR of €700 that has been converted to U.S. dollars. As of December 31, 2022, the Company had borrowings denominated in GBP of £22,850 and borrowings denominated in EUR of €700 that has been converted to U.S. dollars. As of December 31, 2021, the Company had borrowings denominated in GBP of £16,400 that has been converted to U.S. dollars.
(8)For the year ended December 31, 2021, average debt outstanding represents the period from February 26, 2021 (commencement of the NMNLC Credit Facility II) to December 31, 2021.
(9)For the year ended December 31, 2020, average debt outstanding represents the period from January 1, 2020 to September 23, 2020 (maturity of the NMNLC Credit Facility).
(10)On November 5, 2014, the Company received exemptive relief from the SEC allowing the Company to modify the asset coverage requirement to exclude the SBA-guaranteed debentures from this calculation.
Senior Securities
Information about our senior securities as of December 31, 2023, 2022, 2021, 2020, 2019, 2018, 2017, 2016, 2015 and 2014 are shown in the following table
| | | | | | | | | | | | | | | | | | | | | | | | | | |
| Class and Year (1) | | Total Amount Outstanding Exclusive of Treasury Securities (2) | | Asset Coverage Per Unit (3) | | Involuntary Liquidating Preference Per Unit (4) | | Average Market Value Per Unit (5) |
| December 31, 2023 | | | | | | | | |
| Holdings Credit Facility | | $ | 515.1 | | | $ | 1,875 | | | — | | | N/A |
| | | | | | | | |
Unsecured Notes (not including the 8.250% Unsecured Notes) | | 391.5 | | 1,875 | | | — | | | N/A |
| 2022 Convertible Notes | | 260.0 | | 1,875 | | | — | | | N/A |
| DB Credit Facility | | 186.4 | | 1,875 | | | — | | | N/A |
| 8.250% Unsecured Notes | | 115.0 | | 1,875 | | | — | | | $ | 25.88 | |
| NMFC Credit Facility(6) | | 36.8 | | 1,875 | | | — | | | N/A |
| NMNLC Credit Facility II | | 2.9 | | 1,875 | | | — | | | N/A |
| December 31, 2022 | | | | | | | | |
| Holdings Credit Facility | | 619.0 | | | 1,774 | | | — | | | N/A |
| 2018 Convertible Notes | | 116.8 | | 1,774 | | | — | | | N/A |
| 2022 Convertible Notes | | 200.0 | | 1,774 | | | — | | | N/A |
| Unsecured Notes | | 531.5 | | 1,774 | | | — | | | N/A |
| NMFC Credit Facility(6) | | 40.4 | | 1,774 | | | — | | | N/A |
| DB Credit Facility | | 186.4 | | 1,774 | | | — | | | N/A |
| NMNLC Credit Facility II | | 3.8 | | 1,774 | | | — | | | N/A |
| December 31, 2021 | | | | | | | | |
| Holdings Credit Facility | | 545.3 | | | 1,812 | | | — | | | N/A |
| 2018 Convertible Notes | | 201.2 | | 1,812 | | | — | | | N/A |
| Unsecured Notes | | 511.5 | | 1,812 | | | — | | | N/A |
| | | | | | | | |
| NMFC Credit Facility(6) | | 127.2 | | 1,812 | | | — | | | N/A |
| DB Credit Facility | | 226.3 | | 1,812 | | | — | | | N/A |
| NMNLC Credit Facility II | | 15.2 | | 1,812 | | | — | | | N/A |
| December 31, 2020 | | | | | | | | |
| Holdings Credit Facility | | 450.2 | | | 1,807 | | | — | | | N/A |
| 2018 Convertible Notes | | 201.2 | | | 1,807 | | | — | | | N/A |
Unsecured Notes (not including the 5.75% Unsecured Notes) | | 401.5 | | | 1,807 | | | — | | | N/A |
| 5.75% Unsecured Notes | | 51.8 | | | 1,807 | | | — | | | $ | 24.50 | |
| NMFC Credit Facility | | 165.5 | | | 1,807 | | | — | | | N/A |
| DB Credit Facility | | 244.0 | | | 1,807 | | | — | | | N/A |
| December 31, 2019 | | | | | | | | |
| Holdings Credit Facility | | 661.6 | | | 1,740 | | | — | | | N/A |
| 2018 Convertible Notes | | 201.2 | | | 1,740 | | | — | | | N/A |
Unsecured Notes (not including the 5.75% Unsecured Notes) | | 401.5 | | | 1,740 | | | — | | | N/A |
| 5.75% Unsecured Notes | | 51.8 | | | 1,740 | | | — | | | $ | 25.60 | |
| NMFC Credit Facility | | 188.5 | | | 1,740 | | | — | | | N/A |
| DB Credit Facility | | 230.0 | | | 1,740 | | | — | | | N/A |
| | | | | | | | | | | | | | | | | | | | | | | | | | |
| December 31, 2018 | | | | | | | | |
| Holdings Credit Facility | | $ | 512.6 | | | $ | 1,814 | | | — | | | N/A |
| 2014 Convertible Notes | | 155.3 | | | 1,814 | | | — | | | N/A |
| 2018 Convertible Notes | | 115.0 | | | 1,814 | | | — | | | N/A |
Unsecured Notes (not including the 5.75% Unsecured Notes) | | 285.0 | | | 1,814 | | | — | | | N/A |
| 5.75% Unsecured Notes | | 51.8 | | | 1,814 | | | — | | | $ | 24.70 | |
| NMFC Credit Facility | | 60.0 | | | 1,814 | | | — | | | N/A |
| DB Credit Facility | | 57.0 | | | 1,814 | | | — | | | N/A |
| December 31, 2017 | | | | | | | | |
| Holdings Credit Facility | | 312.4 | | | 2,408 | | | — | | | N/A |
| 2014 Convertible Notes | | 155.3 | | | 2,408 | | | — | | | N/A |
| Unsecured Notes | | 145.0 | | | 2,408 | | | — | | | N/A |
| NMFC Credit Facility | | 122.5 | | | 2,408 | | | — | | | N/A |
| December 31, 2016 | | | | | | | | |
| Holdings Credit Facility | | 333.5 | | | 2,593 | | | — | | | N/A |
| 2014 Convertible Notes | | 155.3 | | | 2,593 | | | — | | | N/A |
| Unsecured Notes | | 90.0 | | | 2,593 | | | — | | | N/A |
| NMFC Credit Facility | | 10.0 | | | 2,593 | | | — | | | N/A |
| December 31, 2015 | | | | | | | | |
| Holdings Credit Facility | | 419.3 | | | 2,341 | | | — | | | N/A |
| 2014 Convertible Notes | | 115.0 | | | 2,341 | | | — | | | N/A |
| NMFC Credit Facility | | 90.0 | | | 2,341 | | | — | | | N/A |
| December 31, 2014 | | | | | | | | |
| Holdings Credit Facility | | 468.1 | | | 2,267 | | | — | | | N/A |
| 2014 Convertible Notes | | 115.0 | | | 2,267 | | | — | | | N/A |
| NMFC Credit Facility | | 50.0 | | | 2,267 | | | — | | | N/A |
| | | | | | | | |
| | | | | | | | |
| | | | | | | | |
| | | | | | | | |
| | | | | | | | |
| | | | | | | | |
| | | | | | | | |
| | | | | | | | |
| | | | | | | | |
(1)The company has excluded the SBA-guaranteed debentures from this table as a result of the SEC exemptive relief that permits the Company to exclude such debentures from the definition of senior securities in the 150.0% asset coverage ratio that are required to maintain under the 1940 Act. At December 31, 2023, December 31, 2022, December 31, 2021, December 31, 2020, December 31, 2019, December 31, 2018, December 31, 2017, December 31, 2016, December 31, 2015 and December 31, 2014, the Company had $300.0 million, $300.0 million, $300.0 million,$300.0 million, $225.0 million, $165.0 million, $150.0 million, $121.7 million, $117.7 million and $37.5 million, respectively, in SBA-guaranteed debentures outstanding. Total asset coverage per unit including the SBA-guaranteed debentures as of December 31, 2023, December 31, 2022, December 31, 2021, December 31, 2020, December 31, 2019, December 31, 2018, December 31, 2017, December 31, 2016, December 31, 2015 and December 31, 2014 is $1,730, $1,658, $1,686, $1,673, $1,655, $1,718, $2,169, $2,320, $2,128 and $2,196, respectively, and unchanged for the prior years.
(2)Total amount of each class of senior securities outstanding at the end of the period presented.
(3)Asset coverage per unit is the ratio of the carrying value of our total assets, less all liabilities excluding indebtedness represented by senior securities in this table, to the aggregate amount of senior securities representing indebtedness. Asset coverage per unit is expressed in terms of dollar amounts per $1,000 of indebtedness and is calculated on a consolidated basis.
(4)The amount to which such class of senior security would be entitled upon the voluntary liquidation of the issuer in preference to any security junior to it. The "—" in this column indicates that the SEC expressly does not require this information to be disclosed for certain types of senior securities.
(5)Not applicable for any of the senior securities (except the 5.75% Unsecured Notes and the 8.250% Unsecured Notes) as they were not registered for public trading. For the 5.75% Unsecured Notes, the amounts represent the average of the daily closing prices on the New York Stock Exchange, or NASDAQ, as applicable, for (a) the period from September 28, 2018 (date of listing) through December 31, 2018, with respect to the year ended December 31, 2018, (b) the entire 2019
fiscal year, with respect to the year ended December 31, 2019 (c) the entire 2020 fiscal year, with respect to the year ended December 31, 2020. On March 8, 2021, the 5.75% Unsecured Notes were redeemed. For the 8.250% Unsecured Notes, the amounts represent the average of the daily closing prices on NASDAQ from the period from November 24, 2023 through December 31, 2023 with respect to the year ended December 31, 2023.
(6)Under the NMFC Credit Facility, the Company may borrow in U.S. dollars or certain other permitted currencies. As of December 31, 2023, the Company had borrowings denominated in GBP of £22.9 million and in EUR of €0.7 million that have been converted to U.S. dollars. As of December 31, 2022, the Company had borrowings denominated in GBP of £22.9 million and in EUR of €0.7 million that has been converted to U.S. dollars. As of December 31, 2021, the Company had borrowing denominated in GBP of £16.4 million and in EUR of €0.0 million that has been converted to U.S. dollars.
Note 14. Recent Accounting Standards Updates
In March 2020, the Financial Accounting Standards Board (the "FASB") issued ASU 2020-04, Reference Rate Reform. The amendments in ASU 2020-04 provide optional expedients and exceptions for applying GAAP to contracts, hedging relationships, and other transactions affected by reference rate reform if certain criteria are met. The standard was effective as of March 12, 2020 through December 31, 2022. Management is currently evaluating the impact of the optional guidance on the Company's consolidated financial statements and disclosures. The Company did not utilize the optional expedients and exceptions provided by ASU 2020-04 during the year ended December 31, 2023. In December 2022, the FASB issued ASU No. 2022-06, Reference Rate Reform (Topic 848): Deferral of the Sunset Date of Topic 848, which deferred the sunset day of this guidance to December 31, 2024. The Company is currently evaluating the impact of this guidance on its consolidated financial statements.
In December 2020, the U.S. Securities and Exchange Commission (the “SEC”) adopted a rule providing a framework for fund valuation practices. Rule 2a-5 under the 1940 Act (“Rule 2a-5”) establishes requirements for determining fair value in good faith for purposes of the 1940 Act. Rule 2a-5 permits boards, subject to board oversight and certain other conditions, to designate certain parties to perform fair value determinations. Rule 2a-5 also defines when market quotations are “readily available” for purposes of the 1940 Act and the threshold for determining whether a fund must determine the fair value of a security. The SEC also adopted Rule 31a-4 under the 1940 Act (“Rule 31a-4”), which provides the recordkeeping requirements associated with fair value determinations. Finally, the SEC rescinded previously issued guidance on related issues, including the role of the board in determining fair value and the accounting and auditing of fund investments. Rule 2a-5 and Rule 31a-4 became effective on March 8, 2021, and had a compliance date of September 8, 2022. While the Company's board of directors has not elected to designate the Investment Adviser as the valuation designee, the Company has adopted certain revisions to its valuation policies and procedures in order comply with the applicable requirements of Rule 2a-5 and Rule 31a-4.
Note 15. Subsequent Events
On January 25, 2024, the Company caused notices to be issued to holders of the Company's 2019A Unsecured Notes regarding the exercise of the Company's option to repay all of the Company's $116,500 in aggregate principal amount of issued and outstanding 2019A Unsecured Notes, which was repaid on February 5, 2024.
On January 30, 2024, the Company's board of directors declared a first quarter 2024 distribution of $0.32 per share and a supplemental distribution related to fourth quarter earnings of $0.04 per share, each payable on March 29, 2024 to holders of record as of March 15, 2024.
On February 1, 2024, the Company issued $300,000 in aggregate principal amount of its 6.875% notes due 2029 (the "2029 Unsecured Notes") for net proceeds of $293,892 after deducting underwriting commissions of $3,000. Offering costs incurred were approximately $900. Interest on the 2029 Unsecured Notes will be paid semi-annually in arrears on February 1 and August 1 at a rate of 6.875% per year, beginning on August 1, 2024, to holders of record as of the close of business on January 15 or July 15 (whether or not a business day), as the case may be, immediately preceding the relevant interest payment date. The 2029 Unsecured Notes may be redeemed in whole or in part at the Company’s option at any time prior to January 1, 2029, at par plus a “make-whole” premium, and thereafter at par, plus accrued interest.
The terms "we", "us", "our" and the "Company" refers to New Mountain Finance Corporation and its consolidated subsidiaries.
Item 9. Changes in and Disagreements with Accountants on Accounting and Financial Disclosure
None.
Item 9A. Controls and Procedures
(a)Evaluation of Disclosure Controls and Procedures
As of December 31, 2023 (the end of the period covered by this Annual Report on Form 10-K), we, including our Chief Executive Officer and Chief Financial Officer, evaluated the effectiveness of the design and operation of our disclosure controls and procedures (as defined in Rule 13a-15(e) of the Exchange Act). Based on that evaluation, our management, including the Chief Executive Officer and Chief Financial Officer, concluded that our disclosure controls and procedures were effective and provided reasonable assurance that information required to be disclosed in our periodic SEC filings is recorded, processed, summarized and reported within the time periods specified in the SEC's rules and forms, and that such information is accumulated and communicated to our management, including our Chief Executive Officer and Chief Financial Officer, as appropriate, to allow timely decisions regarding required disclosure. However, in evaluating the disclosure controls and procedures, management recognized that any controls and procedures, no matter how well designed and operated, can provide only reasonable assurance of achieving the desired control objectives, and management necessarily was required to apply its judgment in evaluating the cost-benefit relationship of such possible controls and procedures.
(b)Report of Management on Internal Control Over Financial Reporting
Management is responsible for establishing and maintaining adequate internal control over financial reporting, and for performing an assessment of the effectiveness of internal control over financial reporting. Internal control over financial reporting is a process designed to provide reasonable assurance regarding the reliability of financial reporting and the preparation of financial statements for external purposes in accordance with generally accepted accounting principles. Our internal control over financial reporting includes those policies and procedures that (i) pertain to assets of the Company; (ii) provide reasonable assurance that transactions are recorded as necessary to permit preparation of financial statements in accordance with generally accepted accounting principles, and that receipts and expenditures of the Company are being made only in accordance with authorizations of our management and directors; and (iii) provide reasonable assurance regarding prevention or timely detection of unauthorized acquisition, use, or disposition of our assets that could have a material effect on the financial statements.
Management performed an assessment of the effectiveness of our internal control over financial reporting as of December 31, 2023 based upon the criteria in the 2013 Internal Control—Integrated Framework issued by the Committee of Sponsoring Organizations of the Treadway Commission. Based on management's assessment, management determined that our internal control over financial reporting was effective as of December 31, 2023.
(c)Attestation Report of the Registered Public Accounting Firm.
Our independent registered public accounting firm, Deloitte & Touche LLP, has issued an attestation report on New Mountain Finance Corporation's internal control over financial reporting, which is set forth on the following page.
(d)Changes in Internal Control Over Financial Reporting
Management has not identified any change in our internal control over financial reporting that occurred during our most recently completed fiscal quarter that have materially affected, or are reasonably likely to materially affect, our internal control over financial reporting.
| | | | | |
|
Deloitte & Touche LLP
30 Rockefeller Plaza
New York, NY 10112
USA
Tel: 212 492 4000
Fax: 212 489 1687
www.deloitte.com |
REPORT OF INDEPENDENT REGISTERED PUBLIC ACCOUNTING FIRM
To the shareholders and the Board of Directors of New Mountain Finance Corporation
Opinion on Internal Control over Financial Reporting
We have audited the internal control over financial reporting of New Mountain Finance Corporation and subsidiaries (the “Company”) as of December 31, 2023, based on criteria established in Internal Control — Integrated Framework (2013) issued by the Committee of Sponsoring Organizations of the Treadway Commission (COSO). In our opinion, the Company maintained, in all material respects, effective internal control over financial reporting as of December 31, 2023, based on criteria established in Internal Control — Integrated Framework (2013) issued by COSO.
We have also audited, in accordance with the standards of the Public Company Accounting Oversight Board (United States) (PCAOB), the consolidated financial statements as of and for the year ended December 31, 2023 of the Company and our report dated February 26, 2024, expressed an unqualified opinion on those consolidated financial statements.
Basis for Opinion
The Company’s management is responsible for maintaining effective internal control over financial reporting and for its assessment of the effectiveness of internal control over financial reporting, included in the accompanying Report of Management on Internal Control Over Financial Reporting. Our responsibility is to express an opinion on the Company’s internal control over financial reporting based on our audit. We are a public accounting firm registered with the PCAOB and are required to be independent with respect to the Company in accordance with the U.S. federal securities laws and the applicable rules and regulations of the Securities and Exchange Commission and the PCAOB.
We conducted our audit in accordance with the standards of the PCAOB. Those standards require that we plan and perform the audit to obtain reasonable assurance about whether effective internal control over financial reporting was maintained in all material respects. Our audit included obtaining an understanding of internal control over financial reporting, assessing the risk that a material weakness exists, testing and evaluating the design and operating effectiveness of internal control based on the assessed risk, and performing such other procedures as we considered necessary in the circumstances. We believe that our audit provides a reasonable basis for our opinion.
Definition and Limitations of Internal Control over Financial Reporting
A company’s internal control over financial reporting is a process designed to provide reasonable assurance regarding the reliability of financial reporting and the preparation of financial statements for external purposes in accordance with generally accepted accounting principles. A company’s internal control over financial reporting includes those policies and procedures that (1) pertain to the maintenance of records that, in reasonable detail, accurately and fairly reflect the transactions and dispositions of the assets of the company; (2) provide reasonable assurance that transactions are recorded as necessary to permit preparation of financial statements in accordance with generally accepted accounting principles, and that receipts and expenditures of the company are being made only in accordance with authorizations of management and directors of the company; and (3) provide reasonable assurance regarding prevention or timely detection of unauthorized acquisition, use, or disposition of the company’s assets that could have a material effect on the financial statements.
Because of its inherent limitations, internal control over financial reporting may not prevent or detect misstatements. Also, projections of any evaluation of effectiveness to future periods are subject to the risk that controls may become inadequate because of changes in conditions, or that the degree of compliance with the policies or procedures may deteriorate.
/s/ DELOITTE & TOUCHE LLP
February 26, 2024
Item 9B. Other Information
(a)None.
(b)For the fiscal quarter ended December 31, 2023, neither the Company nor any director or officer has entered into or terminated any (i) contract, instruction or written plan for the purchase or sale of securities intended to satisfy the affirmative defense conditions of Rule 10b5-1(c) under the Exchange Act or (ii) any non-Rule 10b5-1 trading arrangement.
We have adopted insider trading policies and procedures governing the purchase, sale, and disposition of the our securities by our officers and directors that are reasonably designed to promote compliance with insider trading laws, rules and regulations.
Item 9C. Disclosure Regarding Foreign Jurisdictions that Prevent Inspections
Not Applicable.
The terms "we", "us", "our" and the "Company" refers to New Mountain Finance Corporation and its consolidated subsidiaries.
PART III
We will file a definitive Proxy Statement for our 2024 Annual Meeting of Stockholders with the U.S. Securities and Exchange Commission, pursuant to Regulation 14A, not later than 120 days after the end of our fiscal year. Accordingly, certain information required by Part III has been omitted under General Instruction G(3) to Form 10-K. Only those sections of our definitive Proxy Statement that specifically address the items set forth herein are incorporated by reference.
Item 10. Directors, Executive Officers and Corporate Governance
The information required by Item 10 is hereby incorporated by reference from the definitive Proxy Statement relating to our 2024 Annual Meeting of Stockholders, to be filed with the U.S. Securities and Exchange Commission within 120 days following the end of our fiscal year.
Item 11. Executive Compensation
The information required by Item 11 is hereby incorporated by reference from the definitive Proxy Statement relating to our 2024 Annual Meeting of Stockholders, to be filed with the U.S. Securities and Exchange Commission within 120 days following the end of our fiscal year.
Item 12. Security Ownership of Certain Beneficial Owners and Management and Related Stockholder Matters
The information required by Item 12 is hereby incorporated by reference from the definitive Proxy Statement relating to our 2024 Annual Meeting of Stockholders, to be filed with the U.S. Securities and Exchange Commission within 120 days following the end of our fiscal year.
Item 13. Certain Relationships and Related Transactions, and Director Independence
The information required by Item 13 is hereby incorporated by reference from the definitive Proxy Statement relating to our 2024 Annual Meeting of Stockholders, to be filed with the U.S. Securities and Exchange Commission within 120 days following the end of our fiscal year.
Item 14. Principal Accountant Fees and Services
The information required by Item 14 is hereby incorporated by reference from the definitive Proxy Statement relating to our 2024 Annual Meeting of Stockholders, to be filed with the U.S. Securities and Exchange Commission within 120 days following the end of our fiscal year.
PART IV
Item 15. Exhibits and Financial Statement Schedules
(a)Documents Filed as Part of this Report
The following financial statements are set forth in Item 8: | | | | | |
| New Mountain Finance Corporation | |
| |
| |
| |
| |
| |
| |
| |
(b)Exhibits
The following exhibits are filed as part of this Annual Report on Form 10-K or hereby incorporated by reference to exhibits previously filed with the United States Securities and Exchange Commission:
| | | | | | | | |
| Exhibit Number | | Description |
| 3.1(a) | | |
| 3.1(b) | | |
| 3.1(c) | | |
| 3.2 | | | |
| 4.1 | | | |
| 4.2 | | | |
| 4.3 | | | |
| 4.4 | | | |
| 4.5 | | | |
| 4.6 | | | |
| 4.7 | | | |
| 4.8 | | | |
| 4.9 | | | |
| 4.10 | | | |
| 4.11 | | | |
| 10.1 | | | |
| 10.2 | | | |
| 10.3 | | | |
| 10.4 | | | |
| 10.5 | | | |
| 10.6 | | | |
| 10.7 | | | |
| 10.8 | | | |
| 10.9 | | | |
| 10.10 | | | |
| 10.11 | | | Third Amended and Restated Loan and Security Agreement, dated as of October 24, 2017, by and among New Mountain Finance Corporation, as the collateral manager, New Mountain Finance Holdings, L.L.C., as the borrower, Wells Fargo Bank, National Association, as the administrative agent, the lenders party thereto and Wells Fargo Bank, National Association, as the collateral custodian(15) |
| 10.12 | | | First Amendment to Loan and Security Agreement, dated as of March 30, 2018, by and among New Mountain Finance Corporation, as the collateral manager, New Mountain Finance Holdings, L.L.C., as the borrower, Wells Fargo Bank, National Association, as the administrative agent, the lenders party thereto and Wells Fargo Bank, National Association, as the collateral custodian (18) |
| | | | | | | | |
| Exhibit Number | | Description |
| 10.13 | | | Third Amended and Restated Loan and Security Agreement, conformed through Amendment No. 2, dated as of November 19, 2018, by and among New Mountain Finance Corporation, as the collateral manager, New Mountain Finance Holdings, L.L.C., as the borrower, Wells Fargo Bank, National Association, as the administrative agent, the lenders party thereto and Wells Fargo Bank, National Association, as the collateral custodian(23) |
| 10.14 | | | Form of Joinder Supplement, dated as of December 13, 2018, by and among TIAA, FSB, New Mountain Finance Holdings, L.L.C., as the borrower, and Wells Fargo Bank, National Association, as the administrative agent(25) |
| 10.15 | | | |
| 10.16 | | | Form of Joinder Supplement, dated as of January 25, 2019, by and among Sumitomo Mitsui Trust Bank, Limited, New York, New Mountain Finance Holdings, L.L.C., as the borrower, and Wells Fargo Bank, National Association, as the administrative agent(25) |
| 10.17 | | | Form of Third Amended and Restated to Loan and Security Agreement, conformed through the Third Amendment to Loan and Security Agreement dated as of May 7, 2019, by and among New Mountain Finance Corporation, as the collateral manager, New Mountain Finance Holdings, L.L.C., as the borrower, Wells Fargo Bank, National Association, as the administrative agent, the lenders party thereto and Wells Fargo Bank, National Association, as the collateral custodian(30) |
| 10.18 | | | |
| 10.19 | | | Incremental Commitment Supplement, dated as of September 6, 2019, to the Third Amended and Restated Loan and Security Agreement, dated October 24, 2017, as amended, by and among New Mountain Finance Corporation, as the collateral manager, New Mountain Finance Holdings, L.L.C., as the borrower, Wells Fargo Bank, National Association, as the administrative agent, the lenders party thereto and Wells Fargo Bank, National Association, as the collateral custodian(33) |
| 10.20 | | | |
| 10.21 | | | |
| 10.22 | | | |
| 10.23 | | | Form of Fourth Amendment to Loan and Security Agreement, dated as of September 30, 2020, by and among New Mountain Finance Corporation, as the collateral manager, New Mountain Finance Holdings, L.L.C., as the borrower, Wells Fargo Bank, National Association, as the administrative agent, the lenders party thereto and Wells Fargo Bank, National Association, as the collateral custodian(37) |
| 10.24 | | | |
| 10.25 | | | |
| 10.26 | | | |
| 10.27 | | | |
| 10.28 | | | |
| 10.29 | | | |
| | | | | | | | |
| Exhibit Number | | Description |
| 10.30 | | | |
| 10.31 | | | |
| 10.32 | | | |
| 10.33 | | | |
| 10.34 | | | |
| 10.35 | | | |
| 10.36 | | | |
| 10.37 | | | |
| 10.38 | | | |
| 10.39 | | | |
| 10.40 | | | |
| 10.41 | | | |
| 10.42 | | | |
| 10.43 | | | Form of Loan Financing and Servicing Agreement, dated as of December 14, 2018, by and among New Mountain Finance DB, L.L.C., New Mountain Finance Corporation, as equityholder and servicer, the lenders from time to time party thereto, Deutsche Bank, as the facility agent, the other agents from time to time party thereto and U.S. Bank National Association, as collateral agent and collateral custodian(24) |
| 10.44 | | | |
| 10.45 | | | Form of First Amended and Restated Loan Finance and Servicing Agreement, conformed through Amendment No. 1, dated on March 18, 2019, by and among New Mountain Finance DB, L.L.C., New Mountain Finance Corporation, as equityholder and servicer, the lenders from time to time party thereto, Deutsche Bank, as the facility agent, the other agents from time to time party thereto and U.S. Bank National Association, as collateral agent and collateral custodian(28) |
| 10.46 | | | Form of Amendment No. 2 to Loan Financing and Servicing Agreement, dated as of June 28, 2019, by and among New Mountain Finance Corporation, as the equityholder, New Mountain Finance DB, L.L.C., as the borrower, U.S. Bank National Association, as the collateral Agent and collateral custodian, and Deutsche Bank AG, New York Branch, as the facility agent, agent and a lender(31) |
| 10.47 | | | Form of Amendment No. 3 to Loan Financing and Servicing Agreement, dated as of August 12, 2019, by and among New Mountain Finance Corporation, as the equityholder, New Mountain Finance DB, L.L.C., as the borrower, U.S. Bank National Association, as the collateral Agent and collateral custodian, and Deutsche Bank AG, New York Branch, as the facility agent, an agent and a lender, and the other agents and lenders party thereto(32) |
| | | | | | | | |
| Exhibit Number | | Description |
| 10.48 | | | |
| 10.49 | | | Form of Amendment No. 5 to Loan Financing and Servicing Agreement, dated as of December 12, 2019, by and among New Mountain Finance Corporation, as the equityholder, New Mountain Finance DB, L.L.C., as the borrower, U.S. Bank National Association, as the collateral Agent and collateral custodian, and Deutsche Bank AG, New York Branch, as the facility agent, an agent and a lender, and the other agents and lenders party thereto(34) |
| 10.50 | | | |
| 10.51 | | | |
| 10.52 | | | Form of Amendment No. 6 to Loan Financing and Servicing Agreement, dated as of March 25, 2021, by and among New Mountain Finance Corporation, as the equityholder, New Mountain Finance DB, L.L.C., as the borrower, U.S. Bank National Association, as the collateral Agent and collateral custodian, and Deutsche Bank AG, New York Branch, as the facility agent, an agent and a lender, and the other agents and lenders party thereto(39) |
| 10.53 | | | Form of Fifth Amendment to Loan and Security Agreement, dated as of April 20, 2021, by and among New Mountain Finance Corporation, as the collateral manager, New Mountain Finance Holdings, L.L.C., as the borrower, Wells Fargo Bank, National Association, as the administrative agent, the lenders party thereto and Wells Fargo Bank, National Association, as the collateral custodian(40) |
| 10.54 | | | |
| 10.55 | | | |
| 10.56 | | | |
| 10.57 | | | |
| 10.58 | | | Equity Distribution Agreement, dated November 3, 2021, by among New Mountain Finance Corporation, New Mountain Finance Advisers BDC, L.L.C., and New Mountain Finance Administration, L.L.C., on the one hand, and B. Riley Securities, Inc. and Raymond James, Inc. & Associates, on the other hand(45) |
| 10.59 | | | |
| 10.60 | | | |
| 10.61 | | | |
| 10.62 | | | Seventh Amendment to Loan and Security Agreement, dated as of April 28, 2023, by and among New Mountain Finance Corporation, as the collateral manager, New Mountain Finance Holdings, L.L.C., as the borrower, Wells Fargo Bank, National Association, as the administrative agent, the lenders party thereto and Wells Fargo Bank, National Association, as the collateral custodian(50) |
| 10.63 | | | First Amendment to Loan and Security Agreement, dated as of April 28, 2023, by and among New Mountain Finance Corporation, as the collateral manager, NMFC Senior Loan Program IV LLC as the borrower, NMFC Senior Loan Program I LLC and NMFC Senior Loan Program II as guarantor subsidiaries, Wells Fargo Bank, National Association, as the administrative agent, the lender party thereto and Wells Fargo Bank, National Association, as the collateral custodian(50) |
| 10.64 | | | |
| | | | | | | | |
| Exhibit Number | | Description |
| 10.65 | | | |
| 10.66 | | | |
| 10.67 | | | Amendment No. 7 to Loan Financing and Servicing Agreement, dated as of June 29, 2023, by and among New Mountain Finance Corporation, as the equityholder, New Mountain Finance DB, L.L.C., as the borrower, U.S. Bank Trust Company, National Association, as the collateral agent, U.S. Bank National Association, as the collateral custodian, and Deutsche Bank AG, New York Branch, as the facility agent, an agent and a lender, and the other agents and lenders party thereto(52) |
| 10.68 | | | |
| 10.69 | | | |
| 10.70 | | | Form of Eighth Amendment to Loan and Security Agreement, dated as of October 26, 2023, by and among New Mountain Finance Corporation, as the collateral manager, New Mountain Finance Holdings, L.L.C., as the borrower, Wells Fargo Bank, National Association, as the administrative agent, the lenders party thereto and Wells Fargo Bank, National Association, as the collateral custodian(54) |
| 10.71 | | | Amendment No. 8 to the Loan Financing and Servicing Agreement, dated as of December 14, 2018, by and among New Mountain Finance Corporation, as the equityholder, New Mountain Finance DB, L.L.C. as the borrower, Deutsche Bank AG, New York Branch as the facility agent, Lender and other agent from time to time party thereto and U.S. Bank National Association, as collateral agent and collateral custodian(54) |
| 10.72 | | | |
| 10.73 | | | Ninth Amended and Restated Loan and Security Agreement, dated as of February 2, 2024, by and among New Mountain Finance Corporation, as the collateral manager, New Mountain Finance Holdings, L.L.C., as the borrower, Wells Fargo Bank, National Association, as the administrative agent, the lenders party thereto and Wells Fargo Bank, National Association, as the collateral custodian* |
| 10.74 | | | Second Amendment to Loan and Security Agreement, dated as of February 14, 2024, by and among New Mountain Finance Corporation, as the collateral manager, NMFC Senior Loan Program IV LLC as the borrower, NMFC Senior Loan Program I LLC and NMFC Senior Loan Program II as guarantor subsidiaries, Wells Fargo Bank,National Association, as the administrative agent, the lender party thereto and Wells Fargo Bank, National Association, as the collateral custodian* |
| 14.1 | | | |
| 19.1 | | | |
| 21.1 | | | Subsidiaries of New Mountain Finance Corporation: |
| | | New Mountain Finance Holdings, L.L.C. (Delaware) |
| | | NMF Ancora Holdings, Inc. (Delaware) |
| | NMF QID NGL Holdings, Inc. (Delaware) |
| | | NMF YP Holdings, Inc. (Delaware) |
| | NMF Permian Holdings L.L.C. (Delaware) |
| | NMF HB, Inc. (Delaware) |
| | NMF TRM, L.L.C. (Delaware) |
| | NMF Pioneer, Inc. (Delaware) |
| | NMF OEC, Inc. (Delaware) |
| | New Mountain Finance DB, L.L.C. (Delaware) |
| | | New Mountain Finance Servicing, L.L.C. (Delaware) |
| | | New Mountain Finance SBIC G.P., L.L.C. (Delaware) |
| | New Mountain Finance SBIC II G.P., L.L.C. (Delaware) |
| | | New Mountain Finance SBIC, L.P. (Delaware) |
| | New Mountain Finance SBIC II, L.P. (Delaware) |
| | New Mountain Net Lease Corporation (Maryland) |
| | | | | | | | |
| Exhibit Number | | Description |
| 23.1 | | | |
| 31.1 | | | |
| 31.2 | | | |
| 32.1 | | | |
| 32.2 | | | |
| 97.1 | | | |
(1)Previously filed in connection with New Mountain Finance Corporation's registration statement on Form N-2 Pre-Effective Amendment No. 3 (File Nos. 333-168280 and 333-172503) filed on May 9, 2011.
(2)Previously filed in connection with New Mountain Finance Corporation's quarterly report on Form 10-Q filed on August 11, 2011.
(3)Previously filed in connection with New Mountain Finance Corporation and New Mountain Finance AIV Holdings Corporation report on Form 8-K filed on August 25, 2011.
(4)Previously filed in connection with New Mountain Finance Corporation's quarterly report on Form 10-Q filed on November 14, 2011.
(5)Previously filed in connection with New Mountain Finance Corporation's registration statement on Form N-2 Post-Effective Amendment No. 2 (File Nos. 333-189706 and 333-189707) filed on April 11, 2014.
(6)Previously filed in connection with New Mountain Finance Corporation's current report on Form 8-K filed on May 8, 2014.
(7)Previously filed in connection with New Mountain Finance Corporation's current report on Form 8-K filed on June 10, 2014.
(8)Previously filed in connection with New Mountain Finance Corporation's current report on Form 8-K filed on January 5, 2015.
(9)Previously filed in connection with New Mountain Finance Corporation's quarterly report on Form 10-Q filed on May 5, 2015.
(10)Previously filed in connection with New Mountain Finance Corporation's current report on Form 8-K filed on June 30, 2015.
(11)Previously filed in connection with New Mountain Finance Corporation's current report on Form 8-K filed on March 29, 2016.
(12)Previously filed in connection with New Mountain Finance Corporation's quarterly report on Form 10-Q filed on May 4, 2016.
(13)Previously filed in connection with New Mountain Finance Corporation's current report on Form 8-K filed on October 3, 2016.
(14)Previously filed in connection with New Mountain Finance Corporation's current report on Form 8-K filed on July 3, 2017.
(15)Previously filed in connection with New Mountain Finance Corporation’s current report on Form 8-K filed on October 31, 2017.
(16)Previously filed in connection with New Mountain Finance Corporation's current report on Form 8-K filed on February 5, 2018.
(17)Previously filed in connection with New Mountain Finance Corporation’s annual report on Form 10-K filed on February 28, 2018.
(18)Previously filed in connection with New Mountain Finance Corporation’s current report on Form 8-K filed on April 5, 2018.
(19)Previously filed in connection with New Mountain Finance Corporation's quarterly report on Form 10-Q filed on May 7, 2018.
(20)Previously filed in connection with New Mountain Finance Corporation’s current report on Form 8-K filed on July 11, 2018.
(21)Previously filed in connection with New Mountain Finance Corporation's registration statement on Form N-2 Post-Effective Amendment No. 3 (File No. 333-218040) filed on August 20, 2018.
(22)Previously filed in connection with New Mountain Finance Corporation's registration statement on Form N-2 Post-Effective Amendment No. 4 (File No. 333-218040) filed on September 25, 2018.
(23)Previously filed in connection with New Mountain Finance Corporation's current report on Form 8-K filed on November 27, 2018.
(24)Previously filed in connection with New Mountain Finance Corporation's current report on Form 8-K filed on December 19, 2018.
(25)Previously filed in connection with New Mountain Finance Corporation's registration statement on Form N-2 Post-Effective Amendment No. 5 (File No. 333-218040) filed on February 13, 2019.
(26)Previously filed in connection with New Mountain Finance Corporation's annual report on Form 10-K filed on February 27, 2019.
(27)Previously filed in connection with New Mountain Finance Corporation's current report on Form 8-K filed on April 3, 2019.
(28)Previously filed in connection with New Mountain Finance Corporation's registration statement on Form N-2 Pre-Effective Amendment No. 1 (File No. 333-230326) filed on April 26, 2019.
(29)Previously filed in connection with New Mountain Finance Corporation's current report on Form 8-K filed on May 3, 2019.
(30)Previously filed in connection with New Mountain Finance Corporation's current report on Form 8-K filed on May 9, 2019.
(31)Previously filed in connection with New Mountain Finance Corporation's current report on Form 8-K filed on July 3, 2019.
(32)Previously filed in connection with New Mountain Finance Corporation's current report on Form 8-K filed on August 16, 2019.
(33)Previously filed in connection with New Mountain Finance Corporation's registration statement on Form N-2 Post-Effective Amendment No. 3 (File No. 333-230326) filed on October 25, 2019.
(34)Previously filed in connection with New Mountain Finance Corporation's current report on Form 8-K filed on December 16, 2019.
(35)Previously filed in connection with New Mountain Finance Corporation's quarterly report on Form 10-Q filed on May 6, 2020.
(36)Previously filed in connection with New Mountain Finance Corporation's current report on Form 8-K filed on September 30, 2020.
(37)Previously filed in connection with New Mountain Finance Corporation's quarterly report on Form 10-Q filed on November 4, 2020.
(38)Previously filed in connection with New Mountain Finance Corporation's current report on Form 8-K filed on February 1, 2021.
(39)Previously filed in connection with New Mountain Finance Corporation's current report on Form 8-K filed on March 31, 2021.
(40)Previously filed in connection with New Mountain Finance Corporation's current report on Form 8-K filed on April 26, 2021.
(41)Previously filed in connection with New Mountain Finance Corporation's current report on Form 8-K filed on May 5, 2021.
(42)Previously filed in connection with New Mountain Finance Corporation's current report on Form 8-K filed on June 9, 2021.
(43)Previously filed in connection with New Mountain Finance Corporation's current report on Form 8-K filed on November 3, 2021.
(44)Previously filed in connection with New Mountain Finance Corporation's current report on Form 8-K filed on December 23, 2021.
(45)Previously filed in connection with new Mountain Finance Corporation's current report on Form 8-K filed on November 4, 2021.
(46)Previously filed in connection with New Mountain Finance Corporation's current report on Form 8-K filed on June 17, 2022.
(47)Previously filed in connection with New Mountain Finance Corporation's current report on Form 8-K filed on October 28, 2022.
(48)Previously filed in connection with New Mountain Finance Corporation's current report on Form 8-K filed on November 2, 2022.
(49)Previously filed in connection with New Mountain Finance Corporation's current report on Form 8-K filed on March 10, 2023.
(50)Previously filed in connection with New Mountain Finance Corporation's quarterly report on Form 10-Q filed on May 8, 2023.
(51)Previously filed in connection with New Mountain Finance Corporation's current report on Form 8-K filed on May 19, 2023.
(52)Previously filed in connection with New Mountain Finance Corporation’s quarterly report on Form 10-Q filed on August 2, 2023.
(53)Previously filed in connection with New Mountain Finance Corporation's current report on Form 8-K filed on August 9, 2023.
(54)Previously filed in connection with New Mountain Finance Corporation’s quarterly report on Form 10-Q filed on November 2, 2023.
(55)Previously filed in connection with New Mountain Finance Corporation’s current report on Form 8-K filed on November 13, 2023.
(56)Previously filed in connection with New Mountain Finance Corporation's current report on Form 8-K filed on February 1, 2024.
* Filed herewith.
Financial Statement Schedules
No financial statement schedules are filed herewith because (1) such schedules are not required or (2) the information has been presented in the aforementioned financial statements.
Item 16. Form 10-K Summary
None.
SIGNATURES
Pursuant to the requirements of Section 13 or 15(d) of the Securities Exchange Act of 1934, the Registrant has duly caused this report to be signed on its behalf by the undersigned, thereunto duly authorized on February 26, 2024.
| | | | | | | | | | | |
| | NEW MOUNTAIN FINANCE CORPORATION |
| | By: | | /s/ JOHN R. KLINE |
| | | John R. Kline President, Chief Executive Officer (Principal Executive Officer) and Director |
Pursuant to the requirements of the Securities Exchange Act of 1934, this report has been signed below by the following persons on behalf of the Registrant and in the capacities and on the dates indicated. | | | | | | | | | | | | | | | | | | | | |
| SIGNATURE | | TITLE | | DATE |
| | | | | | | |
| By: | | /s/ JOHN R. KLINE | | President, Chief Executive Officer (Principal Executive Officer) and Director | | February 26, 2024 |
| | John R. Kline | | |
| | | | | | |
| By: | | /s/ KRIS CORBETT | | Chief Financial Officer and Treasurer (Principal Financial and Accounting Officer) | | February 26, 2024 |
| | Kris Corbett | | |
| | | | | | |
| By: | | /s/ STEVEN B. KLINSKY | | Chairman of the Board of Directors | | February 26, 2024 |
| | Steven B. Klinsky | | |
| | | | | | |
| By: | | /s/ ROBERT A. HAMWEE | | Vice Chairman of the Board of Directors | | February 26, 2024 |
| | Robert A. Hamwee | | | |
| | | | | | |
| By: | | /s/ ADAM B. WEINSTEIN | | Executive Vice President, Chief Administrative Officer and Director | | February 26, 2024 |
| | Adam B. Weinstein | | |
| | | | | | |
| By: | | /s/ ROME G. ARNOLD III | | Director | | February 26, 2024 |
| | Rome G. Arnold III | | |
| | | | | | |
| By: | | /s/ BARBARA DANIEL | | Director | | February 26, 2024 |
| | Barbara Daniel | | |
| | | | | | |
| By: | | /s/ DANIEL B. HEBERT | | Director | | February 26, 2024 |
| | Daniel B. Hebert | | |
| | | | | | |
| By: | | /s/ ALFRED F. HURLEY, JR. | | Director | | February 26, 2024 |
| | Alfred F. Hurley, Jr. | | |
| | | | | | |
| By: | | /s/ DAVID OGENS | | Director | | February 26, 2024 |
| | David Ogens | | |
| | | | | | |