Filed Pursuant to Rule 497
Registration Statement Nos. 333-180689 and 333-180690
This preliminary prospectus supplement relates to an effective registration statement under the Securities Act of 1933, as amended,
but the information in this preliminary prospectus supplement is not complete and may be changed. This preliminary prospectus supplement and the accompanying prospectus are not an offer to sell and are not soliciting an offer to buy these securities
in any jurisdiction where the offer and sale is not permitted.
Subject to Completion, Dated December 3, 2012
PRELIMINARY PROSPECTUS
SUPPLEMENT
(to Prospectus dated July 10, 2012)
3,000,000 Shares
New Mountain Finance Corporation
Common Stock
New Mountain Finance Corporation (“NMFC”) is a holding company with no direct operations of its own, and its only business and sole asset
is its ownership of common membership units of New Mountain Finance Holdings, L.L.C. (the “Operating Company”). The Operating Company is an externally managed business development company managed by New Mountain Finance Advisers BDC,
L.L.C. and is the operating company for NMFC’s business. NMFC and the Operating Company each have elected to be treated as a business development company under the Investment Company Act of 1940. The Operating Company’s investment
objective is to generate current income and capital appreciation through the sourcing and origination of debt securities at all levels of the capital structure, including first and second lien debt, notes, bonds and mezzanine securities. Prior to
this offering, NMFC owned approximately 56.1% of the common membership units of the Operating Company and New Mountain Finance AIV Holdings Corporation owned approximately 43.9% of the common membership units of the Operating Company.
We are offering for sale 3,000,000 shares of NMFC’s common stock. We have granted the underwriters a 30-day option to purchase up to
450,000 additional shares of NMFC’s common stock at the public offering price, less the underwriting discounts and commissions.
NMFC’s common stock is listed on the New York Stock Exchange under the symbol “NMFC”. On November 30, 2012, the last
reported sales price on the New York Stock Exchange for NMFC’s common stock was $15.18 per share.
An investment in
NMFC’s common stock is very risky and highly speculative. Shares of closed-end investment companies, including business development companies, frequently trade at a discount to their net asset value. In addition, the companies in which NMFC
invests, through the Operating Company, are subject to special risks. See “Risk Factors” beginning on page 19 of the accompanying prospectus to read about factors you should consider, including the risk of leverage, before investing
in NMFC’s common stock.
This prospectus supplement and the accompanying prospectus contain important information about NMFC and
the Operating Company that a prospective investor should know before investing in NMFC’s common stock. Please read this prospectus supplement and the accompanying prospectus before investing and keep it for future reference. NMFC and the
Operating Company file annual, quarterly and current reports, proxy statements and other information with the Securities and Exchange Commission (http://www.sec.gov), which is available free of charge by contacting NMFC by mail at 787 Seventh
Avenue, 48th Floor, New York, New York 10019 or on our website at http://www.newmountainfinance.com. Information contained on our website is not incorporated by reference into this prospectus supplement and the accompanying prospectus,
and you should not consider that information to be part of this prospectus supplement and the accompanying prospectus.
Neither the Securities
and Exchange Commission nor any state securities commission has approved or disapproved of these securities, or determined if this prospectus supplement or the accompanying prospectus is truthful or complete. Any representation to the contrary is a
criminal offense.
|
|
|
|
|
|
|
|
|
| |
|
Per Share |
|
|
Total(2) |
|
| Public Offering Price |
|
$ |
|
|
|
$ |
|
|
| Sales Load (Underwriting Discounts and Commissions)(1) |
|
$ |
|
|
|
$ |
|
|
| Proceeds to us (before expenses) |
|
$ |
|
|
|
$ |
|
|
| (1) |
New Mountain Finance Advisers BDC, L.L.C. (the “Investment Adviser”) has agreed to bear an additional
$ or $ per share, of sales load in connection with this offering, which is not reflected in the
above table. All other expenses of the offering, including the sales load not being borne by the Investment Adviser, will be borne by the Operating Company. The Operating Company will incur approximately $181,254 of estimated expenses, excluding the
sales load, in connection with this offering. Stockholders will indirectly bear such expenses, including the sales load not being borne by the Investment Adviser, through NMFC’s ownership of common membership units of the Operating Company.
|
| (2) |
To the extent that the underwriters sell more than 3,000,000 shares of NMFC’s common stock, the underwriters have the option to purchase up to an additional 450,000 shares
of NMFC’s common stock at the public offering price, less the sales load, within 30 days of the date of this prospectus supplement. If the underwriters exercise this option in full, the total public offering price, sales load and proceeds
to us will be $ , $ and $ ,
respectively. If the underwriters exercise their option to purchase additional shares of NMFC’s common stock, NMFC will use the proceeds from the exercise of this option to purchase additional common membership units of the Operating Company.
|
The underwriters expect to deliver the shares against payment in New York, New York on or
about , 2012.
Joint-Lead Bookrunners
|
|
|
| Goldman, Sachs & Co. |
|
Wells Fargo Securities |
Co-Lead Managers
|
|
|
| RBC Capital Markets |
|
Stifel Nicolaus Weisel |
Prospectus Supplement dated , 2012.
TABLE OF CONTENTS
PROSPECTUS SUPPLEMENT
PROSPECTUS
ABOUT THIS PROSPECTUS SUPPLEMENT
You should rely only on the information contained in this prospectus supplement and the accompanying prospectus. Neither we nor the underwriters
have authorized any other person to provide you with different information from that contained in this prospectus supplement or the accompanying prospectus. If anyone provides you with different or inconsistent information, you should not rely on
it. This prospectus supplement and the accompanying prospectus do not constitute an offer to sell, or a solicitation of an offer to buy, any shares of our common stock by any person in any jurisdiction where it is unlawful for that person to make
such an offer or solicitation or to any person in any jurisdiction to whom it is unlawful to make such an offer or solicitation. The information contained in this prospectus supplement and the accompanying prospectus is complete and accurate only as
of their respective dates, regardless of the time of their delivery or sale of our common stock. This prospectus supplement supersedes the accompanying prospectus to the extent it contains information different from or additional to the information
in that prospectus.
This document is in two parts. The first part is this prospectus supplement, which describes the terms of this
offering of common stock and also adds to and updates information contained in the accompanying prospectus. The second part is the accompanying prospectus, which gives more general information and disclosure. To the extent the information contained
in this prospectus supplement differs from the information contained in the accompanying prospectus, the information in this prospectus supplement shall control. Please carefully read this prospectus supplement and the accompanying prospectus
together with any exhibits and the additional information described under “Available Information” and in the “Summary” and “Risk Factors” sections before you make an investment decision.
PROSPECTUS SUPPLEMENT SUMMARY
This summary highlights some of the information in this prospectus supplement and the accompanying prospectus. It is not complete and may not
contain all of the information that you may want to consider. You should read carefully the more detailed information set forth under “Risk Factors” and the other information included in this prospectus supplement and the accompanying
prospectus.
In this prospectus supplement, unless the context otherwise requires, references to:
| |
Ÿ |
|
“NMFC” refers to New Mountain Finance Corporation, a Delaware corporation, which was incorporated on June 29, 2010 in preparation for the
initial public offering; |
| |
Ÿ |
|
“NMF SLF” refers to New Mountain Finance SPV Funding, L.L.C.; |
| |
Ÿ |
|
“Operating Company” refers to New Mountain Finance Holdings, L.L.C., a Delaware limited liability company, which is the operating company for
our business. References to the Operating Company include New Mountain Finance Holdings, L.L.C.’s wholly-owned subsidiary, NMF SLF, unless the context otherwise requires. References to the Operating Company exclude NMF SLF when referencing the
Operating Company’s common membership units, board of directors, and credit facility or leverage; |
| |
Ÿ |
|
“Guardian AIV” refers to New Mountain Guardian AIV, L.P.; |
| |
Ÿ |
|
“AIV Holdings” refers to New Mountain Finance AIV Holdings Corporation, a Delaware corporation which was incorporated on March 11, 2011, of
which Guardian AIV is the sole stockholder; |
| |
Ÿ |
|
“New Mountain Finance Entities”, “we”, “us” and “our” refer to NMFC, the Operating Company and AIV Holdings,
collectively; except for references to the registration statement of which this prospectus forms a part and the offering of securities thereunder, in which case references to “we”, “us” and “our” refer to NMFC and the
Operating Company only. |
| |
Ÿ |
|
“Investment Adviser” refers to New Mountain Finance Advisers BDC, L.L.C., the Operating Company’s investment adviser;
|
| |
Ÿ |
|
“Administrator” refers to the New Mountain Finance Entities’ administrator, New Mountain Finance Administration, L.L.C.;
|
| |
Ÿ |
|
“New Mountain Capital” refers to New Mountain Capital Group, L.L.C. and its affiliates; |
| |
Ÿ |
|
“Predecessor Entities” refers to New Mountain Guardian (Leveraged), L.L.C. and New Mountain Guardian Partners, L.P., together with their
respective direct and indirect wholly-owned subsidiaries prior to the initial public offering; |
| |
Ÿ |
|
“Holdings Credit Facility” refers to the Operating Company’s Amended and Restated Loan and Security Agreement with Wells Fargo Bank, National
Association, dated May 19, 2011, as amended; |
| |
Ÿ |
|
“SLF Credit Facility” refers to NMF SLF’s Loan and Security Agreement with Wells Fargo Bank, National Association, dated October 27, 2010,
as amended; and |
| |
Ÿ |
|
“Credit Facilities” refers to the Holding Credit Facility and the SLF Credit Facility, collectively. |
S-1
Overview
The Operating Company is a Delaware limited liability company. The Operating Company is externally managed and has elected to be treated as a business development company (“BDC”) under the Investment
Company Act of 1940, as amended (the “1940 Act”). As such, the Operating Company is obligated to comply with certain regulatory requirements. The Operating Company intends to be treated as a partnership for federal income tax purposes for
so long as it has at least two members.
The Operating Company is externally managed by the Investment Adviser. The Administrator
provides the administrative services necessary for its operations. The Investment Adviser and Administrator are wholly-owned subsidiaries of New Mountain Capital. New Mountain Capital is a firm with a track record of investing in the middle market
and with assets under management (which includes amounts committed, not all of which have been drawn down and invested to date) totaling approximately $9.0 billion as of September 30, 2012. New Mountain Capital focuses on investing in defensive
growth companies across its private equity, public equity, and credit investment vehicles. The Operating Company, formerly known as New Mountain Guardian (Leveraged), L.L.C., was originally formed as a subsidiary of Guardian AIV by New Mountain
Capital in October 2008. Guardian AIV was formed through an allocation of approximately $300.0 million of the $5.1 billion of commitments supporting New Mountain Partners III, L.P., a private equity fund managed by New Mountain
Capital. In February 2009, New Mountain Capital formed a co-investment vehicle, New Mountain Guardian Partners, L.P., comprising $20.4 million of commitments.
NMFC is a Delaware corporation that was originally incorporated on June 29, 2010. NMFC is a closed-end, non-diversified management investment company that has elected to be treated as a BDC under the 1940 Act.
As such, NMFC is obligated to comply with certain regulatory requirements. NMFC has elected to be treated, and intends to comply with the requirements to qualify annually, as a regulated investment company (“RIC”) under Subchapter M
of the Internal Revenue Code of 1986, as amended, (the “Code”).
AIV Holdings is a Delaware corporation that was originally
incorporated on March 11, 2011. Guardian AIV, a Delaware limited partnership, is AIV Holdings’ sole stockholder. AIV Holdings is a closed-end, non-diversified management investment company that has elected to be treated as a BDC under the
1940 Act. As such, AIV Holdings is obligated to comply with certain regulatory requirements. AIV Holdings has elected to be treated, and intends to comply with the requirements to qualify annually, as a RIC under the Code.
On May 19, 2011, NMFC priced its initial public offering (the “IPO”) of 7,272,727 shares of common stock at a public offering price
of $13.75 per share. Concurrently with the closing of the IPO and at the public offering price of $13.75 per share, NMFC sold an additional 2,172,000 shares of its common stock to certain executives and employees of, and other individuals affiliated
with, New Mountain Capital in a concurrent private placement (the “Concurrent Private Placement”). Additionally, 1,252,964 shares were issued to the partners of New Mountain Guardian Partners, L.P. at that time for their ownership
interest in the Predecessor Entities. In connection with NMFC’s IPO and through a series of transactions, the Operating Company owns all of the operations of the Predecessor Entities, including all of the assets and liabilities related to such
operations.
On July 10, 2012, NMFC’s shelf registration statement became effective. On July 17, 2012, NMFC completed a public
offering of 5,250,000 shares of its common stock at a public offering price of $14.35 per share. In connection with the offering, the underwriters purchased an additional 676,802 shares with the exercise of the overallotment option to purchase up to
an additional 787,500 shares of
S-2
common stock. As a result of this public offering, NMFC and AIV Holdings owned approximately 45.1% and 54.9%, respectively, of the units of NMF Holdings.
On September 28, 2012, NMFC completed an underwritten secondary public offering of 4,000,000 shares of its common stock at a public offering price
of $15.00 per share on behalf of a selling stockholder, AIV Holdings. No shares were sold by NMFC, and it did not receive any proceeds from this secondary public offering. The Operating Company and NMFC did not bear any expenses in connection with
this offering. The offering expenses were borne by the selling stockholder, AIV Holdings. After completion of this underwritten secondary public offering, NMFC and AIV Holdings owned approximately 56.0% and 44.0%, respectively, of the units of NMF
Holdings.
NMFC and AIV Holdings are holding companies with no direct operations of their own, and their sole asset is their ownership
in the Operating Company. NMFC and AIV Holdings each entered into a joinder agreement with respect to the Limited Liability Company Agreement, as amended and restated, of the Operating Company, pursuant to which NMFC and AIV Holdings were admitted
as members of the Operating Company. NMFC acquired from the Operating Company, with the gross proceeds of the IPO and the Concurrent Private Placement, common membership units (“units”) of the Operating Company (the number of units are
equal to the number of shares of NMFC’s common stock sold in the IPO and the Concurrent Private Placement). Additionally, NMFC received units of the Operating Company equal to the number of shares of common stock of NMFC issued to the partners
of New Mountain Guardian Partners, L.P. Guardian AIV was the parent of the Operating Company prior to the IPO and, as a result of the transactions completed in connection with the IPO, obtained units in the Operating Company. Guardian AIV
contributed its units in the Operating Company to its newly formed subsidiary, AIV Holdings, in exchange for common stock of AIV Holdings. AIV Holdings has the right to exchange all or any portion of its units in the Operating Company for shares of
NMFC’s common stock on a one-for-one basis at any time.
As part of the third quarter 2012 dividend payment, NMFC issued an
additional 66,142 shares in conjunction with its dividend reinvestment plan at a price of $14.82. As of September 30, 2012, NMFC and AIV Holdings own approximately 56.1% and 43.9%, respectively, of the units of the Operating Company.
The current structure was designed to generally prevent NMFC and its stockholders from being allocated taxable income with respect to unrecognized
gains that existed at the time of the IPO in the Predecessor Entities’ assets, and rather such amounts would be allocated generally to AIV Holdings and its stockholders. The result is that any distributions made to NMFC’s stockholders that
are attributable to such gains generally will not be treated as taxable dividends but rather as return of capital.
S-3
The diagram below depicts our current organizational structure (percentages are prior to this
offering).

The Operating Company’s investment objective is to generate current income and capital appreciation through
the sourcing and origination of debt securities at all levels of the capital structure, including first and second lien debt, notes, bonds and mezzanine securities. In some cases, the Operating Company’s investments may also include equity
interests. The primary focus is in the debt of defensive growth companies, which are defined as generally exhibiting the following characteristics: (i) sustainable secular growth drivers, (ii) high barriers to competitive entry,
(iii) high free cash flow after capital expenditure and working capital needs, (iv) high returns on assets and (v) niche market dominance.
As of September 30, 2012, the Operating Company’s net asset value was $520.4 million and its portfolio had a fair value of approximately $858.9 million in 58 portfolio companies, with a weighted average Yield
to Maturity of approximately 9.9%. This Yield to Maturity calculation assumes that all investments not on non-accrual are purchased at fair value on September 30, 2012 and held until their
S-4
respective maturities with no prepayments or losses and exited at par at maturity. The actual yield to maturity may be higher or lower due to the future selection of the London Interbank Offered
Rate (“LIBOR”) contracts by the individual companies in the Operating Company’s portfolio or other factors.
The
Investment Adviser
The Investment Adviser, a wholly-owned subsidiary of New Mountain Capital, manages the Operating Company’s
day-to-day operations and provides it with investment advisory and management services. In particular, the Investment Adviser is responsible for identifying attractive investment opportunities, conducting research and due diligence on prospective
investments, structuring the Operating Company’s investments and monitoring and servicing the Operating Company’s investments. We currently do not have, and do not intend to have, any employees. As of September 30, 2012, the Investment
Adviser was supported by over 90 staff members of New Mountain Capital, including 62 investment professionals.
The Investment
Adviser is managed by a five member investment committee (the “Investment Committee”), which is responsible for approving purchases and sales of the Operating Company’s investments above $5.0 million in aggregate by issuer. The
Investment Committee currently consists of Steven B. Klinsky, Robert A. Hamwee, Adam Collins, Douglas Londal and Alok Singh. The Investment Committee is responsible for approving all of the Operating Company’s investment purchases above
$5.0 million. The Investment Committee also monitors investments in the Operating Company’s portfolio and approves all asset dispositions above $5.0 million. Purchases and dispositions below $5.0 million may be approved by the
Operating Company’s Chief Executive Officer. These approval thresholds are subject to change over time. We expect to benefit from the extensive and varied relevant experience of the investment professionals serving on the Investment Committee,
which includes expertise in private equity, primary and secondary leveraged credit, private mezzanine finance and distressed debt.
Recent Developments
Preliminary
Estimates of Net Asset Value
Set forth below is a preliminary estimate of our net asset value per share as of December 3, 2012.
The following estimate is not a comprehensive statement of our financial condition or results for the period from September 30, 2012 through December 3, 2012. We advise you that our actual results for the three months and year-ended December 31,
2012 may differ materially from this estimate, which is given only as of December 3, 2012, as a result of the completion of our financial closing procedures, final adjustments and other developments, including changes in interest rates or changes in
the businesses to whom we have made loans, which may arise between now and the time that our financial results for the three months and year-ended December 31, 2012 are finalized. This information is inherently uncertain.
As of December 3, 2012, we estimate that our net asset value per share is approximately $14.35, which does not include the dividend distribution
which will be paid on December 28, 2012.
The preliminary financial estimate provided herein has been prepared by, and is the
responsibility of, management. Deloitte & Touche LLP, our independent registered public accounting firm, has not audited, reviewed, compiled, or performed any procedures with respect to the accompanying preliminary financial data. Accordingly,
Deloitte & Touche LLP does not express an opinion or any form of assurance with respect thereto.
S-5
New BDC Legislation
On June 8, 2012, legislation was introduced in the U.S. House of Representatives intended to revise certain regulations applicable to business development companies, or “BDCs”. The legislation
provides for (i) increasing the amount of funds BDCs may borrow by reducing asset to debt limitations from 2:1 to 3:2, (ii) permitting BDCs to file registration statements with the U.S. Securities and Exchange Commission that incorporate
information from already-filed reports by reference, (iii) utilizing other streamlined registration processes afforded to operating companies, and (iv) allowing BDCs to own investment adviser subsidiaries. There are no assurances as to
when the legislation will be enacted by Congress, if at all, or, if enacted, what final form the legislation would take.
Competitive
Advantages
We believe that we have the following competitive advantages over other capital providers to middle market companies:
Proven and Differentiated Investment Style With Areas of Deep Industry Knowledge
In making its investment decisions, the Investment Adviser applies New Mountain Capital’s long-standing, consistent investment approach that
has been in place since its founding more than 10 years ago. We focus on companies in less well followed defensive growth niches of the middle market space where we believe few debt funds have built equivalent research and operational size and
scale.
We benefit directly from New Mountain Capital’s private equity investment strategy that seeks to identify attractive
investment sectors from the top down and then works to become a well positioned investor in these sectors. New Mountain Capital focuses on companies and end markets with sustainable strengths in all economic cycles, particularly ones that are
defensive in nature, that are non-cyclical and can maintain pricing power in the midst of a recessionary and/or inflationary environment. New Mountain Capital focuses on companies within sectors in which it has significant expertise (examples
include federal services, software, education, niche healthcare, business services, energy and logistics) while typically avoiding investments in companies with end markets that are highly cyclical, face secular headwinds, are overly-dependent on
consumer demand or are commodity-like in nature.
In making its investment decisions, the Investment Adviser has adopted the approach of
New Mountain Capital, which is based on three primary investment principles:
1. A generalist approach, combined with
proactive pursuit of the highest quality opportunities within carefully selected industries, identified via an intensive and structured ongoing research process;
2. Emphasis on strong downside protection and strict risk controls; and
3. Continued search for superior risk adjusted returns, combined with timely, intelligent exits and outstanding return performance.
Experienced Management Team and Established Platform
The Investment Adviser’s team members have extensive experience in the leveraged lending space. Steven B. Klinsky, New Mountain Capital’s Founder, Chief Executive Officer and Managing Director and
Chairman of the board of directors of the New Mountain Finance Entities, was a general
S-6
partner of Forstmann Little & Co., a manager of debt and equity funds totaling multiple billions of dollars in the 1980s and 1990s. He was also a co-founder of Goldman,
Sachs & Co.’s Leverage Buyout Group in the period from 1981 to 1984. Robert A. Hamwee, Chief Executive Officer and President of the New Mountain Finance Entities and Managing Director of New Mountain Capital, was formerly
President of GSC Group, Inc. (“GSC”), where he was the portfolio manager of GSC’s distressed debt funds and led the development of GSC’s CLOs. Douglas Londal, Managing Director of New Mountain Capital, was previously co-head
of Goldman, Sachs & Co.’s United States (“U.S.”) mezzanine debt team. Alok Singh, Managing Director of New Mountain Capital, has extensive experience structuring debt products as a long-time partner at Bankers Trust
Company.
Many of the debt investments that the Operating Company has made to date have been in the same companies with which New
Mountain Capital has already conducted months of intensive acquisition due diligence related to potential private equity investments. We believe that private equity underwriting due diligence is usually more robust than typical due diligence for
loan underwriting. In its underwriting of debt investments, the Investment Adviser is able to utilize the research and hands-on operating experience that New Mountain Capital’s private equity underwriting teams possess regarding the individual
companies and industries. Business and industry due diligence is led by a team of investment professionals of the Investment Adviser that generally consists of three to seven individuals, typically based on their relevant company and/or industry
specific knowledge. Additionally, the Investment Adviser is also able to utilize its relationships with operating management teams and other private equity sponsors. We believe this differentiates us from many of our competitors.
Significant Sourcing Capabilities and Relationships
We believe the Investment Adviser’s ability to source attractive investment opportunities is greatly aided by both New Mountain Capital’s historical and current reviews of private equity opportunities in
the business segments we target. To date, a significant majority of the investments that the Operating Company has made are in the debt of companies and industry sectors that were first identified and reviewed in connection with New Mountain
Capital’s private equity efforts, and the majority of our current pipeline reflects this as well. Furthermore, the Investment Adviser’s investment professionals have deep and longstanding relationships in both the private equity sponsor
community and the lending/agency community which they have and will continue to utilize to generate investment opportunities.
Risk Management
through Various Cycles
New Mountain Capital has emphasized tight control of risk since its inception and long before the recent
global financial distress began. To date, New Mountain Capital has never experienced a bankruptcy of any of its portfolio companies in its private equity efforts or with respect to the Predecessor Entities’ business. The Investment Adviser
seeks to emphasize tight control of risk with our investments in several important ways, consistent with New Mountain Capital’s historical approach. In particular, the Investment Adviser:
| |
Ÿ |
|
Emphasizes the origination or purchase of debt in what the Investment Adviser believes are defensive growth companies, which are less likely to be dependent on
macro-economic cycles; |
| |
Ÿ |
|
Targets investments in companies that are preeminent market leaders in their own industries, and when possible, investments in companies that have strong
management teams whose skills are difficult for competitors to acquire or reproduce; and |
| |
Ÿ |
|
Emphasizes capital structure seniority in the Investment Adviser’s underwriting process. |
S-7
Access to Non Mark to Market, Seasoned Leverage Facilities
The amounts available under the Credit Facilities are generally not subject to reduction as a result of mark to market fluctuations in the Operating
Company’s portfolio investments. For a detailed discussion of the Credit Facilities, see “Management’s Discussion and Analysis of Financial Conditions and Results of Operations—Liquidity and Capital Resources”.
Market Opportunity
We
believe that the size of the market for investments that we target, coupled with the demands of middle market companies for flexible sources of capital at competitive terms and rates, create an attractive investment environment for us.
| |
Ÿ |
|
The leverage finance market has a high level of financing needs over the next several years due to significant bank debt maturities. We believe that
the large dollar volume of loans that need to be refinanced will present attractive opportunities to invest capital in a manner consistent with our stated objectives. |
| |
Ÿ |
|
Middle market companies continue to face difficulties in accessing the capital markets. We believe opportunities to serve the middle market will
continue to exist. While many middle market companies were formerly able to raise funds by issuing high-yield bonds, we believe this approach to financing has become more difficult in recent years as institutional investors have sought to invest in
larger, more liquid offerings. In addition, many private finance companies and hedge funds have reduced their middle market lending activities due to decreased availability of their own financing. |
| |
Ÿ |
|
Consolidation among commercial banks has reduced the focus on middle market lending. We believe that many traditional bank lenders to middle market
businesses have either exited or de-emphasized their service and product offerings in the middle market. These traditional lenders have instead focused on lending and providing other services to large corporate clients. We believe this has resulted
in fewer key players and the reduced availability of debt capital to the companies we target. |
| |
Ÿ |
|
Attractive pricing. Reduced access to, and availability of, debt capital typically increases the interest rates, or pricing, of loans for middle
market lenders. Recent primary debt transactions in this market often include upfront fees, prepayment protections and, in some cases, warrants to purchase common stock, all of which should enhance the profitability of new loans to lenders.
|
| |
Ÿ |
|
Conservative deal structures. As a result of the credit crisis, many lenders are requiring larger equity contributions from financial sponsors.
Larger equity contributions create an enhanced margin of safety for lenders because leverage is a lower percentage of the implied enterprise value of the company. |
| |
Ÿ |
|
Large pool of uninvested private equity capital available for new buyouts. We expect that private equity firms will continue to pursue acquisitions
and will seek to leverage their equity investments with mezzanine loans and/or senior loans (including traditional first and second lien, as well as unitranche loans) provided by companies such as ours. |
Operating and Regulatory Structure
NMFC and the Operating Company are closed-end, non-diversified management investment companies that have elected to be treated as BDCs under the 1940 Act and are required to maintain
S-8
an asset coverage ratio, as defined in the 1940 Act, of at least 200.0%. NMFC has no material long-term liabilities itself and its only business and sole asset is its ownership of units of the
Operating Company. As a result, NMFC looks to the Operating Company’s assets for purposes of satisfying the requirements under the 1940 Act otherwise applicable to NMFC. See “Regulation”. The Operating Company and NMF SLF have
long term liabilities related to the Credit Facilities.
NMFC has elected to be treated, and intends to comply with the requirements to
qualify annually, as a RIC under Subchapter M of the Code. See “Material Federal Income Tax Considerations” in the accompanying prospectus. As a RIC, NMFC generally will not have to pay corporate-level federal income taxes on any net
ordinary income or capital gains that it timely distributes to its stockholders as dividends if it meets certain source-of-income, distribution and asset diversification requirements. The Operating Company intends to make distributions to its unit
holders that will be sufficient to enable NMFC to pay quarterly distributions to its stockholders and to maintain its status as a RIC. NMFC intends to distribute to its stockholders substantially all of its annual taxable income, except that it may
retain certain net capital gains for reinvestment in units of the Operating Company.
Risks
An investment in NMFC’s common stock involves risk, including the risk of leverage and the risk that our operating policies and strategies may
change without prior notice to NMFC stockholders or prior stockholder approval. See “Risk Factors” and the other information included in this prospectus supplement and the accompanying prospectus for a discussion of factors you should
carefully consider before deciding to invest in shares of NMFC’s common stock. The value of the Operating Company’s assets, as well as the market price of NMFC’s shares, will fluctuate. Our investments may be risky, and you may lose
all or part of your investment in NMFC. Investing in NMFC involves other risks, including the following:
| |
Ÿ |
|
We have a limited operating history; |
| |
Ÿ |
|
The Operating Company may suffer credit losses; |
| |
Ÿ |
|
The Operating Company does not expect to replicate the Predecessor Entities’ historical performance or the historical performance of other entities managed
or supported by New Mountain Capital; |
| |
Ÿ |
|
There is uncertainty as to the value of the Operating Company’s portfolio investments because most of its investments are, and may continue to be in private
companies and recorded at fair value. In addition, because NMFC is a holding company, the fair values of the Operating Company’s investments are determined by the Operating Company’s board of directors in accordance with the Operating
Company’s valuation policy; |
| |
Ÿ |
|
The Operating Company’s ability to achieve its investment objective depends on key investment personnel of the Investment Adviser. If the Investment Adviser
were to lose any of its key investment personnel, the Operating Company’s ability to achieve its investment objective could be significantly harmed; |
| |
Ÿ |
|
The Investment Adviser has limited experience managing a BDC or a RIC, which could adversely affect our business; |
| |
Ÿ |
|
The Operating Company operates in a highly competitive market for investment opportunities and may not be able to compete effectively;
|
| |
Ÿ |
|
Our business, results of operations and financial condition depends on the Operating Company’s ability to manage future growth effectively;
|
S-9
| |
Ÿ |
|
The Operating Company borrows money, which could magnify the potential for gain or loss on amounts invested in us and increase the risk of investing in us;
|
| |
Ÿ |
|
Changes in interest rates may affect the Operating Company’s cost of capital and net investment income; |
| |
Ÿ |
|
Regulations governing the operations of BDCs will affect our ability to raise additional equity capital as well as our ability to issue senior securities or
borrow for investment purposes, any or all of which could have a negative effect on our investment objectives and strategies; |
| |
Ÿ |
|
We may experience fluctuations in our annual and quarterly results due to the nature of our business; |
| |
Ÿ |
|
The Operating Company’s board of directors may change its investment objective, operating policies and strategies without prior notice or member approval,
the effects of which may be adverse to your interest as a stockholder; |
| |
Ÿ |
|
NMFC will be subject to corporate-level federal income tax on all of its income if it is unable to maintain RIC status under Subchapter M of the Code, which
would have a material adverse effect on its financial performance; |
| |
Ÿ |
|
NMFC may not be able to pay you distributions on its common stock, its distributions to you may not grow over time and a portion of their distributions to you
may be a return of capital for federal income tax purposes; |
| |
Ÿ |
|
The Operating Company’s investments in portfolio companies may be risky, and the Operating Company could lose all or part of any of its investments;
|
| |
Ÿ |
|
The lack of liquidity in the Operating Company’s investments may adversely affect our business; |
| |
Ÿ |
|
Economic recessions or downturns could impair the Operating Company’s portfolio companies and harm its operating results; |
| |
Ÿ |
|
NMFC is a holding company with no direct operations of its own, and will depend on distributions from the Operating Company to meet its ongoing obligations;
|
| |
Ÿ |
|
Any future exchange by AIV Holdings of units of the Operating Company for shares of NMFC’s common stock would significantly dilute the voting power of
NMFC’s current stockholders with respect to the election of NMFC directors or other matters that require the approval of NMFC stockholders only. In addition, the interests of the partners of Guardian AIV following such exchange by AIV Holdings
may be adverse to the interests of NMFC’s current stockholders and could limit your ability to influence the outcome of key transactions, including any change of control; |
| |
Ÿ |
|
The market price of NMFC’s common stock may fluctuate significantly; and |
| |
Ÿ |
|
Sales of substantial amounts of NMFC’s common stock in the public market may have an adverse effect on the market price of its common stock.
|
Company Information
Our administrative and executive offices are located at 787 Seventh Avenue, 48th Floor, New York, New York 10019, and our telephone number is (212) 720-0300. We maintain a website at
http://www.newmountainfinance.com. Information contained on our website is not incorporated by reference into this prospectus supplement and the accompanying prospectus, and you should not
S-10
consider information contained on our website to be part of this prospectus supplement and the accompanying prospectus.
Presentation of Historical Financial Information and Market Data
Historical Financial Information
Unless otherwise indicated, historical references contained in the accompanying prospectus in “Selected Financial and Other
Data”, “Selected Quarterly Data”, “Management’s Discussion and Analysis of Financial Condition and Results of Operations”, “Senior Securities” and “Portfolio Companies” relate to the Operating
Company, which is NMFC’s sole investment. The consolidated financial statements of New Mountain Finance Holdings, L.L.C., formerly known as New Mountain Guardian (Leveraged), L.L.C., and New Mountain Guardian Partners, L.P. are
the Operating Company’s historical consolidated financial statements.
Market Data
Statistical and market data used in this prospectus supplement and the accompanying prospectus has been obtained from governmental and independent
industry sources and publications. We have not independently verified the data obtained from these sources, and we cannot assure you of the accuracy or completeness of the data. Forward-looking information obtained from these sources is subject to
the same qualifications and the additional uncertainties regarding the other forward-looking statements contained in this prospectus supplement and the accompanying prospectus. See “Cautionary Statement Regarding Forward-Looking
Statements”.
S-11
THE OFFERING
|
|
|
| Common Stock Offered by NMFC |
|
3,000,000 shares, excluding 450,000 shares of common stock issuable pursuant to the option to purchase additional shares granted to the underwriters. |
|
|
| Common Stock Currently Outstanding |
|
20,690,635 shares. |
|
|
| Common Stock Outstanding After This Offering |
|
23,690,635 shares, excluding 450,000 shares of common stock issuable pursuant to the option to purchase additional shares granted to the underwriters. This amount does not include any
shares which may be issuable upon conversion of existing securities. |
|
|
| Use of Proceeds |
|
The Operating Company intends to use the net proceeds from this offering primarily for new investments in portfolio companies in accordance with the Operating Company’s investment
objective and strategies described in this prospectus supplement and the accompanying prospectus. The Operating Company may also use a portion of the net proceeds for other general corporate purposes, including to temporarily repay indebtedness
(which will be subject to reborrowing), and other working capital needs. The Operating Company is continuously identifying, reviewing and, to the extent consistent with its investment objective, funding new investments. As a result, we typically
raise capital as we deem appropriate to fund such new investments. We expect the Operating Company to substantially invest the net proceeds of this offering by the end of the calendar year, depending on the availability of attractive opportunities
and market conditions. However, we can offer no assurance that we will be able to achieve this goal. Pending such use, the Operating Company will invest the net proceeds primarily in cash, cash equivalents, U.S. government securities and other
high-quality investments that mature in one year or less from the date of the investment. These securities may have lower yields than the types of investments we would typically make in accordance with our investment objective and, accordingly, may
result in lower distributions, if any, during such period. See “Use of Proceeds” in this prospectus supplement. |
|
|
| New York Stock Exchange Symbol |
|
“NMFC” |
|
|
| Investment Advisory Fees |
|
NMFC does not have an investment adviser. The Operating Company pays the Investment Adviser a fee for its services under an investment advisory and management agreement (the
“Investment Management Agreement”) consisting of two components—a base management fee and an incentive fee. The base management fee is payable quarterly in arrears and is calculated at an annual rate of 1.75% of the Operating
Company’s gross assets less (i) the borrowings under the SLF Credit Facility and (ii) cash and cash equivalents. The base management fee is calculated based on the average value of the Operating Company’s gross assets, borrowings
under the SLF Credit Facility, and the cash and cash equivalents at the end of each of the two most recently completed calendar quarters, and appropriately adjusted on a pro rata |
S-12
|
|
|
|
|
basis for any equity capital raises or repurchases during the current calendar quarter. The incentive fee consists of two parts. The first part is calculated and payable quarterly in
arrears and equals 20.0% of the Operating Company’s “Pre-Incentive Fee Adjusted Net Investment Income” for the immediately preceding quarter, subject to a “preferred return”, or “hurdle”, and a “catch-up”
feature. The second part will be determined and payable in arrears as of the end of each calendar year (or upon termination of the Investment Management Agreement) and will equal 20.0% of the Operating Company’s “Adjusted Realized Capital
Gains”, if any, on a cumulative basis from inception through the end of the year, computed net of all “Adjusted Realized Capital Losses” and “Adjusted Unrealized Capital Depreciation” on a cumulative basis, less the
aggregate amount of any previously paid capital gain incentive fee. See “Investment Management Agreement” in the accompanying prospectus. |
|
|
| Administrator |
|
The Administrator serves as the administrator for us and arranges office space for us and provides us with office equipment and administrative services. The Administrator performs, or
oversees the performance of, our financial records, prepares reports to our stockholders/unit holders and reports filed by us with the Securities and Exchange Commission (“SEC”), monitors the payment of our expenses, and oversees the
performance of administrative and professional services rendered to us by others. The Operating Company reimburses the Administrator for the New Mountain Finance Entities’ allocable portion of overhead and other expenses incurred by the
Administrator in performing its obligations to the New Mountain Finance Entities under an administration agreement, as amended and restated (the “Administration Agreement”). See “Administration Agreement” in the accompanying
prospectus. |
|
|
| Distributions |
|
NMFC intends to pay quarterly distributions to its stockholders out of assets legally available for distribution. The quarterly distributions, if any, will be determined by NMFC’s
board of directors. The distributions NMFC pays to its stockholders in a year may exceed its taxable income for that year and, accordingly, a portion of such distributions may constitute a return of capital for federal income tax purposes. The
specific tax characteristics of NMFC’s distributions will be reported to stockholders after the end of the calendar year. The Operating Company intends to make distributions to its members that will be sufficient to enable NMFC to pay quarterly
distributions to its stockholders. See “Distributions” in the accompanying prospectus. |
|
|
| Taxation of NMFC |
|
NMFC has elected to be treated, and intends to comply with the requirements to qualify annually, as a RIC under Subchapter M of the Code. As a RIC, NMFC generally will not pay
corporate-level federal income taxes on any net ordinary income or capital gains that it timely distributes to its stockholders as dividends. To maintain its RIC status, NMFC must meet specified source-of-income and asset diversification
requirements and distribute annually to its stockholders at least 90.0% of its net ordinary income and realized net short-term capital gains in excess of realized net long-term capital losses, if any. The Operating Company intends to make
distributions to its members that will be sufficient to enable NMFC to maintain its status as a RIC. See “Distributions” and “Material Federal Income Tax Considerations” in the accompanying
prospectus. |
S-13
|
|
|
| Taxation of Operating Company |
|
The Operating Company intends to be treated as a partnership for federal income tax purposes for as long as it has at least two members. As a result, the Operating Company will itself not
be subject to federal income tax. Rather, each of the Operating Company’s unit holders, including NMFC, will be required to take into account, for federal income tax purposes, its allocable share of the Operating Company’s items of income,
gain, loss, deduction and credit. NMF SLF expects to be treated as a disregarded entity for federal income tax purposes. As a result, NMF SLF will itself not be subject to federal income tax and, for federal income tax purposes, the Operating
Company will take into account all of NMF SLF’s assets and items of income, gain, loss, deduction and credit. See “Material Federal Income Tax Considerations” in the accompanying prospectus. |
|
|
| Dividend Reinvestment Plan |
|
NMFC has adopted an “opt out” dividend reinvestment plan for its stockholders. As a result, if NMFC declares a distribution, then your cash distributions will be automatically
reinvested in additional shares of NMFC’s common stock, unless you specifically “opt out” of the dividend reinvestment plan so as to receive cash distributions. Stockholders who receive distributions in the form of stock will be
subject to the same federal income tax consequences as stockholders who elect to receive their distributions in cash. Cash distributions reinvested in additional shares of NMFC’s common stock will be automatically reinvested by NMFC in
additional units of the Operating Company. NMFC will use only newly issued shares to implement the plan if the price at which newly issued shares are to be credited is equal to or greater than 110.0% of the last determined net asset value of the
shares. NMFC reserves the right to purchase shares of its common stock in the open market in connection with its implementation of the plan if the price at which its newly issued shares are to be credited does not exceed 110.0% of the last
determined net asset value of the shares. See “Dividend Reinvestment Plan” in the accompanying prospectus. |
|
|
| Trading at a Discount |
|
Shares of closed-end investment companies frequently trade at a discount to their net asset value. The possibility that NMFC’s common stock may trade at a discount to its net asset
value per share is separate and distinct from the risk that its net asset value per share may decline. We cannot predict whether NMFC’s common stock will trade above, at or below net asset value. |
|
|
| License Agreement |
|
The New Mountain Finance Entities have entered into a royalty-free license agreement with New Mountain Capital, pursuant to which New Mountain Capital has agreed to grant the New Mountain
Finance Entities a non-exclusive license to use the names “New Mountain” and “New Mountain Finance”. See “License Agreement” in the accompanying prospectus. |
|
|
| Leverage |
|
We expect to continue to use leverage to make investments. As a result, we may continue to be exposed to the risks of leverage, which include that leverage may be considered a speculative
investment technique. The use of leverage magnifies the potential for gain and |
S-14
|
|
|
|
|
loss on amounts we invest and therefore, indirectly, increases the risks associated with investing in shares of NMFC’s common stock. See “Risk Factors” in the accompanying
prospectus. |
|
|
| Anti-Takeover Provisions |
|
The New Mountain Finance Entities’ respective boards of directors are divided into three classes of directors serving staggered three-year terms. This structure is intended to provide
us with a greater likelihood of continuity of management, which may be necessary for us to realize the full value of our investments. A staggered board of directors also may serve to deter hostile takeovers or proxy contests, as may certain other
measures that we may adopt. These measures may delay, defer or prevent a transaction or a change in control that might otherwise be in the best interests of NMFC stockholders. See “Description of NMFC’s Capital Stock—Delaware Law and
Certain Certificate of Incorporation and Bylaw Provisions; Anti-Takeover Measures” in the accompanying prospectus. |
|
|
| Available Information |
|
We have filed with the SEC a registration statement on Form N-2 together with all amendments and related exhibits under the Securities Act. The
registration statement contains additional information about us and the shares of common stock being offered by this prospectus supplement and the accompanying prospectus.
We are required to file annual, quarterly and current reports, proxy statements and other
information with the SEC under the Securities Exchange Act of 1934, as amended (the “Exchange Act”). This information is available at the SEC’s public reference room at 100 F Street, NE, Washington, District of Columbia 20549 and
on the SEC’s website at http://www.sec.gov. The public may obtain information on the operation of the SEC’s public reference room by calling the SEC at 1-800-SEC-0330. This information is also available free of charge by contacting
us at New Mountain Finance Corporation, 787 Seventh Avenue, 48th Floor, New York, New York 10019, by telephone at (212) 720-0300, or on our website at
http://www.newmountainfinance.com. Information contained on our
website or on the SEC’s web site about us is not incorporated into this prospectus supplement and the accompanying prospectus and you should not consider information contained on our website or on the SEC’s website to be part of this
prospectus supplement and the accompanying prospectus. |
S-15
FEES AND EXPENSES
The following table is intended to assist you in understanding the costs and expenses that you will bear directly or indirectly. We caution you
that some of the percentages indicated in the table below are estimates and may vary. Except where the context suggests otherwise, whenever this prospectus supplement and the accompanying prospectus contains a reference to fees or expenses paid by
“you”, “NMFC”, the “Operating Company”, or “us” or that “we”, “NMFC”, or the “Operating Company” will pay fees or expenses, stockholders will indirectly bear such fees or expenses
through NMFC’s investment in the Operating Company.
|
|
|
|
|
| Stockholder transaction expenses: |
|
|
|
|
| Sales load (as a percentage of offering price) |
|
|
4.0 |
%(1) |
| Offering expenses borne by us (as a percentage of offering price) |
|
|
0.4 |
%(2) |
| Dividend reinvestment plan fees |
|
|
N/A |
(3) |
|
|
|
|
|
| Total stockholder transaction expenses (as a percentage of offering price) |
|
|
4.4 |
% |
|
|
| Annual expenses (as a percentage of net assets attributable to common stock): |
|
|
|
|
| Base management fees |
|
|
2.2 |
%(4) |
| Incentive fees payable under the Investment Management Agreement |
|
|
2.8 |
%(5) |
| Interest payments on borrowed funds |
|
|
1.5 |
%(6) |
| Other expenses |
|
|
0.9 |
%(7) |
|
|
|
|
|
| Total annual expenses |
|
|
7.4 |
%(8) |
Example
The
following example, required by the SEC, demonstrates the projected dollar amount of total cumulative expenses that would be incurred over various periods with respect to a hypothetical investment in NMFC’s common stock. In calculating the
following expense amounts, we have assumed that our borrowings and annual operating expenses would remain at the levels set forth in the table above. See Note 6 below for additional information regarding certain assumptions regarding our level of
leverage.
|
|
|
|
|
|
|
|
|
|
|
|
|
|
|
|
|
| |
|
1 Year |
|
|
3 Years |
|
|
5 Years |
|
|
10 Years |
|
| You would pay the following expenses on a $1,000 investment, assuming a 5.0% annual return |
|
$ |
46 |
|
|
$ |
138 |
|
|
$ |
231 |
|
|
$ |
464 |
|
The example and the expenses in the tables above should not be considered a representation of future expenses,
and actual expenses may be greater or less than those shown.
While the example assumes, as required by the applicable rules of the
SEC, a 5.0% annual return, our performance will vary and may result in a return greater or less than 5.0%. The incentive fee under the Investment Management Agreement, which, assuming a 5.0% annual return, would either not be payable or would have
an insignificant impact on the expense amounts shown above, is not included in the example. The above illustration assumes that we will not realize any capital gains (computed net of all realized capital losses and unrealized capital depreciation)
in any of the indicated time periods. If we achieve sufficient returns on our investments, including through the realization of capital gains, to trigger an incentive fee of a material amount, our expenses and returns to our investors would be
higher. For example, if we assumed that we received our 5.0% annual return completely in the form of net realized capital gains on our investments, computed net of all cumulative
S-16
unrealized depreciation on our investments, the projected dollar amount of total cumulative expenses set forth in the above illustration would be as follows:
|
|
|
|
|
|
|
|
|
|
|
|
|
|
|
|
|
| |
|
1 Year |
|
|
3 Years |
|
|
5 Years |
|
|
10 Years |
|
| You would pay the following expenses on a $1,000 investment, assuming a 5.0% annual return |
|
$ |
56 |
|
|
$ |
165 |
|
|
$ |
273 |
|
|
$ |
536 |
|
The example assumes a sales load of 4.0%. In addition, while the examples assume reinvestment of all distributions
at net asset value, participants in NMFC’s dividend reinvestment plan will receive a number of shares of NMFC’s common stock determined by dividing the total dollar amount of the distribution payable to a participant by the market price
per share of NMFC’s common stock at the close of trading on the dividend payment date. The market price per share of NMFC’s common stock may be at, above or below net asset value. See “Dividend Reinvestment Plan” in the
accompanying prospectus for additional information regarding the dividend reinvestment plan.
| (1) |
Represents the commission with respect to the shares of NMFC’s common stock being sold in this offering which we will pay to in connection with sales of shares of
NMFC’s common stock effected by in this offering. The Investment Adviser has agreed to bear an additional $ per share, or approximately % of
the offering price, of commission in connection with this offering, which is not reflected in the above table. There is no guaranty that there will be any sales of NMFC’s common stock pursuant to this prospectus supplement and the accompanying
prospectus. |
| (2) |
The offering expenses of this offering are estimated to be approximately $181,254. Total expenses relating to the shelf registration statement that was declared effective by the
SEC on July 10, 2012, of which this prospectus supplement and the accompanying prospectus form a part, are estimated to be $822,697. |
| (3) |
The de minimus expenses of the dividend reinvestment plan are included in “other expenses”. |
| (4) |
The base management fee under the Investment Management Agreement is based on an annual rate of 1.75% of the Operating Company’s average gross assets for the two most recent
quarters less (i) the borrowings under the SLF Credit Facility and (ii) cash and cash equivalents. The base management fees reflected in the table above is based on the nine months ended September 30, 2012. See “Investment Management
Agreement” in the accompanying prospectus. |
| (5) |
Assumes that annual incentive fees earned by the Investment Adviser remain consistent with the incentive fees earned by the Investment Adviser during the nine months ended
September 30, 2012 and includes accrued capital gains incentive fee. These accrued capital gains incentive fees would be paid by the Operating Company if the Operating Company ceased operations on September 30, 2012 and liquidated its investments at
the September 30, 2012 valuation. As we cannot predict whether the Operating Company will meet the thresholds for incentive fees under the Investment Management Agreement, the incentive fees paid in subsequent periods, if any, may be substantially
different than the fees incurred during the nine months ended September 30, 2012. For more detailed information about the incentive fee calculations, see the “Investment Management Agreement” section of the accompanying prospectus.
|
| (6) |
We may borrow funds from time to time to make investments to the extent we determine that additional capital would allow us to take advantage of additional investment
opportunities or if the economic situation is otherwise conducive to doing so. The costs associated with these borrowings are indirectly borne by NMFC’s stockholders through its investment in the Operating Company. As of September 30, 2012, the
Operating Company had $135.7 million and $200.0 million of indebtedness outstanding under the Holdings Credit Facility and the SLF Credit Facility, respectively. For purposes of this calculation, we have assumed the September 30, 2012 amounts
outstanding under these credit facilities, and have computed interest expense using an assumed interest rate of 3.0% for the Holdings Credit Facility and 2.2% for the SLF Credit Facility, which were the rates payable as of September 30, 2012. See
“Senior Securities” in the accompanying prospectus. |
S-17
| (7) |
“Other expenses” include the New Mountain Finance Entities’ overhead expenses, including payments by the Operating Company under the Administration Agreement based
on the allocable portion of overhead and other expenses incurred by the Administrator in performing its obligations to the New Mountain Finance Entities under the Administration Agreement. Pursuant to the Administration Agreement, and further
restricted by the Operating Company, expenses payable to the Administrator by the Operating Company as well as other direct and indirect expenses (excluding interest, other credit facility expenses, trading expenses and management and incentive
fees) have been capped at $3.5 million for the time period from April 1, 2012 to March 31, 2013. This expense ratio does not include the expense cap of $3.5 million. Assuming $3.5 million of annual expense, the expense ratio would be
0.6%. See “Administration Agreement” in the accompanying prospectus. |
| (8) |
The holders of shares of NMFC’s common stock indirectly bear the cost associated with our annual expenses through NMFC’s investment in the Operating Company.
|
S-18
SELECTED FINANCIAL AND OTHER DATA
The selected financial data should be read in conjunction with the respective financial statements and related combined notes thereto and
“Management’s Discussion and Analysis of Financial Condition and Results of Operations” included in this prospectus. Financial information for the years ended December 31, 2011, December 31, 2010, December 31,
2009 and for the period October 29, 2008 (commencement of operations) to December 31, 2008 has been derived from our financial statements that were audited by Deloitte & Touche, LLP, an independent registered public accounting
firm. The financial information for the nine months ended September 30, 2012 was derived from our unaudited financial statements and related notes. In the opinion of management, all adjustments, consisting solely of normal recurring accruals,
considered necessary for the fair presentation of financial statements for the interim periods, have been included. Our results for the interim period may not be indicative of our results for the full year. See “Management’s Discussion and
Analysis of Financial Condition and Results of Operations” elsewhere in this prospectus supplement and “Senior Securities” in the accompanying prospectus for more information.
(in thousands except shares and per share data)
|
|
|
|
|
|
|
|
|
|
|
|
|
|
|
|
|
|
|
|
|
New Mountain Finance Holdings, L.L.C.
Statement of Operations Data: |
|
Nine
months
ended
September 30,
2012 |
|
|
Year ended December 31, |
|
|
Period from
October 29, 2008
(commencement of
operations)
to
December 31,
2008 |
|
| |
|
2011 |
|
|
2010 |
|
|
2009 |
|
|
| |
|
|
|
|
|
|
|
|
|
|
|
|
|
|
|
| Total investment income |
|
$ |
61,073 |
|
|
$ |
56,523 |
|
|
$ |
41,375 |
|
|
$ |
21,767 |
|
|
$ |
256 |
|
| Net expenses |
|
|
29,378 |
|
|
|
17,998 |
|
|
|
3,911 |
|
|
|
1,359 |
|
|
|
— |
|
| Net investment income |
|
|
31,695 |
|
|
|
38,525 |
|
|
|
37,464 |
|
|
|
20,408 |
|
|
|
256 |
|
| Net realized and unrealized gains (losses) |
|
|
25,301 |
|
|
|
(6,848 |
) |
|
|
26,328 |
|
|
|
105,272 |
|
|
|
(1,435 |
) |
| Net increase (decrease) in net assets resulting from operations |
|
|
56,996 |
|
|
|
31,677 |
|
|
|
63,792 |
|
|
|
125,680 |
|
|
|
(1,179 |
) |
|
|
|
|
|
|
| Per share data: |
|
|
|
|
|
|
|
|
|
|
|
|
|
|
|
|
|
|
|
|
| Net asset value |
|
$ |
14.10 |
|
|
$ |
13.60 |
|
|
|
N/A |
|
|
|
N/A |
|
|
|
N/A |
|
| Net increase (decrease) in net assets resulting from operations (basic and diluted) |
|
|
1.74 |
|
|
|
1.02 |
|
|
|
N/A |
|
|
|
N/A |
|
|
|
N/A |
|
| Dividends paid(1) |
|
|
1.23 |
|
|
|
0.86 |
|
|
|
N/A |
|
|
|
N/A |
|
|
|
N/A |
|
|
|
|
|
|
|
| Balance sheet data: |
|
|
|
|
|
|
|
|
|
|
|
|
|
|
|
|
|
|
|
|
| Total assets |
|
$ |
886,828 |
|
|
$ |
730,579 |
|
|
$ |
460,224 |
|
|
$ |
330,558 |
|
|
$ |
61,669 |
|
| SLF Credit Facility |
|
|
200,000 |
|
|
|
165,928 |
|
|
|
56,936 |
|
|
|
— |
|
|
|
— |
|
| Holdings Credit Facility |
|
|
135,665 |
|
|
|
129,038 |
|
|
|
59,697 |
|
|
|
77,745 |
|
|
|
— |
|
| Total net assets |
|
|
520,355 |
|
|
|
420,502 |
|
|
|
241,927 |
|
|
|
239,441 |
|
|
|
30,354 |
|
|
|
|
|
|
|
| Other data: |
|
|
|
|
|
|
|
|
|
|
|
|
|
|
|
|
|
|
|
|
| Total return at net asset value(2) |
|
|
13.06 |
% |
|
|
10.09 |
% |
|
|
26.54 |
% |
|
|
76.38 |
% |
|
|
NM |
|
| Number of portfolio companies at period end |
|
|
58 |
|
|
|
55 |
|
|
|
43 |
|
|
|
24 |
|
|
|
6 |
|
| Total new investments for the period |
|
$ |
392,162 |
|
|
$ |
493,331 |
|
|
$ |
332,708 |
|
|
$ |
268,382 |
|
|
$ |
63,018 |
|
| Investment sales and prepayments for the period |
|
|
268,370 |
|
|
|
231,962 |
|
|
|
258,202 |
|
|
|
125,430 |
|
|
|
132 |
|
| Weighted average Yield to Maturity on debt portfolio at period end(3) (unaudited) |
|
|
9.9 |
% |
|
|
10.7 |
% |
|
|
N/A |
(4) |
|
|
N/A |
(4) |
|
|
N/A |
(4) |
| Weighted average Adjusted Yield to Maturity on debt portfolio at period end(5) (unaudited) |
|
|
N/A |
|
|
|
13.1 |
% |
|
|
12.5 |
% |
|
|
12.7 |
% |
|
|
18.8 |
% |
| Weighted average common membership units outstanding at period end |
|
|
32,671,954 |
|
|
|
30,919,629 |
|
|
|
N/A |
|
|
|
N/A |
|
|
|
N/A |
|
| Portfolio turnover |
|
|
34.77 |
% |
|
|
42.13 |
% |
|
|
76.69 |
% |
|
|
57.50 |
% |
|
|
0.22 |
% |
N/A—Fund was not unitized as of December 31, 2010, December 31, 2009 and December 31, 2008.
NM—Total return from commencement of operations through December 31, 2008 was deemed not meaningful due to the scaling of operations during this short
time period.
S-19
| (1) |
Dividends paid in the nine months ended September 30, 2012 include a special dividend related to estimated realized capital gains attributable to the Operating
Company’s investments in Lawson Software, Inc. and Infor Lux Bond Company. Actual cash payments on the dividends declared to AIV Holdings, only, for the quarters ended March 31, 2012 and June 30, 2012, were made on April 4, 2012
and July 9, 2012, respectively. |
| (2) |
For the nine months ended September 30, 2012, total return is calculated assuming a purchase at net asset value on the opening of the first day of the year and a sale at net
asset value on the last day of the period. For the year ended December 31, 2011, total return is calculated in two parts: (1) from the opening of the first day of the year to NMFC’s IPO date, total return is calculated based on net
income over weighted average net assets and (2) from NMFC’s IPO date to the last day of the year, total return is calculated assuming a purchase at net asset value on NMFC’s IPO date and a sale at net asset value on the last day of
the year. Dividends and distributions, if any, are assumed for purposes of this calculation, to be reinvested at net asset value. For the years ended December 31, 2010 and December 31, 2009, total return is the ratio of net income compared
to capital, adjusted for capital contributions and distributions. |
| (3) |
The Operating Company’s weighted average Yield to Maturity calculation assumes that all investments not on non-accrual are purchased at fair value on the respective period
ends and held until their respective maturities with no prepayments or losses and exited at par at maturity. |
| (4) |
Prior to NMFC’s IPO, for yield calculation purposes, NMF SLF was treated as a fully levered asset of the Operating Company with NMF SLF’s net asset value being included
in the yield to maturity calculations. Since NMF SLF is consolidated in accordance with GAAP, at the time of the IPO, the Operating Company began using the weighted average Yield to Maturity concept instead of the “Adjusted Yield to
Maturity” concept for yield calculation purposes. |
| (5) |
“Adjusted Yield to Maturity” assumes that the investments in the Operating Company’s portfolio are purchased at fair value on the respective period ends and held
until their respective maturities with no prepayments or losses and exited at par at maturity. This calculation excludes the impact of existing leverage, except for the non-recourse debt of NMF SLF. NMF SLF is treated as a fully levered asset of the
Operating Company, with NMF SLF’s net asset value being included for yield calculation purposes. |
(in thousands except shares and
per share data)
|
|
|
|
|
|
|
|
|
New Mountain Finance Corporation
Statement of Operations Data: |
|
Nine months
ended
September 30,
2012 |
|
|
Period from
May 19, 2011
(commencement of
operations)
to
December 31,
2011 |
|
| Total investment income allocated from the Operating Company |
|
$ |
23,346 |
|
|
$ |
13,669 |
|
| Net expenses allocated from the Operating Company |
|
|
11,313 |
|
|
|
5,324 |
|
| Net investment income allocated from the Operating Company |
|
|
12,033 |
|
|
|
8,345 |
|
| Net realized and unrealized gains (losses) allocated from the Operating Company |
|
|
9,988 |
|
|
|
(4,235 |
) |
| Net change in unrealized (depreciation) appreciation of investment in the Operating Company |
|
|
(43 |
) |
|
|
6,221 |
|
| Net increase (decrease) in net assets resulting from operations |
|
|
21,978 |
|
|
|
10,331 |
|
|
|
|
| Per share data: |
|
|
|
|
|
|
|
|
| Net asset value |
|
$ |
14.10 |
|
|
$ |
13.60 |
|
| Net increase (decrease) in net assets resulting from operations (basic) |
|
|
1.75 |
|
|
|
0.97 |
|
| Net increase (decrease) in net assets resulting from operations (diluted) |
|
|
1.74 |
|
|
|
0.38 |
|
| Dividends paid(1) |
|
|
1.23 |
|
|
|
0.86 |
|
|
|
|
| Balance sheet data: |
|
|
|
|
|
|
|
|
| Total assets |
|
$ |
291,675 |
|
|
$ |
145,487 |
|
| Total net assets |
|
|
291,675 |
|
|
|
145,487 |
|
|
|
|
| Other data: |
|
|
|
|
|
|
|
|
| Total return at market value(2) |
|
|
20.27 |
% |
|
|
4.16 |
% |
| Total return at net asset value(3) |
|
|
13.06 |
% |
|
|
2.82 |
% |
| Weighted average shares outstanding for the period |
|
|
12,537,607 |
|
|
|
10,697,691 |
|
| (1) |
Dividends paid in the nine months ended September 30, 2012 include a special dividend related to estimated realized capital gains attributable to the Operating
Company’s investments in Lawson Software, Inc. and Infor Lux Bond Company. |
S-20
| (2) |
For the nine months ended September 30, 2012, total return is calculated assuming a purchase of common stock on the opening of the first day of the year and a sale on the
closing of the last business day of the period. For the period ended December 31, 2011, total return is calculated assuming a purchase of common stock at IPO and a sale on the closing of the last business day of the period. Dividends and
distributions, if any, are assumed for purposes of this calculation, to be reinvested at prices obtained under NMFC’s dividend reinvestment plan. |
| (3) |
For the nine months ended September 30, 2012, total return is calculated assuming a purchase at net asset value on the opening of the first day of the year and a sale at net
asset value on the last business day of the period. For the period ended December 31, 2011, total return is calculated assuming a purchase at net asset value on the opening of the first day of the period and a sale at net asset value on the
last day of the period. Dividends and distributions, if any, are assumed for purposes of this calculation, to be reinvested at the net asset value on the last day of the respective quarter. |
S-21
SELECTED QUARTERLY FINANCIAL DATA
The following table sets forth certain quarterly financial data for the quarters ended September 30, 2012, June 30, 2012 and
March 31, 2012 and for each of the quarters for the fiscal years ended December 31, 2011, December 31, 2010 and December 31, 2009 of the Operating Company and for the quarters ended September 30,
2012, June 30, 2012 and March 31, 2012 and for each of the quarters from May 19, 2011 (commencement of operations) through December 31, 2011 of NMFC. This data is derived from our unaudited financial statements. Results for
any quarter are not necessarily indicative of results for the full year or for any future quarter.
The below selected quarterly
financial data is for the Operating Company.
(in thousands except for per unit data)
|
|
|
|
|
|
|
|
|
|
|
|
|
|
|
|
|
|
|
|
|
|
|
|
|
|
|
|
|
|
|
|
|
| |
|
Investment Income |
|
|
Net Investment
Income |
|
|
Total Net Realized
Gains and
Net Changes
in Unrealized
Appreciation
(Depreciation)
of
Investments |
|
|
Net Increase (Decrease) in
Capital Resulting
from Operations |
|
| Quarter Ended |
|
Total |
|
|
Per
Unit |
|
|
Total |
|
|
Per
Unit |
|
|
Total |
|
|
Per
Unit |
|
|
Total |
|
|
Per
Unit |
|
| September 30, 2012 |
|
$ |
21,752 |
|
|
$ |
0.60 |
|
|
$ |
10,136 |
|
|
$ |
0.28 |
|
|
$ |
12,109 |
|
|
$ |
0.34 |
|
|
$ |
22,245 |
|
|
$ |
0.62 |
|
| June 30, 2012 |
|
|
20,299 |
|
|
|
0.66 |
|
|
|
11,646 |
|
|
|
0.38 |
|
|
|
(561 |
) |
|
|
(0.02 |
) |
|
|
11,085 |
|
|
|
0.36 |
|
| March 31, 2012 |
|
|
19,022 |
|
|
|
0.62 |
|
|
|
9,913 |
|
|
|
0.32 |
|
|
|
13,754 |
|
|
|
0.45 |
|
|
|
23,667 |
|
|
|
0.77 |
|
|
|
|
|
|
|
|
|
|
| December 31, 2011 |
|
$ |
17,127 |
|
|
$ |
0.55 |
|
|
$ |
9,540 |
|
|
$ |
0.31 |
|
|
$ |
8,317 |
|
|
$ |
0.27 |
|
|
$ |
17,857 |
|
|
$ |
0.58 |
|
| September 30, 2011 |
|
|
15,069 |
|
|
|
0.49 |
|
|
|
10,002 |
|
|
|
0.32 |
|
|
|
(21,255 |
) |
|
|
(0.68 |
) |
|
|
(11,253 |
) |
|
|
(0.36 |
) |
| June 30, 2011 |
|
|
13,116 |
|
|
|
0.42 |
|
|
|
9,554 |
|
|
|
0.31 |
|
|
|
(899 |
) |
|
|
(0.03 |
) |
|
|
8,655 |
|
|
|
0.28 |
|
| March 31, 2011 |
|
|
11,212 |
|
|
|
N/A |
|
|
|
9,429 |
|
|
|
N/A |
|
|
|
6,990 |
|
|
|
N/A |
|
|
|
16,419 |
|
|
|
N/A |
|
|
|
|
|
|
|
|
|
|
| December 31, 2010 |
|
$ |
9,820 |
|
|
|
N/A |
|
|
$ |
8,335 |
|
|
|
N/A |
|
|
$ |
7,978 |
|
|
|
N/A |
|
|
$ |
16,313 |
|
|
|
N/A |
|
| September 30, 2010 |
|
|
13,881 |
|
|
|
N/A |
|
|
|
13,145 |
|
|
|
N/A |
|
|
|
5,560 |
|
|
|
N/A |
|
|
|
18,705 |
|
|
|
N/A |
|
| June 30, 2010 |
|
|
8,597 |
|
|
|
N/A |
|
|
|
7,777 |
|
|
|
N/A |
|
|
|
(5,349 |
) |
|
|
N/A |
|
|
|
2,428 |
|
|
|
N/A |
|
| March 31, 2010 |
|
|
9,077 |
|
|
|
N/A |
|
|
|
8,208 |
|
|
|
N/A |
|
|
|
18,138 |
|
|
|
N/A |
|
|
|
26,346 |
|
|
|
N/A |
|
|
|
|
|
|
|
|
|
|
| December 31, 2009 |
|
$ |
7,617 |
|
|
|
N/A |
|
|
$ |
6,617 |
|
|
|
N/A |
|
|
$ |
1,617 |
|
|
|
N/A |
|
|
$ |
8,234 |
|
|
|
N/A |
|
| September 30, 2009 |
|
|
6,148 |
|
|
|
N/A |
|
|
|
6,030 |
|
|
|
N/A |
|
|
|
33,709 |
|
|
|
N/A |
|
|
|
39,739 |
|
|
|
N/A |
|
| June 30, 2009 |
|
|
5,092 |
|
|
|
N/A |
|
|
|
4,877 |
|
|
|
N/A |
|
|
|
42,562 |
|
|
|
N/A |
|
|
|
47,439 |
|
|
|
N/A |
|
| March 31, 2009 |
|
|
2,910 |
|
|
|
N/A |
|
|
|
2,883 |
|
|
|
N/A |
|
|
|
27,385 |
|
|
|
N/A |
|
|
|
30,268 |
|
|
|
N/A |
|
N/A—Not applicable, as the Operating Company was not unitized until May 19, 2011.
S-22
The below selected quarterly financial data is for NMFC.
(in thousands except for per share data)
|
|
|
|
|
|
|
|
|
|
|
|
|
|
|
|
|
|
|
|
|
|
|
|
|
| |
|
Net Investment
Income allocated
from the Operating
Company |
|
|
Total Net
Realized and Unrealized
Gains (Losses) |
|
|
Net Increase
(Decrease) in Net Assets
Resulting from
Operations |
|
| Quarter Ended |
|
Total |
|
|
Per Share |
|
|
Total |
|
|
Per Share |
|
|
Total |
|
|
Per Share |
|
| September 30, 2012 |
|
$ |
4,574 |
|
|
$ |
0.28 |
|
|
$ |
5,381 |
|
|
$ |
0.34 |
|
|
$ |
9,955 |
|
|
$ |
0.62 |
|
| June 30, 2012 |
|
|
4,029 |
|
|
|
0.38 |
|
|
|
(194 |
) |
|
|
(0.02 |
) |
|
|
3,835 |
|
|
|
0.36 |
|
| March 31, 2012 |
|
|
3,430 |
|
|
|
0.32 |
|
|
|
4,758 |
|
|
|
0.45 |
|
|
|
8,188 |
|
|
|
0.77 |
|
|
|
|
|
|
|
|
| December 31, 2011 |
|
$ |
3,301 |
|
|
$ |
0.31 |
|
|
$ |
2,877 |
|
|
$ |
0.27 |
|
|
$ |
6,178 |
|
|
$ |
0.58 |
|
| September 30, 2011 |
|
|
3,460 |
|
|
|
0.32 |
|
|
|
(7,353 |
) |
|
|
(0.68 |
) |
|
|
(3,893 |
) |
|
|
(0.36 |
) |
| June 30, 2011 |
|
|
1,584 |
|
|
|
0.15 |
|
|
|
6,462 |
|
|
|
0.60 |
|
|
|
8,046 |
|
|
|
0.75 |
|
| March 31, 2011 |
|
|
N/A |
|
|
|
N/A |
|
|
|
N/A |
|
|
|
N/A |
|
|
|
N/A |
|
|
|
N/A |
|
N/A—Not applicable, as NMFC did not commence operations until May 19, 2011.
S-23
CAUTIONARY STATEMENT REGARDING FORWARD-LOOKING STATEMENTS
This prospectus supplement contains forward-looking statements that involve substantial risks and uncertainties. These
forward-looking statements are not historical facts, but rather are based on current expectations, estimates and projections about us, the Operating Company’s current and prospective portfolio investments, our industry, our beliefs, and our
assumptions. Words such as “anticipates”, “expects”, “intends”, “plans”, “believes”, “seeks”, “estimates”, “would”, “should”, “targets”,
“projects”, and variations of these words and similar expressions are intended to identify forward-looking statements. The forward-looking statements contained in this prospectus supplement involve risks and uncertainties, including
statements as to:
| |
Ÿ |
|
the preliminary estimates of our net asset value |
| |
Ÿ |
|
our future operating results; |
| |
Ÿ |
|
the Operating Company’s business prospects and the prospects of its portfolio companies; |
| |
Ÿ |
|
the impact of investments that the Operating Company expects to make; |
| |
Ÿ |
|
our contractual arrangements and relationships with third parties; |
| |
Ÿ |
|
the dependence of our future success on the general economy and its impact on the industries in which we invest; |
| |
Ÿ |
|
the ability of the Operating Company’s portfolio companies to achieve their objectives; |
| |
Ÿ |
|
the Operating Company’s expected financings and investments; |
| |
Ÿ |
|
the adequacy of our cash resources and working capital; and |
| |
Ÿ |
|
the timing of cash flows, if any, from the operations of the Operating Company’s portfolio companies. |
These statements are not guarantees of future performance and are subject to risks, uncertainties, and other factors, some of which are beyond our
control and difficult to predict and could cause actual results to differ materially from those expressed or forecasted in the forward-looking statements, including without limitation:
| |
Ÿ |
|
an economic downturn could impair the Operating Company’s portfolio companies’ ability to continue to operate, which could lead to the loss of some or
all of the Operating Company’s investments in such portfolio companies; |
| |
Ÿ |
|
a contraction of available credit and/or an inability to access the equity markets could impair our lending and investment activities;
|
| |
Ÿ |
|
interest rate volatility could adversely affect our results, particularly if we elect to use leverage as part of our investment strategy;
|
| |
Ÿ |
|
currency fluctuations could adversely affect the results of the Operating Company’s investments in foreign companies, particularly to the extent that we
receive payments denominated in foreign currency rather than U.S. dollars; and |
| |
Ÿ |
|
the risks, uncertainties and other factors we identify in “Risk Factors” and elsewhere in this prospectus supplement, the accompanying prospectus and
in our filings with the SEC. |
Although we believe that the assumptions on which these forward-looking statements are
based are reasonable, any of those assumptions could prove to be inaccurate, and as a result, the forward-looking statements based on those assumptions also could be inaccurate. Important assumptions include the Operating Company’s ability to
originate new loans and investments, certain margins and
S-24
levels of profitability and the availability of additional capital. In light of these and other uncertainties, the inclusion of a projection or forward-looking statement in this prospectus
supplement should not be regarded as a representation by us that our plans and objectives will be achieved. These risks and uncertainties include those described or identified in “Risk Factors” and elsewhere in this prospectus supplement
and the accompanying prospectus. You should not place undue reliance on these forward-looking statements, which apply only as of the date of this prospectus supplement. However, we will update this prospectus supplement to reflect any material
changes to the information contained herein. The forward-looking statements and projections contained in this prospectus supplement are excluded from the safe harbor protection provided by Section 27A of the Securities Act of 1933, as amended,
or the Securities Act.
S-25
CAPITALIZATION
The following table sets forth our capitalization as of September 30, 2012:
| |
Ÿ |
|
on an actual basis; and |
| |
Ÿ |
|
on an as adjusted basis to give effect to the sale of 3,000,000 shares of NMFC’s common stock in this offering at an assumed public offering price of
$15.18 per share (the last reported closing price of NMFC’s common stock on November 30, 2012), after deducting the estimated underwriting discounts and commissions of approximately $1.8 million (excluding the sales load borne by the
Investment Adviser) and estimated offering expenses of approximately $0.2 million payable by the Operating Company. |
You should read this table together with “Use of Proceeds” and financial statements and related notes thereto included elsewhere in this
prospectus supplement and the accompanying prospectus.
|
|
|
|
|
|
|
|
|
| |
|
As of
September 30, 2012 |
|
| |
|
Actual |
|
|
As
Adjusted
(unaudited) |
|
| |
|
(in thousands) |
|
| Assets: |
|
|
|
|
|
|
|
|
| Cash and cash equivalents |
|
$ |
12,671 |
|
|
$ |
12,671 |
|
| Investments at fair value |
|
|
858,884 |
|
|
|
858,884 |
|
| Other assets |
|
|
15,273 |
|
|
|
15,092 |
|
|
|
|
|
|
|
|
|
|
| Total assets |
|
$ |
886,828 |
|
|
$ |
886,647 |
|
|
|
|
|
|
|
|
|
|
|
|
|
| Liabilities: |
|
|
|
|
|
|
|
|
| Credit facilities payable |
|
$ |
335,665 |
|
|
$ |
292,128 |
|
| Other liabilities |
|
|
30,808 |
|
|
|
30,627 |
|
|
|
|
|
|
|
|
|
|
| Total liabilities |
|
$ |
366,473 |
|
|
$ |
322,755 |
|
|
|
|
|
|
|
|
|
|
| Net assets |
|
$ |
520,355 |
|
|
$ |
563,892 |
|
|
|
|
|
|
|
|
|
|
|
|
|
| Stockholders’ equity: |
|
|
|
|
|
|
|
|
| Common stock, par value $0.01 per share; 100,000,000 shares authorized, 39,912,573 shares outstanding |
|
|
|
|
|
$ |
399 |
|
| Capital in excess of par value |
|
|
|
|
|
|
563,493 |
|
|
|
|
|
|
|
|
|
|
| Total stockholders’ equity |
|
|
|
|
|
$ |
563,892 |
|
|
|
|
|
|
|
|
|
|
S-26
USE OF PROCEEDS
We estimate that we will receive net proceeds from the sale of the 3,000,000 shares of NMFC’s common stock in this offering of approximately
$43.5 million (using the last reported closing price of NMFC’s common stock on November 30, 2012 of $15.18 per share), after deducting estimated offering expenses of approximately $0.2 million payable by the Operating Company and
underwriting discounts and commissions of approximately $1.8 million. In addition, the Investment Adviser has agreed to bear an additional $ of commissions in connection
with this offering, which will not be subject to reimbursement by either NMFC or the Operating Company.
The Operating Company intends
to use the net proceeds from this offering primarily for new investments in portfolio companies in accordance with the Operating Company’s investment objective and strategies described in this prospectus supplement and the accompanying
prospectus. The Operating Company may also use a portion of the net proceeds for other general corporate purposes, including to temporarily repay indebtedness (which will be subject to reborrowing), and other working capital needs. The Operating
Company is continuously identifying, reviewing and, to the extent consistent with its investment objective, funding new investments. As a result, we typically raise capital as we deem appropriate to fund such new investments.
We expect the Operating Company to substantially invest the net proceeds of this offering by the end of the calendar year, depending on the
availability of attractive opportunities and market conditions. However, we can offer no assurance that we will be able to achieve this goal.
Proceeds not immediately used for new investments or the temporary repayment of debt will be invested primarily in cash, cash equivalents, U.S. government securities and other high-quality investments that mature
in one year or less from the date of investment. These temporary investments are expected to provide a lower net return than we hope to achieve from the Operating Company’s target investments.
S-27
PRICE RANGE OF COMMON STOCK AND DISTRIBUTIONS
NMFC’s common stock is traded on the New York Stock Exchange (“NYSE”) under the symbol “NMFC”. The following table sets
forth the net asset value (“NAV”) per share of NMFC’s common stock, the high and low closing sale price for NMFC’s common stock, the closing sale price as a percentage of NAV and the quarterly dividend distributions per share for
each fiscal quarter since NMFC’s IPO on May 19, 2011.
|
|
|
|
|
|
|
|
|
|
|
|
|
|
|
|
|
|
|
|
|
|
|
|
|
| Fiscal Year Ended |
|
NAV
Per Share(2) |
|
|
Closing Sales
Price(4) |
|
|
Premium or
Discount of
High Sales to
NAV(5) |
|
|
Premium or
Discount of
Low Sales to
NAV(5) |
|
|
Declared
Dividends
Per Share(6) |
|
| |
|
High |
|
|
Low |
|
|
|
|
| December 31, 2012 |
|
|
|
|
|
|
|
|
|
|
|
|
|
|
|
|
|
|
|
|
|
|
|
|
| Fourth Quarter(1) |
|
|
|
* |
|
$ |
15.18 |
|
|
$ |
13.75 |
|
|
|
|
* |
|
|
|
* |
|
$ |
0.34 |
|
| Third Quarter |
|
$ |
14.10 |
|
|
$ |
15.50 |
|
|
$ |
14.18 |
|
|
|
9.93 |
% |
|
|
0.57 |
% |
|
$ |
0.34 |
|
| Second Quarter |
|
$ |
13.83 |
|
|
$ |
14.29 |
|
|
$ |
13.28 |
|
|
|
3.33 |
% |
|
|
(3.98 |
)% |
|
$ |
0.57 |
(8) |
| First Quarter |
|
$ |
14.05 |
|
|
$ |
13.75 |
|
|
$ |
13.14 |
|
|
|
(2.14 |
)% |
|
|
(6.48 |
)% |
|
$ |
0.32 |
|
| December 31, 2011(2) |
|
|
|
|
|
|
|
|
|
|
|
|
|
|
|
|
|
|
|
|
|
|
|
|
| Fourth Quarter |
|
$ |
13.60 |
|
|
$ |
13.41 |
|
|
$ |
12.27 |
|
|
|
(1.40 |
)% |
|
|
(9.78 |
)% |
|
$ |
0.30 |
|
| Third Quarter |
|
$ |
13.32 |
|
|
$ |
13.37 |
|
|
$ |
10.77 |
|
|
|
0.38 |
% |
|
|
(19.14 |
)% |
|
$ |
0.29 |
|
| Second Quarter(7) |
|
$ |
14.25 |
|
|
$ |
13.55 |
|
|
$ |
12.35 |
|
|
|
(4.91 |
)% |
|
|
(13.33 |
)% |
|
$ |
0.27 |
|
| (1) |
Period from October 1, 2012 through November 30, 2012. |
| (2) |
NMFC was not unitized until the IPO date of May 19, 2011. |
| (3) |
NAV is determined as of the last date in the relevant quarter and therefore may not reflect the NAV per share on the date of the high and low sales prices. The NAVs shown are
based on outstanding shares at the end of each period. |
| (4) |
Closing sales price is determined as the high or low closing sales price noted within the respective quarter, not adjusted for dividends. |
| (5) |
Calculated as of the respective high or low sales price divided by the quarter end NAV. |
| (6) |
Represents the dividend paid for the specified quarter. |
| (7) |
Period from May 19, 2011 through June 30, 2011 (excludes IPO price of $13.75). |
| (8) |
Includes a special dividend of $0.23 per share payable on May 31, 2012 and a second quarter dividend of $0.34 per share payable on June 29, 2012.
|
| * |
Not determinable at the time of filing. |
On
November 30, 2012, the last reported sales price of NMFC’s common stock was $15.18 per share. As of September 30, 2012, the Operating Company had two record holders, which were NMFC and AIV Holdings, whereas NMFC had approximately 17
stockholders of record and approximately three beneficial owners whose shares are held in the names of brokers, dealers, funds, trusts and clearing agencies. The Operating Company is not a publicly traded entity.
Shares of BDCs may trade at a market price that is less than the value of the net assets attributable to those shares. The possibility that
NMFC’s shares of common stock will trade at a discount from net asset value or at premiums that are unsustainable over the long term are separate and distinct from the risk that our net asset value will decrease. Since NMFC’s initial
public offering on May 19, 2011, NMFC’s shares of common stock have traded at times at a discount to the net assets attributable to those shares. As of November 30, 2012, NMFC’s shares of common stock traded at a premium of
approximately 7.7% of the net asset value attributable to those shares as of September 30, 2012. It is not possible to predict whether the shares offered hereby will trade at, above, or below net asset value.
S-28
Since NMFC is a holding company, distributions will be paid on NMFC’s common stock from
distributions received from the Operating Company. The Operating Company intends to make distributions to its unit holders that will be sufficient to enable NMFC to pay quarterly distributions to NMFC’s stockholders and to maintain NMFC’s
status as a regulated investment company. NMFC intends to distribute approximately its entire portion of the Operating Company’s Adjusted Net Investment Income on a quarterly basis and substantially its entire portion of the Operating
Company’s taxable income on an annual basis, except that they may retain certain net capital gains for reinvestment.
NMFC has
adopted an “opt out” dividend reinvestment plan on behalf of its stockholders, whereas NMFC stockholders’ cash dividends will be automatically reinvested in additional shares of NMFC’s common stock, unless the stockholder elects
to receive cash. Cash dividends reinvested in additional shares of NMFC’s common stock will be automatically reinvested by NMFC into additional units of the Operating Company.
NMFC applies the following in implementing the dividend reinvestment plan. If the price at which newly issued shares are to be credited to
stockholders’ accounts is greater than 110.0% of the last determined net asset value of the shares, NMFC will use only newly issued shares to implement its dividend reinvestment plan. Under such circumstances, the number of shares to be issued
to a stockholder is determined by dividing the total dollar amount of the distribution payable to such stockholder by the market price per share of NMFC’s common stock on the NYSE on the distribution payment date. Market price per share on that
date will be the closing price for such shares on the NYSE or, if no sale is reported for such day, the average of their electronically reported bid and asked prices. If NMFC uses newly issued shares to implement the plan, NMFC will receive, on a
one-for-one basis, additional units of the Operating Company in exchange for cash distributions that are reinvested in shares of NMFC’s common stock under the dividend reinvestment plan.
If the price at which newly issued shares are to be credited to stockholders’ accounts is less than 110.0% of the last determined net asset
value of the shares, NMFC will either issue new shares or instruct the plan administrator to purchase shares in the open market to satisfy the additional shares required. Shares purchased in open market transactions by the plan administrator will be
allocated to a stockholder based on the average purchase price, excluding any brokerage charges or other charges, of all shares of common stock purchased in the open market. The number of shares of NMFC’s common stock to be outstanding after
giving effect to payment of the distribution cannot be established until the value per share at which additional shares will be issued has been determined and elections of NMFC’s stockholders have been tabulated.
The following table reflects the cash distributions, including dividends and returns of capital, if any, per unit/share that have been declared by
the Operating Company’s board of directors, and subsequently NMFC’s board of directors, since NMFC’s IPO:
|
|
|
|
|
|
|
| Date Declared |
|
Record Date |
|
Payment Date |
|
Amount |
| August 8, 2012 |
|
September 14, 2012 |
|
September 28, 2012 |
|
$0.34 |
| May 8, 2012 |
|
June 15, 2012 |
|
June 29, 2012 |
|
0.34 |
| May 8, 2012(1) |
|
May 21, 2012 |
|
May 31, 2012 |
|
0.23 |
| March 7, 2012 |
|
March 15, 2012 |
|
March 30, 2012 |
|
0.32 |
|
|
|
|
| November 8, 2011 |
|
December 15, 2011 |
|
December 30, 2011 |
|
$0.30 |
| August 10, 2011 |
|
September 15, 2011 |
|
September 30, 2011 |
|
0.29 |
| August 10, 2011 |
|
August 22, 2011 |
|
August 31, 2011 |
|
0.27 |
|
|
|
|
|
|
|
| Total |
|
|
|
|
|
$2.09 |
|
|
|
|
|
|
|
S-29
| (1) |
Special dividend related to estimated realized capital gains attributable to the Operating Company’s investments in Lawson Software, Inc. and Infor Lux Bond Company.
|
Tax characteristics of all dividends paid by NMFC are reported to stockholders on Form 1099 after the end of the calendar
year. Future quarterly dividends, if any, for the New Mountain Finance Entities will be determined by their respective board of directors.
S-30
MANAGEMENT’S DISCUSSION AND ANALYSIS OF FINANCIAL CONDITION AND
RESULTS OF OPERATIONS
The information contained in this section should be read in conjunction with the Selected Financial and Other
Data and our Financial Statements and notes thereto appearing elsewhere in this prospectus supplement and the accompanying prospectus. In addition to historical information, the following discussion and other parts of this prospectus supplement and
the accompanying prospectus contain forward-looking information that involves risks and uncertainties. Our actual results could differ materially from those anticipated by such forward-looking information due to the factors discussed under
“Risk Factors” appearing in the accompanying prospectus and “Cautionary Statement Regarding Forward-Looking Statements” appearing elsewhere in this prospectus supplement.
Overview
The Operating
Company is a Delaware limited liability company. The Operating Company is externally managed and has elected to be treated as a business development company (“BDC”) under the Investment Company Act of 1940, as amended (the “1940
Act”). As such, The Operating Company is obligated to comply with certain regulatory requirements. The Operating Company intends to be treated as a partnership for federal income tax purposes for so long as it has at least two members.
The Operating Company is externally managed by the Investment Adviser. New Mountain Finance Administration, L.L.C. (the
“Administrator”) provides the administrative services necessary for operations. The Investment Adviser and Administrator are wholly-owned subsidiaries of New Mountain Capital (defined as New Mountain Capital Group, L.L.C. and its
affiliates). New Mountain Capital is a firm with a track record of investing in the middle market and with assets under management (which includes amounts committed, not all of which have been drawn down and invested to date) totaling approximately
$9.0 billion as of September 30, 2012. New Mountain Capital focuses on investing in defensive growth companies across its private equity, public equity, and credit investment vehicles. The Operating Company, formerly known as New Mountain
Guardian (Leveraged), L.L.C., was originally formed as a subsidiary of New Mountain Guardian AIV, L.P. (“Guardian AIV”) by New Mountain Capital in October 2008. Guardian AIV was formed through an allocation of approximately $300.0
million of the $5.1 billion of commitments supporting New Mountain Partners III, L.P., a private equity fund managed by New Mountain Capital. In February 2009, New Mountain Capital formed a co-investment vehicle, New Mountain Guardian Partners,
L.P., comprising $20.4 million of commitments. New Mountain Guardian (Leveraged), L.L.C. and New Mountain Guardian Partners, L.P., together with their respective direct and indirect wholly- owned subsidiaries, are defined as the “Predecessor
Entities”.
NMFC is a Delaware corporation that was originally incorporated on June 29, 2010. NMFC is a closed-end,
non-diversified management investment company that has elected to be treated as a BDC under the 1940 Act. As such, NMFC is obligated to comply with certain regulatory requirements. NMFC has elected to be treated, and intends to comply with the
requirements to continue to qualify annually, as a regulated investment company (“RIC”) under Subchapter M of the Internal Revenue Code of 1986, as amended, (the “Code”).
AIV Holdings is a Delaware corporation that was originally incorporated on March 11, 2011. Guardian AIV, a Delaware limited partnership, is
AIV Holdings’ sole stockholder. AIV Holdings is a closed-end, non-diversified management investment company that has elected to be treated as a BDC under the 1940 Act. As such, AIV Holdings is obligated to comply with certain regulatory
requirements. AIV Holdings has elected to be treated, and intends to comply with the requirements to continue to qualify annually, as a RIC under the Code.
S-31
On May 19, 2011, NMFC priced its initial public offering (the “IPO”) of 7,272,727
shares of common stock at a public offering price of $13.75 per share. Concurrently with the closing of the IPO and at the public offering price of $13.75 per share, NMFC sold an additional 2,172,000 shares of its common stock to certain executives
and employees of, and other individuals affiliated with, New Mountain Capital in a concurrent private placement (the “Concurrent Private Placement”). Additionally, 1,252,964 shares were issued to the limited partners of New Mountain
Guardian Partners, L.P. at that time for their ownership interest in the Predecessor Entities. In connection with NMFC’s IPO and through a series of transactions, the Operating Company owns all of the operations of the Predecessor Entities,
including all of the assets and liabilities related to such operations.
On July 10, 2012, NMFC’s shelf registration statement
became effective. On July 17, 2012, NMFC completed a public offering of 5,250,000 shares of its common stock at a public offering price of $14.35 per share. In connection with the offering, the underwriters purchased an additional 676,802
shares with the exercise of the overallotment option to purchase up to an additional 787,500 shares of common stock. As a result of this public offering, NMFC and AIV Holdings owned approximately 45.1% and 54.9%, respectively, of the units of the
Operating Company.
On September 28, 2012, NMFC completed an underwritten secondary public offering of 4,000,000 shares of its
common stock at a public offering price of $15.00 per share on behalf of a selling stockholder, AIV Holdings. No shares were sold by NMFC, and it did not receive any proceeds from this secondary public offering. The Operating Company and NMFC did
not bear any expenses in connection with this offering. The offering expenses were borne by the selling stockholder, AIV Holdings. After completion of this underwritten secondary public offering, NMFC and AIV Holdings owned approximately 56.0% and
44.0%, respectively, of the units of the Operating Company.
NMFC and AIV Holdings are holding companies with no direct operations of
their own, and their sole asset is their ownership in the Operating Company. NMFC and AIV Holdings each entered into a joinder agreement with respect to the Limited Liability Company Agreement, as amended and restated, of the Operating Company,
pursuant to which NMFC and AIV Holdings were admitted as members of the Operating Company. NMFC acquired from the Operating Company, with the gross proceeds of the IPO and the Concurrent Private Placement, common membership units (“units”)
of the Operating Company (the number of units are equal to the number of shares of NMFC’s common stock sold in the IPO and the Concurrent Private Placement). Additionally, NMFC received units of the Operating Company equal to the number of
shares of common stock of NMFC issued to the limited partners of New Mountain Guardian Partners, L.P. Guardian AIV was the parent of the Operating Company prior to the IPO and, as a result of the transactions completed in connection with the IPO,
obtained units in the Operating Company. Guardian AIV contributed its units in the Operating Company to its newly formed subsidiary, AIV Holdings, in exchange for common stock of AIV Holdings. AIV Holdings has the right to exchange all or any
portion of its units in the Operating Company for shares of NMFC’s common stock on a one-for-one basis.
As part of the third
quarter 2012 dividend payment, NMFC issued an additional 66,142 shares in conjunction with its dividend reinvestment plan at a price of $14.82. As of September 30, 2012, NMFC and AIV Holdings own approximately 56.1% and 43.9%, respectively, of
the units of the Operating Company.
The current structure was designed to generally prevent NMFC from being allocated taxable income
with respect to unrecognized gains that existed at the time of the IPO in the Predecessor Entities’ assets, and rather such amounts would be allocated generally to AIV Holdings. The result is that any distributions made to NMFC’s
stockholders that are attributable to such gains generally will not be treated as taxable dividends but rather as return of capital.
S-32
The diagram below depicts our current organizational structure (percentages are prior to this
offering).
The Operating Company’s investment objective is to generate current income and capital appreciation through
the sourcing and origination of debt securities at all levels of the capital structure, including first and second lien debt, notes, bonds and mezzanine securities. In some cases, the Operating Company’s investments may also include equity
interests. The primary focus is in the debt of defensive growth companies, which are defined as generally exhibiting the following characteristics: (i) sustainable secular growth drivers, (ii) high barriers to competitive entry,
(iii) high free cash flow after capital expenditure and working capital needs, (iv) high returns on assets and (v) opportunities for niche market dominance.
As of September 30, 2012, the Operating Company’s net asset value was $520.4 million and its portfolio had a fair value of approximately $858.9 million in 58 portfolio companies, with a weighted average
Yield to Maturity of approximately 9.9%. This Yield to Maturity calculation assumes that all investments not on non-accrual are purchased at fair value on September 30, 2012 and held until their respective maturities with no prepayments or
losses and exited at par at maturity. The actual yield to maturity may be higher or lower due to the future selection of the London Interbank Offered Rate (“LIBOR”) contracts by the individual companies in the Operating Company’s
portfolio or other factors.
S-33
Recent Developments
On November 6, 2012, the Operating Company’s board of directors, and subsequently NMFC’s board of directors, declared a fourth quarter 2012 distribution of $0.34 per unit/share payable on
December 28, 2012 to holders of record as of December 14, 2012.
Critical Accounting Policies
The preparation of financial statements and related disclosures in conformity with generally accepted accounting principles in the United States
(“GAAP”) requires management to make estimates and assumptions that affect the reported amounts of assets and liabilities, disclosure of contingent assets and liabilities at the date of the financial statements, and revenues and expenses
during the periods reported. Actual results could materially differ from those estimates. We have identified the following items as critical accounting policies.
Basis of Accounting
The Operating Company consolidates its wholly-owned subsidiary, NMF
SLF. NMFC does not consolidate the Operating Company. NMFC applies investment company master-feeder financial statement presentation, as described in Accounting Standards Codification 946, Financial Services—Investment Companies,
(“ASC 946”) to their interest in the Operating Company. NMFC observes that it is industry practice to follow the presentation prescribed for a Master Fund-Feeder Fund structure in ASC 946 in instances in which a Master Fund is owned by
more than one feeder fund and that such presentation provides stockholders of NMFC with a clearer depiction of their investment in the Master Fund.
Valuation and Leveling of Portfolio Investments
The Operating Company conducts the valuation of assets, pursuant to which its net asset value, and, consequently, NMFC’s net asset value is determined, at all times consistent with GAAP and the 1940 Act.
The Operating Company values its assets on a quarterly basis, or more frequently if required under the 1940 Act. In all cases, the
Operating Company’s board of directors is ultimately and solely responsible for determining the fair value of its portfolio investments on a quarterly basis in good faith, including investments that are not publicly traded, those whose market
prices are not readily available, and any other situation where its portfolio investments require a fair value determination. Security transactions are accounted for on a trade date basis. The Operating Company’s quarterly valuation procedures
are set forth in more detail below:
(1) Investments for which market quotations are readily available on an exchange are valued at such
market quotations based on the closing price indicated from independent pricing services.
(2) Investments for which indicative prices
are obtained from various pricing services and/or brokers or dealers are valued through a multi-step valuation process, as described below, to determine whether the quote(s) obtained is representative of fair value in accordance with GAAP.
a. Bond quotes are obtained through independent pricing services. Internal reviews are performed by the investment professionals of the
Investment Adviser to ensure that the quote obtained is representative of fair value in accordance with GAAP and if so, the quote is used. If the Investment Adviser is unable to sufficiently validate the quote(s) internally and if the
S-34
investment’s par value exceeds the materiality threshold, the investment is valued similarly to those assets with no readily available quotes (see (3) below);
b. For investments other than bonds, the investment professionals of the Investment Adviser look at the number of quotes readily available and
perform the following:
i. Investments for which two or more quotes are received from a pricing service are valued using the mean of the
mean of the bid and ask of the quotes obtained;
ii. Investments for which one quote is received from a pricing service are validated
internally. The investment professionals of the Investment Adviser analyze the market quotes obtained using an array of valuation methods (further described below) to validate the fair value. If the Investment Adviser is unable to sufficiently
validate the quote internally and if the investment’s par value exceeds the materiality threshold, the investment is valued similarly to those assets with no readily available quotes (see (3) below).
(3) Investments for which quotations are not readily available through exchanges, pricing services, brokers, or dealers are valued through a
multi-step valuation process:
a. Each portfolio company or investment is initially valued by the investment professionals of the
Investment Adviser responsible for the credit monitoring;
b. Preliminary valuation conclusions will then be documented and discussed
with the Operating Company’s senior management;
c. If an investment falls into (3) above for four consecutive quarters and if
the investment’s par value exceeds the materiality threshold, then at least once each fiscal year, the valuation for each portfolio investment for which the investment professionals of the Investment Adviser do not have a readily available
market quotation will be reviewed by an independent valuation firm engaged by the Operating Company’s board of directors.
d. Also,
when deemed appropriate by the Operating Company’s management, an independent valuation firm may be engaged to review and value investment(s) of a portfolio company, without any preliminary valuation being performed by the Investment
Adviser. The investment professionals of the Investment Adviser will review and validate the value provided.
Valuation methods may
include comparisons of financial ratios of the portfolio companies that issued such private securities to peer companies that are public, the nature of and the realizable value of any collateral, the portfolio company’s earnings, discounted
cash flows, the ability to make payments, the markets in which the portfolio company conducts business, and other relevant factors, including available market data such as relevant and applicable market trading and transaction comparables;
applicable market yields and multiples; security covenants; call protection provisions; information rights; comparable merger and acquisition transactions; and the principal market and enterprise values. When an external event such as a purchase
transaction, public offering or subsequent sale occurs, we will consider the pricing indicated by the external event to corroborate the private valuation.
The values assigned to investments are based upon available information and do not necessarily represent amounts which might ultimately be realized, since such amounts depend on future circumstances and cannot be
reasonably determined until the individual positions are liquidated. Due to the inherent uncertainty of determining the fair value of investments that do not have a readily available market value, the fair value of certain investments may fluctuate
from period to period.
S-35
GAAP fair value measurement guidance classifies the inputs used in measuring fair value into three
levels as follows:
Level I—Quoted prices (unadjusted) are available in active markets for identical investments and the Operating
Company has the ability to access such quotes as of the reporting date. The type of investments which would generally be included in Level I include active exchange-traded equity securities and exchange-traded derivatives. As required by Accounting
Standards Codification 820, Fair Value Measurements and Disclosures (“ASC 820”), the Operating Company, to the extent that we hold such investments, does not adjust the quoted price for these investments, even in situations where
the Operating Company holds a large position and a sale could reasonably impact the quoted price.
Level II—Pricing inputs are
observable for the investments, either directly or indirectly, as of the reporting date, but are not the same as those used in Level I. Level II inputs include the following:
| |
Ÿ |
|
Quoted prices for similar assets or liabilities in active markets; |
| |
Ÿ |
|
Quoted prices for identical or similar assets or liabilities in non-active markets (examples include corporate and municipal bonds, which trade infrequently);
|
| |
Ÿ |
|
Pricing models whose inputs are observable for substantially the full term of the asset or liability (examples include most over-the-counter derivatives,
including foreign exchange forward contracts); and |
| |
Ÿ |
|
Pricing models whose inputs are derived principally from or corroborated by observable market data through correlation or other means for substantially the full
term of the asset or liability. |
Level III—Pricing inputs are unobservable for the investment and include
situations where there is little, if any, market activity for the investment.
The inputs into the determination of fair value require
significant judgment or estimation by management. A review of the fair value hierarchy classifications is conducted on a quarterly basis. Changes in the observability of valuation inputs may result in the reclassification of certain investments
within the fair value hierarchy from period to period.
The following table summarizes the levels in the fair value hierarchy that the
Operating Company’s portfolio investments fall into as of September 30, 2012:
|
|
|
|
|
|
|
|
|
|
|
|
|
|
|
|
|
| (in thousands) |
|
|
|
|
|
|
|
|
|
|
|
|
| |
|
Total |
|
|
Level I |
|
|
Level II |
|
|
Level III |
|
| First lien |
|
$ |
516,697 |
|
|
$ |
— |
|
|
$ |
466,136 |
|
|
$ |
50,561 |
|
| Second lien |
|
|
306,001 |
|
|
|
— |
|
|
|
262,746 |
|
|
|
43,255 |
|
| Subordinated |
|
|
29,798 |
|
|
|
— |
|
|
|
22,259 |
|
|
|
7,539 |
|
| Equity and other |
|
|
6,388 |
|
|
|
— |
|
|
|
— |
|
|
|
6,388 |
|
|
|
|
|
|
|
|
|
|
|
|
|
|
|
|
|
|
| Total investments |
|
$ |
858,884 |
|
|
$ |
— |
|
|
$ |
751,141 |
|
|
$ |
107,743 |
|
|
|
|
|
|
|
|
|
|
|
|
|
|
|
|
|
|
NMFC is a holding company with no direct operations of its own, and its sole asset is its ownership in the
Operating Company. NMFC’s investment in the Operating Company is carried at fair value and represents the pro-rata interest in the net assets of the Operating Company as of the applicable reporting date. NMFC values its ownership interest on a
quarterly basis, or more frequently if required under the 1940 Act.
The Operating Company generally uses the following framework when
determining the fair value of investments where there are little, if any, market activity or observable pricing inputs.
S-36
Company Performance, Financial Review, and Analysis: Prior to
investment, as part of its due diligence process, the Operating Company evaluates the overall performance and financial stability of the portfolio company. Post investment, the Operating Company analyzes each portfolio company’s current
operating performance and relevant financial trends versus prior year and budgeted results, including, but not limited to, factors affecting its revenue and earnings before interest, taxes, depreciation, and amortization (“EBITDA”) growth,
margin trends, liquidity position, covenant
compliance and changes to its capital structure. The Operating Company also attempts to identify and
subsequently track any developments at the portfolio company, within its customer or vendor base or within the industry or the macroeconomic environment, generally, that may alter any material element of its original investment thesis. This analysis
is specific to each portfolio company. The Operating Company leverages the knowledge gained from its original due diligence process, augmented by this subsequent monitoring, to continually refine its outlook for each of its portfolio companies and
ultimately form the valuation of its investment in each portfolio company.
Market Based
Approach: The Operating Company typically estimates the total enterprise value of each portfolio company by utilizing market value cash flow (EBITDA) multiples of publicly traded comparable companies. The Operating
Company carefully considers numerous factors when selecting the appropriate companies whose trading multiples are used to value its portfolio companies. These factors include, but are not limited to, the type of organization, similarity to the
business being valued, relevant risk factors, as well as size, profitability and growth expectations. The Operating Company generally applies an average of various relevant comparable company EBITDA multiples to the portfolio company’s latest
twelve month (“LTM”) EBITDA or projected EBITDA to calculate portfolio company enterprise value. This is done in order to ensure that there is an appropriate level of value coverage for each investment. In applying the market based
approach as of September 30, 2012, the Operating Company used a relevant EBITDA range of 3.50x to 11.60x for first lien debt investments and 5.50x to 8.00x for second lien and subordinated debt investments to determine the enterprise value of
seven of its portfolio companies. The Operating Company believes this was a reasonable range in light of current comparable company trading levels and the specific companies involved.
Income Based Approach: The Operating Company also typically uses a discounted cash flow analysis to estimate
the fair value of the investment. Projected cash flows represent the relevant security’s contractual interest, fee and principal payments plus the assumption of full principal recovery at the investment’s expected maturity date. These cash
flows are discounted at a rate established utilizing a yield calibration approach, which incorporates changes in the credit quality (as measured by relevant statistics) of the portfolio company, as compared to changes in the yield associated with
comparable credit quality market indices, between the date of origination and the valuation date. In applying the income based approach as of September 30, 2012, the Operating Company used a discount range of 6.5% to 14.5% for first lien debt
investments, 11.5% to 13.1% for second lien debt investments and 17.0% to 22.1% for subordinated debt investments to value six of its portfolio companies.
Revenue Recognition
The Operating Company’s revenue recognition policies are as
follows:
Sales and paydowns of investments: Realized gains and losses on investments are determined on the
specific identification method.
Interest income: Interest income, including amortization of premium and discount
using the effective interest method, is recorded on the accrual basis and periodically assessed for collectability. Interest income also includes interest earned from cash on hand. Upon the prepayment of a loan or debt security, any prepayment
penalties are recorded as part of interest income. The Operating Company has loans in the portfolio that contain a payment-in-kind (“PIK”)
S-37
provision. PIK represents interest that is accrued and recorded as interest income at the contractual rates, added to the loan principal on the respective capitalization dates, and generally due
at maturity.
Non-accrual income: Loans are placed on non-accrual status when principal or interest payments are
past due 30 days or more and when there is reasonable doubt that principal or interest will be collected. Accrued cash and un-capitalized PIK interest is generally reversed when a loan is placed on non-accrual status. Previously capitalized PIK
interest is not reversed when an investment is placed on non-accrual status. Interest payments received on non-accrual loans may be recognized as income or applied to principal depending upon management’s judgment of the ultimate outcome.
Non-accrual loans are restored to accrual status when past due principal and interest is paid and, in management’s judgment, are likely to remain current.
Other income: Other income represents delayed compensation, consent or amendment fees, revolver fees and other miscellaneous fees received. Delayed compensation is income earned from counterparties on trades
that do not settle within a set number of business days after trade date.
NMFC’s revenue recognition policy is as follows:
Revenue, expenses, and capital gains (losses): At each quarterly valuation date, the Operating Company’s
investment income, expenses, net realized gains (losses), and net increase (decrease) in unrealized appreciation (depreciation) are allocated to NMFC based on its pro-rata interest in the net assets of the Operating Company. This is recorded on
NMFC’s Statements of Operations. Realized gains and losses are recorded upon sales of NMFC’s investments in the Operating Company. Net change in unrealized appreciation (depreciation) of investment in New Mountain Finance Holdings, L.L.C.
is the difference between the net asset value per share and the closing price per share for shares issued as part of the dividend reinvestment plan on the dividend payment date. This net change in unrealized appreciation (depreciation) of investment
in New Mountain Finance Holdings, L.L.C. includes the unrealized appreciation (depreciation) from the IPO. NMFC used the proceeds from its IPO and Concurrent Private Placement to purchase units in the Operating Company at $13.75 per unit (its IPO
price per share). At the IPO date, $13.75 per unit represented a discount to the actual net asset value per unit of the Operating Company. As a result, NMFC experienced immediate unrealized appreciation on its investment.
All expenses are paid and recorded by the Operating Company. Expenses are allocated to NMFC based on pro-rata ownership interest.
In addition, the Operating Company paid all of the offering costs related to the IPO. NMFC has recorded its portion of the offering costs excluding underwriters’ discounts or commissions as a direct reduction to net assets and the cost of its
investment in the Operating Company.
With respect to the expenses incident to any registration of shares of NMFC’s
common stock issued in exchange for units of the Operating Company, AIV Holdings is responsible for the expenses of any demand registration (including underwriters’ discounts or commissions) and their pro-rata share of any “piggyback”
registration expenses.
Monitoring of Portfolio Investments
The Operating Company monitors the performance and financial trends of its portfolio companies on at least a quarterly basis. The Operating Company
attempts to identify any developments at the portfolio company or within the industry or the macroeconomic environment that may alter any material element of its original investment strategy.
S-38
The Operating Company uses an investment rating system to characterize and monitor the credit profile
and expected level of returns on each investment in the portfolio. The Operating Company uses a four-level numeric rating scale as follows:
| |
Ÿ |
|
Investment Rating 1—Investment is performing materially above expectations; |
| |
Ÿ |
|
Investment Rating 2—Investment is performing materially in-line with expectations. All new loans are rated 2 at initial purchase;
|
| |
Ÿ |
|
Investment Rating 3—Investment is performing materially below expectations and risk has increased materially since the original investment; and
|
| |
Ÿ |
|
Investment Rating 4—Investment is performing substantially below expectations and risks have increased substantially since the original investment. Payments
may be delinquent. There is meaningful possibility that the Operating Company will not recoup its original cost basis in the investment and may realize a substantial loss upon exit. |
As of September 30, 2012, all investments in the Operating Company’s portfolio had an Investment Rating of 1 or 2 with the exception of
two portfolio company names; one with an Investment Rating of 3 and the other with an Investment Rating of 4. As of September 30, 2012, the Operating Company’s first lien positions in ATI Acquisition Company had an Investment Rating of 4
due to the underlying business encountering significant regulatory constraints which have led to the portfolio company’s underperformance. As of September 30, 2012, the Operating Company’s original first lien position in ATI
Acquisition Company remained on non-accrual status due to the inability of the portfolio company to service its interest payments for the quarter then ended and uncertainty about its ability to pay such amounts in the future. As of
September 30, 2012, this first lien debt investment had a cost basis of $4.3 million, a fair value of $0.3 million and total unearned interest income of $0.2 million and $0.5 million, respectively, for the three and nine months then
ended. Additionally, the Operating Company has two super priority first lien debt investments in ATI Acquisition Company with a combined cost basis of $1.6 million and a combined fair value of $1.1 million as of September 30, 2012. Unrealized
gains include a fee that the Operating Company would receive upon maturity of the two super priority first lien debt investments. During the third quarter of 2012, the Operating Company placed the super priority first lien positions on non-accrual
status as well, resulting in the aggregate reversal of accrued interest income of $0.2 million, of which $0.1 million was previously earned and accrued in prior periods (prior to the quarter ended September 30, 2012 and dating back to
October 1, 2011). No PIK was recorded during the quarter ended September 30, 2012 related to the two super priority first lien positions. As of September 30, 2012, the Operating Company’s total investment in ATI Acquisition
Company had an aggregate cost basis of $5.9 million and an aggregate fair value of $1.5 million, putting the entire ATI Acquisition Company positions on non-accrual.
Portfolio and Investment Activity
The fair value of the Operating Company’s investments
was approximately $858.9 million in 58 portfolio companies at September 30, 2012 and approximately $703.5 million in 55 portfolio companies at December 31, 2011. For the nine months ended September 30, 2012, the Operating Company
made approximately $392.2 million of new investments in 30 portfolio companies. For the nine months ended September 30, 2011, the Operating Company made approximately $354.2 million of new investments in 28 portfolio companies.
S-39
For the nine months ended September 30, 2012, the Operating Company had approximately
$190.5 million in debt repayments in existing portfolio companies and sales of securities in 13 portfolio companies aggregating approximately $77.9 million. In addition, during the nine months ended September 30, 2012, the Operating
Company had a change in unrealized appreciation on 43 portfolio companies totaling approximately $20.6 million, which was offset by a change in unrealized depreciation on 14 portfolio companies totaling approximately $9.9 million. For the nine
months ended September 30, 2011, the Operating Company had approximately $113.6 million in debt repayments in existing portfolio companies and sales of securities in 13 portfolio companies aggregating approximately $68.7 million. During the
nine months ended September 30, 2011, the Operating Company had a change in unrealized appreciation on seven portfolio companies totaling approximately $2.3 million, which was offset by a change in unrealized depreciation on 52 portfolio
companies totaling approximately $31.4 million.
At September 30, 2012, the Operating Company’s weighted average Yield to
Maturity was approximately 9.9%.
Results of Operations
Since NMFC is a holding company with no direct operations of its own, and its only business and sole asset is its ownership of common membership units of the Operating Company, NMFC’s results of operations is
based on the Operating Company’s results of operations.
Under GAAP, NMFC’s IPO did not step-up the cost basis of the
Operating Company’s existing investments to fair market value at the IPO date. Since the total value of the Operating Company’s investments at the time of the IPO was greater than the investments’ cost basis, a larger amount of
amortization of purchase or original issue discount, and different amounts in realized gain and unrealized appreciation, may be recognized under GAAP in each period than if the step-up had occurred. This will remain until such predecessor
investments are sold or mature in the future. The Operating Company tracks the transferred (or fair market) value of each of its investment as of the time of the IPO and, for purposes of the incentive fee calculation, adjusts income as if each
investment was purchased at the date of the IPO (or stepped up to fair market value). The respective “Adjusted Net Investment Income” (defined as net investment income adjusted to reflect income as if the cost basis of investments held at
the IPO date had stepped-up to fair market value as of the IPO date) is used in calculating both the incentive fee and dividend payments. The Operating Company also uses the transferred (or fair market) value of each of its investments as of the
time of the IPO to adjust capital gains (“Adjusted Realized Capital Gains”) or losses (“Adjusted Realized Capital Losses”) and unrealized capital appreciation (“Adjusted Unrealized Capital Appreciation”) and unrealized
capital depreciation (“Adjusted Unrealized Capital Depreciation”). See Item 1.—Financial Statements—Note 5, Agreements for additional details.
S-40
The following table for the Operating Company for the three months ended September 30, 2012 is
adjusted to reflect the step-up to fair market value and the allocation of the incentive fees related to hypothetical capital gains out of the adjusted post-incentive fee net investment income.
|
|
|
|
|
|
|
|
|
|
|
|
|
|
|
|
|
| (in thousands) |
|
|
|
|
|
|
|
|
|
|
|
|
|
|
|
|
| |
|
Three months ended
September 30, 2012 |
|
|
Stepped-up Cost
Basis Adjustments |
|
|
Incentive Fee
Adjustments (1) |
|
|
Adjusted three
months ended
September 30, 2012 |
|
| Investment income |
|
|
|
|
|
|
|
|
|
|
|
|
|
|
|
|
| Interest income |
|
$ |
21,362 |
|
|
$ |
(806 |
) |
|
$ |
— |
|
|
$ |
20,556 |
|
| Dividend income |
|
|
215 |
|
|
|
|
|
|
|
|
|
|
|
215 |
|
| Other income |
|
|
175 |
|
|
|
— |
|
|
|
— |
|
|
|
175 |
|
|
|
|
|
|
|
|
|
|
|
|
|
|
|
|
|
|
| Total investment income |
|
|
21,752 |
|
|
|
(806 |
) |
|
|
— |
|
|
|
20,946 |
|
|
|
|
|
|
|
|
|
|
|
|
|
|
|
|
|
|
| Total expenses pre-incentive fee |
|
|
6,055 |
|
|
|
— |
|
|
|
— |
|
|
|
6,055 |
|
|
|
|
|
|
|
|
|
|
|
|
|
|
|
|
|
|
| Pre-Incentive Fee Net Investment Income |
|
|
15,697 |
|
|
|
(806 |
) |
|
|
— |
|
|
|
14,891 |
|
|
|
|
|
|
|
|
|
|
|
|
|
|
|
|
|
|
| Incentive fee |
|
|
5,561 |
|
|
|
— |
|
|
|
(2,583 |
) |
|
|
2,978 |
|
|
|
|
|
|
|
|
|
|
|
|
|
|
|
|
|
|
| Post-Incentive Fee Net Investment Income |
|
|
10,136 |
|
|
|
(806 |
) |
|
|
2,583 |
|
|
|
11,913 |
|
|
|
|
|
|
|
|
|
|
|
|
|
|
|
|
|
|
| Net realized gains on investments |
|
|
1,615 |
|
|
|
(168 |
) |
|
|
— |
|
|
|
1,447 |
|
| Net change in unrealized appreciation of investments |
|
|
10,494 |
|
|
|
974 |
|
|
|
— |
|
|
|
11,468 |
|
| Capital gains incentive fees |
|
|
— |
|
|
|
— |
|
|
|
(2,583 |
) |
|
|
(2,583 |
) |
|
|
|
|
|
|
|
|
|
|
|
|
|
|
|
|
|
| Net increase in capital resulting from operations |
|
$ |
22,245 |
|
|
|
|
|
|
|
|
|
|
$ |
22,245 |
|
|
|
|
|
|
|
|
|
|
|
|
|
|
|
|
|
|
| (1) |
For the three months ended September 30, 2012, the Operating Company incurred total incentive fees of $5.6 million, of which $2.6 million related to capital gains incentive
fees on a hypothetical liquidation basis. |
For the three months ended September 30, 2012, the Operating Company had a
$0.8 million adjustment to interest income for amortization, a decrease of $0.2 million to net realized gains and an increase of $1.0 million to net change in unrealized appreciation to adjust for the stepped-up cost basis of the transferred
investments as discussed above. For the three months ended September 30, 2012, total adjusted interest income of $20.5 million consisted of approximately $18.1 million in cash interest from investments, approximately $0.5 million in
payment-in-kind interest from investments, approximately $1.2 million in prepayment fees and net amortization of purchase premiums/discounts and origination fees of approximately $0.7 million. The Operating Company’s Adjusted Net Investment
Income was $11.9 million for the three months ended September 30, 2012.
The following table for the Operating Company for the nine
months ended September 30, 2012 is adjusted to reflect the step-up to fair market value and the allocation of the incentive fees related to hypothetical capital gains out of the adjusted post-incentive fee net investment income.
S-41
|
|
|
|
|
|
|
|
|
|
|
|
|
|
|
|
|
| (in thousands) |
|
|
|
|
|
|
|
|
|
|
|
|
| |
|
Nine months ended
September 30, 2012 |
|
|
Stepped-up Cost
Basis Adjustments |
|
|
Incentive Fee
Adjustments(1) |
|
|
Adjusted
nine months
ended
September 30, 2012 |
|
| Investment income |
|
|
|
|
|
|
|
|
|
|
|
|
|
|
|
|
| Interest income |
|
$ |
60,087 |
|
|
$ |
(2,654 |
) |
|
$ |
— |
|
|
$ |
57,433 |
|
| Other income |
|
|
771 |
|
|
|
— |
|
|
|
— |
|
|
|
771 |
|
| Dividend income |
|
|
215 |
|
|
|
— |
|
|
|
— |
|
|
|
215 |
|
|
|
|
|
|
|
|
|
|
|
|
|
|
|
|
|
|
| Total investment income |
|
|
61,073 |
|
|
|
(2,654 |
) |
|
|
— |
|
|
|
58,419 |
|
|
|
|
|
|
|
|
|
|
|
|
|
|
|
|
|
|
| Total expenses pre-incentive fee |
|
|
17,684 |
|
|
|
— |
|
|
|
— |
|
|
|
17,684 |
|
|
|
|
|
|
|
|
|
|
|
|
|
|
|
|
|
|
| Pre-Incentive Fee Net Investment Income |
|
|
43,389 |
|
|
|
(2,654 |
) |
|
|
— |
|
|
|
40,735 |
|
|
|
|
|
|
|
|
|
|
|
|
|
|
|
|
|
|
| Incentive fee |
|
|
11,694 |
|
|
|
— |
|
|
|
(3,547 |
) |
|
|
8,147 |
|
|
|
|
|
|
|
|
|
|
|
|
|
|
|
|
|
|
| Post-Incentive Fee Net Investment Income |
|
|
31,695 |
|
|
|
(2,654 |
) |
|
|
3,547 |
|
|
|
32,588 |
|
|
|
|
|
|
|
|
|
|
|
|
|
|
|
|
|
|
| Net realized gains on investments |
|
|
14,591 |
|
|
|
(5,386 |
) |
|
|
— |
|
|
|
9,205 |
|
| Net change in unrealized appreciation of investments |
|
|
10,710 |
|
|
|
8,040 |
|
|
|
— |
|
|
|
18,750 |
|
| Capital gains incentive fees |
|
|
— |
|
|
|
— |
|
|
|
(3,547 |
) |
|
|
(3,547 |
) |
|
|
|
|
|
|
|
|
|
|
|
|
|
|
|
|
|
| Net increase in capital resulting from operations |
|
$ |
56,996 |
|
|
|
|
|
|
|
|
|
|
$ |
56,996 |
|
|
|
|
|
|
|
|
|
|
|
|
|
|
|
|
|
|
| (1) |
For the nine months ended September 30, 2012, the Operating Company incurred total incentive fees of $11.7 million, of which $3.5 million related to capital gains incentive
fees on a hypothetical liquidation basis. |
For the nine months ended September 30, 2012, the Operating Company had a
$2.7 million adjustment to interest income for amortization, a decrease of $5.4 million to net realized gains and an increase of $8.0 million to net change in unrealized appreciation to adjust for the stepped-up cost basis of the transferred
investments as discussed above. For the nine months ended September 30, 2012, total adjusted interest income of $57.4 million consisted of approximately $51.4 million in cash interest from investments, approximately $1.6 million in
payment-in-kind interest from investments, approximately $2.5 million in prepayment fees and net amortization of purchase premiums/discounts and origination fees of approximately $1.9 million. The Operating Company’s Adjusted Net Investment
Income was $32.6 million for the nine months ended September 30, 2012.
In accordance with GAAP, for the nine months ended
September 30, 2012, the Operating Company accrued $3.5 million of hypothetical capital gains incentive fee based upon the cumulative net Adjusted Realized Capital Gains and Adjusted Realized Capital Losses and the cumulative net Adjusted
Unrealized Capital Appreciation and Adjusted Unrealized Capital Depreciation on investments held at the end of each period. Actual amounts paid to the Investment Adviser are consistent with the Investment Management Agreement and are based only on
actual Adjusted Realized Capital Gains computed net of all Adjusted Realized Capital Losses and Adjusted Unrealized Capital Depreciation on a cumulative basis from inception through the end of each calendar year as if the entire portfolio was
S-42
sold at fair value. As of September 30, 2012, no actual capital gains incentive fee was owed under the Investment Management Agreement, as cumulative net Adjusted Realized Gains did not
exceed cumulative Adjusted Unrealized Depreciation.
Results of Operations for the Operating Company for the
Three Months Ended September 30, 2012 and September 30, 2011
Revenue
|
|
|
|
|
|
|
|
|
|
|
|
|
| (in thousands) |
|
Three months ended |
|
|
Percent
Change |
|
| |
|
September 30, 2012 |
|
|
September 30, 2011 |
|
|
| Interest income |
|
$ |
21,362 |
|
|
$ |
14,861 |
|
|
|
44 |
% |
| Dividend income |
|
|
215 |
|
|
|
— |
|
|
|
N/A |
|
| Other income |
|
|
175 |
|
|
|
208 |
|
|
|
(16 |
)% |
|
|
|
|
|
|
|
|
|
|
|
|
|
| Total investment income |
|
$ |
21,752 |
|
|
$ |
15,069 |
|
|
|
|
|
|
|
|
|
|
|
|
|
|
|
|
|
|
The Operating Company’s total investment income increased by $6.7 million for the three months ended
September 30, 2012 as compared to the three months ended September 30, 2011. The increase in investment income from the three months ended September 30, 2011 to the three months ended September 30, 2012 was primarily attributable
to larger invested balances, driven by the proceeds of the IPO on May 19, 2011, the proceeds from the July 2012 offering, and the Operating Company’s use of leverage from its revolving credit facilities to originate new investments.
Additionally during the three months ended September 30, 2012, the Operating Company received a distribution on its warrant membership interest in YP Equity Investors LLC.
Operating Expenses
|
|
|
|
|
|
|
|
|
|
|
|
|
| (in thousands) |
|
Three months ended |
|
|
Percent
Change |
|
| |
|
September 30, 2012 |
|
|
September 30, 2011 |
|
|
| Incentive fee(1) |
|
$ |
5,561 |
|
|
$ |
701 |
|
|
|
693 |
% |
| Management fee |
|
|
2,768 |
|
|
|
1,930 |
|
|
|
43 |
% |
| Interest and other credit facility expenses |
|
|
2,402 |
|
|
|
1,686 |
|
|
|
42 |
% |
| Professional fees |
|
|
233 |
|
|
|
55 |
|
|
|
324 |
% |
| Other expenses |
|
|
652 |
|
|
|
695 |
|
|
|
(6 |
)% |
|
|
|
|
|
|
|
|
|
|
|
|
|
| Total operating expenses |
|
$ |
11,616 |
|
|
$ |
5,067 |
|
|
|
|
|
|
|
|
|
|
|
|
|
|
|
|
|
|
| (1) |
For the three months ended September 30, 2012, the total incentive fees incurred of $5.6 million included $2.6 million related to capital gains incentive fees on a
hypothetical liquidation basis. |
The Operating Company’s total operating expenses increased by $6.5 million for
the three months ended September 30, 2012 as compared to the three months ended September 30, 2011. Interest and other credit facility expenses increased by $0.7 million during the three months ended September 30, 2012, primarily
due to the increase of average debt outstanding from $32.7 million to $105.8 million for the Holdings Credit Facility and from $152.0 million to $184.1 million for the SLF Credit Facility for the three months ended September 30,
2011 compared to September 30, 2012. As of September 30, 2012, the Operating Company incurred $10.6 thousand in other expenses that was not subject to the expense cap pursuant to the Administration Agreement, as amended and restated, and
further restricted by the Operating Company.
S-43
Additionally, the Operating Company’s management fees and incentive fees increased by $0.8
million and $4.9 million, respectively, for the three months ended September 30, 2012 as compared to the three months ended September 30, 2011. The increase in management and incentive fees from the three months ended September 30,
2011 to the three months ended September 30, 2012 was attributable to larger invested balances, driven by the proceeds of the IPO on May 19, 2011, the proceeds from the July 2012 offering, and the Operating Company’s use of
leverage from its revolving credit facilities to originate new investments. As a result of the net increase in Adjusted Realized Capital Gains (Losses) and Adjusted Unrealized Capital Appreciation (Depreciation), the Operating Company’s capital
gains incentive fees accrual for the quarter increased from $1.0 million as of June 30, 2012 to $3.5 million as of September 30, 2012, accounting for $2.6 million of the $5.6 million total incentive fees for the three months ended
September 30, 2012.
Net Realized Gains and Net Change in Unrealized (Depreciation) Appreciation
|
|
|
|
|
|
|
|
|
|
|
|
|
| (in thousands) |
|
Three months ended |
|
|
Percent
Change |
|
| |
|
September 30, 2012 |
|
|
September 30, 2011 |
|
|
| Net realized gains on investments |
|
$ |
1,615 |
|
|
$ |
1,402 |
|
|
|
15 |
% |
| Net change in unrealized (depreciation) appreciation of investments |
|
|
10,494 |
|
|
|
(22,657 |
) |
|
|
146 |
% |
|
|
|
|
|
|
|
|
|
|
|
|
|
| Total net realized gains and net change in unrealized (depreciation) appreciation of investments |
|
$ |
12,109 |
|
|
$ |
(21,255 |
) |
|
|
|
|
|
|
|
|
|
|
|
|
|
|
|
|
|
The Operating Company’s net realized and unrealized gains or losses resulted in a net gain of $12.1 million
for the three months ended September 30, 2012 compared to a net loss of $21.3 million for the same period in 2011. We look at net realized and unrealized gains or losses together as movement in unrealized appreciation or depreciation can be the
result of realizations. The net gain for the three months ended September 30, 2012 was primarily driven by the overall increase in the market prices of the Operating Company’s investments during the period. The net loss for the three
months ended September 30, 2011 was primarily driven by the overall decline in market prices during the period.
Results of
Operations for the Operating Company for the Nine months Ended
September 30, 2012 and September 30, 2011
Revenue
|
|
|
|
|
|
|
|
|
|
|
|
|
| (in thousands) |
|
Nine months ended |
|
|
Percent
Change |
|
| |
|
September 30, 2012 |
|
|
September 30, 2011 |
|
|
| Interest income |
|
$ |
60,087 |
|
|
$ |
38,839 |
|
|
|
55 |
% |
| Other income |
|
|
771 |
|
|
|
558 |
|
|
|
38 |
% |
| Dividend income |
|
|
215 |
|
|
|
— |
|
|
|
N/A |
|
|
|
|
|
|
|
|
|
|
|
|
|
|
| Total investment income |
|
$ |
61,073 |
|
|
$ |
39,397 |
|
|
|
|
|
|
|
|
|
|
|
|
|
|
|
|
|
|
The Operating Company’s total investment income increased by $21.7 million for the nine months ended
September 30, 2012 as compared to the nine months ended September 30, 2011. The increase in investment income from the nine months ended September 30, 2011 to the nine months ended
S-44
September 30, 2012 was primarily attributable to larger invested balances, driven by the proceeds of the IPO on May 19, 2011, the proceeds from the July 2012 offering, and the
Operating Company’s use of leverage from its revolving credit facilities to originate new investments. In the nine months ended September 30, 2012, the Operating Company’s other income increased due to commitment fees received
associated with the closing of its two bridge facilities held as of December 31, 2011 and fees received associated with the early repayments or partial repayments of 10 different portfolio companies held by the Operating Company as of
December 31, 2011. Additionally during the three months ended September 30, 2012, the Operating Company received a distribution on its warrant membership interest in YP Equity Investors LLC.
Operating Expenses
|
|
|
|
|
|
|
|
|
|
|
|
|
| (in thousands) |
|
Nine months ended |
|
|
Percent
Change |
|
| |
|
September 30, 2012 |
|
|
September 30, 2011 |
|
|
| Incentive fee(1) |
|
$ |
11,694 |
|
|
$ |
1,205 |
|
|
|
870 |
% |
| Management fee |
|
|
7,887 |
|
|
|
2,738 |
|
|
|
188 |
% |
| Interest and other credit facility expenses |
|
|
7,286 |
|
|
|
4,767 |
|
|
|
53 |
% |
| Professional fees |
|
|
743 |
|
|
|
625 |
|
|
|
19 |
% |
| Other expenses |
|
|
1,768 |
|
|
|
1,076 |
|
|
|
64 |
% |
|
|
|
|
|
|
|
|
|
|
|
|
|
| Total operating expenses |
|
$ |
29,378 |
|
|
$ |
10,411 |
|
|
|
|
|
|
|
|
|
|
|
|
|
|
|
|
|
|
| (1) |
For the nine months ended September 30, 2012, the total incentive fees incurred of $11.7 million included $3.5 million related to capital gains incentive fees on a
hypothetical liquidation basis. |
The Operating Company’s total operating expenses increased by $19.0 million for
the nine months ended September 30, 2012 as compared to the nine months ended September 30, 2011. Interest and other credit facility expenses increased by $2.5 million during the nine months ended September 30, 2012, primarily
due to the increase of average debt outstanding from $46.7 million to $122.9 million for the Holdings Credit Facility and from $123.0 million to $174.8 million for the SLF Credit Facility for the nine months ended September 30,
2011 compared to September 30, 2012. As of September 30, 2012, the Operating Company incurred $10.6 thousand in other expenses that was not subject to the expense cap pursuant to the Administration Agreement, as amended and restated, and
further restricted by the Operating Company.
Additionally, the Operating Company’s management fees and incentive fees increased by
$5.1 million and $10.5 million, respectively, for the nine months ended September 30, 2012 as compared to the nine months ended September 30, 2011. The increase in management and incentive fees from the nine months ended September 30,
2011 to the nine months ended September 30, 2012 was attributable to larger invested balances, driven by the proceeds of the IPO on May 19, 2011, the proceeds from the July 2012 offering, and the Operating Company’s use of
leverage from its revolving credit facilities to originate new investments. As a result of the net increase in Adjusted Realized Capital Gains (Losses) and Adjusted Unrealized Capital Appreciation (Depreciation), a capital gains incentive fees
accrual of $3.5 million was booked for the nine months ended September 30, 2012. No capital gains incentive fees were booked for the nine months ended September 30, 2011. As a result of the IPO on May 19, 2011, the Operating Company
pays management fees and incentive fees under its Investment Management Agreement, which provides a different basis for the calculation of these fees as compared to amounts previously paid prior to the completion of the IPO. Prior to the IPO, an
affiliate of the Predecessor Entities paid a majority of the management and incentive fees. In addition, historical operating expenses do not reflect the allocation of certain professional fees, administrative
S-45
and other expenses that have been incurred following the completion of the IPO. Accordingly, the Operating Company’s historical operating expenses are not comparable to its operating
expenses after the completion of the IPO.
Net Realized Gains and Net Change in Unrealized (Depreciation) Appreciation
|
|
|
|
|
|
|
|
|
|
|
|
|
| (in thousands) |
|
Nine months ended |
|
|
Percent
Change |
|
| |
|
September 30, 2012 |
|
|
September 30, 2011 |
|
|
| Net realized gains on investments |
|
$ |
14,591 |
|
|
$ |
13,955 |
|
|
|
5 |
% |
| Net change in unrealized appreciation (depreciation) of investments |
|
|
10,710 |
|
|
|
(29,119 |
) |
|
|
137 |
% |
|
|
|
|
|
|
|
|
|
|
|
|
|
| Total net realized gains and net change in unrealized (depreciation) appreciation of investments |
|
$ |
25,301 |
|
|
$ |
(15,164 |
) |
|
|
|
|
|
|
|
|
|
|
|
|
|
|
|
|
|
The Operating Company’s net realized and unrealized gains or losses resulted in a net gain of $25.3 million
for the nine months ended September 30, 2012 compared to a net loss of $15.2 million for the same period in 2011. We look at net realized and unrealized gains or losses together as movement in unrealized appreciation or depreciation can be the
result of realizations. The net gain for the nine months ended September 30, 2012 was primarily related to the overall increase in the market and the quality of the Operating Company’s portfolio, directly impacting the prices of the
Operating Company’s portfolio. The net gain was driven by the appreciation of the Operating Company’s portfolio and the sale or repayment of investments with fair values in excess of December 31, 2011 valuations, resulting in net
realized gains being greater than the reversal of the cumulative net unrealized gains for those investments. The net loss for the nine months ended September 30, 2011 was primarily driven by the depreciation of our portfolio as a result of the
overall decline in market prices.
Liquidity and Capital Resources
The primary use of existing funds and any funds raised in the future is expected to be for the Operating Company’s repayment of indebtedness,
the Operating Company’s investments in portfolio companies, cash distributions to the Operating Company’s unit holders or for other general corporate purposes.
Guardian AIV and New Mountain Guardian Partners, L.P. contributed a portfolio to the Operating Company in connection with the IPO of NMFC, receiving 20,221,938 units of the Operating Company and 1,252,964
shares of NMFC, respectively. On May 19, 2011, NMFC priced its initial offering of 7,272,727 shares of common stock at a public offering price of $13.75 per share. Concurrently with the closing of the IPO and at the public offering price of
$13.75 per share, NMFC sold an additional 2,172,000 shares of its common stock to certain executives and employees of, and other individuals affiliated with, New Mountain Capital in the Concurrent Private Placement. NMFC used the gross proceeds from
the IPO and Concurrent Private Placement to acquire units in the Operating Company.
On July 10, 2012, NMFC’s shelf
registration statement became effective. On July 17, 2012, NMFC completed a public offering of 5,250,000 shares of its common stock at a public offering price of $14.35 per share. In connection with this offering, the underwriters purchased an
additional 676,802 shares with the exercise of the overallotment option to purchase up to an additional 787,500 shares of common stock.
S-46
On September 28, 2012, NMFC completed an underwritten secondary public offering of 4,000,000
shares of its common stock at a public offering price of $15.00 per share on behalf of a selling stockholder, AIV Holdings. No shares were sold by NMFC, and it did not receive any proceeds from this secondary public offering. The Operating Company
and NMFC did not bear any expenses in connection with the offering. The offering expenses were borne by the selling stockholder, AIV Holdings.
The Operating Company’s liquidity is generated and generally available through advances from the revolving credit facilities, from cash flows from operations, and, we expect, through periodic follow-on equity
offerings of NMFC.
At September 30, 2012 and December 31, 2011, the Operating Company had cash and cash equivalents of
approximately $12.7 million and $15.3 million, respectively. Cash (used in) operating activities for the nine months ended September 30, 2012 and September 30, 2011 was approximately $(83.8) million and $(252.0) million, respectively.
We expect that all current liquidity needs by the Operating Company will be met with cash flows from operations and other activities.
Credit
Facilities
Holdings Credit Facility—The Loan and Security Agreement, as amended and restated, dated May 19,
2011 (the “Holdings Credit Facility”) among the Operating Company as the Borrower and Collateral Administrator, Wells Fargo Securities, L.L.C. as the Administrative Agent, and Wells Fargo Bank, National Association, as the Collateral
Custodian, is structured as a revolving credit facility and matures on October 27, 2016, as amended on May 8, 2012. The maximum amount of revolving borrowings available under the Holdings Credit Facility is $185.0 million, as amended on
August 7, 2012. The Operating Company is permitted to borrow up to 45.0% or 25.0% of the purchase price of pledged first lien or non-first lien debt securities, and up to 67.0% and 45.0% of the purchase price of specified first lien debt
securities and specified non-first lien debt securities, respectively, subject to approval by Wells Fargo Bank, National Association. The credit facility is collateralized by all of the investments of the Operating Company on an investment by
investment basis. All fees associated with the origination or upsizing of the Holdings Credit Facility are capitalized on the Operating Company’s Consolidated Statement of Assets, Liabilities, and Members’ Capital and charged against
income as other credit facility expenses over the life of the Holdings Credit Facility. The Holdings Credit Facility contains certain customary affirmative and negative covenants and events of default, including the occurrence of a change in
control. In addition, the Holdings Credit Facility requires the Operating Company to maintain a minimum asset coverage ratio. However, the covenants are generally not tied to mark to market fluctuations in the prices of the Operating Company’s
investments, but rather to the performance of the underlying portfolio companies.
The Holdings Credit Facility (as well as the
Predecessor Credit Facility) bears interest at a rate of the London Interbank Offered Rate (“LIBOR”) plus 2.75% per annum, as amended on May 8, 2012, and charges a non-usage fee, based on the unused facility amount multiplied by
the Non-Usage Fee Rate (as defined in the credit agreement). Interest expense and non-usage fees were $0.8 million and $0.2 million, respectively, for the three months ended September 30, 2012. Interest expense and non-usage fees were $2.9
million and $0.3 million, respectively, for the nine months ended September 30, 2012. Interest expense and non-usage fees were $0.3 million and $0.2 million, respectively, for the three months ended September 30, 2011. Interest expense and
non-usage fees were $1.2 million and $0.5 million, respectively, for the nine months ended September 30, 2011. The weighted average interest rate for the nine months ended September 30, 2012 and September 30, 2011 was 3.1% and 3.2%,
respectively. The average debt outstanding for the nine months ended September 30, 2012 and September 30, 2011 was $122.9 million and $46.7 million, respectively. The outstanding balance as of September 30, 2012 and December 31,
2011 was $135.7 million and $129.0
S-47
million, respectively. As of September 30, 2012 and December 31, 2011, the Operating Company was in compliance with all financial and operational covenants required by the credit
facilities existing on such dates.
SLF Credit Facility—The Operating Company’s senior loan fund’s Loan and
Security Agreement, as amended and restated, dated October 27, 2010 (the “SLF Credit Facility”) among NMF SLF as the Borrower, the Operating Company as the Collateral Administrator, Wells Fargo Securities, L.L.C. as the Administrative
Agent, and Wells Fargo Bank, National Association, as the Collateral Custodian, is structured as a revolving credit facility and matures on October 27, 2016, as amended on May 8, 2012. The maximum amount of revolving borrowings available
under the SLF Credit Facility is $200.0 million, as amended on August 7, 2012. The loan is non-recourse to the Operating Company and secured by all assets owned by the borrower on an investment by investment basis. All fees associated with
the origination or upsizing of the SLF Credit Facility are capitalized on the Consolidated Statement of Assets, Liabilities, and Members’ Capital and charged against income as other credit facility expenses over the life of the SLF Credit
Facility. The SLF Credit Facility contains certain customary affirmative and negative covenants and events of default, including the occurrence of a change in control. The covenants are generally not tied to mark to market fluctuations in the prices
of our investments, but rather to the performance of the underlying portfolio companies.
The SLF Credit Facility permits borrowings of
up to 67.0% of the purchase price of pledged debt securities subject to approval by Wells Fargo Bank, National Association. Due to a fifth amendment to the SLF Credit Facility on October 27, 2011, NMF SLF is no longer restricted from the
purchase or sale of loans with an affiliate. Therefore, specified first lien loans can be moved as collateral between the Holdings Credit Facility and the SLF Credit Facility.
The SLF Credit Facility bears interest at a rate of LIBOR plus 2.00% per annum, as amended on May 8, 2012. A non-usage fee is paid, based on the unused facility amount multiplied by the Non-Usage Fee Rate
(as defined in the credit agreement). Interest expense and non-usage fees were $1.0 million and $7.4 thousand, respectively, for the three months ended September 30, 2012. Interest expense and non-usage fees were $3.1 million and $19.8
thousand, respectively, for the nine months ended September 30, 2012. Interest expense and non-usage fees were $1.0 million and $24.6 thousand, respectively, for the three months ended September 30, 2011. Interest expense and non-usage
fees were $2.3 million and $0.1 million, respectively, for the nine months ended September 30, 2011. The weighted average interest rate for the nine months ended September 30, 2012 and September 30, 2011 for the facility was 2.4% and
2.5%, respectively. The average debt outstanding for the nine months ended September 30, 2012 and September 30, 2011 was $174.8 million and $123.0 million, respectively. The outstanding balance as of September 30, 2012 and
December 31, 2011 was $200.0 million and $165.9 million, respectively. As of September 30, 2012 and December 31, 2011, NMF SLF was in compliance with all financial and operational covenants required by the SLF Credit Facility.
Off-Balance Sheet Arrangements
The Operating Company may become a party to financial instruments with off-balance sheet risk in the normal course of business to meet the financial needs of its portfolio companies. These instruments may include
commitments to extend credit and involve, to varying degrees, elements of liquidity and credit risk in excess of the amount recognized in the balance sheet. As of September 30, 2012 and December 31, 2011, the Operating Company had
outstanding commitments to third parties to fund investments totaling $13.9 million and $27.0 million, respectively, under various undrawn revolving credit facilities, delayed draw commitments or other future funding commitments.
S-48
The Operating Company may from time to time enter into financing commitment letters or bridge
financing commitments. As of September 30, 2012 and December 31, 2011, the Operating Company did not have any commitment letters to purchase debt investments. As of September 30, 2012 and December 31, 2011, the Operating Company
had bridge financing commitments in an aggregate par amount of $0 million and $35.0 million, respectively, which could require funding in the future.
Borrowings
The Operating Company had borrowings of $135.7 million and
$129.0 million outstanding as of September 30, 2012 and December 31, 2011, respectively, under the Holdings Credit Facility. The Operating Company had borrowings of $200.0 million and $165.9 million outstanding as of
September 30, 2012 and December 31, 2011, respectively, under the SLF Credit Facility.
Contractual Obligations
A summary of the Operating Company’s significant contractual payment obligations as of September 30, 2012 is as
follows:
|
|
|
|
|
|
|
|
|
|
|
|
|
|
|
|
|
|
|
|
|
| |
|
|
|
|
Contractual Obligations
Payments Due by Period
(in thousands) |
|
|
|
|
| |
|
Total |
|
|
Less than
1 Year |
|
|
1 - 3
Years |
|
|
3 - 5
Years |
|
|
More than
5 Years |
|
| Holdings Credit Facility(1) |
|
$ |
135,665 |
|
|
$ |
— |
|
|
$ |
— |
|
|
$ |
135,665 |
|
|
$ |
— |
|
| SLF Credit Facility(2) |
|
|
200,000 |
|
|
|
— |
|
|
|
— |
|
|
|
200,000 |
|
|
|
— |
|
|
|
|
|
|
|
|
|
|
|
|
|
|
|
|
|
|
|
|
|
|
| Total Contractual Obligations |
|
$ |
335,665 |
|
|
$ |
— |
|
|
$ |
— |
|
|
$ |
335,665 |
|
|
$ |
— |
|
|
|
|
|
|
|
|
|
|
|
|
|
|
|
|
|
|
|
|
|
|
| (1) |
Under the terms of the $185.0 million Holdings Credit Facility, all outstanding borrowings under that facility ($135.7 million as of September 30, 2012) must be
repaid on or before October 27, 2016. As of September 30, 2012, there was approximately $49.3 million of possible capacity remaining under the Holdings Credit Facility. |
| (2) |
Under the terms of the $200.0 million SLF Credit Facility, all outstanding borrowings under that facility ($200.0 million as of September 30, 2012) must be repaid
on or before October 27, 2016. As of September 30, 2012, there was zero of possible capacity remaining under the SLF Credit Facility. |
The Operating Company has certain contracts under which it has material future commitments. The Operating Company has $13.9 million of undrawn funding commitments as of September 30, 2012 related to its
participation as a lender in revolving credit facilities, delayed draw commitments or other future funding commitments of the Operating Company’s portfolio companies. As of September 30, 2012, the Operating Company did not enter into any
bridge financing commitments, which could require funding in the future.
We have entered into the Investment Management Agreement with
the Investment Adviser in accordance with the 1940 Act. Under the Investment Management Agreement, the Investment Adviser has agreed to provide the Operating Company with investment advisory and management services. We have agreed to pay for these
services (1) a management fee and (2) an incentive fee based on its performance.
We have also entered into an administration
agreement, as amended and restated (the “Administration Agreement”), with the Administrator. Under the Administration Agreement, the Administrator has agreed to arrange office space for us and provide office equipment and clerical,
S-49
bookkeeping and record keeping services and other administrative services necessary to conduct our respective day-to-day operations. The Administrator has also agreed to perform, or oversee the
performance of, our financial records, our reports to stockholders/unit holders and reports filed with the Securities and Exchange Commission.
If any of the contractual obligations discussed above are terminated, our costs under any new agreements that are entered into may increase. In addition, we would likely incur significant time and expense in
locating alternative parties to provide the services we expect to receive under the Investment Management Agreement and the Administration Agreement.
Distributions and Dividends
Dividends declared and paid to stockholders / unit holders
of the New Mountain Finance Entities for the nine months ended September 30, 2012 totaled $40.0 million. Tax characteristics of all dividends paid by NMFC and AIV Holdings are reported to stockholders on Form 1099 after the end of the
calendar year. Future quarterly dividends, if any, for the New Mountain Finance Entities will be determined by their respective board of directors.
The following table summarizes the Operating Company’s and NMFC’s quarterly cash distributions, including dividends and returns of capital, if any, per unit/share that have been declared by the Operating
Company’s board of directors, and subsequently NMFC’s board of directors, since NMFC’s IPO:
|
|
|
|
|
|
|
|
|
|
|
| Fiscal Year Ended |
|
Date Declared |
|
Record Date |
|
Payment Date |
|
Per Share/
Unit Amount |
|
| December 31, 2012 |
|
|
|
|
|
|
|
|
|
|
| Third Quarter |
|
August 8, 2012 |
|
September 14, 2012 |
|
September 28, 2012 |
|
$ |
0.34 |
|
| Second Quarter |
|
May 8, 2012 |
|
June 15, 2012 |
|
June 29, 2012 |
|
|
0.34 |
|
| Second Quarter(1) |
|
May 8, 2012 |
|
May 21, 2012 |
|
May 31, 2012 |
|
|
0.23 |
|
| First Quarter |
|
March 7, 2012 |
|
March 15, 2012 |
|
March 30, 2012 |
|
|
0.32 |
|
| December 31, 2011 |
|
|
|
|
|
|
|
|
|
|
| Fourth Quarter |
|
November 8, 2011 |
|
December 15, 2011 |
|
December 30, 2011 |
|
$ |
0.30 |
|
| Third Quarter |
|
August 10, 2011 |
|
September 15, 2011 |
|
September 30, 2011 |
|
|
0.29 |
|
| Second Quarter |
|
August 10, 2011 |
|
August 22, 2011 |
|
August 31, 2011 |
|
|
0.27 |
|
|
|
|
|
|
|
|
|
|
|
|
| Total |
|
|
|
|
|
|
|
$ |
2.09 |
|
|
|
|
|
|
|
|
|
|
|
|
| (1) |
Special dividend related to estimated realized capital gains attributable to the Operating Company’s investments in Lawson Software, Inc. and Infor Lux Bond Company.
|
Since NMFC is a holding company, all distributions on its common stock will be paid from distributions received from the
Operating Company. The Operating Company intends to make distributions to its unit holders that will be sufficient to enable NMFC to pay quarterly distributions to its stockholders and to maintain its status as a RIC. NMFC intends to distribute
approximately its entire portion of the Operating Company’s Adjusted Net Investment Income on a quarterly basis and substantially its entire portion of the Operating Company’s taxable income on an annual basis, except that it may retain
certain net capital gains for reinvestment.
NMFC maintains an “opt out” dividend reinvestment plan for its common
stockholders. As a result, if the Operating Company declares a dividend, then NMFC stockholders’ cash dividends will be automatically reinvested in additional shares of NMFC’s common stock, unless they specifically
“opt
S-50
out” of the dividend reinvestment plan so as to receive cash dividends. Cash dividends reinvested in additional shares of NMFC’s common stock will be automatically reinvested by NMFC in
the Operating Company in exchange for additional units of the Operating Company. See Item 1—Financial Statements—Note 2, Summary of Significant Accounting Policies for additional details regarding NMFC’s dividend
reinvestment plan.
Related Parties
The New Mountain Finance Entities have entered into a number of business relationships with affiliated or related parties, including the following:
| |
Ÿ |
|
Together, NMFC and AIV Holdings own all the outstanding units of the Operating Company. As of September 30, 2012, NMFC and AIV Holdings own approximately
56.1% and 43.9%, respectively, of the units of the Operating Company. |
| |
Ÿ |
|
The Operating Company has entered into the Investment Management Agreement with the Investment Adviser, a wholly-owned subsidiary of New Mountain Capital.
Therefore, New Mountain Capital is entitled to any profits earned by the Investment Adviser, which includes any fees payable to the Investment Adviser under the terms of the Investment Management Agreement, less expenses incurred by the Investment
Adviser in performing its services under the Investment Management Agreement. |
| |
Ÿ |
|
The New Mountain Finance Entities have entered into an Administration Agreement, with the Administrator, a wholly-owned subsidiary of New Mountain Capital. The
Administrator arranges office space for the New Mountain Finance Entities and provides office equipment and administrative services necessary to conduct their respective day-to-day operations pursuant to the Administration Agreement. The Operating
Company reimburses the Administrator for the allocable portion of overhead and other expenses incurred by it in performing its obligations to the New Mountain Finance Entities under the Administration Agreement, including rent, the fees and expenses
associated with performing administrative, finance, and compliance functions, and the compensation of the Operating Company’s chief financial officer and chief compliance officer and their respective staffs. Pursuant to the Administration
Agreement, as amended and restated, and further restricted by the Operating Company, expenses payable to the Administrator by the Operating Company as well as other direct and indirect expenses (excluding interest, other credit facility expense,
trading expenses and management and incentive fees) has been capped at $3.5 million for the time period from April 1, 2012 to March 31, 2013. |
| |
Ÿ |
|
The New Mountain Finance Entities, the Investment Adviser and the Administrator have entered into a royalty-free Trademark License Agreement, as amended, with
New Mountain Capital, pursuant to which New Mountain Capital has agreed to grant the New Mountain Finance Entities, the Investment Adviser and the Administrator, a non-exclusive, royalty-free license to use the name “New Mountain” and
“New Mountain Finance”. |
In addition, NMFC and the Operating Company have adopted a formal code of ethics
that governs the conduct of their respective officers and directors. These officers and directors also remain subject to the duties imposed by the 1940 Act, the Delaware General Corporation Law and the Delaware Limited Liability Company Act.
The Investment Adviser and its affiliates may also manage other funds in the future that may have investment mandates that are similar,
in whole and in part, with the Operating Company’s investment mandates. The Investment Adviser and its affiliates may determine that an investment is appropriate for the Operating Company and for one or more of those other funds. In such event,
S-51
depending on the availability of such investment and other appropriate factors, the Investment Adviser or its affiliates may determine that we should invest side-by-side with one or more other
funds. Any such investments will be made only to the extent permitted by applicable law and interpretive positions of the Securities and Exchange Commission and its staff, and consistent with the Investment Adviser’s allocation procedures.
Concurrently with the IPO, NMFC sold an additional 2,172,000 shares of its common stock to certain executives and employees of, and
other individuals affiliated with, New Mountain Capital in the Concurrent Private Placement.
S-52
UNDERWRITING
NMFC, the Operating Company and the underwriters named below have entered into an underwriting agreement with respect to the shares being offered.
Subject to certain conditions, each underwriter has severally agreed to purchase the number of shares indicated in the following table. Goldman, Sachs & Co. and Wells Fargo Securities, LLC are the representatives of the
underwriters.
|
|
|
|
|
| Underwriter |
|
Number
of Shares |
|
| Goldman, Sachs & Co. |
|
|
|
|
| Wells Fargo Securities, LLC |
|
|
|
|
| RBC Capital Markets, LLC |
|
|
|
|
| Stifel, Nicolaus & Company, Incorporated |
|
|
|
|
|
|
|
|
|
| Total |
|
|
3,000,000 |
|
|
|
|
|
|
The underwriters are committed to take and pay for all of the shares being offered, if any are taken, other than
the shares covered by the option described below unless and until this option is exercised.
If the underwriters sell more shares than
the total number set forth in the table above, the underwriters have an option to buy up to an additional 450,000 shares from NMFC. They may exercise that option for 30 days. If any shares are purchased pursuant to this option, the underwriters will
severally purchase shares in approximately the same proportion as set forth in the table above.
The following table shows the per share
and total underwriting discounts and commissions (sales load) to be paid to the underwriters by the Operating Company. Such amounts are shown assuming both no exercise and full exercise of the underwriters’ option to purchase 450,000 additional
shares. In addition, the Investment Adviser has agreed to bear an additional $ , or $ per share, and
$ , or $ per share, respectively, of commissions (sales load) in connection with this offering in the
event of no exercise and full exercise of the underwriters option to purchase 450,000 additional shares, which is not reflected in the following table.
|
|
|
|
|
|
|
|
|
| |
|
No Exercise |
|
|
Full Exercise |
|
| Per Share |
|
$ |
|
|
|
$ |
|
|
| Total |
|
$ |
|
|
|
$ |
|
|
Because the Financial Industry Regulatory Authority, or FINRA, views the common stock offered hereby as interests
in a direct participation program, the offering is being made in compliance with the requirements of FINRA Rule 2310. In compliance with such requirements, the underwriting discounts and commissions in connection with the sale of securities
will not exceed 10.0% of gross proceeds of this offering. Investor suitability with respect to the common stock should be judged similarly to suitability with respect to other securities that are listed for trading on a national securities exchange.
In the ordinary course of their various business activities, the underwriters and their respective affiliates may make or hold a broad
array of investments and actively trade debt and equity securities (or related derivative securities) and financial instruments (including bank loans) for their own account and for the accounts of their customers and may at any time hold long and
short positions in such securities and instruments. Such investment and securities activities may involve securities and instruments of the issuer. The underwriters and their respective affiliates may also make investment recommendations and/or
publish or express independent research views in respect of such securities or instruments and may at any time hold, or recommend to clients that they acquire, long and/or short positions in such securities and instruments.
S-53
Shares sold by the underwriters to the public will initially be offered at the public offering price
set forth on the cover of this prospectus supplement. Any shares sold by the underwriters to securities dealers may be sold at a discount of up to $ per
share from the public offering price. If all the shares are not sold at the initial offering price, the representatives may change the public offering price and the other selling terms. The offering of the shares by the underwriters is subject to
receipt and acceptance and subject to the underwriters’ right to reject any order in whole or in part.
NMFC, each of its officers
and directors, each of the members of the Investment Adviser’s investment committee and AIV Holdings have agreed with the underwriters, subject to certain exceptions, not to dispose of or hedge any shares of NMFC’s common stock or
securities convertible into or exchangeable for shares of NMFC’s common stock during the period from the date of this prospectus supplement continuing through the date 60 days after the date of this prospectus supplement, except with the
prior written consent of Goldman, Sachs & Co. and Wells Fargo Securities, LLC.
The 60 day restricted period
described in the preceding paragraph will be automatically extended if: (1) during the last 17 days of the 60 day restricted period the NMFC issues an earnings release or announce material news or a material event; or (2) prior to the
expiration of the 60 day restricted period, the NMFC announces that it will release earnings results during the 15-day period following the last day of the 60 day period, in which case the restrictions described in the preceding paragraph will
continue to apply until the expiration of the 18-day period beginning on the issuance of the earnings release of the announcement of the material news or material event.
NMFC’s common stock is listed on the New York Stock Exchange under the symbol “NMFC”.
In connection with the offering, the underwriters may purchase and sell shares of common stock in the open market. These transactions may include
short sales, stabilizing transactions and purchases to cover positions created by short sales. Short sales involve the sale by the underwriters of a greater number of shares than they are required to purchase in the offering. “Covered”
short sales are sales made in an amount not greater than the underwriters’ option to purchase additional shares from us in the offering. The underwriters may close out any covered short position by either exercising their option to purchase
additional shares or purchasing shares in the open market. In determining the source of shares to close out the covered short position, the underwriters will consider, among other things, the price of shares available for purchase in the open market
as compared to the price at which they may purchase additional shares pursuant to the option granted to them. “Naked” short sales are any sales in excess of such option. The underwriters must close out any naked short position by
purchasing shares in the open market. A naked short position is more likely to be created if the underwriters are concerned that there may be downward pressure on the price of the common stock in the open market after pricing that could adversely
affect investors who purchase in the offering. Stabilizing transactions consist of various bids for or purchases of common stock made by the underwriters in the open market prior to the completion of the offering.
The underwriters may also impose a penalty bid. This occurs when a particular underwriter repays to the underwriters a portion of the underwriting
discount received by it because the representatives have repurchased shares sold by or for the account of such underwriter in stabilizing or short covering transactions.
Purchases to cover a short position and stabilizing transactions, as well as other purchases by the underwriters for their own account, may have the effect of preventing or retarding a decline in the market price
of the company’s stock, and together with the imposition of the penalty bid, may stabilize, maintain or otherwise affect the market price of the common stock. As a result, the price of the common stock may be higher than the price that
otherwise might exist in the open market. If these activities are commenced, they may be discontinued at any time. These transactions may be effected on the New York Stock Exchange, in the over-the-counter market or otherwise.
S-54
The underwriters do not expect sales to discretionary accounts to exceed five percent of the total
number of shares offered.
We estimate that our share of the total expenses of the offering, excluding underwriting discounts and
commissions, will be approximately $181,254. The Operating Company will pay all of the expenses incurred by us in connection with this offering.
NMFC and the Operating Company have agreed to indemnify the several underwriters against certain liabilities, including liabilities under the Securities Act of 1933.
The underwriters and their respective affiliates are full-service financial institutions engaged in various activities, which may include
securities trading, commercial and investment banking, financial advisory, investment management, investment research, principal investment, hedging, financing and brokerage activities. Certain of the underwriters and their respective affiliates
may, from time to time, perform various financial advisory and investment banking services for the company, for which they will receive customary fees and expenses. In addition, an affiliate of Wells Fargo Securities, LLC is a lender under our
Credit Facilities.
In the ordinary course of their various business activities, the underwriters and their respective affiliates may
make or hold a broad array of investments and actively trade debt and equity securities (or related derivative securities) and financial instruments (including bank loans) for their own account and for the accounts of their customers and such
investment and securities activities may involve securities and/or instruments of the issuer. The underwriters and their respective affiliates may also make investment recommendations and/or publish or express independent research views in respect
of such securities or instruments and may at any time hold, or recommend to clients that they acquire, long and/or short positions in such securities and instruments.
The net proceeds from the sale of the shares of NMFC’s common stock in this offering are expected to be used to temporarily pay down outstanding indebtedness under the Credit Facilities and for general
corporate purposes. Affiliates of Wells Fargo Securities, LLC are lenders under the Credit Facilities. Accordingly, affiliates of Wells Fargo Securities, LLC may receive more than 5% of the net proceeds of this offering to the extent such proceeds
are used to temporarily repay outstanding indebtedness under the Credit Facilities.
The principal business address of Goldman,
Sachs & Co. is 200 West Street, New York, New York 10282 and the principal business address of Wells Fargo Securities, LLC is 375 Park Avenue, New York, New York 10152.
Each of the underwriters may arrange to sell common shares offered hereby in certain jurisdictions outside the United States, either directly or
through affiliates, where they are permitted to do so. In that regard, Wells Fargo Securities, LLC may arrange to sell shares in certain jurisdictions through an affiliate, Wells Fargo Securities International Limited, or WFSIL. WFSIL is a
wholly-owned indirect subsidiary of Wells Fargo & Company and an affiliate of Wells Fargo Securities, LLC. WFSIL is a United Kingdom incorporated investment firm regulated by the Financial Services Authority. Wells Fargo Securities is the
trade name for certain corporate and investment banking services of Wells Fargo & Company and its affiliates, including Wells Fargo Securities, LLC and WFSIL.
European Economic Area
Each underwriter has represented and agreed that, in relation to
each Member State of the European Economic Area which has implemented the Prospectus Directive (each, a “Relevant Member State”), with effect from and including the date on which the Prospectus Directive is implemented in that Relevant
Member State (the “Relevant Implementation Date”), it has not made and will not make an offer of shares to the public in that Relevant Member State prior to the publication of a prospectus in relation to the shares which has been approved
by the competent authority in that Relevant Member State or, where appropriate, approved in another Relevant Member State and notified to the competent authority in that Relevant Member State, all in accordance with the
S-55
Prospectus Directive, except that it may, with effect from and including the Relevant Implementation Date, make an offer of shares to the public in that Relevant Member State at any time:
(1) to any legal entity which is a qualified investor as defined in the Prospectus Directive;
(2) to fewer than 150 natural or legal persons (other than qualified investors as defined in the Prospectus Directive), subject to
obtaining the prior consent of the representative or representatives nominated by NMFC for any such offer; or
(3) in any
other circumstances falling within Article 3(2) of the Prospectus Directive,
provided that no such offer of shares shall require NMFC
or any underwriter to publish a prospectus pursuant to Article 3 of the Prospectus Directive.
For the purposes of this provision, the
expression an “offer of shares to the public” in relation to any shares in any Relevant Member State means the communication in any form and by any means of sufficient information on the terms of the offer and the shares to be offered so
as to enable an investor to decide to purchase or subscribe for the shares, as the same may be varied in that Relevant Member State by any measure implementing the Prospectus Directive in that Relevant Member State; “Prospectus Directive”
means European Council Directive 2003/71/EC (and amendments thereto, including the 2010 PD Amending Directive) and includes any relevant implementing measure in the Relevant Member State; and “2010 PD Amending Directive” means Directive
2010/73/EU.
United Kingdom
Each underwriter has represented and agreed that:
(a) it has only communicated or caused to be communicated and will only communicate or cause to be communicated an invitation or inducement to engage in investment activity (within the meaning of Section 21 of
the FSMA) received by it in connection with the issue or sale of the shares in circumstances in which Section 21(1) of the FSMA would not, if the Issuer was not an authorized person, apply to the Issuer; and
(b) it has complied and will comply with all applicable provisions of the FSMA with respect to anything done by it in relation to
the shares in, from or otherwise involving the United Kingdom.
Switzerland
This document does not constitute a prospectus within the meaning of Art. 652a of the Swiss Code of Obligations. The shares of common stock may not
be sold directly or indirectly in or into Switzerland except in a manner which will not result in a public offering within the meaning of the Swiss Code of Obligations. Neither this document nor any other offering materials relating to the shares of
common stock may be distributed, published or otherwise made available in Switzerland except in a manner which will not constitute a public offer of the shares of common stock in Switzerland.
Hong Kong
The shares may not be offered or sold by means of any document other than
(i) in circumstances which do not constitute an offer to the public within the meaning of the Companies Ordinance (Cap.32, Laws of Hong Kong), or (ii) to “professional investors” within the meaning of the Securities and Futures
Ordinance (Cap.571, Laws of Hong Kong) and any rules made thereunder, or (iii) in other circumstances which do not result in the document being a “prospectus” within the meaning of the Companies Ordinance (Cap.32, Laws of Hong Kong),
and no advertisement, invitation or document relating to the shares may be issued or may be in the possession of any person for the purpose of
S-56
issue (in each case whether in Hong Kong or elsewhere), which is directed at, or the contents of which are likely to be accessed or read by, the public in Hong Kong (except if permitted to do so
under the laws of Hong Kong) other than with respect to shares which are or are intended to be disposed of only to persons outside Hong Kong or only to “professional investors” within the meaning of the Securities and Futures Ordinance
(Cap. 571, Laws of Hong Kong) and any rules made thereunder.
Singapore
This prospectus has not been registered as a prospectus with the Monetary Authority of Singapore. Accordingly, this prospectus and any other
document or material in connection with the offer or sale, or invitation for subscription or purchase, of the shares may not be circulated or distributed, nor may the shares be offered or sold, or be made the subject of an invitation for
subscription or purchase, whether directly or indirectly, to persons in Singapore other than (i) to an institutional investor under Section 274 of the Securities and Futures Act, Chapter 289 of Singapore (the “SFA”), (ii) to
a relevant person, or any person pursuant to Section 275(1A), and in accordance with the conditions, specified in Section 275 of the SFA or (iii) otherwise pursuant to, and in accordance with the conditions of, any other applicable
provision of the SFA.
Where the shares are subscribed or purchased under Section 275 by a relevant person which is: (a) a
corporation (which is not an accredited investor) the sole business of which is to hold investments and the entire share capital of which is owned by one or more individuals, each of whom is an accredited investor; or (b) a trust (where the
trustee is not an accredited investor) whose sole purpose is to hold investments and each beneficiary is an accredited investor, shares, debentures and units of shares and debentures of that corporation or the beneficiaries’ rights and interest
in that trust shall not be transferable for 6 months after that corporation or that trust has acquired the shares under Section 275 except: (1) to an institutional investor under Section 274 of the SFA or to a relevant person, or any
person pursuant to Section 275(1A), and in accordance with the conditions, specified in Section 275 of the SFA; (2) where no consideration is given for the transfer; or (3) by operation of law.
Japan
The securities have not been
and will not be registered under the Financial Instruments and Exchange Law of Japan (the Financial Instruments and Exchange Law) and each underwriter has agreed that it will not offer or sell any securities, directly or indirectly, in Japan or to,
or for the benefit of, any resident of Japan (which term as used herein means any person resident in Japan, including any corporation or other entity organized under the laws of Japan), or to others for re-offering or resale, directly or indirectly,
in Japan or to a resident of Japan, except pursuant to an exemption from the registration requirements of, and otherwise in compliance with, the Financial Instruments and Exchange Law and any other applicable laws, regulations and ministerial
guidelines of Japan.
S-57
LEGAL MATTERS
Certain legal matters in connection with the securities offered hereby will be passed upon for us by Sutherland Asbill & Brennan LLP,
Washington, District of Columbia. Certain legal matters in connection with the securities offered hereby will be passed upon for the underwriters by Fried, Frank, Harris, Shriver & Jacobson LLP, New York, New York.
INDEPENDENT REGISTERED PUBLIC ACCOUNTING FIRM
With respect to the unaudited interim financial information of New Mountain Finance Holdings, L.L.C. as of September 30, 2012 and for the three and
nine month periods ended September 30, 2012 and 2011, and of New Mountain Finance Corporation and New Mountain Finance AIV Holdings Corporation as of September 30, 2012 and for the three and nine month periods then ended, the three months ended
September 30, 2011 and the period May 19, 2011 to September 30, 2011, which is included in this prospectus supplement, Deloitte & Touche LLP, an independent registered public accounting firm, has applied limited procedures in accordance
with the standards of the Public Company Accounting Oversight Board (United States) for a review of such information. However, as stated in their reports included in this prospectus supplement, they did not audit and they do not express an opinion
on that interim financial information. Accordingly, the degree of reliance on their reports on such information should be restricted in light of the limited nature of the review procedures applied. Deloitte & Touche LLP are not subject to
the liability provisions of Section 11 of the Securities Act of 1933 for their reports on the unaudited interim financial information because those reports are not “reports” or a “part” of the Registration Statement prepared
or certified by an accountant within the meaning of Sections 7 and 11 of the Act.
The financial statements of New Mountain Finance
Holdings, L.L.C. as of December 31, 2011 and 2010 and for each of the three years ended December 31, 2011, and the financial statements of New Mountain Finance Corporation and New Mountain Finance AIV Holdings Corporation as of
December 31, 2011 and for the period from May 19, 2011 (Commencement of Operations) to December 31, 2011, including the Senior Securities table included in the accompanying prospectus have been audited by Deloitte & Touche
LLP, an independent registered public accounting firm, as stated in their reports appearing herein and elsewhere in the Registration Statement. Such financial statements and information included in the Senior Securities table as of December 31,
2011, 2010 and 2009 have been so included in reliance upon the reports of such firm, given their authority as experts in accounting and auditing.
The principal business address of Deloitte & Touche LLP is 2 World Financial Center, New York, New York 10281.
AVAILABLE INFORMATION
We have filed with the SEC a
registration statement on Form N-2, together with all amendments and related exhibits, under the Securities Act, with respect to the shares of common stock offered by this prospectus supplement and the accompanying prospectus. The registration
statement contains additional information about us and the shares of common stock being offered by this prospectus supplement and the accompanying prospectus.
We are required to file with or submit to the SEC annual, quarterly and current reports, proxy statements and other information meeting the informational requirements of the Exchange Act. You may inspect and copy
these reports, proxy statements and other information, as well as the registration
S-58
statement and related exhibits and schedules, at the Public Reference Room of the SEC at 100 F Street, N.E., Washington, District of Columbia 20549. You may obtain information on the
operation of the Public Reference Room by calling the SEC at 1-800-SEC-0330. The SEC maintains an internet site that contains reports, proxy and information statements and other information filed electronically by us with the SEC, which are
available on the SEC’s website at http://www.sec.gov. Copies of these reports, proxy and information statements and other information may be obtained, after paying a duplicating fee, by electronic request at the following e-mail address:
publicinfo@sec.gov, or by writing the SEC’s Public Reference Section, 100 F Street, N.E., Washington, District of Columbia 20549. This information will also be available free of charge by contacting us at 787 Seventh Avenue,
48th Floor, New York, New York 10019, by telephone at (212) 720-0300, or on our website at http://www.newmountainfinance.com. Information contained on our website or on the SEC’s web site about us is not incorporated into this
prospectus supplement and the accompanying prospectus and you should not consider information contained on our website or on the SEC’s website to be part of this prospectus supplement and the accompanying prospectus.
S-59
INDEX TO FINANCIAL STATEMENTS
|
|
|
|
|
| |
|
PAGE |
|
| INTERIM FINANCIAL STATEMENTS FOR THE QUARTER ENDED SEPTEMBER 30, 2012 |
|
|
F-1 |
|
| New Mountain Finance Holdings, L.L.C. |
|
|
|
|
| Consolidated Statements of Assets, Liabilities and Members’ Capital as of September
30, 2012 (unaudited) and December 31, 2011 |
|
|
F-1 |
|
| Consolidated Statements of Operations for the three months and nine months ended September
30, 2012 (unaudited) and September 30, 2011 (unaudited) |
|
|
F-2 |
|
| Consolidated Statements of Changes in Members’ Capital for the nine months ended September
30, 2012 (unaudited) and September 30, 2011 (unaudited) |
|
|
F-3 |
|
| Consolidated Statements of Cash Flows for the nine months ended September
30, 2012 (unaudited) and September 30, 2011 (unaudited) |
|
|
F-4 |
|
| Consolidated Schedule of Investments as of September 30, 2012 (unaudited) |
|
|
F-5 |
|
| Consolidated Schedule of Investments as of December 31, 2011 |
|
|
F-13 |
|
| New Mountain Finance Corporation |
|
|
|
|
| Statement of Assets and Liabilities as of September 30, 2012 (unaudited) and December 31,
2011 |
|
|
F-20 |
|
| Statements of Operations for the three months ended September 30, 2012 (unaudited) and September
30, 2011 (unaudited), the nine months ended September 30, 2012 (unaudited) and from May 19, 2011 (commencement of operations) to September 30, 2011 (unaudited) |
|
|
F-21 |
|
| Statement of Changes in Net Assets for the nine months ended September 30, 2012 (unaudited) and from May
19, 2011 (commencement of operations) to September 30, 2011 (unaudited) |
|
|
F-22 |
|
| Statement of Cash Flows for the nine months ended September 30, 2012 (unaudited) and from May
19, 2011 (commencement of operations) to September 30, 2011 (unaudited) |
|
|
F-23 |
|
| New Mountain Finance AIV Holdings Corporation |
|
|
|
|
| Statement of Assets and Liabilities as of September 30, 2012 (unaudited) and December 31,
2011 |
|
|
F-24 |
|
| Statements of Operations for the three months ended September 30, 2012 (unaudited) and September
30, 2011 (unaudited), the nine months ended September 30, 2012 (unaudited) and from May 19, 2011 (commencement of operations) to September 30, 2011 (unaudited) |
|
|
F-25 |
|
| Statement of Changes in Net Assets for the nine months ended September 30, 2012 (unaudited) and from May
19, 2011 (commencement of operations) to September 30, 2011 (unaudited) |
|
|
F-26 |
|
| Statement of Cash Flows for the nine months ended September 30, 2012 (unaudited) and from May
19, 2011 (commencement of operations) to September 30, 2011 (unaudited) |
|
|
F-27 |
|
| Combined Notes to the Consolidated Financial Statements of New Mountain Finance Holdings, L.L.C., the Financial Statements
of New Mountain Finance Corporation and the Financial Statements of New Mountain Finance AIV Holdings Corporation |
|
|
F-28 |
|
| Report of Independent Registered Public Accounting Firm |
|
|
F-64 |
|
S-60
New Mountain Finance Holdings, L.L.C.
Consolidated Statements of Assets, Liabilities and Members’ Capital
|
|
|
|
|
|
|
|
|
| |
|
September 30,
2012 |
|
|
December 31,
2011 |
|
| |
|
(unaudited) |
|
|
|
|
| Assets |
|
|
|
|
|
|
|
|
| Investments at fair value (cost of $844,524,713 and $699,864,784, respectively) |
|
$ |
858,884,178 |
|
|
$ |
703,513,560 |
|
| Cash and cash equivalents |
|
|
12,670,690 |
|
|
|
15,318,811 |
|
| Interest and dividend receivable |
|
|
8,579,017 |
|
|
|
7,307,092 |
|
| Deferred credit facility costs (net of accumulated amortization of $1,680,588 and $855,955, respectively) |
|
|
5,317,053 |
|
|
|
3,713,739 |
|
| Receivable from affiliate |
|
|
170,909 |
|
|
|
369,017 |
|
| Other assets |
|
|
1,206,326 |
|
|
|
356,486 |
|
|
|
|
|
|
|
|
|
|
| Total assets |
|
$ |
886,828,173 |
|
|
$ |
730,578,705 |
|
|
|
|
|
|
|
|
|
|
| Liabilities |
|
|
|
|
|
|
|
|
| SLF Credit Facility |
|
|
200,000,000 |
|
|
|
165,928,000 |
|
| Holdings Credit Facility |
|
|
135,664,913 |
|
|
|
129,037,813 |
|
| Payable for unsettled securities purchased |
|
|
19,800,000 |
|
|
|
7,604,931 |
|
| Incentive fee payable |
|
|
6,525,063 |
|
|
|
2,317,328 |
|
| Management fee payable |
|
|
2,767,648 |
|
|
|
2,200,354 |
|
| Interest payable |
|
|
580,796 |
|
|
|
1,747,095 |
|
| Payable to affiliate |
|
|
22,728 |
|
|
|
— |
|
| Other liabilities |
|
|
1,112,085 |
|
|
|
1,241,366 |
|
|
|
|
|
|
|
|
|
|
| Total liabilities |
|
|
366,473,233 |
|
|
|
310,076,887 |
|
| Members’ Capital |
|
|
520,354,940 |
|
|
|
420,501,818 |
|
|
|
|
|
|
|
|
|
|
| Total liabilities and members’ capital |
|
$ |
886,828,173 |
|
|
$ |
730,578,705 |
|
|
|
|
|
|
|
|
|
|
| Outstanding common membership units |
|
|
36,912,573 |
|
|
|
30,919,629 |
|
| Capital per unit |
|
$ |
14.10 |
|
|
$ |
13.60 |
|
The accompanying notes are an integral part of these consolidated financial statements.
F-1
New Mountain Finance Holdings, L.L.C.
Consolidated Statements of Operations
(unaudited)
|
|
|
|
|
|
|
|
|
|
|
|
|
|
|
|
|
| |
|
Three months ended |
|
|
Nine months ended |
|
| |
|
September 30,
2012 |
|
|
September 30,
2011 |
|
|
September 30,
2012 |
|
|
September 30,
2011 |
|
| Investment income |
|
|
|
|
|
|
|
|
|
|
|
|
|
|
|
|
| Interest income |
|
$ |
21,362,055 |
|
|
$ |
14,860,750 |
|
|
$ |
60,087,281 |
|
|
$ |
38,838,944 |
|
| Dividend income |
|
|
215,160 |
|
|
|
— |
|
|
|
215,160 |
|
|
|
— |
|
| Other income |
|
|
174,515 |
|
|
|
207,831 |
|
|
|
770,313 |
|
|
|
557,648 |
|
|
|
|
|
|
|
|
|
|
|
|
|
|
|
|
|
|
| Total investment income |
|
|
21,751,730 |
|
|
|
15,068,581 |
|
|
|
61,072,754 |
|
|
|
39,396,592 |
|
|
|
|
|
|
|
|
|
|
|
|
|
|
|
|
|
|
| Expenses |
|
|
|
|
|
|
|
|
|
|
|
|
|
|
|
|
| Incentive fee |
|
|
5,561,173 |
|
|
|
700,610 |
|
|
|
11,693,825 |
|
|
|
1,205,003 |
|
| Management fee |
|
|
2,767,649 |
|
|
|
1,930,140 |
|
|
|
7,887,506 |
|
|
|
2,737,649 |
|
| Interest and other credit facility expenses |
|
|
2,401,847 |
|
|
|
1,686,113 |
|
|
|
7,286,164 |
|
|
|
4,767,013 |
|
| Administrative expenses (net of reimbursable expenses of $267,973, $218,396, $850,816 and $398,651, respectively) |
|
|
276,277 |
|
|
|
314,250 |
|
|
|
753,021 |
|
|
|
517,668 |
|
| Professional fees (net of reimbursable expenses of $170,909, $816,530, $535,771 and $946,716, respectively) |
|
|
233,561 |
|
|
|
55,138 |
|
|
|
742,934 |
|
|
|
624,972 |
|
| Other general and administrative expenses |
|
|
375,777 |
|
|
|
380,612 |
|
|
|
1,014,660 |
|
|
|
559,180 |
|
|
|
|
|
|
|
|
|
|
|
|
|
|
|
|
|
|
| Total expenses |
|
|
11,616,284 |
|
|
|
5,066,863 |
|
|
|
29,378,110 |
|
|
|
10,411,485 |
|
|
|
|
|
|
|
|
|
|
|
|
|
|
|
|
|
|
| Net investment income |
|
|
10,135,446 |
|
|
|
10,001,718 |
|
|
|
31,694,644 |
|
|
|
28,985,107 |
|
| Net realized gains on investments |
|
|
1,615,032 |
|
|
|
1,402,671 |
|
|
|
14,590,819 |
|
|
|
13,954,834 |
|
| Net change in unrealized appreciation (depreciation) of investments |
|
|
10,494,213 |
|
|
|
(22,657,239 |
) |
|
|
10,710,689 |
|
|
|
(29,119,352 |
) |
|
|
|
|
|
|
|
|
|
|
|
|
|
|
|
|
|
| Net increase (decrease) in capital resulting from operations |
|
$ |
22,244,691 |
|
|
$ |
(11,252,850 |
) |
|
$ |
56,996,152 |
|
|
$ |
13,820,589 |
|
|
|
|
|
|
|
|
|
|
|
|
|
|
|
|
|
|
The accompanying notes are an integral part of these consolidated financial statements.
F-2
New Mountain Finance Holdings, L.L.C.
Consolidated Statements of Changes in Members’ Capital
(unaudited)
|
|
|
|
|
|
|
|
|
| |
|
Nine months ended |
|
| |
|
September 30,
2012 |
|
|
September 30,
2011 |
|
| Increase (decrease) in members’ capital resulting from operations: |
|
|
|
|
|
|
|
|
| Net investment income |
|
$ |
31,694,644 |
|
|
$ |
28,985,107 |
|
| Net realized gains on investments |
|
|
14,590,819 |
|
|
|
13,954,834 |
|
| Net change in unrealized appreciation (depreciation) of investments |
|
|
10,710,689 |
|
|
|
(29,119,352 |
) |
|
|
|
|
|
|
|
|
|
| Net increase in members’ capital resulting from operations |
|
|
56,996,152 |
|
|
|
13,820,589 |
|
| Distributions |
|
|
— |
|
|
|
(10,249,155 |
) |
| Contributions |
|
|
— |
|
|
|
65,429,677 |
|
| Net proceeds from issuance of members’ units |
|
|
82,299,574 |
|
|
|
129,864,997 |
|
| Dividends declared |
|
|
(40,046,256 |
) |
|
|
(17,314,992 |
) |
| Offering costs |
|
|
(376,559 |
) |
|
|
(11,557,173 |
) |
| Reinvestment of dividends |
|
|
980,211 |
|
|
|
— |
|
|
|
|
|
|
|
|
|
|
| Net increase in members’ capital |
|
|
99,853,122 |
|
|
|
169,993,943 |
|
| Members’ capital at beginning of period |
|
|
420,501,818 |
|
|
|
241,927,261 |
|
|
|
|
|
|
|
|
|
|
| Members’ capital at end of period |
|
$ |
520,354,940 |
|
|
$ |
411,921,204 |
|
|
|
|
|
|
|
|
|
|
The accompanying notes are an integral part of these consolidated financial statements.
F-3
New Mountain Finance Holdings, L.L.C.
Consolidated Statements of Cash Flows
(unaudited)
|
|
|
|
|
|
|
|
|
| |
|
Nine months ended |
|
| |
|
September 30,
2012 |
|
|
September 30,
2011 |
|
| Cash flows from operating activities |
|
|
|
|
|
|
|
|
| Net increase in members’ capital resulting from operations |
|
$ |
56,996,152 |
|
|
$ |
13,820,589 |
|
| Adjustments to reconcile net (increase) decrease in capital resulting from operations to net cash (used in) provided by operating
activities: |
|
|
|
|
|
|
|
|
| Net realized gains on investments |
|
|
(14,590,819 |
) |
|
|
(13,954,834 |
) |
| Net change in unrealized (appreciation) depreciation of investments |
|
|
(10,710,689 |
) |
|
|
29,119,352 |
|
| Amortization of purchase discount |
|
|
(4,548,871 |
) |
|
|
(5,048,033 |
) |
| Amortization of deferred credit facility costs |
|
|
824,634 |
|
|
|
540,957 |
|
| Non-cash interest income |
|
|
(888,438 |
) |
|
|
(957,171 |
) |
| (Increase) decrease in operating assets: |
|
|
|
|
|
|
|
|
| Purchase of investments |
|
|
(392,161,971 |
) |
|
|
(355,424,928 |
) |
| Proceeds from sales and paydowns of investments |
|
|
268,370,176 |
|
|
|
182,264,633 |
|
| Cash received for purchase of undrawn portion of revolving credit facility |
|
|
— |
|
|
|
1,260,000 |
|
| Cash paid for drawn revolvers |
|
|
(10,710,000 |
) |
|
|
(535,593 |
) |
| Cash repayments on drawn revolvers |
|
|
9,870,000 |
|
|
|
— |
|
| Interest and dividend receivable |
|
|
(1,271,925 |
) |
|
|
(3,753,482 |
) |
| Receivable from unsettled securities sold |
|
|
— |
|
|
|
(6,755,000 |
) |
| Receivable from affiliate |
|
|
198,108 |
|
|
|
(1,003,530 |
) |
| Other assets |
|
|
(641,517 |
) |
|
|
(515,714 |
) |
| Increase (decrease) in operating liabilities: |
|
|
|
|
|
|
|
|
| Payable for unsettled securities purchased |
|
|
12,195,069 |
|
|
|
(94,462,500 |
) |
| Incentive fee payable |
|
|
4,207,735 |
|
|
|
700,610 |
|
| Management fee payable |
|
|
567,294 |
|
|
|
1,930,140 |
|
| Interest payable |
|
|
(1,166,299 |
) |
|
|
416,448 |
|
| Payable to affiliate |
|
|
22,728 |
|
|
|
(202,180 |
) |
| Other liabilities |
|
|
(322,345 |
) |
|
|
525,198 |
|
|
|
|
|
|
|
|
|
|
| Net cash flows (used in) provided by operating activities |
|
|
(83,760,978 |
) |
|
|
(252,035,038 |
) |
|
|
|
|
|
|
|
|
|
| Cash flows from financing activities |
|
|
|
|
|
|
|
|
| Contributions |
|
|
— |
|
|
|
65,429,677 |
|
| Distributions |
|
|
— |
|
|
|
(10,249,155 |
) |
| Net proceeds from issuance of members’ units |
|
|
82,299,574 |
|
|
|
129,864,997 |
|
| Dividends paid |
|
|
(39,066,045 |
) |
|
|
(17,314,992 |
) |
| Offering costs paid |
|
|
(258,516 |
) |
|
|
(11,500,044 |
) |
| Proceeds from Holdings Credit Facility |
|
|
311,326,025 |
|
|
|
205,870,450 |
|
| Repayment of Holdings Credit Facility |
|
|
(304,698,925 |
) |
|
|
(207,664,263 |
) |
| Proceeds from SLF Credit Facility |
|
|
89,031,051 |
|
|
|
134,361,800 |
|
| Repayment of SLF Credit Facility |
|
|
(54,959,051 |
) |
|
|
(24,691,352 |
) |
| Deferred credit facility costs paid |
|
|
(2,561,256 |
) |
|
|
(4,377,595 |
) |
|
|
|
|
|
|
|
|
|
| Net cash flows provided by financing activities |
|
|
81,112,857 |
|
|
|
259,729,523 |
|
|
|
|
|
|
|
|
|
|
| Net (decrease) increase in cash and cash equivalents |
|
|
(2,648,121 |
) |
|
|
7,694,485 |
|
| Cash and cash equivalents at the beginning of the period |
|
|
15,318,811 |
|
|
|
10,744,082 |
|
|
|
|
|
|
|
|
|
|
| Cash and cash equivalents at the end of the period |
|
$ |
12,670,690 |
|
|
$ |
18,438,567 |
|
|
|
|
|
|
|
|
|
|
| Supplemental disclosure of cash flow information |
|
|
|
|
|
|
|
|
| Interest paid |
|
$ |
7,184,552 |
|
|
$ |
3,025,253 |
|
| Non-cash financing activities: |
|
|
|
|
|
|
|
|
| Value of members’ capital issued in connection with dividend reinvestment plan |
|
$ |
980,211 |
|
|
$ |
— |
|
| Accrual for offering costs |
|
|
326,372 |
|
|
|
57,129 |
|
| Accrual for deferred credit facility costs |
|
|
58,791 |
|
|
|
— |
|
The accompanying notes are an integral part of these consolidated financial statements.
F-4
New Mountain Finance Holdings, L.L.C.
Consolidated Schedule of Investments
September 30, 2012
(unaudited)
|
|
|
|
|
|
|
|
|
|
|
|
|
|
|
|
|
|
|
|
|
|
|
|
|
| Portfolio Company, Location
and Industry |
|
Type of
Investment |
|
Interest Rate |
|
Maturity
Date |
|
|
Principal
Amount,
Par Value
or Shares |
|
|
Cost |
|
|
Fair
Value |
|
|
Percent of
Members’
Capital |
|
| Funded Debt Investments—Cayman Islands |
|
|
|
|
|
|
|
|
|
|
|
|
|
|
|
|
|
|
|
|
|
|
|
|
| Pinnacle Holdco S.à r.l. / Pinnacle (US) Acquisition Co Limited** |
|
|
|
|
|
|
|
|
|
|
|
|
|
|
|
|
|
|
|
|
|
|
|
|
| Software |
|
First lien(3) |
|
6.50% (Base Rate + 5.25%) |
|
|
7/30/2019 |
|
|
$ |
15,000,000 |
|
|
$ |
14,913,322 |
|
|
$ |
14,962,500 |
|
|
|
|
|
|
|
Second lien(2) |
|
10.50% (Base Rate + 9.25%) |
|
|
7/30/2020 |
|
|
|
30,000,000 |
|
|
|
29,407,720 |
|
|
|
30,450,000 |
|
|
|
|
|
|
|
|
|
|
|
|
|
|
|
|
|
|
|
|
|
|
|
|
|
|
|
|
|
|
|
|
|
|
|
|
|
|
|
|
|
45,000,000 |
|
|
|
44,321,042 |
|
|
|
45,412,500 |
|
|
|
8.73 |
% |
|
|
|
|
|
|
|
|
|
|
|
|
|
|
|
|
|
|
|
|
|
|
|
|
|
| Total Funded Debt Investments—Cayman Islands |
|
|
|
|
|
|
|
|
|
$ |
45,000,000 |
|
|
$ |
44,321,042 |
|
|
$ |
45,412,500 |
|
|
|
8.73 |
% |
|
|
|
|
|
|
|
|
|
|
|
|
|
|
|
|
|
|
|
|
|
|
|
|
|
| Funded Debt Investments—United Kingdom |
|
|
|
|
|
|
|
|
|
|
|
|
|
|
|
|
|
|
|
|
|
|
|
|
| Magic Newco, LLC** |
|
|
|
|
|
|
|
|
|
|
|
|
|
|
|
|
|
|
|
|
|
|
|
|
| Software |
|
First lien(3) |
|
7.25% (Base Rate + 6.00%) |
|
|
12/12/2018 |
|
|
$ |
15,000,000 |
|
|
$ |
14,566,032 |
|
|
$ |
15,089,070 |
|
|
|
2.90 |
% |
|
|
|
|
|
|
|
|
|
|
|
|
|
|
|
|
|
|
|
|
|
|
|
|
|
| Total Funded Debt Investments—United Kingdom |
|
|
|
|
|
|
|
|
|
$ |
15,000,000 |
|
|
$ |
14,566,032 |
|
|
$ |
15,089,070 |
|
|
|
2.90 |
% |
|
|
|
|
|
|
|
|
|
|
|
|
|
|
|
|
|
|
|
|
|
|
|
|
|
| Funded Debt Investments—United States |
|
|
|
|
|
|
|
|
|
|
|
|
|
|
|
|
|
|
|
|
|
|
|
|
| Plato, Inc. (Archipelago Learning, Inc.) |
|
|
|
|
|
|
|
|
|
|
|
|
|
|
|
|
|
|
|
|
|
|
|
|
| Education |
|
First lien(3) |
|
7.50% (Base Rate + 6.00%) |
|
|
5/17/2018 |
|
|
$ |
11,850,000 |
|
|
$ |
11,511,291 |
|
|
$ |
11,894,438 |
|
|
|
|
|
|
|
Second lien(2) |
|
11.25% (Base Rate + 9.75%) |
|
|
5/17/2019 |
|
|
|
29,150,000 |
|
|
|
28,589,575 |
|
|
|
28,567,000 |
|
|
|
|
|
|
|
|
|
|
|
|
|
|
|
|
|
|
|
|
|
|
|
|
|
|
|
|
|
|
|
|
|
|
|
|
|
|
|
|
|
41,000,000 |
|
|
|
40,100,866 |
|
|
|
40,461,438 |
|
|
|
7.77 |
% |
|
|
|
|
|
|
|
|
|
|
|
|
|
|
|
|
|
|
|
|
|
|
|
|
|
| Novell, Inc. (fka Attachmate Corporation, NetIQ Corporation) |
|
|
|
|
|
|
|
|
|
|
|
|
|
|
|
|
|
|
|
|
|
|
|
|
| Software |
|
First lien(3) |
|
7.25% (Base Rate + 5.75%) |
|
|
11/22/2017 |
|
|
|
7,850,000 |
|
|
|
7,701,167 |
|
|
|
7,923,594 |
|
|
|
|
|
|
|
Second lien(2) |
|
11.00% (Base Rate + 9.50%) |
|
|
11/22/2018 |
|
|
|
24,000,000 |
|
|
|
23,306,638 |
|
|
|
23,535,000 |
|
|
|
|
|
|
|
|
|
|
|
|
|
|
|
|
|
|
|
|
|
|
|
|
|
|
|
|
|
|
|
|
|
|
|
|
|
|
|
|
|
31,850,000 |
|
|
|
31,007,805 |
|
|
|
31,458,594 |
|
|
|
6.04 |
% |
|
|
|
|
|
|
|
|
|
|
|
|
|
|
|
|
|
|
|
|
|
|
|
|
|
| Rocket Software, Inc. |
|
|
|
|
|
|
|
|
|
|
|
|
|
|
|
|
|
|
|
|
|
|
|
|
| Software |
|
Second lien(2) |
|
10.25% (Base Rate + 8.75%) |
|
|
2/8/2019 |
|
|
|
30,875,000 |
|
|
|
30,706,131 |
|
|
|
30,836,406 |
|
|
|
5.92 |
% |
| Unitek Global Services, Inc. |
|
|
|
|
|
|
|
|
|
|
|
|
|
|
|
|
|
|
|
|
|
|
|
|
| Business Services |
|
First lien(2) |
|
9.00% (Base Rate + 7.50%) |
|
|
4/15/2018 |
|
|
|
19,700,000 |
|
|
|
19,229,669 |
|
|
|
19,379,875 |
|
|
|
|
|
|
|
First lien(2) |
|
9.00% (Base Rate + 7.50%) |
|
|
4/15/2018 |
|
|
|
4,975,000 |
|
|
|
4,786,094 |
|
|
|
4,894,156 |
|
|
|
|
|
|
|
First lien(2) |
|
9.00% (Base Rate + 7.50%) |
|
|
4/15/2018 |
|
|
|
5,985,000 |
|
|
|
5,806,242 |
|
|
|
5,887,744 |
|
|
|
|
|
|
|
|
|
|
|
|
|
|
|
|
|
|
|
|
|
|
|
|
|
|
|
|
|
|
|
|
|
|
|
|
|
|
|
|
|
30,660,000 |
|
|
|
29,822,005 |
|
|
|
30,161,775 |
|
|
|
5.80 |
% |
|
|
|
|
|
|
|
|
|
|
|
|
|
|
|
|
|
|
|
|
|
|
|
|
|
| Managed Health Care Associates, Inc. |
|
|
|
|
|
|
|
|
|
|
|
|
|
|
|
|
|
|
|
|
|
|
|
|
| Healthcare Services |
|
First lien(2) |
|
3.47% (Base Rate + 3.25%) |
|
|
8/1/2014 |
|
|
|
14,755,543 |
|
|
|
13,009,095 |
|
|
|
14,275,988 |
|
|
|
|
|
|
|
Second lien(2) |
|
6.72% (Base Rate + 6.50%) |
|
|
2/1/2015 |
|
|
|
15,000,000 |
|
|
|
12,567,838 |
|
|
|
14,475,000 |
|
|
|
|
|
|
|
|
|
|
|
|
|
|
|
|
|
|
|
|
|
|
|
|
|
|
|
|
|
|
|
|
|
|
|
|
|
|
|
|
|
29,755,543 |
|
|
|
25,576,933 |
|
|
|
28,750,988 |
|
|
|
5.53 |
% |
|
|
|
|
|
|
|
|
|
|
|
|
|
|
|
|
|
|
|
|
|
|
|
|
|
The accompanying notes are an integral part of these consolidated
financial statements.
F-5
New Mountain Finance Holdings, L.L.C.
Consolidated Schedule of Investments (continued)
September 30, 2012
(unaudited)
|
|
|
|
|
|
|
|
|
|
|
|
|
|
|
|
|
|
|
|
|
|
|
|
|
| Portfolio Company, Location
and Industry |
|
Type of
Investment |
|
Interest Rate |
|
Maturity
Date |
|
|
Principal
Amount,
Par Value
or Shares |
|
|
Cost |
|
|
Fair
Value |
|
|
Percent of
Members’
Capital |
|
| Global Knowledge
Training LLC |
|
|
|
|
|
|
|
|
|
|
|
|
|
|
|
|
|
|
|
|
|
|
|
|
| Education |
|
First lien(3) |
|
6.50% (Base Rate + 4.99%) |
|
|
4/21/2017 |
|
|
$ |
4,806,802 |
|
|
$ |
4,745,019 |
|
|
$ |
4,734,699 |
|
|
|
|
|
|
|
Second lien(2) |
|
11.50% (Base Rate + 9.75%) |
|
|
10/21/2018 |
|
|
|
24,250,000 |
|
|
|
23,800,763 |
|
|
|
23,755,300 |
|
|
|
|
|
|
|
|
|
|
|
|
|
|
|
|
|
|
|
|
|
|
|
|
|
|
|
|
|
|
|
|
|
|
|
|
|
|
|
|
|
29,056,802 |
|
|
|
28,545,782 |
|
|
|
28,489,999 |
|
|
|
5.48 |
% |
|
|
|
|
|
|
|
|
|
|
|
|
|
|
|
|
|
|
|
|
|
|
|
|
|
| Meritas Schools Holdings, LLC |
|
|
|
|
|
|
|
|
|
|
|
|
|
|
|
|
|
|
|
|
|
|
|
|
| Education |
|
First lien(3) |
|
7.50% (Base Rate + 6.00%) |
|
|
7/29/2017 |
|
|
|
8,390,000 |
|
|
|
8,319,083 |
|
|
|
8,390,000 |
|
|
|
|
|
|
|
Second lien(2) |
|
11.50% (Base Rate + 10.00%) |
|
|
1/29/2018 |
|
|
|
20,000,000 |
|
|
|
19,738,032 |
|
|
|
20,050,000 |
|
|
|
|
|
|
|
|
|
|
|
|
|
|
|
|
|
|
|
|
|
|
|
|
|
|
|
|
|
|
|
|
|
|
|
|
|
|
|
|
|
28,390,000 |
|
|
|
28,057,115 |
|
|
|
28,440,000 |
|
|
|
5.47 |
% |
|
|
|
|
|
|
|
|
|
|
|
|
|
|
|
|
|
|
|
|
|
|
|
|
|
| Insight Pharmaceuticals LLC |
|
|
|
|
|
|
|
|
|
|
|
|
|
|
|
|
|
|
|
|
|
|
|
|
| Healthcare Products |
|
Second lien(2) |
|
13.25% (Base Rate + 11.75%) |
|
|
8/25/2017 |
|
|
|
25,000,000 |
|
|
|
24,125,366 |
|
|
|
24,625,000 |
|
|
|
4.73 |
% |
| SRA International, Inc. |
|
|
|
|
|
|
|
|
|
|
|
|
|
|
|
|
|
|
|
|
|
|
|
|
| Federal Services |
|
First lien(2) |
|
6.50% (Base Rate + 5.25%) |
|
|
7/20/2018 |
|
|
|
4,315,000 |
|
|
|
4,222,087 |
|
|
|
4,288,031 |
|
|
|
|
|
|
|
First lien(3) |
|
6.50% (Base Rate + 5.25%) |
|
|
7/20/2018 |
|
|
|
20,436,329 |
|
|
|
19,715,305 |
|
|
|
20,308,602 |
|
|
|
|
|
|
|
|
|
|
|
|
|
|
|
|
|
|
|
|
|
|
|
|
|
|
|
|
|
|
|
|
|
|
|
|
|
|
|
|
|
24,751,329 |
|
|
|
23,937,392 |
|
|
|
24,596,633 |
|
|
|
4.73 |
% |
|
|
|
|
|
|
|
|
|
|
|
|
|
|
|
|
|
|
|
|
|
|
|
|
|
| Ipreo Holdings LLC |
|
|
|
|
|
|
|
|
|
|
|
|
|
|
|
|
|
|
|
|
|
|
|
|
| Information Services |
|
First lien(2) |
|
8.00% (Base Rate + 6.50%) |
|
|
8/7/2017 |
|
|
|
2,992,500 |
|
|
|
2,963,476 |
|
|
|
2,992,500 |
|
|
|
|
|
|
|
First lien(3) |
|
8.00% (Base Rate + 6.50%) |
|
|
8/7/2017 |
|
|
|
18,562,500 |
|
|
|
18,212,926 |
|
|
|
18,562,500 |
|
|
|
|
|
|
|
|
|
|
|
|
|
|
|
|
|
|
|
|
|
|
|
|
|
|
|
|
|
|
|
|
|
|
|
|
|
|
|
|
|
21,555,000 |
|
|
|
21,176,402 |
|
|
|
21,555,000 |
|
|
|
4.14 |
% |
|
|
|
|
|
|
|
|
|
|
|
|
|
|
|
|
|
|
|
|
|
|
|
|
|
| Renaissance Learning, Inc. |
|
|
|
|
|
|
|
|
|
|
|
|
|
|
|
|
|
|
|
|
|
|
|
|
| Education |
|
Second lien(2) |
|
12.00% (Base Rate + 10.50%) |
|
|
10/19/2018 |
|
|
|
20,000,000 |
|
|
|
19,088,505 |
|
|
|
20,500,000 |
|
|
|
3.94 |
% |
| Learning Care Group (US), Inc. |
|
|
|
|
|
|
|
|
|
|
|
|
|
|
|
|
|
|
|
|
|
|
|
|
| Education |
|
First lien(2) |
|
12.00% |
|
|
4/27/2016 |
|
|
|
17,368,421 |
|
|
|
17,159,158 |
|
|
|
16,695,606 |
|
|
|
|
|
|
|
Subordinated(2) |
|
15.00% PIK* |
|
|
6/30/2016 |
|
|
|
3,518,479 |
|
|
|
3,364,940 |
|
|
|
3,194,889 |
|
|
|
|
|
|
|
|
|
|
|
|
|
|
|
|
|
|
|
|
|
|
|
|
|
|
|
|
|
|
|
|
|
|
|
|
|
|
|
|
|
20,886,900 |
|
|
|
20,524,098 |
|
|
|
19,890,495 |
|
|
|
3.82 |
% |
|
|
|
|
|
|
|
|
|
|
|
|
|
|
|
|
|
|
|
|
|
|
|
|
|
| eResearchTechnology, Inc. |
|
|
|
|
|
|
|
|
|
|
|
|
|
|
|
|
|
|
|
|
|
|
|
|
| Healthcare Services |
|
First lien(3) |
|
8.00% (Base Rate + 6.50%) |
|
|
5/2/2018 |
|
|
|
20,000,000 |
|
|
|
19,223,418 |
|
|
|
19,837,500 |
|
|
|
3.81 |
% |
| Six3 Systems, Inc. |
|
|
|
|
|
|
|
|
|
|
|
|
|
|
|
|
|
|
|
|
|
|
|
|
| Federal Services |
|
First lien(2) |
|
7.00% (Base Rate + 5.75%) |
|
|
10/4/2019 |
|
|
|
20,000,000 |
|
|
|
19,800,000 |
|
|
|
19,800,000 |
|
|
|
3.81 |
% |
| Transplace Texas, L.P. |
|
|
|
|
|
|
|
|
|
|
|
|
|
|
|
|
|
|
|
|
|
|
|
|
| Logistics |
|
Second lien(2) |
|
11.00% (Base Rate + 9.00%) |
|
|
4/12/2017 |
|
|
|
20,000,000 |
|
|
|
19,567,234 |
|
|
|
19,500,000 |
|
|
|
3.75 |
% |
| Smile Brands Group Inc. |
|
|
|
|
|
|
|
|
|
|
|
|
|
|
|
|
|
|
|
|
|
|
|
|
| Healthcare Services |
|
First lien(3) |
|
7.00% (Base Rate + 5.25%) |
|
|
12/21/2017 |
|
|
|
17,409,960 |
|
|
|
17,264,301 |
|
|
|
17,464,367 |
|
|
|
3.36 |
% |
| Brock Holdings III, Inc. |
|
|
|
|
|
|
|
|
|
|
|
|
|
|
|
|
|
|
|
|
|
|
|
|
| Industrial Services |
|
Second lien(2) |
|
10.00% (Base Rate + 8.25%) |
|
|
3/16/2018 |
|
|
|
17,000,000 |
|
|
|
16,769,702 |
|
|
|
17,042,500 |
|
|
|
3.28 |
% |
The
accompanying notes are an integral part of these consolidated financial statements.
F-6
New Mountain Finance Holdings, L.L.C.
Consolidated Schedule of Investments (continued)
September 30, 2012
(unaudited)
|
|
|
|
|
|
|
|
|
|
|
|
|
|
|
|
|
|
|
|
|
|
|
|
|
| Portfolio Company, Location
and Industry |
|
Type of
Investment |
|
Interest Rate |
|
Maturity
Date |
|
|
Principal
Amount,
Par Value
or Shares |
|
|
Cost |
|
|
Fair
Value |
|
|
Percent of
Members’
Capital |
|
| PODS, Inc.(7) |
|
|
|
|
|
|
|
|
|
|
|
|
|
|
|
|
|
|
|
|
|
|
|
|
| Consumer Services |
|
|
|
|
|
|
|
|
|
|
|
|
|
|
|
|
|
|
|
|
|
|
|
|
| PODS Funding Corp. II |
|
First lien(3) |
|
8.50% (Base Rate + 7.00%) |
|
|
11/29/2016 |
|
|
$ |
12,473,577 |
|
|
$ |
12,148,661 |
|
|
$ |
12,442,393 |
|
|
|
|
|
| Storapod Holding Company, Inc. |
|
Subordinated(2) |
|
21.00% PIK* |
|
|
11/29/2017 |
|
|
|
4,500,000 |
|
|
|
4,356,024 |
|
|
|
4,344,095 |
|
|
|
|
|
|
|
|
|
|
|
|
|
|
|
|
|
|
|
|
|
|
|
|
|
|
|
|
|
|
|
|
|
|
|
|
|
|
|
|
|
16,973,577 |
|
|
|
16,504,685 |
|
|
|
16,786,488 |
|
|
|
3.23 |
% |
|
|
|
|
|
|
|
|
|
|
|
|
|
|
|
|
|
|
|
|
|
|
|
|
|
| Sotera Defense Solutions, Inc. (Global Defense Technology & Systems, Inc.) |
|
|
|
|
|
|
|
|
|
|
|
|
|
|
|
|
|
|
|
|
|
|
|
|
| Federal Services |
|
First lien(3) |
|
7.00% (Base Rate + 5.50%) |
|
|
4/21/2017 |
|
|
|
16,787,570 |
|
|
|
16,659,206 |
|
|
|
16,619,694 |
|
|
|
3.19 |
% |
| KeyPoint Government Solutions, Inc. |
|
|
|
|
|
|
|
|
|
|
|
|
|
|
|
|
|
|
|
|
|
|
|
|
| Federal Services |
|
First lien(2) |
|
10.25% (Base Rate + 7.00%) |
|
|
12/31/2015 |
|
|
|
16,364,668 |
|
|
|
16,135,054 |
|
|
|
16,446,491 |
|
|
|
3.16 |
% |
| NEWAsurion Corporation(6) |
|
|
|
|
|
|
|
|
|
|
|
|
|
|
|
|
|
|
|
|
|
|
|
|
| Business Services |
|
|
|
|
|
|
|
|
|
|
|
|
|
|
|
|
|
|
|
|
|
|
|
|
| Asurion, LLC (fka Asurion Corporation) |
|
Second lien(2) |
|
9.00% (Base Rate + 7.50%) |
|
|
5/24/2019 |
|
|
|
2,229,299 |
|
|
|
2,220,007 |
|
|
|
2,310,111 |
|
|
|
|
|
| Lonestar Intermediate Super Holdings, LLC |
|
Subordinated(2) |
|
11.00% (Base Rate + 9.50%) |
|
|
9/2/2019 |
|
|
|
12,000,000 |
|
|
|
11,657,714 |
|
|
|
12,825,000 |
|
|
|
|
|
|
|
|
|
|
|
|
|
|
|
|
|
|
|
|
|
|
|
|
|
|
|
|
|
|
|
|
|
|
|
|
|
|
|
|
|
14,229,299 |
|
|
|
13,877,721 |
|
|
|
15,135,111 |
|
|
|
2.91 |
% |
|
|
|
|
|
|
|
|
|
|
|
|
|
|
|
|
|
|
|
|
|
|
|
|
|
| OpenLink International, Inc. |
|
|
|
|
|
|
|
|
|
|
|
|
|
|
|
|
|
|
|
|
|
|
|
|
| Software |
|
First lien(3) |
|
7.75% (Base Rate + 6.25%) |
|
|
10/30/2017 |
|
|
|
14,887,500 |
|
|
|
14,626,310 |
|
|
|
14,980,547 |
|
|
|
2.88 |
% |
| Landslide Holdings, Inc. (Crimson Acquisition Corp.) |
|
|
|
|
|
|
|
|
|
|
|
|
|
|
|
|
|
|
|
|
|
|
|
|
| Software |
|
First lien(3) |
|
7.00% (Base Rate + 5.75%) |
|
|
6/19/2018 |
|
|
|
14,812,500 |
|
|
|
14,526,917 |
|
|
|
14,886,192 |
|
|
|
2.86 |
% |
| Volume Services America, Inc. (Centerplate) |
|
|
|
|
|
|
|
|
|
|
|
|
|
|
|
|
|
|
|
|
|
|
|
|
| Consumer Services |
|
First lien(2) |
|
10.50% (Base Rate + 8.50%) |
|
|
9/16/2016 |
|
|
|
14,737,500 |
|
|
|
14,448,936 |
|
|
|
14,737,500 |
|
|
|
2.83 |
% |
| Triple Point Technology, Inc. |
|
|
|
|
|
|
|
|
|
|
|
|
|
|
|
|
|
|
|
|
|
|
|
|
| Software |
|
First lien(3) |
|
8.00% (Base Rate + 6.50%) |
|
|
10/27/2017 |
|
|
|
14,391,250 |
|
|
|
13,884,062 |
|
|
|
14,427,228 |
|
|
|
2.77 |
% |
| Sabre Inc. |
|
|
|
|
|
|
|
|
|
|
|
|
|
|
|
|
|
|
|
|
|
|
|
|
| Software |
|
First lien(2) |
|
7.25% (Base Rate + 6.00%) |
|
|
12/29/2017 |
|
|
|
14,000,000 |
|
|
|
13,950,842 |
|
|
|
14,128,338 |
|
|
|
2.72 |
% |
| Virtual Radiologic Corporation |
|
|
|
|
|
|
|
|
|
|
|
|
|
|
|
|
|
|
|
|
|
|
|
|
| Healthcare Information Technology |
|
First lien(3) |
|
7.75% (Base Rate + 4.50%) |
|
|
12/22/2016 |
|
|
|
14,777,469 |
|
|
|
14,616,427 |
|
|
|
13,299,722 |
|
|
|
2.56 |
% |
| Aspen Dental Management, Inc |
|
|
|
|
|
|
|
|
|
|
|
|
|
|
|
|
|
|
|
|
|
|
|
|
| Healthcare Services |
|
First lien(3) |
|
7.00% (Base Rate + 5.50%) |
|
|
10/6/2016 |
|
|
|
12,902,500 |
|
|
|
12,670,893 |
|
|
|
12,870,244 |
|
|
|
2.47 |
% |
The
accompanying notes are an integral part of these consolidated financial statements.
F-7
New Mountain Finance Holdings, L.L.C.
Consolidated Schedule of Investments (continued)
September 30, 2012
(unaudited)
|
|
|
|
|
|
|
|
|
|
|
|
|
|
|
|
|
|
|
|
|
|
|
|
|
| Portfolio Company, Location
and Industry |
|
Type of
Investment |
|
Interest Rate |
|
Maturity
Date |
|
|
Principal
Amount,
Par Value
or Shares |
|
|
Cost |
|
|
Fair
Value |
|
|
Percent of
Members’
Capital |
|
| Van Wagner Communications, LLC |
|
|
|
|
|
|
|
|
|
|
|
|
|
|
|
|
|
|
|
|
|
|
|
|
| Media |
|
First lien(2) |
|
8.25% (Base Rate + 7.00%) |
|
|
8/3/2018 |
|
|
$ |
12,000,000 |
|
|
$ |
11,764,551 |
|
|
$ |
12,230,004 |
|
|
|
2.35 |
% |
| Supervalu Inc.** |
|
|
|
|
|
|
|
|
|
|
|
|
|
|
|
|
|
|
|
|
|
|
|
|
| Retail |
|
First lien(2) |
|
8.00% (Base Rate + 6.75%) |
|
|
8/30/2018 |
|
|
|
11,970,000 |
|
|
|
11,614,165 |
|
|
|
12,060,709 |
|
|
|
2.32 |
% |
| Vision Solutions, Inc. |
|
|
|
|
|
|
|
|
|
|
|
|
|
|
|
|
|
|
|
|
|
|
|
|
| Software |
|
Second lien(2) |
|
9.50% (Base Rate + 8.00%) |
|
|
7/23/2017 |
|
|
|
12,000,000 |
|
|
|
11,908,205 |
|
|
|
12,030,000 |
|
|
|
2.31 |
% |
| TravelCLICK, Inc. (fka TravelCLICK Acquisition Co.) |
|
|
|
|
|
|
|
|
|
|
|
|
|
|
|
|
|
|
|
|
|
|
|
|
| Information Services |
|
First lien(3) |
|
6.50% (Base Rate + 5.00%) |
|
|
3/16/2016 |
|
|
|
11,315,157 |
|
|
|
11,157,696 |
|
|
|
11,258,581 |
|
|
|
2.16 |
% |
| Merrill Communications LLC |
|
|
|
|
|
|
|
|
|
|
|
|
|
|
|
|
|
|
|
|
|
|
|
|
| Business Services |
|
First lien(2) |
|
9.75% (Base Rate + 6.50%) |
|
|
12/24/2012 |
|
|
|
11,421,788 |
|
|
|
11,132,749 |
|
|
|
11,207,630 |
|
|
|
2.15 |
% |
| Mailsouth, Inc. |
|
|
|
|
|
|
|
|
|
|
|
|
|
|
|
|
|
|
|
|
|
|
|
|
| Media |
|
First lien(3) |
|
6.75% (Base Rate + 5.00%) |
|
|
12/14/2016 |
|
|
|
11,164,655 |
|
|
|
11,039,209 |
|
|
|
10,997,185 |
|
|
|
2.11 |
% |
| Immucor, Inc. |
|
|
|
|
|
|
|
|
|
|
|
|
|
|
|
|
|
|
|
|
|
|
|
|
| Healthcare Services |
|
First lien(3) |
|
5.75% (Base Rate + 4.50%) |
|
|
8/19/2018 |
|
|
|
4,950,094 |
|
|
|
4,777,916 |
|
|
|
5,024,345 |
|
|
|
|
|
|
|
Subordinated(2) |
|
11.13% |
|
|
8/15/2019 |
|
|
|
5,000,000 |
|
|
|
4,941,655 |
|
|
|
5,675,000 |
|
|
|
|
|
|
|
|
|
|
|
|
|
|
|
|
|
|
|
|
|
|
|
|
|
|
|
|
|
|
|
|
|
|
|
|
|
|
|
|
|
9,950,094 |
|
|
|
9,719,571 |
|
|
|
10,699,345 |
|
|
|
2.06 |
% |
|
|
|
|
|
|
|
|
|
|
|
|
|
|
|
|
|
|
|
|
|
|
|
|
|
| Permian Tank & Manufacturing, Inc. |
|
|
|
|
|
|
|
|
|
|
|
|
|
|
|
|
|
|
|
|
|
|
|
|
| Energy |
|
First lien(3) |
|
9.00% (Base Rate + 7.25%) |
|
|
3/15/2017 |
|
|
|
10,657,658 |
|
|
|
10,414,096 |
|
|
|
10,657,658 |
|
|
|
2.05 |
% |
| YP Holdings LLC(1) |
|
|
|
|
|
|
|
|
|
|
|
|
|
|
|
|
|
|
|
|
|
|
|
|
| YP Intermediate Holdings Corp. / YP Intermediate Holdings II LLC |
|
|
|
|
|
|
|
|
|
|
|
|
|
|
|
|
|
|
|
|
|
|
|
|
| Media |
|
Second lien(2) |
|
15.00% (12.00% + 3.00% PIK)* |
|
|
5/18/2017 |
|
|
|
10,411,891 |
|
|
|
9,676,418 |
|
|
|
10,516,010 |
|
|
|
2.02 |
% |
| CHG Companies, Inc. |
|
|
|
|
|
|
|
|
|
|
|
|
|
|
|
|
|
|
|
|
|
|
|
|
| Healthcare Services |
|
Second lien(2) |
|
11.25% (Base Rate + 9.50%) |
|
|
4/7/2017 |
|
|
|
10,000,000 |
|
|
|
9,845,241 |
|
|
|
10,050,000 |
|
|
|
1.93 |
% |
| Vertafore, Inc. |
|
|
|
|
|
|
|
|
|
|
|
|
|
|
|
|
|
|
|
|
|
|
|
|
| Software |
|
Second lien(2) |
|
9.75% (Base Rate + 8.25%) |
|
|
10/29/2017 |
|
|
|
10,000,000 |
|
|
|
9,920,803 |
|
|
|
10,050,000 |
|
|
|
1.93 |
% |
| Premier Dental Services, Inc. (Western) |
|
|
|
|
|
|
|
|
|
|
|
|
|
|
|
|
|
|
|
|
|
|
|
|
| Healthcare Services |
|
First lien(2) |
|
5.87% (Base Rate + 5.50%) |
|
|
7/1/2013 |
|
|
|
9,961,832 |
|
|
|
9,550,010 |
|
|
|
9,936,928 |
|
|
|
1.91 |
% |
| Merge Healthcare Inc.** |
|
|
|
|
|
|
|
|
|
|
|
|
|
|
|
|
|
|
|
|
|
|
|
|
| Healthcare Services |
|
First lien(2) |
|
11.75% |
|
|
5/1/2015 |
|
|
|
9,000,000 |
|
|
|
8,906,260 |
|
|
|
9,787,500 |
|
|
|
1.88 |
% |
| Consona Holdings, Inc. |
|
|
|
|
|
|
|
|
|
|
|
|
|
|
|
|
|
|
|
|
|
|
|
|
| Software |
|
First lien(3) |
|
7.25% (Base Rate + 6.00%) |
|
|
8/6/2018 |
|
|
|
8,500,000 |
|
|
|
8,416,300 |
|
|
|
8,415,000 |
|
|
|
1.62 |
% |
The
accompanying notes are an integral part of these consolidated financial statements.
F-8
New Mountain Finance Holdings, L.L.C.
Consolidated Schedule of Investments (continued)
September 30, 2012
(unaudited)
|
|
|
|
|
|
|
|
|
|
|
|
|
|
|
|
|
|
|
|
|
|
|
|
|
| Portfolio Company, Location
and Industry |
|
Type of
Investment |
|
Interest Rate |
|
Maturity
Date |
|
|
Principal
Amount,
Par Value
or Shares |
|
|
Cost |
|
|
Fair
Value |
|
|
Percent of
Members’
Capital |
|
| Physio-Control International, Inc. |
|
|
|
|
|
|
|
|
|
|
|
|
|
|
|
|
|
|
|
|
|
|
|
|
| Healthcare Products |
|
First lien(2)(8) |
|
9.88% |
|
|
1/15/2019 |
|
|
$ |
7,000,000 |
|
|
$ |
7,000,000 |
|
|
$ |
7,700,000 |
|
|
|
1.48 |
% |
| Surgery Center Holdings, Inc. |
|
|
|
|
|
|
|
|
|
|
|
|
|
|
|
|
|
|
|
|
|
|
|
|
| Healthcare Services |
|
First lien(3) |
|
6.50% (Base Rate + 5.00%) |
|
|
2/6/2017 |
|
|
|
6,851,250 |
|
|
|
6,825,324 |
|
|
|
6,851,250 |
|
|
|
1.32 |
% |
| Research Pharmaceutical Services, Inc. |
|
|
|
|
|
|
|
|
|
|
|
|
|
|
|
|
|
|
|
|
|
|
|
|
| Healthcare Services |
|
First lien(3) |
|
6.76% (Base Rate + 5.24%) |
|
|
2/18/2017 |
|
|
|
7,218,750 |
|
|
|
7,134,959 |
|
|
|
6,496,875 |
|
|
|
1.25 |
% |
| Stratus Technologies, Inc. |
|
|
|
|
|
|
|
|
|
|
|
|
|
|
|
|
|
|
|
|
|
|
|
|
| Information Technology |
|
First lien(2) |
|
12.00% |
|
|
3/29/2015 |
|
|
|
6,664,000 |
|
|
|
6,380,436 |
|
|
|
6,230,840 |
|
|
|
1.20 |
% |
| Alion Science and Technology Corporation |
|
|
|
|
|
|
|
|
|
|
|
|
|
|
|
|
|
|
|
|
|
|
|
|
| Federal Services |
|
First lien(2) |
|
12.00% (10.00% + 2.00% PIK)* |
|
|
11/1/2014 |
|
|
|
6,257,192 |
|
|
|
6,043,096 |
|
|
|
5,845,263 |
|
|
|
1.12 |
% |
| Ozburn-Hessey Holding Company LLC |
|
|
|
|
|
|
|
|
|
|
|
|
|
|
|
|
|
|
|
|
|
|
|
|
| Logistics |
|
Second lien(2) |
|
11.50% (Base Rate + 9.50%) |
|
|
10/10/2016 |
|
|
|
6,000,000 |
|
|
|
5,908,033 |
|
|
|
5,430,000 |
|
|
|
1.04 |
% |
| Education Management LLC** |
|
|
|
|
|
|
|
|
|
|
|
|
|
|
|
|
|
|
|
|
|
|
|
|
| Education |
|
First lien(3) |
|
8.25% (Base Rate + 7.00%) |
|
|
3/30/2018 |
|
|
|
5,072,385 |
|
|
|
4,928,655 |
|
|
|
4,499,205 |
|
|
|
0.86 |
% |
| Brickman Group Holdings, Inc. |
|
|
|
|
|
|
|
|
|
|
|
|
|
|
|
|
|
|
|
|
|
|
|
|
| Business Services |
|
Subordinated(2)(8) |
|
9.13% |
|
|
11/1/2018 |
|
|
|
3,650,000 |
|
|
|
3,332,451 |
|
|
|
3,759,500 |
|
|
|
0.72 |
% |
| Tekelec Global, Inc. |
|
|
|
|
|
|
|
|
|
|
|
|
|
|
|
|
|
|
|
|
|
|
|
|
| Software |
|
First lien(3) |
|
9.00% (Base Rate + 7.50%) |
|
|
1/29/2018 |
|
|
|
2,300,000 |
|
|
|
2,268,500 |
|
|
|
2,300,000 |
|
|
|
0.44 |
% |
| Mach Gen, LLC |
|
|
|
|
|
|
|
|
|
|
|
|
|
|
|
|
|
|
|
|
|
|
|
|
| Power Generation |
|
Second lien(2) |
|
7.93% PIK (Base
Rate + 7.50%)* |
|
|
2/22/2015 |
|
|
|
3,603,356 |
|
|
|
3,383,164 |
|
|
|
2,278,541 |
|
|
|
0.44 |
% |
| Airvana Network Solutions Inc. |
|
|
|
|
|
|
|
|
|
|
|
|
|
|
|
|
|
|
|
|
|
|
|
|
| Software |
|
First lien(2) |
|
10.00% (Base Rate + 8.00%) |
|
|
3/25/2015 |
|
|
|
1,714,286 |
|
|
|
1,692,824 |
|
|
|
1,716,965 |
|
|
|
0.33 |
% |
| ATI Acquisition Company (fka Ability Acquisition, Inc.) |
|
|
|
|
|
|
|
|
|
|
|
|
|
|
|
|
|
|
|
|
|
|
|
|
| Education |
|
First lien(2) |
|
12.25% (Base Rate +
5.00% + 4.00% PIK)(5)* |
|
|
12/30/2014 |
|
|
|
4,432,501 |
|
|
|
4,306,437 |
|
|
|
332,438 |
|
|
|
|
|
The accompanying notes are an integral part of these consolidated
financial statements.
F-9
New Mountain Finance Holdings, L.L.C.
Consolidated Schedule of Investments (continued)
September 30, 2012
(unaudited)
|
|
|
|
|
|
|
|
|
|
|
|
|
|
|
|
|
|
|
|
|
|
|
| Portfolio Company, Location
and Industry |
|
Type of
Investment |
|
Interest Rate |
|
Maturity
Date |
|
Principal
Amount,
Par Value
or Shares |
|
|
Cost |
|
|
Fair
Value |
|
|
Percent of
Members’
Capital |
|
|
|
First lien(2) |
|
17.25% (Base Rate +
10.00% + 4.00% PIK)(5)* |
|
6/30/2012
- Past Due |
|
$ |
102,861 |
|
|
$ |
93,691 |
|
|
$ |
66,860 |
|
|
|
|
|
|
|
First lien(2) |
|
17.25% (Base Rate +
10.00% + 4.00% PIK)(5)* |
|
6/30/2012
- Past Due |
|
|
1,665,103 |
|
|
|
1,516,666 |
|
|
|
1,082,317 |
|
|
|
|
|
|
|
|
|
|
|
|
|
|
|
|
|
|
|
|
|
|
|
|
|
|
|
|
|
|
|
|
|
|
|
|
|
6,200,465 |
|
|
|
5,916,794 |
|
|
|
1,481,615 |
|
|
|
0.28 |
% |
| Advantage Sales & Marketing Inc. |
|
|
|
|
|
|
|
|
|
|
|
|
|
|
|
|
|
|
|
|
|
|
| Business Services |
|
First lien(2)(4) |
|
6.25% (Base Rate + 3.00%) |
|
12/17/2015 |
|
|
840,000 |
|
|
|
739,200 |
|
|
|
777,000 |
|
|
|
0.15 |
% |
| Total Funded Debt Investments—United States |
|
|
|
|
|
|
|
$ |
804,779,126 |
|
|
$ |
783,812,818 |
|
|
$ |
792,991,854 |
|
|
|
152.39 |
% |
|
|
|
|
|
|
|
|
|
|
|
|
|
|
|
|
|
|
|
|
|
|
|
| Total Funded Debt Investments |
|
|
|
|
|
|
|
$ |
864,779,126 |
|
|
$ |
842,699,892 |
|
|
$ |
853,493,424 |
|
|
|
164.02 |
% |
|
|
|
|
|
|
|
|
|
|
|
|
|
|
|
|
|
|
|
|
|
|
|
| Equity—United States |
|
|
|
|
|
|
|
|
|
|
|
|
|
|
|
|
|
|
|
|
|
|
| Global Knowledge Training LLC |
|
|
|
|
|
|
|
|
|
|
|
|
|
|
|
|
|
|
|
|
|
|
| Education |
|
Ordinary shares(2) |
|
— |
|
— |
|
|
2 |
|
|
|
2,109 |
|
|
|
2,109 |
|
|
|
|
|
|
|
Preferred shares(2) |
|
— |
|
— |
|
|
2,423 |
|
|
|
2,422,891 |
|
|
|
2,422,891 |
|
|
|
|
|
|
|
|
|
|
|
|
|
|
|
|
|
|
|
|
|
|
|
|
|
|
|
|
|
|
|
|
|
|
|
|
|
|
|
|
|
2,425,000 |
|
|
|
2,425,000 |
|
|
|
0.47 |
% |
|
|
|
|
|
|
|
|
|
|
|
|
|
|
|
|
|
|
|
|
|
|
|
| Stratus Technologies, Inc. |
|
|
|
|
|
|
|
|
|
|
|
|
|
|
|
|
|
|
|
|
|
|
| Information Technology |
|
Ordinary shares(2) |
|
— |
|
— |
|
|
144,270 |
|
|
|
65,123 |
|
|
|
37,265 |
|
|
|
|
|
|
|
Preferred shares(2) |
|
— |
|
— |
|
|
32,830 |
|
|
|
14,819 |
|
|
|
8,480 |
|
|
|
|
|
|
|
|
|
|
|
|
|
|
|
|
|
|
|
|
|
|
|
|
|
|
|
|
|
|
|
|
|
|
|
|
|
|
|
|
|
79,942 |
|
|
|
45,745 |
|
|
|
0.01 |
% |
|
|
|
|
|
|
|
|
|
|
|
|
|
|
|
|
|
|
|
|
|
|
|
| Total Shares |
|
|
|
|
|
|
|
|
|
|
|
$ |
2,504,942 |
|
|
$ |
2,470,745 |
|
|
|
0.48 |
% |
|
|
|
|
|
|
|
|
|
|
|
|
|
|
|
|
|
|
|
|
|
|
|
| Warrants—United States |
|
|
|
|
|
|
|
|
|
|
|
|
|
|
|
|
|
|
|
|
|
|
| YP Holdings LLC(1) |
|
|
|
|
|
|
|
|
|
|
|
|
|
|
|
|
|
|
|
|
|
|
| YP Equity Investors LLC |
|
|
|
|
|
|
|
|
|
|
|
|
|
|
|
|
|
|
|
|
|
|
| Media |
|
Warrants(2) |
|
— |
|
— |
|
|
5 |
|
|
$ |
466,248 |
|
|
$ |
3,537,307 |
|
|
|
0.68 |
% |
| Alion Science and Technology Corporation |
|
|
|
|
|
|
|
|
|
|
|
|
|
|
|
|
|
|
|
|
|
|
| Federal Services |
|
Warrants(2) |
|
— |
|
— |
|
|
6,000 |
|
|
|
292,851 |
|
|
|
209,828 |
|
|
|
0.04 |
% |
| PODS, Inc.(7) |
|
|
|
|
|
|
|
|
|
|
|
|
|
|
|
|
|
|
|
|
|
|
| Storapod Holding Company, Inc. |
|
|
|
|
|
|
|
|
|
|
|
|
|
|
|
|
|
|
|
|
|
|
| Consumer Services |
|
Warrants(2) |
|
— |
|
— |
|
|
360,129 |
|
|
|
155,905 |
|
|
|
155,906 |
|
|
|
0.03 |
% |
| Learning Care Group (US), Inc. |
|
|
|
|
|
|
|
|
|
|
|
|
|
|
|
|
|
|
|
|
|
|
| Education |
|
Warrants(2) |
|
— |
|
— |
|
|
844 |
|
|
|
193,850 |
|
|
|
14,371 |
|
|
|
0.00 |
% |
|
|
|
|
|
|
|
|
|
|
|
|
|
|
|
|
|
|
|
|
|
|
|
| Total Warrants |
|
|
|
|
|
|
|
|
|
|
|
$ |
1,108,854 |
|
|
$ |
3,917,412 |
|
|
|
0.75 |
% |
|
|
|
|
|
|
|
|
|
|
|
|
|
|
|
|
|
|
|
|
|
|
|
| Total Funded Investments |
|
|
|
|
|
|
|
|
|
|
|
$ |
846,313,688 |
|
|
$ |
859,881,581 |
|
|
|
165.25 |
% |
|
|
|
|
|
|
|
|
|
|
|
|
|
|
|
|
|
|
|
|
|
|
|
The accompanying notes are an integral part of these consolidated financial
statements.
F-10
New Mountain Finance Holdings, L.L.C.
Consolidated Schedule of Investments (continued)
September 30, 2012
(unaudited)
|
|
|
|
|
|
|
|
|
|
|
|
|
|
|
|
|
|
|
|
|
|
|
| Portfolio Company, Location
and Industry |
|
Type of
Investment |
|
Interest Rate |
|
Maturity
Date |
|
Principal
Amount,
Par Value
or Shares |
|
|
Cost |
|
|
Fair
Value |
|
|
Percent of
Members’
Capital |
|
| Unfunded Debt Investments—United States |
|
|
|
|
|
|
|
|
|
|
|
|
|
|
|
|
|
|
|
|
|
|
| Kronos Incorporated |
|
|
|
|
|
|
|
|
|
|
|
|
|
|
|
|
|
|
|
|
|
|
| Software |
|
First lien(2)(4)—
Undrawn |
|
— |
|
6/11/2013 |
|
$ |
4,198,500 |
|
|
$ |
(629,775 |
) |
|
$ |
(272,903 |
) |
|
|
(0.05 |
)% |
| Advantage Sales & Marketing Inc. |
|
|
|
|
|
|
|
|
|
|
|
|
|
|
|
|
|
|
|
|
|
|
| Business Services |
|
First lien(2)(4)—
Undrawn |
|
— |
|
12/17/2015 |
|
|
9,660,000 |
|
|
|
(1,159,200 |
) |
|
|
(724,500 |
) |
|
|
(0.14 |
)% |
| Total Unfunded Debt Investments |
|
|
|
|
|
|
|
$ |
13,858,500 |
|
|
$ |
(1,788,975 |
) |
|
$ |
(997,403 |
) |
|
|
(0.19 |
)% |
|
|
|
|
|
|
|
|
|
|
|
|
|
|
|
|
|
|
|
|
|
|
|
| Total Investments |
|
|
|
|
|
|
|
|
|
|
|
$ |
844,524,713 |
|
|
$ |
858,884,178 |
|
|
|
165.06 |
% |
|
|
|
|
|
|
|
|
|
|
|
|
|
|
|
|
|
|
|
|
|
|
|
| (1) |
New Mountain Finance Holdings, L.L.C. (“NMF Holdings”) holds investments in two related entities of YP Holdings LLC. NMF Holdings directly holds warrants to purchase a
4.96% membership interest of YP Equity Investors, LLC (which at closing represented an indirect 1.0% equity interest in YP Holdings LLC) and holds an investment in the Term Loan B loans issued by YP Intermediate Holdings Corp. and YP Intermediate
Holdings II LLC (together “YP Intermediate”), a subsidiary of YP Holdings LLC. |
| (2) |
The Holdings Credit Facility is collateralized by the indicated investments. |
| (3) |
The SLF Credit Facility is collateralized by the indicated investments. |
| (4) |
Par Value amounts represent the drawn or undrawn (as indicated in type of investment) portion of revolving credit facilities. Cost amounts represent the cash received at
settlement date net the impact of paydowns and cash paid for drawn revolvers. |
| (5) |
Investment is on non-accrual status. |
| (6) |
NMF Holdings holds investments in two related entities of NEWAsurion Corporation. NMF Holdings has credit investments in Asurion, LLC and Lonestar Intermediate Super Holdings,
LLC. Asurion, LLC is a wholly-owned subsidiary of Lonestar Intermediate Holdings, LLC, which in turn is a wholly-owned subsidiary of Lonestar Intermediate Super Holdings, LLC. |
| (7) |
NMF Holdings holds investments in two related entities of PODS, Inc. NMF Holdings directly holds warrants in Storapod Holding Company, Inc. (“Storapod”) and
has a credit investment in Storapod through Storapod WCF II Limited (“Storapod WCF II”). Storapod WCF II is a special purpose entity used to enter into a Shari’ah- compliant financing arrangement with Storapod. Additionally, NMF
Holdings has a credit investment in PODS Funding Corp. II (“PODS II”). PODS, Inc. is a wholly-owned subsidiary of PODS Holding, Inc., which in turn is a majority-owned subsidiary of Storapod. PODS II is a special purpose entity
used to enter into a Shari’ah-compliant financing arrangement with PODS, Inc. and its subsidiary, PODS Enterprises, Inc. |
| (8) |
Securities are exempt from registration under Rule 144A of the Securities Act of 1933. These securities are considered liquid and may be resold in transactions exempt from
registration to qualified institutional buyers. At September 30, 2012, the aggregate market value of these securities amounted to $11,459,500 or 2.20% of members’ capital. |
| * |
All or a portion of interest contains payments-in-kind (“PIK”). |
| ** |
Indicates assets that NMF Holdings deems to be “non-qualifying assets” under Section 55(a) of the Investment Company Act of 1940, as amended. Qualifying
assets must represent at least 70.00% of NMF Holdings’ total assets at the time of acquisition of any additional non-qualifying assets. |
The accompanying notes are an integral part of these consolidated financial statements.
F-11
New Mountain Finance Holdings, L.L.C.
Consolidated Schedule of Investments (continued)
September 30, 2012
(unaudited)
|
|
|
|
|
| |
|
September 30, 2012 |
|
| Investment Type |
|
Percent of Total
Investments at Fair Value |
|
| First lien |
|
|
60.16 |
% |
| Second lien |
|
|
35.63 |
% |
| Subordinated |
|
|
3.47 |
% |
| Equity and other |
|
|
0.74 |
% |
|
|
|
|
|
| Total investments |
|
|
100.00 |
% |
|
|
|
|
|
|
|
|
|
|
| |
|
September 30, 2012 |
|
| Industry Type |
|
Percent of Total
Investments at Fair Value |
|
| Software |
|
|
25.09 |
% |
| Education |
|
|
17.02 |
% |
| Healthcare Services |
|
|
15.46 |
% |
| Federal Services |
|
|
9.72 |
% |
| Business Services |
|
|
7.02 |
% |
| Media |
|
|
4.34 |
% |
| Information Services |
|
|
3.82 |
% |
| Healthcare Products |
|
|
3.76 |
% |
| Consumer Services |
|
|
3.69 |
% |
| Logistics |
|
|
2.90 |
% |
| Industrial Services |
|
|
1.99 |
% |
| Healthcare Information Technology |
|
|
1.55 |
% |
| Retail |
|
|
1.40 |
% |
| Energy |
|
|
1.24 |
% |
| Information Technology |
|
|
0.73 |
% |
| Power Generation |
|
|
0.27 |
% |
|
|
|
|
|
| Total investments |
|
|
100.00 |
% |
|
|
|
|
|
The accompanying notes are an integral part of these consolidated financial statements.
F-12
New Mountain Finance Holdings, L.L.C.
Consolidated Schedule of Investments
December 31, 2011
|
|
|
|
|
|
|
|
|
|
|
|
|
|
|
|
|
|
|
|
|
|
|
|
|
| Portfolio Company, Location
and Industry |
|
Type of
Investment |
|
Interest Rate |
|
Maturity
Date |
|
|
Principal
Amount,
Par Value
or Shares |
|
|
Cost |
|
|
Fair
Value |
|
|
Percent of
Members’
Capital |
|
| Funded Debt Investments—United States |
|
|
|
|
|
|
|
|
|
|
|
|
|
|
|
|
|
|
|
|
|
|
|
|
| Novell, Inc. (fka Attachmate Corporation, NetIQ Corporation) |
|
|
|
|
|
|
|
|
|
|
|
|
|
|
|
|
|
|
|
|
|
|
|
|
| Software |
|
First lien(3) |
|
6.50% (Base Rate + 5.00%) |
|
|
4/27/2017 |
|
|
$ |
13,825,000 |
|
|
$ |
13,703,238 |
|
|
$ |
13,583,062 |
|
|
|
|
|
|
|
Second lien(2) |
|
9.50% (Base Rate + 8.00%) |
|
|
10/27/2017 |
|
|
|
20,000,000 |
|
|
|
19,669,018 |
|
|
|
19,200,000 |
|
|
|
|
|
|
|
|
|
|
|
|
|
|
|
|
|
|
|
|
|
|
|
|
|
|
|
|
|
|
|
|
|
|
|
|
|
|
|
|
|
33,825,000 |
|
|
|
33,372,256 |
|
|
|
32,783,062 |
|
|
|
7.80 |
% |
|
|
|
|
|
|
|
|
|
|
|
|
|
|
|
|
|
|
|
|
|
|
|
|
|
| Decision Resources, LLC |
|
|
|
|
|
|
|
|
|
|
|
|
|
|
|
|
|
|
|
|
|
|
|
|
| Business Services |
|
First lien(3) |
|
7.00% (Base Rate + 5.50%) |
|
|
12/28/2016 |
|
|
|
17,820,000 |
|
|
|
17,588,508 |
|
|
|
17,196,300 |
|
|
|
|
|
|
|
Second lien(2) |
|
9.50% (Base Rate + 8.00%) |
|
|
5/7/2018 |
|
|
|
14,500,000 |
|
|
|
14,368,204 |
|
|
|
14,282,500 |
|
|
|
|
|
|
|
|
|
|
|
|
|
|
|
|
|
|
|
|
|
|
|
|
|
|
|
|
|
|
|
|
|
|
|
|
|
|
|
|
|
32,320,000 |
|
|
|
31,956,712 |
|
|
|
31,478,800 |
|
|
|
7.48 |
% |
|
|
|
|
|
|
|
|
|
|
|
|
|
|
|
|
|
|
|
|
|
|
|
|
|
| Lawson Software, Inc. (fka SoftBrands, Inc.) |
|
|
|
|
|
|
|
|
|
|
|
|
|
|
|
|
|
|
|
|
|
|
|
|
| Software |
|
First lien(3) |
|
6.75% (Base Rate + 5.25%) |
|
|
7/5/2017 |
|
|
|
18,703,125 |
|
|
|
18,001,977 |
|
|
|
18,305,684 |
|
|
|
|
|
|
|
Subordinated(2)(7) |
|
11.50% |
|
|
7/15/2018 |
|
|
|
13,500,000 |
|
|
|
12,329,105 |
|
|
|
13,162,500 |
|
|
|
|
|
|
|
|
|
|
|
|
|
|
|
|
|
|
|
|
|
|
|
|
|
|
|
|
|
|
|
|
|
|
|
|
|
|
|
|
|
32,203,125 |
|
|
|
30,331,082 |
|
|
|
31,468,184 |
|
|
|
7.47 |
% |
|
|
|
|
|
|
|
|
|
|
|
|
|
|
|
|
|
|
|
|
|
|
|
|
|
| Meritas Schools Holdings, LLC |
|
|
|
|
|
|
|
|
|
|
|
|
|
|
|
|
|
|
|
|
|
|
|
|
| Education |
|
First lien(3) |
|
7.50% (Base Rate + 6.00%) |
|
|
7/29/2017 |
|
|
|
9,500,000 |
|
|
|
9,409,890 |
|
|
|
9,357,500 |
|
|
|
|
|
|
|
Second lien(2) |
|
11.50% (Base Rate + 10.00%) |
|
|
1/29/2018 |
|
|
|
20,000,000 |
|
|
|
19,712,425 |
|
|
|
19,650,000 |
|
|
|
|
|
|
|
|
|
|
|
|
|
|
|
|
|
|
|
|
|
|
|
|
|
|
|
|
|
|
|
|
|
|
|
|
|
|
|
|
|
29,500,000 |
|
|
|
29,122,315 |
|
|
|
29,007,500 |
|
|
|
6.89 |
% |
|
|
|
|
|
|
|
|
|
|
|
|
|
|
|
|
|
|
|
|
|
|
|
|
|
| Global Knowledge Training LLC |
|
|
|
|
|
|
|
|
|
|
|
|
|
|
|
|
|
|
|
|
|
|
|
|
| Education |
|
First lien(3) |
|
6.50% (Base Rate + 5.00%) |
|
|
4/21/2017 |
|
|
|
4,867,647 |
|
|
|
4,796,665 |
|
|
|
4,794,632 |
|
|
|
|
|
|
|
Second lien(2) |
|
11.50% (Base Rate + 9.75%) |
|
|
10/21/2018 |
|
|
|
24,250,000 |
|
|
|
23,764,101 |
|
|
|
23,755,300 |
|
|
|
|
|
|
|
|
|
|
|
|
|
|
|
|
|
|
|
|
|
|
|
|
|
|
|
|
|
|
|
|
|
|
|
|
|
|
|
|
|
29,117,647 |
|
|
|
28,560,766 |
|
|
|
28,549,932 |
|
|
|
6.79 |
% |
|
|
|
|
|
|
|
|
|
|
|
|
|
|
|
|
|
|
|
|
|
|
|
|
|
| Managed Health Care Associates, Inc. |
|
|
|
|
|
|
|
|
|
|
|
|
|
|
|
|
|
|
|
|
|
|
|
|
| Healthcare Services |
|
First lien(2) |
|
3.55% (Base Rate + 3.25%) |
|
|
8/1/2014 |
|
|
|
15,467,673 |
|
|
|
12,941,252 |
|
|
|
14,462,274 |
|
|
|
|
|
|
|
Second lien(2) |
|
6.80% (Base Rate + 6.50%) |
|
|
2/1/2015 |
|
|
|
15,000,000 |
|
|
|
11,950,542 |
|
|
|
13,950,000 |
|
|
|
|
|
|
|
|
|
|
|
|
|
|
|
|
|
|
|
|
|
|
|
|
|
|
|
|
|
|
|
|
|
|
|
|
|
|
|
|
|
30,467,673 |
|
|
|
24,891,794 |
|
|
|
28,412,274 |
|
|
|
6.76 |
% |
|
|
|
|
|
|
|
|
|
|
|
|
|
|
|
|
|
|
|
|
|
|
|
|
|
| Insight Pharmaceuticals LLC |
|
|
|
|
|
|
|
|
|
|
|
|
|
|
|
|
|
|
|
|
|
|
|
|
| Healthcare Products |
|
Second lien(2) |
|
13.25% (Base Rate + 11.75%) |
|
|
8/25/2017 |
|
|
|
25,000,000 |
|
|
|
24,037,614 |
|
|
|
24,875,000 |
|
|
|
5.92 |
% |
| Renaissance Learning, Inc. |
|
|
|
|
|
|
|
|
|
|
|
|
|
|
|
|
|
|
|
|
|
|
|
|
| Education |
|
Second lien(2) |
|
12.00% (Base Rate + 10.50%) |
|
|
10/19/2018 |
|
|
|
20,000,000 |
|
|
|
19,016,871 |
|
|
|
20,100,000 |
|
|
|
4.78 |
% |
| Learning Care Group (US), Inc. |
|
|
|
|
|
|
|
|
|
|
|
|
|
|
|
|
|
|
|
|
|
|
|
|
| Education |
|
First lien(2) |
|
12.00% |
|
|
4/27/2016 |
|
|
|
17,368,421 |
|
|
|
17,115,609 |
|
|
|
16,695,606 |
|
|
|
|
|
|
|
Subordinated(2) |
|
15.00% PIK* |
|
|
6/30/2016 |
|
|
|
3,273,004 |
|
|
|
3,089,870 |
|
|
|
2,971,990 |
|
|
|
|
|
|
|
|
|
|
|
|
|
|
|
|
|
|
|
|
|
|
|
|
|
|
|
|
|
|
|
|
|
|
|
|
|
|
|
|
|
20,641,425 |
|
|
|
20,205,479 |
|
|
|
19,667,596 |
|
|
|
4.68 |
% |
|
|
|
|
|
|
|
|
|
|
|
|
|
|
|
|
|
|
|
|
|
|
|
|
|
| Transplace Texas, L.P. |
|
|
|
|
|
|
|
|
|
|
|
|
|
|
|
|
|
|
|
|
|
|
|
|
| Logistics |
|
Second lien(2) |
|
11.00% (Base Rate + 9.00%) |
|
|
4/12/2017 |
|
|
|
20,000,000 |
|
|
|
19,514,617 |
|
|
|
19,500,000 |
|
|
|
4.64 |
% |
The accompanying notes are an integral part of these consolidated financial statements.
F-13
New Mountain Finance Holdings, L.L.C.
Consolidated Schedule of Investments (continued)
December 31, 2011
|
|
|
|
|
|
|
|
|
|
|
|
|
|
|
|
|
|
|
|
|
|
|
|
|
| Portfolio Company, Location
and Industry |
|
Type of
Investment |
|
Interest Rate |
|
Maturity
Date |
|
|
Principal
Amount,
Par Value
or Shares |
|
|
Cost |
|
|
Fair
Value |
|
|
Percent of
Members’
Capital |
|
| U.S. Healthworks Holding Company, Inc. |
|
|
|
|
|
|
|
|
|
|
|
|
|
|
|
|
|
|
|
|
|
|
|
|
| Healthcare Services |
|
Second lien(2) |
|
10.50% (Base Rate + 9.00%) |
|
|
6/15/2017 |
|
|
$ |
20,000,000 |
|
|
$ |
19,719,547 |
|
|
$ |
19,500,000 |
|
|
|
4.64 |
% |
| Unitek Global Services, Inc. |
|
|
|
|
|
|
|
|
|
|
|
|
|
|
|
|
|
|
|
|
|
|
|
|
| Business Services |
|
First lien(2) |
|
9.00% (Base Rate + 7.50%) |
|
|
4/15/2018 |
|
|
|
19,850,000 |
|
|
|
19,312,984 |
|
|
|
19,440,594 |
|
|
|
4.62 |
% |
| Ipreo Holdings LLC |
|
|
|
|
|
|
|
|
|
|
|
|
|
|
|
|
|
|
|
|
|
|
|
|
| Information Services |
|
First lien(3) |
|
8.00% (Base Rate + 6.50%) |
|
|
8/5/2017 |
|
|
|
18,703,125 |
|
|
|
18,308,298 |
|
|
|
18,282,305 |
|
|
|
4.35 |
% |
| KeyPoint Government Solutions, Inc. |
|
|
|
|
|
|
|
|
|
|
|
|
|
|
|
|
|
|
|
|
|
|
|
|
| Federal Services |
|
First lien(2) |
|
10.00% (Base Rate + 8.00%) |
|
|
12/31/2015 |
|
|
|
17,820,000 |
|
|
|
17,521,860 |
|
|
|
17,909,100 |
|
|
|
4.26 |
% |
| Sotera Defense Solutions, Inc. (Global Defense Technology & Systems, Inc.) |
|
|
|
|
|
|
|
|
|
|
|
|
|
|
|
|
|
|
|
|
|
|
|
|
| Federal Services |
|
First lien(3) |
|
7.00% (Base Rate + 5.50%) |
|
|
4/21/2017 |
|
|
|
16,915,000 |
|
|
|
16,764,489 |
|
|
|
16,872,713 |
|
|
|
4.01 |
% |
| SRA International, Inc. |
|
|
|
|
|
|
|
|
|
|
|
|
|
|
|
|
|
|
|
|
|
|
|
|
| Federal Services |
|
First lien(3) |
|
6.50% (Base Rate + 5.25%) |
|
|
7/20/2018 |
|
|
|
17,433,389 |
|
|
|
16,624,324 |
|
|
|
16,416,447 |
|
|
|
3.90 |
% |
| OpenLink International, Inc. |
|
|
|
|
|
|
|
|
|
|
|
|
|
|
|
|
|
|
|
|
|
|
|
|
| Software |
|
First lien(2) |
|
7.75% (Base Rate + 6.25%) |
|
|
10/30/2017 |
|
|
|
15,000,000 |
|
|
|
14,706,514 |
|
|
|
15,056,250 |
|
|
|
3.58 |
% |
| Volume Services America, Inc. (Centerplate) |
|
|
|
|
|
|
|
|
|
|
|
|
|
|
|
|
|
|
|
|
|
|
|
|
| Consumer Services |
|
First lien(2) |
|
10.50% (Base Rate + 8.50%) |
|
|
9/16/2016 |
|
|
|
14,850,000 |
|
|
|
14,512,417 |
|
|
|
14,924,250 |
|
|
|
3.55 |
% |
| SonicWALL, Inc. |
|
|
|
|
|
|
|
|
|
|
|
|
|
|
|
|
|
|
|
|
|
|
|
|
| Software |
|
First lien(3) |
|
8.27% (Base Rate + 6.19%) |
|
|
1/23/2016 |
|
|
|
4,822,985 |
|
|
|
4,831,869 |
|
|
|
4,847,099 |
|
|
|
|
|
|
|
Second lien(2) |
|
12.00% (Base Rate + 10.00%) |
|
|
1/23/2017 |
|
|
|
10,000,000 |
|
|
|
9,746,209 |
|
|
|
9,950,000 |
|
|
|
|
|
|
|
|
|
|
|
|
|
|
|
|
|
|
|
|
|
|
|
|
|
|
|
|
|
|
|
|
|
|
|
|
|
|
|
|
|
14,822,985 |
|
|
|
14,578,078 |
|
|
|
14,797,099 |
|
|
|
3.52 |
% |
|
|
|
|
|
|
|
|
|
|
|
|
|
|
|
|
|
|
|
|
|
|
|
|
|
| PODS, Inc.(6) Consumer Services |
|
|
|
|
|
|
|
|
|
|
|
|
|
|
|
|
|
|
|
|
|
|
|
|
| PODS Funding Corp. II |
|
First lien(2) |
|
8.50% (Base Rate + 7.00%) |
|
|
11/29/2016 |
|
|
|
11,561,538 |
|
|
|
11,218,525 |
|
|
|
11,214,692 |
|
|
|
|
|
| Storapod Holding Company, Inc. |
|
Subordinated(2) |
|
21.00% PIK* |
|
|
11/29/2017 |
|
|
|
3,728,642 |
|
|
|
3,600,214 |
|
|
|
3,599,461 |
|
|
|
|
|
|
|
|
|
|
|
|
|
|
|
|
|
|
|
|
|
|
|
|
|
|
|
|
|
|
|
|
|
|
|
|
|
|
|
|
|
15,290,180 |
|
|
|
14,818,739 |
|
|
|
14,814,153 |
|
|
|
3.52 |
% |
|
|
|
|
|
|
|
|
|
|
|
|
|
|
|
|
|
|
|
|
|
|
|
|
|
| Triple Point Technology, Inc. |
|
|
|
|
|
|
|
|
|
|
|
|
|
|
|
|
|
|
|
|
|
|
|
|
| Software |
|
First lien(3) |
|
8.00% (Base Rate + 6.50%) |
|
|
10/27/2017 |
|
|
|
14,500,000 |
|
|
|
13,932,051 |
|
|
|
14,536,250 |
|
|
|
3.46 |
% |
| Virtual Radiologic Corporation |
|
|
|
|
|
|
|
|
|
|
|
|
|
|
|
|
|
|
|
|
|
|
|
|
| Healthcare Information Technology |
|
First lien(3) |
|
7.75% (Base Rate + 4.50%) |
|
|
12/22/2016 |
|
|
|
14,889,987 |
|
|
|
14,704,271 |
|
|
|
14,108,263 |
|
|
|
3.36 |
% |
| Brock Holdings III, Inc. |
|
|
|
|
|
|
|
|
|
|
|
|
|
|
|
|
|
|
|
|
|
|
|
|
| Industrial Services |
|
Second lien(2) |
|
10.00% (Base Rate + 8.25%) |
|
|
3/16/2018 |
|
|
|
15,000,000 |
|
|
|
14,746,132 |
|
|
|
13,818,750 |
|
|
|
3.29 |
% |
| LANDesk Group, Inc. |
|
|
|
|
|
|
|
|
|
|
|
|
|
|
|
|
|
|
|
|
|
|
|
|
| Software |
|
First lien(3) |
|
7.00% (Base Rate + 5.25%) |
|
|
3/28/2016 |
|
|
|
14,062,500 |
|
|
|
13,828,336 |
|
|
|
13,798,828 |
|
|
|
3.28 |
% |
| Pacific Architects and Engineers Incorporated |
|
|
|
|
|
|
|
|
|
|
|
|
|
|
|
|
|
|
|
|
|
|
|
|
| Federal Services |
|
First lien(3) |
|
7.50% (Base Rate + 6.00%) |
|
|
4/4/2017 |
|
|
|
14,100,000 |
|
|
|
13,848,322 |
|
|
|
13,677,000 |
|
|
|
3.25 |
% |
The accompanying notes are an integral part of these consolidated financial statements.
F-14
New Mountain Finance Holdings, L.L.C.
Consolidated Schedule of Investments (continued)
December 31, 2011
|
|
|
|
|
|
|
|
|
|
|
|
|
|
|
|
|
|
|
|
|
|
|
|
|
| Portfolio Company, Location
and Industry |
|
Type of
Investment |
|
Interest Rate |
|
Maturity
Date |
|
|
Principal
Amount,
Par Value
or Shares |
|
|
Cost |
|
|
Fair
Value |
|
|
Percent of
Members’
Capital |
|
| Smile Brands Group Inc. |
|
|
|
|
|
|
|
|
|
|
|
|
|
|
|
|
|
|
|
|
|
|
|
|
| Healthcare Services |
|
First lien(3) |
|
7.00% (Base Rate + 5.25%) |
|
|
12/21/2017 |
|
|
$ |
12,337,594 |
|
|
$ |
12,173,547 |
|
|
$ |
12,329,883 |
|
|
|
2.93 |
% |
| Mailsouth, Inc. |
|
|
|
|
|
|
|
|
|
|
|
|
|
|
|
|
|
|
|
|
|
|
|
|
| Media |
|
First lien(3) |
|
6.75% (Base Rate + 4.99%) |
|
|
12/14/2016 |
|
|
|
11,910,000 |
|
|
|
11,756,172 |
|
|
|
11,731,350 |
|
|
|
2.79 |
% |
| Vision Solutions, Inc. |
|
|
|
|
|
|
|
|
|
|
|
|
|
|
|
|
|
|
|
|
|
|
|
|
| Software |
|
Second lien(2) |
|
9.50% (Base Rate + 8.00%) |
|
|
7/23/2017 |
|
|
|
12,000,000 |
|
|
|
11,893,985 |
|
|
|
11,640,000 |
|
|
|
2.77 |
% |
| TravelCLICK, Inc. (fka TravelCLICK Acquisition Co.) |
|
|
|
|
|
|
|
|
|
|
|
|
|
|
|
|
|
|
|
|
|
|
|
|
| Information Services |
|
First lien(3) |
|
6.50% (Base Rate + 5.00%) |
|
|
3/16/2016 |
|
|
|
11,401,313 |
|
|
|
11,208,577 |
|
|
|
11,344,306 |
|
|
|
2.70 |
% |
| Merrill Communications LLC |
|
|
|
|
|
|
|
|
|
|
|
|
|
|
|
|
|
|
|
|
|
|
|
|
| Business Services |
|
First lien(2) |
|
7.50% (Base Rate + 5.50%) |
|
|
12/24/2012 |
|
|
|
11,421,788 |
|
|
|
10,284,637 |
|
|
|
11,002,985 |
|
|
|
2.62 |
% |
| Brickman Group Holdings, Inc. |
|
|
|
|
|
|
|
|
|
|
|
|
|
|
|
|
|
|
|
|
|
|
|
|
| Business Services |
|
First lien(3) |
|
7.25% (Base Rate + 5.50%) |
|
|
10/14/2016 |
|
|
|
7,957,406 |
|
|
|
8,005,917 |
|
|
|
7,982,272 |
|
|
|
|
|
|
|
Subordinated(2)(7) |
|
9.13% |
|
|
11/1/2018 |
|
|
|
3,000,000 |
|
|
|
2,716,216 |
|
|
|
2,715,000 |
|
|
|
|
|
|
|
|
|
|
|
|
|
|
|
|
|
|
|
|
|
|
|
|
|
|
|
|
|
|
|
|
|
|
|
|
|
|
|
|
|
10,957,406 |
|
|
|
10,722,133 |
|
|
|
10,697,272 |
|
|
|
2.54 |
% |
|
|
|
|
|
|
|
|
|
|
|
|
|
|
|
|
|
|
|
|
|
|
|
|
|
| Immucor, Inc. |
|
|
|
|
|
|
|
|
|
|
|
|
|
|
|
|
|
|
|
|
|
|
|
|
| Healthcare Services |
|
First lien(3) |
|
7.25% (Base Rate + 5.75%) |
|
|
8/19/2018 |
|
|
|
4,987,500 |
|
|
|
4,795,791 |
|
|
|
5,022,826 |
|
|
|
|
|
|
|
Subordinated(2) |
|
11.13% |
|
|
8/15/2019 |
|
|
|
5,000,000 |
|
|
|
4,937,575 |
|
|
|
5,200,000 |
|
|
|
|
|
|
|
|
|
|
|
|
|
|
|
|
|
|
|
|
|
|
|
|
|
|
|
|
|
|
|
|
|
|
|
|
|
|
|
|
|
9,987,500 |
|
|
|
9,733,366 |
|
|
|
10,222,826 |
|
|
|
2.43 |
% |
|
|
|
|
|
|
|
|
|
|
|
|
|
|
|
|
|
|
|
|
|
|
|
|
|
| CHG Companies, Inc. |
|
|
|
|
|
|
|
|
|
|
|
|
|
|
|
|
|
|
|
|
|
|
|
|
| Healthcare Services |
|
Second lien(2) |
|
11.25% (Base Rate + 9.50%) |
|
|
4/7/2017 |
|
|
|
10,000,000 |
|
|
|
9,826,548 |
|
|
|
10,025,000 |
|
|
|
2.38 |
% |
| Vertafore, Inc. |
|
|
|
|
|
|
|
|
|
|
|
|
|
|
|
|
|
|
|
|
|
|
|
|
| Software |
|
Second lien(2) |
|
9.75% (Base Rate + 8.25%) |
|
|
10/29/2017 |
|
|
|
10,000,000 |
|
|
|
9,912,104 |
|
|
|
9,725,000 |
|
|
|
2.31 |
% |
| Merge Healthcare Inc.** |
|
|
|
|
|
|
|
|
|
|
|
|
|
|
|
|
|
|
|
|
|
|
|
|
| Healthcare Services |
|
First lien(2) |
|
11.75% |
|
|
5/1/2015 |
|
|
|
9,000,000 |
|
|
|
8,879,303 |
|
|
|
9,585,000 |
|
|
|
2.28 |
% |
| Porex Corporation |
|
|
|
|
|
|
|
|
|
|
|
|
|
|
|
|
|
|
|
|
|
|
|
|
| Specialty Chemicals and Materials |
|
First lien(3) |
|
6.75% (Base Rate + 5.25%) |
|
|
3/31/2015 |
|
|
|
9,573,968 |
|
|
|
9,449,821 |
|
|
|
9,430,359 |
|
|
|
2.24 |
% |
| Sunquest Information Systems, Inc. (Misys Hospital Systems, Inc.) |
|
|
|
|
|
|
|
|
|
|
|
|
|
|
|
|
|
|
|
|
|
|
|
|
| Healthcare Services |
|
Second lien(2) |
|
9.75% (Base Rate + 8.50%) |
|
|
6/16/2017 |
|
|
|
9,000,000 |
|
|
|
8,840,688 |
|
|
|
8,910,000 |
|
|
|
2.12 |
% |
| Mach Gen, LLC |
|
|
|
|
|
|
|
|
|
|
|
|
|
|
|
|
|
|
|
|
|
|
|
|
| Power Generation |
|
Second lien(2) |
|
8.03% PIK (Base Rate + 7.50%)* |
|
|
2/22/2015 |
|
|
|
12,063,894 |
|
|
|
9,966,951 |
|
|
|
8,609,943 |
|
|
|
2.05 |
% |
| Research Pharmaceutical Services, Inc. |
|
|
|
|
|
|
|
|
|
|
|
|
|
|
|
|
|
|
|
|
|
|
|
|
| Healthcare Services |
|
First lien(3) |
|
6.75% (Base Rate + 5.24%) |
|
|
2/18/2017 |
|
|
|
7,453,125 |
|
|
|
7,354,306 |
|
|
|
7,192,266 |
|
|
|
1.71 |
% |
| Airvana Network Solutions Inc. |
|
|
|
|
|
|
|
|
|
|
|
|
|
|
|
|
|
|
|
|
|
|
|
|
| Software |
|
First lien(2) |
|
10.00% (Base Rate + 8.00%) |
|
|
3/25/2015 |
|
|
|
7,009,524 |
|
|
|
6,895,616 |
|
|
|
7,044,571 |
|
|
|
1.68 |
% |
| Surgery Center Holdings, Inc. |
|
|
|
|
|
|
|
|
|
|
|
|
|
|
|
|
|
|
|
|
|
|
|
|
| Healthcare Services |
|
First lien(3) |
|
6.50% (Base Rate + 5.00%) |
|
|
2/6/2017 |
|
|
|
6,947,500 |
|
|
|
6,916,695 |
|
|
|
6,478,544 |
|
|
|
1.54 |
% |
The accompanying notes are an integral part of these consolidated financial statements.
F-15
New Mountain Finance Holdings, L.L.C.
Consolidated Schedule of Investments (continued)
December 31, 2011
|
|
|
|
|
|
|
|
|
|
|
|
|
|
|
|
|
|
|
|
|
|
|
|
|
| Portfolio Company, Location
and Industry |
|
Type of
Investment |
|
Interest Rate |
|
Maturity
Date |
|
|
Principal
Amount,
Par Value
or Shares |
|
|
Cost |
|
|
Fair
Value |
|
|
Percent of
Members’
Capital |
|
| Stratus Technologies, Inc. |
|
|
|
|
|
|
|
|
|
|
|
|
|
|
|
|
|
|
|
|
|
|
|
|
| Information Technology |
|
First lien(2) |
|
12.00% |
|
|
3/29/2015 |
|
|
$ |
6,827,000 |
|
|
$ |
6,490,139 |
|
|
$ |
6,212,570 |
|
|
|
1.48 |
% |
| Alion Science and Technology Corporation |
|
|
|
|
|
|
|
|
|
|
|
|
|
|
|
|
|
|
|
|
|
|
|
|
| Federal Services |
|
First lien(2) |
|
10.00% + 2.00% PIK* |
|
|
11/1/2014 |
|
|
|
6,195,238 |
|
|
|
5,613,308 |
|
|
|
5,555,066 |
|
|
|
1.32 |
% |
| Datatel, Inc. |
|
|
|
|
|
|
|
|
|
|
|
|
|
|
|
|
|
|
|
|
|
|
|
|
| Software |
|
Second lien(2) |
|
8.75% (Base Rate + 7.25%) |
|
|
2/19/2018 |
|
|
|
5,000,000 |
|
|
|
4,977,238 |
|
|
|
5,150,000 |
|
|
|
1.22 |
% |
| Ozburn-Hessey Holding Company LLC |
|
|
|
|
|
|
|
|
|
|
|
|
|
|
|
|
|
|
|
|
|
|
|
|
| Logistics |
|
Second lien(2) |
|
11.50% (Base Rate + 9.50%) |
|
|
10/8/2016 |
|
|
|
6,000,000 |
|
|
|
5,892,802 |
|
|
|
5,110,002 |
|
|
|
1.22 |
% |
| Asurion, LLC (fka Asurion Corporation) |
|
|
|
|
|
|
|
|
|
|
|
|
|
|
|
|
|
|
|
|
|
|
|
|
| Business Services |
|
Second lien(2) |
|
9.00% (Base Rate + 7.50%) |
|
|
5/24/2019 |
|
|
|
5,000,000 |
|
|
|
4,976,820 |
|
|
|
4,950,000 |
|
|
|
1.18 |
% |
| Pharmaceutical Product Development, Inc. (Jaguar Holdings, LLC) |
|
|
|
|
|
|
|
|
|
|
|
|
|
|
|
|
|
|
|
|
|
|
|
|
| Healthcare Services |
|
First lien(3) |
|
6.25% (Base Rate + 5.00%) |
|
|
12/5/2018 |
|
|
|
4,894,921 |
|
|
|
4,864,327 |
|
|
|
4,888,802 |
|
|
|
1.16 |
% |
| Fibertech Networks, LLC (fka Firefox Merger Sub, LLC) |
|
|
|
|
|
|
|
|
|
|
|
|
|
|
|
|
|
|
|
|
|
|
|
|
| Telecommunication |
|
First lien(3) |
|
6.75% (Base Rate + 5.00%) |
|
|
11/30/2016 |
|
|
|
4,897,632 |
|
|
|
4,835,069 |
|
|
|
4,873,144 |
|
|
|
1.16 |
% |
| LVI Services Inc. |
|
|
|
|
|
|
|
|
|
|
|
|
|
|
|
|
|
|
|
|
|
|
|
|
| Industrial Services |
|
First lien(2) |
|
9.25% (Base Rate + 7.50%) |
|
|
3/31/2014 |
|
|
|
5,120,334 |
|
|
|
4,474,056 |
|
|
|
3,725,043 |
|
|
|
0.89 |
% |
| ATI Acquisition Company (fka Ability Acquisition, Inc.) |
|
|
|
|
|
|
|
|
|
|
|
|
|
|
|
|
|
|
|
|
|
|
|
|
| Education |
|
First lien(2) |
|
12.25% (Base Rate + 5.00% + 4.00% PIK)(5)* |
|
|
12/30/2014 |
|
|
|
4,477,810 |
|
|
|
4,351,747 |
|
|
|
783,617 |
|
|
|
|
|
|
|
First lien(2) |
|
17.25% (Base Rate + 10.00% + 4.00% PIK)* |
|
|
6/30/2012 |
|
|
|
91,696 |
|
|
|
91,696 |
|
|
|
91,696 |
|
|
|
|
|
|
|
First lien(2) |
|
17.25% (Base Rate + 10.00% + 4.00% PIK)* |
|
|
6/30/2012 |
|
|
|
1,484,370 |
|
|
|
1,484,370 |
|
|
|
1,484,370 |
|
|
|
|
|
|
|
|
|
|
|
|
|
|
|
|
|
|
|
|
|
|
|
|
|
|
|
|
|
|
|
|
|
|
|
|
|
|
|
|
|
6,053,876 |
|
|
|
5,927,813 |
|
|
|
2,359,683 |
|
|
|
0.56 |
% |
|
|
|
|
|
|
|
|
|
|
|
|
|
|
|
|
|
|
|
|
|
|
|
|
|
| Total Funded Debt Investments |
|
|
|
|
|
|
|
|
|
$ |
727,364,649 |
|
|
$ |
702,801,889 |
|
|
$ |
702,587,965 |
|
|
|
167.08 |
% |
|
|
|
|
|
|
|
|
|
|
|
|
|
|
|
|
|
|
|
|
|
|
|
|
|
|
|
|
|
|
|
|
|
| Equity—United States |
|
|
|
|
|
|
|
|
|
|
|
|
|
|
|
|
|
|
|
|
|
|
|
|
| Stratus Technologies, Inc. |
|
|
|
|
|
|
|
|
|
|
|
|
|
|
|
|
|
|
|
|
|
|
|
|
| Information Technology |
|
Ordinary shares(2) |
|
— |
|
|
— |
|
|
$ |
144,270 |
|
|
$ |
65,123 |
|
|
$ |
29,881 |
|
|
|
|
|
|
|
Preferred shares(2) |
|
— |
|
|
— |
|
|
|
32,830 |
|
|
|
14,819 |
|
|
|
6,800 |
|
|
|
|
|
|
|
|
|
|
|
|
|
|
|
|
|
|
|
|
|
|
|
|
|
|
|
|
|
|
|
|
|
|
|
|
|
|
|
|
|
|
|
|
|
79,942 |
|
|
|
36,681 |
|
|
|
0.01 |
% |
|
|
|
|
|
|
|
|
|
|
|
|
|
|
|
|
|
|
|
|
|
|
|
|
|
F-16
The accompanying notes are an integral part of these consolidated financial statements.
New Mountain Finance Holdings, L.L.C.
Consolidated Schedule of Investments (continued)
December 31, 2011
|
|
|
|
|
|
|
|
|
|
|
|
|
|
|
|
|
|
|
|
|
|
|
|
|
|
|
| Portfolio Company, Location
and Industry |
|
Type of
Investment |
|
|
Interest Rate |
|
Maturity
Date |
|
|
Principal
Amount,
Par Value
or Shares |
|
|
Cost |
|
|
Fair
Value |
|
|
Percent of
Members’
Capital |
|
| Global Knowledge Training LLC |
|
|
|
|
|
|
|
|
|
|
|
|
|
|
|
|
|
|
|
|
|
|
|
|
|
|
| Education |
|
|
Ordinary shares(2) |
|
|
— |
|
|
— |
|
|
$ |
2 |
|
|
$ |
2,109 |
|
|
$ |
2,109 |
|
|
|
|
|
|
|
|
Preferred shares(2) |
|
|
— |
|
|
— |
|
|
|
2,423 |
|
|
|
2,422,891 |
|
|
|
2,422,891 |
|
|
|
|
|
|
|
|
|
|
|
|
|
|
|
|
|
|
|
|
|
|
|
|
|
|
|
|
|
|
|
|
|
|
|
|
|
|
|
|
|
|
|
|
|
|
|
|
|
2,425,000 |
|
|
|
2,425,000 |
|
|
|
0.58 |
% |
|
|
|
|
|
|
|
|
|
|
|
|
|
|
|
|
|
|
|
|
|
|
|
|
|
|
|
| Total Shares |
|
|
|
|
|
|
|
|
|
|
|
|
|
|
|
$ |
2,504,942 |
|
|
$ |
2,461,681 |
|
|
|
0.59 |
% |
|
|
|
|
|
|
|
|
|
|
|
|
|
|
|
|
|
|
|
|
|
|
|
|
|
|
|
| Warrants—United States |
|
|
|
|
|
|
|
|
|
|
|
|
|
|
|
|
|
|
|
|
|
|
|
|
|
|
| Alion Science and Technology Corporation |
|
|
|
|
|
|
|
|
|
|
|
|
|
|
|
|
|
|
|
|
|
|
|
|
|
|
| Federal Services |
|
|
Warrants(2) |
|
|
— |
|
|
— |
|
|
$ |
6,000 |
|
|
$ |
292,851 |
|
|
$ |
244,237 |
|
|
|
0.06 |
% |
| PODS, Inc.(6) |
|
|
|
|
|
|
|
|
|
|
|
|
|
|
|
|
|
|
|
|
|
|
|
|
|
|
| Storapod Holding Company, Inc. |
|
|
|
|
|
|
|
|
|
|
|
|
|
|
|
|
|
|
|
|
|
|
|
|
|
|
| Consumer Services |
|
|
Warrants(2) |
|
|
— |
|
|
— |
|
|
|
298,398 |
|
|
|
129,181 |
|
|
|
129,181 |
|
|
|
0.03 |
% |
| Learning Care Group (US), Inc. |
|
|
|
|
|
|
|
|
|
|
|
|
|
|
|
|
|
|
|
|
|
|
|
|
|
|
| Education |
|
|
Warrants(2) |
|
|
— |
|
|
— |
|
|
|
844 |
|
|
|
193,850 |
|
|
|
14,372 |
|
|
|
0.00 |
% |
|
|
|
|
|
|
|
|
|
|
|
|
|
|
|
|
|
|
|
|
|
|
|
|
|
|
|
| Total Warrants |
|
|
|
|
|
|
|
|
|
|
|
|
|
|
|
$ |
615,882 |
|
|
$ |
387,790 |
|
|
|
0.09 |
% |
|
|
|
|
|
|
|
|
|
|
|
|
|
|
|
|
|
|
|
|
|
|
|
|
|
|
|
| Total Funded Investments |
|
|
|
|
|
|
|
|
|
|
|
|
|
|
|
$ |
705,922,713 |
|
|
$ |
705,437,436 |
|
|
|
167.76 |
% |
|
|
|
|
|
|
|
|
|
|
|
|
|
|
|
|
|
|
|
|
|
|
|
|
|
|
|
| Unfunded Debt Investments—United States |
|
|
|
|
|
|
|
|
|
|
|
|
|
|
|
|
|
|
|
|
|
|
|
|
|
|
| Datatel, Inc. |
|
|
|
|
|
|
|
|
|
|
|
|
|
|
|
|
|
|
|
|
|
|
|
|
|
|
| Software |
|
|
Subordinated—Bridge |
(1),(2) |
|
— |
|
|
12/13/2012 |
|
|
|
20,000,000 |
|
|
|
— |
|
|
|
— |
|
|
|
0.00% |
|
| Physio-Control International, Inc. |
|
|
|
|
|
|
|
|
|
|
|
|
|
|
|
|
|
|
|
|
|
|
|
|
|
|
| Healthcare Products |
|
|
First lien—Bridge(1),(2) |
|
|
— |
|
|
— |
|
|
|
15,000,000 |
|
|
|
— |
|
|
|
— |
|
|
|
0.00% |
|
| ATI Acquisition Company (fka Ability Acquisition, Inc.) |
|
|
|
|
|
|
|
|
|
|
|
|
|
|
|
|
|
|
|
|
|
|
|
|
|
|
| Education |
|
|
First lien(1),(2)—
Undrawn |
|
|
— |
|
|
1/1/2012 |
|
|
|
39,947 |
|
|
|
— |
|
|
|
— |
|
|
|
|
|
|
|
|
First lien(1),(2)—
Undrawn |
|
|
— |
|
|
1/1/2012 |
|
|
|
865 |
|
|
|
— |
|
|
|
— |
|
|
|
|
|
|
|
|
|
|
|
|
|
|
|
|
|
|
|
|
|
|
|
|
|
|
|
|
|
|
|
|
|
|
|
|
|
|
|
|
|
|
|
|
|
40,812 |
|
|
|
— |
|
|
|
— |
|
|
|
0.00% |
|
|
|
|
|
|
|
|
|
|
|
|
|
|
|
|
|
|
|
|
|
|
|
|
|
|
|
|
| PODS, Inc.(6) |
|
|
|
|
|
|
|
|
|
|
|
|
|
|
|
|
|
|
|
|
|
|
|
|
|
|
| Consumer Services |
|
|
|
|
|
|
|
|
|
|
|
|
|
|
|
|
|
|
|
|
|
|
|
|
|
|
| PODS Funding
Corp. II |
|
|
First lien(1),(2)—
Undrawn |
|
|
— |
|
|
11/29/2016 |
|
|
|
3,438,462 |
|
|
|
(103,154 |
) |
|
|
(103,154 |
) |
|
|
|
|
| Storapod Holding Company, Inc. |
|
|
Subordinated (1),(2)—
Undrawn |
|
|
— |
|
|
11/29/2017 |
|
|
|
771,358 |
|
|
|
— |
|
|
|
— |
|
|
|
|
|
|
|
|
|
|
|
|
|
|
|
|
|
|
|
|
|
|
|
|
|
|
|
|
|
|
|
|
|
|
|
|
|
|
|
|
|
|
|
|
|
4,209,820 |
|
|
|
(103,154 |
) |
|
|
(103,154 |
) |
|
|
(0.03 |
)% |
|
|
|
|
|
|
|
|
|
|
|
|
|
|
|
|
|
|
|
|
|
|
|
|
|
|
|
| RGIS Services, LLC |
|
|
|
|
|
|
|
|
|
|
|
|
|
|
|
|
|
|
|
|
|
|
|
|
|
|
| Business Services |
|
|
First lien (2),(4)—
Undrawn |
|
|
— |
|
|
4/30/2013 |
|
|
|
5,000,000 |
|
|
|
(2,850,000 |
) |
|
|
(293,850 |
) |
|
|
(0.07 |
)% |
F-17
The accompanying notes are an integral part of these consolidated financial statements.
New Mountain Finance Holdings, L.L.C.
Consolidated Schedule of Investments (continued)
December 31, 2011
|
|
|
|
|
|
|
|
|
|
|
|
|
|
|
|
|
|
|
|
|
|
|
|
|
| Portfolio Company, Location
and Industry |
|
Type of
Investment |
|
Interest Rate |
|
Maturity
Date |
|
|
Principal
Amount,
Par Value
or Shares |
|
|
Cost |
|
|
Fair
Value |
|
|
Percent of
Members’
Capital |
|
| Education Management LLC** |
|
|
|
|
|
|
|
|
|
|
|
|
|
|
|
|
|
|
|
|
|
|
|
|
| Education |
|
First lien(2)(4)—
Undrawn |
|
— |
|
|
6/1/2012 |
|
|
$ |
3,000,000 |
|
|
$ |
(1,215,000 |
) |
|
$ |
(330,000 |
) |
|
$ |
(0.08 |
)% |
| Kronos Incorporated |
|
|
|
|
|
|
|
|
|
|
|
|
|
|
|
|
|
|
|
|
|
|
|
|
| Software |
|
First lien(2)(4)—
Undrawn |
|
— |
|
|
6/11/2013 |
|
|
|
4,198,500 |
|
|
|
(629,775 |
) |
|
|
(356,872 |
) |
|
|
(0.08 |
)% |
| Advantage Sales & Marketing Inc. |
|
|
|
|
|
|
|
|
|
|
|
|
|
|
|
|
|
|
|
|
|
|
|
|
| Business Services |
|
First lien(2)(4)—
Undrawn |
|
— |
|
|
12/17/2015 |
|
|
|
10,500,000 |
|
|
|
(1,260,000 |
) |
|
|
(840,000 |
) |
|
|
(0.20 |
)% |
|
|
|
|
|
|
|
|
|
|
|
|
|
|
|
|
|
|
|
|
|
|
|
|
|
| Total Unfunded Debt Investments |
|
|
|
|
|
|
|
|
|
$ |
61,949,132 |
|
|
$ |
(6,057,929 |
) |
|
$ |
(1,923,876 |
) |
|
|
(0.46 |
)% |
|
|
|
|
|
|
|
|
|
|
|
|
|
|
|
|
|
|
|
|
|
|
|
|
|
| Total Investments |
|
|
|
|
|
|
|
|
|
|
|
|
|
$ |
699,864,784 |
|
|
$ |
703,513,560 |
|
|
|
167.30 |
% |
|
|
|
|
|
|
|
|
|
|
|
|
|
|
|
|
|
|
|
|
|
|
|
|
|
| (1) |
Par Value amounts represent the drawn or undrawn (as indicated in type of investment) portion of the bridge facility, delayed draw or other future funding commitments.
|
| (2) |
The Holdings Credit Facility is collateralized by the indicated investments. |
| (3) |
The SLF Credit Facility is collateralized by the indicated investments. |
| (4) |
Par Value amounts represent the drawn or undrawn (as indicated in type of investment) portion of revolving credit facilities. Cost amounts represent the cash received at
settlement date net the impact of paydowns and cash paid for drawn revolvers. |
| (5) |
Investment is on non-accrual status. |
| (6) |
New Mountain Finance Holdings, L.L.C. (“NMF Holdings”) holds investments in two related entities of PODS, Inc. NMF Holdings directly holds warrants in Storapod
Holding Company, Inc. (“Storapod”) and has a credit investment in Storapod through Storapod WCF II Limited (“Storapod WCF II”). Storapod WCF II is a special purpose entity used to enter into a Shari’ah- compliant
financing arrangement with Storapod. Additionally, NMF Holdings has a credit investment in PODS Funding Corp. II (“PODS II”). PODS, Inc. is a wholly-owned subsidiary of PODS Holding, Inc., which in turn is a majority- owned
subsidiary of Storapod. PODS II is a special purpose entity used to enter into a Shari’ah-compliant financing arrangement with PODS, Inc. and its subsidiary, PODS Enterprises, Inc. |
| (7) |
Securities are exempt from registration under Rule 144A of the Securities Act of 1933. These securities are considered liquid and may be resold in transactions exempt from
registration to qualified institutional buyers. At December 31, 2011, the aggregate market value of these securities amounted to $15,877,500 or 3.78% of members’ capital. |
| * |
All or a portion of interest contains payments-in-kind (“PIK”). |
| ** |
Indicates assets that NMF Holdings deems to be “non-qualifying assets” under Section 55(a) of the Investment Company Act of 1940, as amended. Qualifying
assets must represent at least 70.00% of NMF Holdings’ total assets at the time of acquisition of any additional non-qualifying assets. |
The accompanying notes are an integral part of these consolidated financial statements.
F-18
New Mountain Finance Holdings, L.L.C.
Consolidated Schedule of Investments (continued)
September 30, 2012
(unaudited)
|
|
|
|
|
| |
|
December 31, 2011 |
|
| Investment Type |
|
Percent of Total
Investments at Fair Value |
|
| First lien |
|
|
58.32 |
% |
| Second lien |
|
|
37.34 |
% |
| Subordinated |
|
|
3.93 |
% |
| Equity and other |
|
|
0.41 |
% |
|
|
|
|
|
| Total investments |
|
|
100.00 |
% |
|
|
|
|
|
|
|
|
|
|
| |
|
December 31, 2011 |
|
| Industry Type |
|
Percent of Total
Investments at Fair Value |
|
| Software |
|
|
22.12 |
% |
| Healthcare Services |
|
|
16.71 |
% |
| Education |
|
|
14.47 |
% |
| Business Services |
|
|
10.86 |
% |
| Federal Services |
|
|
10.05 |
% |
| Consumer Services |
|
|
4.23 |
% |
| Information Services |
|
|
4.21 |
% |
| Healthcare Products |
|
|
3.54 |
% |
| Logistics |
|
|
3.50 |
% |
| Industrial Services |
|
|
2.49 |
% |
| Healthcare Information Technology |
|
|
2.01 |
% |
| Media |
|
|
1.67 |
% |
| Specialty Chemicals and Materials |
|
|
1.34 |
% |
| Power Generation |
|
|
1.22 |
% |
| Information Technology |
|
|
0.89 |
% |
| Telecommunication |
|
|
0.69 |
% |
|
|
|
|
|
| Total investments |
|
|
100.00 |
% |
|
|
|
|
|
The accompanying notes are an integral part of these consolidated financial statements.
F-19
New Mountain Finance Corporation
Statement of Assets and Liabilities
|
|
|
|
|
|
|
|
|
| |
|
September 30, 2012 |
|
|
December 31, 2011 |
|
| |
|
(unaudited) |
|
|
|
|
| Assets |
|
|
|
|
|
|
|
|
| Investment in New Mountain Finance Holdings, L.L.C., at fair value (cost of $283,692,771 and $144,355,856,
respectively) |
|
$ |
291,674,984 |
|
|
$ |
145,486,821 |
|
|
|
|
|
|
|
|
|
|
| Total assets |
|
$ |
291,674,984 |
|
|
$ |
145,486,821 |
|
|
|
|
|
|
|
|
|
|
| Net assets |
|
|
|
|
|
|
|
|
| Common stock, par value $0.01 per share 20,690,635 and 10,697,691 shares issued and outstanding, respectively |
|
|
206,906 |
|
|
|
106,977 |
|
| Paid in capital in excess of par |
|
|
283,532,016 |
|
|
|
144,248,879 |
|
| Accumulated undistributed net realized gains |
|
|
2,334,682 |
|
|
|
286,307 |
|
| Net unrealized appreciation (depreciation) |
|
|
5,601,380 |
|
|
|
844,658 |
|
|
|
|
|
|
|
|
|
|
| Total net assets |
|
$ |
291,674,984 |
|
|
$ |
145,486,821 |
|
|
|
|
|
|
|
|
|
|
| Number of shares outstanding |
|
|
20,690,635 |
|
|
|
10,697,691 |
|
| Net asset value per share |
|
$ |
14.10 |
|
|
$ |
13.60 |
|
The accompanying notes are an integral part of these financial statements.
F-20
New Mountain Finance Corporation
Statement of Operations
(unaudited)
|
|
|
|
|
|
|
|
|
|
|
|
|
|
|
|
|
| |
|
Three months
ended
September 30, 2012 |
|
|
Three months
ended
September 30, 2011 |
|
|
Nine months
ended
September 30, 2012 |
|
|
From May 19, 2011
(commencement of
operations) to
September 30,
2011 |
|
| Net investment income allocated from New Mountain Finance Holdings, L.L.C. |
|
|
|
|
|
|
|
|
|
|
|
|
|
|
|
|
| Interest income |
|
$ |
9,562,923 |
|
|
$ |
5,141,579 |
|
|
$ |
22,961,224 |
|
|
$ |
7,565,172 |
|
| Dividend income |
|
|
95,894 |
|
|
|
— |
|
|
|
95,894 |
|
|
|
— |
|
| Other income |
|
|
82,855 |
|
|
|
71,906 |
|
|
|
288,991 |
|
|
|
177,827 |
|
| Total expenses |
|
|
(5,168,105 |
) |
|
|
(1,753,053 |
) |
|
|
(11,313,409 |
) |
|
|
(2,698,438 |
) |
|
|
|
|
|
|
|
|
|
|
|
|
|
|
|
|
|
| Net investment income allocated from New Mountain Finance Holdings, L.L.C. |
|
|
4,573,567 |
|
|
|
3,460,432 |
|
|
|
12,032,700 |
|
|
|
5,044,561 |
|
| Net realized and unrealized gain (loss) allocated from New Mountain Finance Holdings, L.L.C. |
|
|
|
|
|
|
|
|
|
|
|
|
|
|
|
|
| Net realized gains on investments |
|
|
699,536 |
|
|
|
485,301 |
|
|
|
5,188,948 |
|
|
|
346,214 |
|
| Net change in unrealized appreciation (depreciation) of investments |
|
|
4,724,830 |
|
|
|
(7,839,038 |
) |
|
|
4,799,727 |
|
|
|
(7,458,377 |
) |
|
|
|
|
|
|
|
|
|
|
|
|
|
|
|
|
|
| Net realized and unrealized gain (loss) allocated from New Mountain Finance Holdings, L.L.C. |
|
|
5,424,366 |
|
|
|
(7,353,737 |
) |
|
|
9,988,675 |
|
|
|
(7,112,163 |
) |
|
|
|
|
|
|
|
|
|
|
|
|
|
|
|
|
|
| Total net increase (decrease) in net assets resulting from operations allocated from New Mountain
Finance Holdings, L.L.C. |
|
|
9,997,933 |
|
|
|
(3,893,305 |
) |
|
|
22,021,375 |
|
|
|
(2,067,602 |
) |
|
|
|
|
|
|
|
|
|
|
|
|
|
|
|
|
|
| Net change in unrealized (depreciation) appreciation of investment in New Mountain Finance Holdings, L.L.C. |
|
|
(43,005 |
) |
|
|
— |
|
|
|
(43,005 |
) |
|
|
6,220,520 |
|
| Net increase (decrease) in net assets resulting from operations |
|
$ |
9,954,928 |
|
|
$ |
(3,893,305 |
) |
|
$ |
21,978,370 |
|
|
$ |
4,152,918 |
|
|
|
|
|
|
|
|
|
|
|
|
|
|
|
|
|
|
| Basic earnings per share |
|
$ |
0.62 |
|
|
$ |
(0.36 |
) |
|
$ |
1.75 |
|
|
$ |
0.39 |
|
| Weighted average shares of common stock outstanding—basic (See Note 11) |
|
|
16,177,442 |
|
|
|
10,697,691 |
|
|
|
12,537,607 |
|
|
|
10,697,691 |
|
| Diluted earnings per share |
|
$ |
0.62 |
|
|
$ |
(0.36 |
) |
|
$ |
1.74 |
|
|
$ |
(0.19 |
) |
| Weighted average shares of common stock outstanding—diluted (See Note 11) |
|
|
36,138,511 |
|
|
|
30,919,629 |
|
|
|
32,671,954 |
|
|
|
30,919,629 |
|
The accompanying notes are an integral part of these financial statements.
F-21
New Mountain Finance Corporation
Statement of Changes in Net Assets
(unaudited)
|
|
|
|
|
|
|
|
|
| |
|
Nine months ended
September 30, 2012 |
|
|
From May 19, 2011
(commencement of
operations) to
September 30,
2011 |
|
| Increase (decrease) in net assets resulting from operations: |
|
|
|
|
|
|
|
|
| Net investment income allocated from New Mountain Finance Holdings, L.L.C. |
|
$ |
12,032,700 |
|
|
$ |
5,044,561 |
|
| Net realized gains on investments allocated from New Mountain Finance Holdings, L.L.C. |
|
|
5,188,948 |
|
|
|
346,214 |
|
| Net change in unrealized appreciation (depreciation) of investments allocated from New Mountain Finance Holdings, L.L.C. |
|
|
4,799,727 |
|
|
|
(7,458,377 |
) |
| Net change in unrealized (depreciation) appreciation of investment in New Mountain Finance Holdings, L.L.C. |
|
|
(43,005 |
) |
|
|
6,220,520 |
|
|
|
|
|
|
|
|
|
|
| Total net increase in net assets resulting from operations |
|
|
21,978,370 |
|
|
|
4,152,918 |
|
|
|
|
|
|
|
|
|
|
| Capital transactions |
|
|
|
|
|
|
|
|
| Proceeds from shares sold |
|
|
82,299,573 |
|
|
|
129,864,996 |
|
| Deferred offering costs allocated from New Mountain Finance Holdings, L.L.C. |
|
|
(211,073 |
) |
|
|
(3,998,597 |
) |
| Value of shares issued for exchanged units |
|
|
56,314,355 |
|
|
|
18,489,457 |
|
| Dividends declared |
|
|
(15,173,273 |
) |
|
|
(5,990,707 |
) |
| Reinvestment of dividends |
|
|
980,211 |
|
|
|
— |
|
|
|
|
|
|
|
|
|
|
| Total net increase in net assets resulting from capital transactions |
|
|
124,209,793 |
|
|
|
138,365,149 |
|
|
|
|
|
|
|
|
|
|
| Net increase in net assets |
|
|
146,188,163 |
|
|
|
142,518,067 |
|
| Net assets at beginning of period |
|
|
145,486,821 |
|
|
|
— |
|
|
|
|
|
|
|
|
|
|
| Net assets at end of period |
|
$ |
291,674,984 |
|
|
$ |
142,518,067 |
|
|
|
|
|
|
|
|
|
|
The accompanying notes are an integral part of these financial statements.
F-22
New Mountain Finance Corporation
Statement of Cash Flows
(unaudited)
|
|
|
|
|
|
|
|
|
| |
|
Nine months ended
September 30, 2012 |
|
|
From May 19, 2011
(commencement of
operations) to
September 30,
2011 |
|
| Cash flows from operating activities |
|
|
|
|
|
|
|
|
| Net increase in net assets resulting from operations |
|
$ |
21,978,370 |
|
|
$ |
4,152,918 |
|
| Adjustments to reconcile net (increase) decrease in net assets resulting from operations to net cash (used in) provided by operating
activities: |
|
|
|
|
|
|
|
|
| Net investment income allocated from New Mountain Finance Holdings, L.L.C. |
|
|
(12,032,700 |
) |
|
|
(5,044,561 |
) |
| Net realized and unrealized (gains) losses allocated from New Mountain Finance Holdings, L.L.C. |
|
|
(9,988,675 |
) |
|
|
7,112,163 |
|
| Net change in unrealized depreciation (appreciation) of investment in New Mountain Finance Holdings, L.L.C. |
|
|
43,005 |
|
|
|
(6,220,520 |
) |
| (Increase) decrease in operating assets: |
|
|
|
|
|
|
|
|
| Purchase of investment |
|
|
(82,299,573 |
) |
|
|
(129,864,996 |
) |
| Distributions from New Mountain Finance Holdings, L.L.C. |
|
|
15,173,273 |
|
|
|
5,990,707 |
|
|
|
|
|
|
|
|
|
|
| Net cash flows (used in) provided by operating activities |
|
|
(67,126,300 |
) |
|
|
(123,874,289 |
) |
|
|
|
|
|
|
|
|
|
| Cash flows from financing activities |
|
|
|
|
|
|
|
|
| Proceeds from shares sold |
|
|
82,299,573 |
|
|
|
129,864,996 |
|
| Dividends paid |
|
|
(15,173,273 |
) |
|
|
(5,990,707 |
) |
|
|
|
|
|
|
|
|
|
| Net cash flows provided by financing activities |
|
|
67,126,300 |
|
|
|
123,874,289 |
|
|
|
|
|
|
|
|
|
|
| Net increase (decrease) in cash and cash equivalents |
|
|
— |
|
|
|
— |
|
| Cash and cash equivalents at the beginning of the period |
|
|
— |
|
|
|
— |
|
|
|
|
|
|
|
|
|
|
| Cash and cash equivalents at the end of the period |
|
$ |
— |
|
|
$ |
— |
|
|
|
|
|
|
|
|
|
|
| Non-cash financing activities: |
|
|
|
|
|
|
|
|
| New Mountain Guardian Partners, L.P. exchange of New Mountain Finance Holdings, L.L.C. units for shares |
|
$ |
— |
|
|
$ |
18,489,457 |
|
| New Mountain Finance AIV Holdings Corporation exchange of New Mountain Finance Holdings, L.L.C. units for shares |
|
|
56,314,355 |
|
|
|
— |
|
| Value of shares issued in connection with dividend reinvestment plan |
|
|
980,211 |
|
|
|
— |
|
| Deferred offering costs allocated from New Mountain Finance Holdings, L.L.C. |
|
|
(211,073 |
) |
|
|
(3,998,597 |
) |
The accompanying notes are an integral part of these financial statements.
F-23
New Mountain Finance AIV Holdings Corporation
Statement of Assets and Liabilities
|
|
|
|
|
|
|
|
|
| |
|
September 30, 2012 |
|
|
December 31, 2011 |
|
| |
|
(unaudited) |
|
|
|
|
| Assets |
|
|
|
|
|
|
|
|
| Investment in New Mountain Finance Holdings, L.L.C., at fair value (cost of $234,382,864 and $290,847,952,
respectively) |
|
$ |
228,679,956 |
|
|
$ |
275,014,997 |
|
|
|
|
|
|
|
|
|
|
| Total assets |
|
$ |
228,679,956 |
|
|
$ |
275,014,997 |
|
|
|
|
|
|
|
|
|
|
| Net assets |
|
|
|
|
|
|
|
|
| Common stock, par value $0.01 per share 100 shares issued and outstanding |
|
|
1 |
|
|
|
1 |
|
| Paid in capital in excess of par |
|
|
234,382,861 |
|
|
|
292,383,201 |
|
| Accumulated undistributed net realized gains (distributions in excess of net realized gains) |
|
|
3,196,798 |
|
|
|
(994,034 |
) |
| Net unrealized depreciation |
|
|
(8,899,704 |
) |
|
|
(16,374,171 |
) |
|
|
|
|
|
|
|
|
|
| Total net assets |
|
|
228,679,956 |
|
|
|
275,014,997 |
|
|
|
|
|
|
|
|
|
|
| Total liabilities and net assets |
|
$ |
228,679,956 |
|
|
$ |
275,014,997 |
|
|
|
|
|
|
|
|
|
|
The accompanying notes are an integral part of these financial statements.
F-24
New Mountain Finance AIV Holdings Corporation
Statement of Operations
(unaudited)
|
|
|
|
|
|
|
|
|
|
|
|
|
|
|
|
|
| |
|
Three months
ended
September 30, 2012 |
|
|
Three months
ended
September 30, 2011 |
|
|
Nine months
ended
September 30, 2012 |
|
|
From May 19, 2011
(commencement of
operations) to
September 30,
2011 |
|
| Net investment income allocated from New Mountain Finance Holdings, L.L.C. |
|
|
|
|
|
|
|
|
|
|
|
|
|
|
|
|
| Interest income |
|
$ |
11,799,132 |
|
|
$ |
9,719,171 |
|
|
$ |
37,126,057 |
|
|
$ |
14,300,510 |
|
| Dividend income |
|
|
119,266 |
|
|
|
— |
|
|
|
119,266 |
|
|
|
— |
|
| Other income |
|
|
91,660 |
|
|
|
135,925 |
|
|
|
481,322 |
|
|
|
336,148 |
|
| Total expenses |
|
|
(6,448,179 |
) |
|
|
(3,313,810 |
) |
|
|
(18,064,701 |
) |
|
|
(5,100,875 |
) |
|
|
|
|
|
|
|
|
|
|
|
|
|
|
|
|
|
| Net investment income allocated from New Mountain Finance Holdings, L.L.C. |
|
|
5,561,879 |
|
|
|
6,541,286 |
|
|
|
19,661,944 |
|
|
|
9,535,783 |
|
| Net realized and unrealized gain (loss) allocated from New Mountain Finance Holdings, L.L.C. |
|
|
|
|
|
|
|
|
|
|
|
|
|
|
|
|
| Net realized gains on investments |
|
|
915,496 |
|
|
|
917,370 |
|
|
|
9,401,871 |
|
|
|
654,454 |
|
| Net change in unrealized appreciation (depreciation) of investments |
|
|
5,769,383 |
|
|
|
(14,818,201 |
) |
|
|
5,910,962 |
|
|
|
(14,098,634 |
) |
|
|
|
|
|
|
|
|
|
|
|
|
|
|
|
|
|
| Net realized and unrealized gain (loss) allocated from New Mountain Finance Holdings, L.L.C. |
|
|
6,684,879 |
|
|
|
(13,900,831 |
) |
|
|
15,312,833 |
|
|
|
(13,444,180 |
) |
|
|
|
|
|
|
|
|
|
|
|
|
|
|
|
|
|
| Total net increase (decrease) in net assets resulting from operations allocated from New Mountain Finance
Holdings, L.L.C. |
|
|
12,246,758 |
|
|
|
(7,359,545 |
) |
|
|
34,974,777 |
|
|
|
(3,908,397 |
) |
|
|
|
|
|
|
|
|
|
|
|
|
|
|
|
|
|
| Net realized gains on investment in New Mountain Finance Holdings, L.L.C. |
|
|
381,614 |
|
|
|
— |
|
|
|
381,614 |
|
|
|
— |
|
| Net change in unrealized appreciation (depreciation) of investment in New Mountain Finance Holdings, L.L.C. |
|
|
1,563,505 |
|
|
|
— |
|
|
|
1,563,505 |
|
|
|
(6,212,133 |
) |
|
|
|
|
|
|
|
|
|
|
|
|
|
|
|
|
|
| Net increase (decrease) in net assets resulting from operations |
|
$ |
14,191,877 |
|
|
$ |
(7,359,545 |
) |
|
$ |
36,919,896 |
|
|
$ |
(10,120,530 |
) |
|
|
|
|
|
|
|
|
|
|
|
|
|
|
|
|
|
The accompanying notes are an integral part of these financial statements.
F-25
New Mountain Finance AIV Holdings Corporation
Statement of Changes in Net Assets
(unaudited)
|
|
|
|
|
|
|
|
|
| |
|
Nine months ended
September 30, 2012 |
|
|
From May 19, 2011
(commencement of
operations) to
September 30,
2011 |
|
| Increase (decrease) in net assets resulting from operations: |
|
|
|
|
|
|
|
|
| Net investment income allocated from New Mountain Finance Holdings, L.L.C. |
|
$ |
19,661,944 |
|
|
$ |
9,535,783 |
|
| Net realized gains on investments allocated from New Mountain Finance Holdings, L.L.C. |
|
|
9,401,871 |
|
|
|
654,454 |
|
| Net change in unrealized appreciation (depreciation) of investments allocated from New Mountain Finance Holdings, L.L.C. |
|
|
5,910,962 |
|
|
|
(14,098,634 |
) |
| Net realized gains on investment in New Mountain Finance Holdings, L.L.C. |
|
|
381,614 |
|
|
|
— |
|
| Net change in unrealized appreciation (depreciation) of investment in New Mountain Finance Holdings, L.L.C. |
|
|
1,563,505 |
|
|
|
(6,212,133 |
) |
|
|
|
|
|
|
|
|
|
| Total net increase (decrease) in net assets resulting from operations |
|
|
36,919,896 |
|
|
|
(10,120,530 |
) |
|
|
|
|
|
|
|
|
|
| Capital transactions |
|
|
|
|
|
|
|
|
| Distribution to New Mountain Guardian AIV, L.P. |
|
|
(58,216,467 |
) |
|
|
— |
|
| Deferred offering costs allocated from New Mountain Finance Holdings, L.L.C. |
|
|
(165,487 |
) |
|
|
(7,558,581 |
) |
| Contributions from exchanged shares |
|
|
— |
|
|
|
298,406,533 |
|
| Dividends declared |
|
|
(24,872,983 |
) |
|
|
(11,324,285 |
) |
|
|
|
|
|
|
|
|
|
| Total net (decrease) increase in net assets resulting from capital transactions |
|
|
(83,254,937 |
) |
|
|
279,523,667 |
|
|
|
|
|
|
|
|
|
|
| Net (decrease) increase in net assets |
|
|
(46,335,041 |
) |
|
|
269,403,137 |
|
| Net assets at beginning of period |
|
|
275,014,997 |
|
|
|
— |
|
|
|
|
|
|
|
|
|
|
| Net assets at end of period |
|
$ |
228,679,956 |
|
|
$ |
269,403,137 |
|
|
|
|
|
|
|
|
|
|
The accompanying notes are an integral part of these financial statements.
F-26
New Mountain Finance AIV Holdings Corporation
Statement of Cash Flows
(unaudited)
|
|
|
|
|
|
|
|
|
| |
|
Nine months ended
September 30, 2012 |
|
|
From May 19, 2011
(commencement of
operations) to
September 30,
2011 |
|
| Cash flows from operating activities |
|
|
|
|
|
|
|
|
| Net increase (decrease) in net assets resulting from operations |
|
$ |
36,919,896 |
|
|
$ |
(10,120,530 |
) |
| Adjustments to reconcile net (increase) decrease in net assets resulting from operations to net cash (used in) provided by operating
activities: |
|
|
|
|
|
|
|
|
| Net investment income allocated from New Mountain Finance Holdings, L.L.C. |
|
|
(19,661,944 |
) |
|
|
(9,535,783 |
) |
| Net realized and unrealized (gains) losses allocated from New Mountain Finance Holdings, L.L.C. |
|
|
(15,312,833 |
) |
|
|
13,444,180 |
|
| Net realized gains on investment in New Mountain Finance Holdings, L.L.C. |
|
|
(381,614 |
) |
|
|
— |
|
| Net change in unrealized (appreciation) depreciation in New Mountain Finance Holdings, L.L.C. |
|
|
(1,563,505 |
) |
|
|
6,212,133 |
|
| (Increase) decrease in operating assets: |
|
|
|
|
|
|
|
|
| Distributions from New Mountain Finance Holdings, L.L.C. |
|
|
24,872,983 |
|
|
|
11,324,285 |
|
|
|
|
|
|
|
|
|
|
| Net cash flows provided by (used in) operating activities |
|
|
24,872,983 |
|
|
|
11,324,285 |
|
|
|
|
|
|
|
|
|
|
| Cash flows from financing activities |
|
|
|
|
|
|
|
|
| Proceeds from shares sold |
|
|
58,216,467 |
|
|
|
— |
|
| Distribution to New Mountain Guardian AIV, L.P. |
|
|
(58,216,467 |
) |
|
|
— |
|
| Dividends paid |
|
|
(24,872,983 |
) |
|
|
(11,324,285 |
) |
|
|
|
|
|
|
|
|
|
| Net cash flows (used in) provided by financing activities |
|
|
(24,872,983 |
) |
|
|
(11,324,285 |
) |
|
|
|
|
|
|
|
|
|
| Net increase (decrease) in cash and cash equivalents |
|
|
— |
|
|
|
— |
|
| Cash and cash equivalents at the beginning of the period |
|
|
— |
|
|
|
— |
|
|
|
|
|
|
|
|
|
|
| Cash and cash equivalents at the end of the period |
|
$ |
— |
|
|
$ |
— |
|
|
|
|
|
|
|
|
|
|
| Non-cash financing activities: |
|
|
|
|
|
|
|
|
| New Mountain Guardian AIV, L.P. contribution of New Mountain Finance Holdings, L.L.C. units for shares of New Mountain Finance AIV
Holdings, L.L.C. |
|
$ |
— |
|
|
$ |
298,406,533 |
|
| Deferred offering costs allocated from New Mountain Finance Holdings, L.L.C. |
|
|
(165,487 |
) |
|
|
(7,558,581 |
) |
The accompanying notes are an integral part of these financial statements.
F-27
Combined Notes to the Consolidated Financial Statements of
New Mountain Finance Holdings, L.L.C.,
the Financial Statements of New Mountain Finance Corporation and the Financial Statements
of
New Mountain Finance AIV Holdings Corporation
September 30, 2012
(unaudited)
The information in
these combined notes to the financial statements relates to each of the three separate registrants: New Mountain Finance Holdings, L.L.C., New Mountain Finance Corporation and New Mountain Finance AIV Holdings Corporation (collectively, the
“Companies”). Information that relates to an individual registrant will be specifically referenced by the respective company. None of the Companies makes any representation as to the information related solely to the other registrants
other than itself.
Note 1. Formation and Business Purpose
New Mountain Finance Holdings, L.L.C. (“NMF Holdings”, the “Operating Company” or the “Master Fund”) is a Delaware limited liability company. NMF Holdings is externally managed and has
elected to be treated as a business development company (“BDC”) under the Investment Company Act of 1940, as amended (the “1940 Act”). As such, NMF Holdings is obligated to comply with certain regulatory requirements. NMF
Holdings intends to be treated as a partnership for federal income tax purposes for so long as it has at least two members.
NMF
Holdings is externally managed by New Mountain Finance Advisers BDC, L.L.C. (the “Investment Adviser”). New Mountain Finance Administration, L.L.C. (the “Administrator”) provides the administrative services necessary for
operations. The Investment Adviser and Administrator are wholly-owned subsidiaries of New Mountain Capital (defined as New Mountain Capital Group, L.L.C. and its affiliates). New Mountain Capital is a firm with a track record of investing in the
middle market and with assets under management (which includes amounts committed, not all of which have been drawn down and invested to date) totaling approximately $9.0 billion as of September 30, 2012. New Mountain Capital focuses on
investing in defensive growth companies across its private equity, public equity, and credit investment vehicles. NMF Holdings, formerly known as New Mountain Guardian (Leveraged), L.L.C., was originally formed as a subsidiary of New Mountain
Guardian AIV, L.P. (“Guardian AIV”) by New Mountain Capital in October 2008. Guardian AIV was formed through an allocation of approximately $300.0 million of the $5.1 billion of commitments supporting New Mountain
Partners III, L.P., a private equity fund managed by New Mountain Capital. In February 2009, New Mountain Capital formed a co-investment vehicle, New Mountain Guardian Partners, L.P., comprising $20.4 million of commitments. New
Mountain Guardian (Leveraged), L.L.C. and New Mountain Guardian Partners, L.P., together with their respective direct and indirect wholly-owned subsidiaries, are defined as the “Predecessor Entities”.
New Mountain Finance Corporation (“NMFC”) is a Delaware corporation that was originally incorporated on June 29, 2010. NMFC is a
closed-end, non-diversified management investment company that has elected to be treated as a BDC under the 1940 Act. As such, NMFC is obligated to comply with certain regulatory requirements. NMFC has elected to be treated, and intends to comply
with the requirements to continue to qualify annually, as a regulated investment company (“RIC”) under Subchapter M of the Internal Revenue Code of 1986, as amended, (the “Code”).
New Mountain Finance AIV Holdings Corporation (“AIV Holdings”) is a Delaware corporation that was originally incorporated on
March 11, 2011. Guardian AIV, a Delaware limited partnership, is AIV Holdings’ sole stockholder. AIV Holdings is a closed-end, non-diversified management investment
F-28
Combined Notes to the Consolidated Financial Statements of
New Mountain Finance Holdings, L.L.C.,
the Financial Statements of New Mountain Finance Corporation and the Financial Statements
of
New Mountain Finance AIV Holdings Corporation (continued)
company that has elected to be treated as a BDC under the 1940 Act. As such, AIV Holdings is obligated to comply with certain regulatory requirements. AIV Holdings has elected to be treated, and
intends to comply with the requirements to continue to qualify annually, as a RIC under the Code.
On May 19, 2011, NMFC priced its
initial public offering (the “IPO”) of 7,272,727 shares of common stock at a public offering price of $13.75 per share. Concurrently with the closing of the IPO and at the public offering price of $13.75 per share, NMFC sold an additional
2,172,000 shares of its common stock to certain executives and employees of, and other individuals affiliated with, New Mountain Capital in a concurrent private placement (the “Concurrent Private Placement”). Additionally, 1,252,964 shares
were issued to the limited partners of New Mountain Guardian Partners, L.P. at that time for their ownership interest in the Predecessor Entities. In connection with NMFC’s IPO and through a series of transactions, NMF Holdings owns all of
the operations of the Predecessor Entities, including all of the assets and liabilities related to such operations.
On July 10,
2012, NMFC’s shelf registration statement became effective. On July 17, 2012, NMFC completed a public offering of 5,250,000 shares of its common stock at a public offering price of $14.35 per share. In connection with the offering, the
underwriters purchased an additional 676,802 shares with the exercise of the overallotment option to purchase up to an additional 787,500 shares of common stock. As a result of this public offering, NMFC and AIV Holdings owned approximately 45.1%
and 54.9%, respectively, of the units of NMF Holdings.
On September 28, 2012, NMFC completed an underwritten secondary public
offering of 4,000,000 shares of its common stock at a public offering price of $15.00 per share on behalf of a selling stockholder, AIV Holdings. No shares were sold by NMFC, and it did not receive any proceeds from this secondary public offering.
The Operating Company and NMFC did not bear any expenses in connection with this offering. The offering expenses were borne by the selling stockholder, AIV Holdings. After completion of this underwritten secondary public offering, NMFC and AIV
Holdings owned approximately 56.0% and 44.0%, respectively, of the units of NMF Holdings.
NMFC and AIV Holdings are holding companies
with no direct operations of their own, and their sole asset is their ownership in NMF Holdings. NMFC and AIV Holdings each entered into a joinder agreement with respect to the Limited Liability Company Agreement, as amended and restated, of NMF
Holdings, pursuant to which NMFC and AIV Holdings were admitted as members of NMF Holdings. NMFC acquired from NMF Holdings, with the gross proceeds of the IPO and the Concurrent Private Placement, common membership units (“units”) of NMF
Holdings (the number of units are equal to the number of shares of NMFC’s common stock sold in the IPO and the Concurrent Private Placement). Additionally, NMFC received units of NMF Holdings equal to the number of shares of common stock of
NMFC issued to the limited partners of New Mountain Guardian Partners, L.P. Guardian AIV was the parent of NMF Holdings prior to the IPO and, as a result of the transactions completed in connection with the IPO, obtained units in NMF Holdings.
Guardian AIV contributed its units in NMF Holdings to its newly formed subsidiary, AIV Holdings, in exchange for common stock of AIV Holdings. AIV Holdings has the right to exchange all or any portion of its units in NMF Holdings for shares of
NMFC’s common stock on a one-for-one basis.
As part of the third quarter 2012 dividend payment, NMFC issued an additional 66,142
shares in conjunction with its dividend reinvestment plan at a price of $14.82. As of September 30, 2012, NMFC and AIV Holdings own approximately 56.1% and 43.9%, respectively, of the units of NMF Holdings.
F-29
Combined Notes to the Consolidated Financial Statements of
New Mountain Finance Holdings, L.L.C.,
the Financial Statements of New Mountain Finance Corporation and the Financial Statements
of
New Mountain Finance AIV Holdings Corporation (continued)
The current structure was designed to generally prevent NMFC from being allocated taxable income with respect to unrecognized gains that existed at the time of the IPO in the Predecessor Entities’ assets, and
rather such amounts would be allocated generally to AIV Holdings. The result is that any distributions made to NMFC’s stockholders that are attributable to such gains generally will not be treated as taxable dividends but rather as return of
capital.
The diagram below depicts the Companies’ current organizational structure as of September 30, 2012.
NMF Holdings’ investment objective is to generate current income and capital appreciation through the
sourcing and origination of debt securities at all levels of the capital structure, including first and second lien debt, notes, bonds and mezzanine securities. In some cases, NMF Holdings’ investments may also include equity interests. The
primary focus is in the debt of defensive growth
F-30
Combined Notes to the Consolidated Financial Statements of
New Mountain Finance Holdings, L.L.C.,
the Financial Statements of New Mountain Finance Corporation and the Financial Statements
of
New Mountain Finance AIV Holdings Corporation (continued)
companies, which are defined as generally exhibiting the following characteristics: (i) sustainable secular growth drivers, (ii) high barriers to competitive entry, (iii) high free
cash flow after capital expenditure and working capital needs, (iv) high returns on assets and (v) opportunities for niche market dominance.
Note 2. Summary of Significant Accounting Policies
Basis of accounting—The Companies’ financial statements have been prepared in conformity with accounting principles generally accepted in the United States of America (“GAAP”). NMF
Holdings consolidates its wholly-owned subsidiary, New Mountain Finance SPV Funding, L.L.C. (“NMF SLF”). NMFC and AIV Holdings do not consolidate the Operating Company. NMFC and AIV Holdings apply investment company master-feeder financial
statement presentation, as described in Accounting Standards Codification 946, Financial Services—Investment Companies, (“ASC 946”) to their interest in the Operating Company. NMFC and AIV Holdings observe that it is industry
practice to follow the presentation prescribed for a Master Fund-Feeder Fund structure in ASC 946 in instances in which a Master Fund is owned by more than one feeder fund and that such presentation provides stockholders of NMFC and AIV Holdings
with a clearer depiction of their investment in the Master Fund.
The Companies’ financial statements reflect all adjustments and
reclassifications which, in the opinion of management, are necessary for the fair presentation of the results of operations and financial condition for all periods presented. All intercompany transactions have been eliminated. Revenues are
recognized when earned and expenses when incurred. The financial results of the Operating Company’s portfolio investments are not consolidated in the financial statements. Prior to the IPO, an affiliate of the Predecessor Entities paid a
majority of the management and incentive fees. Historical operating expenses do not reflect the allocation of certain professional fees, administrative and other expenses that have been incurred following the completion of the IPO. Accordingly, the
Operating Company’s historical operating expenses are not comparable to its operating expenses after the completion of the IPO.
The Companies’ interim financial statements are prepared in accordance with GAAP for interim financial information and pursuant to the
requirements for reporting on Form 10-Q and Articles 6 or 10 of Regulation S-X. Accordingly, the Companies’ interim financial statements do not include all of the information and notes required by GAAP for annual financial statements. In
the opinion of management, all adjustments, consisting solely of normal recurring accruals considered necessary for the fair presentation of financial statements for the interim period, have been included. The current period’s results of
operations will not necessarily be indicative of results that ultimately may be achieved for the fiscal year ending December 31, 2012.
Investments—The Operating Company applies fair value accounting in accordance with GAAP. Fair value is the amount that would be received to sell an asset or paid to transfer a liability in an
orderly transaction between market participants at the measurement date. Investments are reflected on the Operating Company’s Consolidated Statements of Assets, Liabilities and Members’ Capital at fair value, with changes in unrealized
gains and losses resulting from changes in fair value reflected in the Operating Company’s Consolidated Statements of Operations as “Net change in unrealized appreciation (depreciation) of investments” and realizations on portfolio
investments reflected in the Operating Company’s Consolidated Statements of Operations as “Net realized gains (losses) on investments”.
F-31
Combined Notes to the Consolidated Financial Statements of
New Mountain Finance Holdings, L.L.C.,
the Financial Statements of New Mountain Finance Corporation and the Financial Statements
of
New Mountain Finance AIV Holdings Corporation (continued)
The Operating Company values its assets on a quarterly basis, or more frequently if required under the 1940 Act. In all cases, the Operating Company’s board of directors is ultimately and solely responsible
for determining the fair value of the portfolio investments on a quarterly basis in good faith, including investments that are not publicly traded, those whose market prices are not readily available and any other situation where its portfolio
investments require a fair value determination. Security transactions are accounted for on a trade date basis. The Operating Company’s quarterly valuation procedures are set forth in more detail below:
(1) Investments for which market quotations are readily available on an exchange are valued at such market quotations based on the
closing price indicated from independent pricing services.
(2) Investments for which indicative prices are obtained from
various pricing services and/or brokers or dealers are valued through a multi-step valuation process, as described below, to determine whether the quote(s) obtained is representative of fair value in accordance with GAAP.
a. Bond quotes are obtained through independent pricing services. Internal reviews are performed by the investment professionals of
the Investment Adviser to ensure that the quote obtained is representative of fair value in accordance with GAAP and if so, the quote is used. If the Investment Adviser is unable to sufficiently validate the quote(s) internally and if the
investment’s par value exceeds the materiality threshold, the investment is valued similarly to those assets with no readily available quotes (see (3) below); and
b. For investments other than bonds, the Operating Company looks at the number of quotes readily available and performs the
following:
i. Investments for which two or more quotes are received from a pricing service are valued using the mean of
the mean of the bid and ask of the quotes obtained;
ii. Investments for which one quote is received from a pricing
service are validated internally. The investment professionals of the Investment Adviser analyze the market quotes obtained using an array of valuation methods (further described below) to validate the fair value. If the Investment Adviser is unable
to sufficiently validate the quote internally and if the investment’s par value exceeds the materiality threshold, the investment is valued similarly to those assets with no readily available quotes (see (3) below).
(3) Investments for which quotations are not readily available through exchanges, pricing services, brokers, or dealers are valued
through a multi-step valuation process:
a. Each portfolio company or investment is initially valued by the investment
professionals of the Investment Adviser responsible for the credit monitoring;
b. Preliminary valuation conclusions
will then be documented and discussed with the Operating Company’s senior management;
c. If an investment falls
into (3) above for four consecutive quarters and if the investment’s par value exceeds the materiality threshold, then at least once each fiscal year, the valuation for each portfolio investment for which the Operating Company does not
have a readily available market quotation will be reviewed by an independent valuation firm engaged by our board of directors; and
F-32
Combined Notes to the Consolidated Financial Statements of
New Mountain Finance Holdings, L.L.C.,
the Financial Statements of New Mountain Finance Corporation and the Financial Statements
of
New Mountain Finance AIV Holdings Corporation (continued)
d. Also, when deemed appropriate by the Operating Company’s management, an independent valuation firm may be engaged to review and value investment(s) of a portfolio company, without any preliminary
valuation being performed by the Investment Adviser. The investment professionals of the Investment Adviser will review and validate the value provided.
Valuation methods may include comparisons of financial ratios of the portfolio companies that issued such private securities to peer companies that are public, the nature of and the realizable value of any
collateral, the portfolio company’s earnings, discounted cash flows, the ability to make payments, the markets in which the portfolio company conducts business, and other relevant factors, including available market data such as relevant and
applicable market trading and transaction comparables; applicable market yields and multiples; security covenants; call protection provisions; information rights; comparable merger and acquisition transactions; and the principal market and
enterprise values. When an external event such as a purchase transaction, public offering or subsequent sale occurs, the Operating Company will consider the pricing indicated by the external event to corroborate the private valuation.
The values assigned to investments are based upon available information and do not necessarily represent amounts which might ultimately be
realized, since such amounts depend on future circumstances and cannot be reasonably determined until the individual positions are liquidated. Due to the inherent uncertainty of determining the fair value of investments that do not have a readily
available market value, the fair value of NMF Holdings’ investments may fluctuate from period to period.
NMFC and AIV Holdings are
holding companies with no direct operations of their own, and their sole asset is their ownership in the Operating Company. NMFC’s and AIV Holdings’ investments in the Operating Company are carried at fair value and represent the
respective pro-rata interest in the net assets of the Operating Company as of the applicable reporting date. NMFC and AIV Holdings value their ownership interest on a quarterly basis, or more frequently if required under the 1940 Act.
See Note 3, Investments, for further discussion relating to investments.
Cash and cash equivalents—Cash and cash equivalents include cash and short-term, highly liquid investments. The Companies define
cash equivalents as securities that are readily convertible into known amounts of cash and so near maturity that there is insignificant risk of changes in value. Generally, these securities have original maturities of three months or less.
Revenue recognition
The Operating Company’s revenue recognition policies are as follows:
Sales
and paydowns of investments: Realized gains and losses on investments are determined on the specific identification method.
Interest income: Interest income, including amortization of premium and discount using the effective interest method, is recorded on the accrual basis and periodically assessed for collectability. Interest
income also includes interest earned from cash on hand. Upon the prepayment of a loan or debt security, any prepayment penalties are recorded as part of interest
F-33
Combined Notes to the Consolidated Financial Statements of
New Mountain Finance Holdings, L.L.C.,
the Financial Statements of New Mountain Finance Corporation and the Financial Statements
of
New Mountain Finance AIV Holdings Corporation (continued)
income. The Operating Company has loans in the portfolio that contain a payment-in-kind (“PIK”) provision. PIK represents interest that is accrued and recorded as interest income at the
contractual rates, added to the loan principal on the respective capitalization dates, and generally due at maturity.
Non-accrual income: Loans are placed on non-accrual status when principal or interest payments are past due 30 days or
more and when there is reasonable doubt that principal or interest will be collected. Accrued cash and un-capitalized PIK interest is generally reversed when a loan is placed on non-accrual status. Previously capitalized PIK interest is not reversed
when an investment is placed on non-accrual status. Interest payments received on non-accrual loans may be recognized as income or applied to principal depending upon management’s judgment of the ultimate outcome. Non-accrual loans are restored
to accrual status when past due principal and interest is paid and, in management’s judgment, are likely to remain current.
Other income: Other income represents delayed compensation, consent or amendment fees, revolver fees and other miscellaneous fees received. Delayed compensation is income earned from counterparties on trades
that do not settle within a set number of business days after trade date. Other income may also include fees from bridge loans. NMF Holdings may from time to time enter into bridge financing commitments, an obligation to provide interim financing to
a counterparty until permanent credit can be obtained. These commitments are short-term in nature and may expire unfunded. A fee is received by NMF Holdings for providing such financing.
NMFC’s and AIV Holdings’ revenue recognition policies are as follows:
Revenue, expenses, and capital gains (losses): At each quarterly valuation date, the Operating Company’s investment
income, expenses, net realized gains (losses), and net increase (decrease) in unrealized appreciation (depreciation) are allocated to NMFC and AIV Holdings based on their pro-rata interest in the net assets of the Operating Company. This is recorded
on NMFC’s and AIV Holdings’ Statements of Operations. Realized gains and losses are recorded upon sales of NMFC’s and AIV Holdings’ investments in the Operating Company. Net change in unrealized appreciation (depreciation) of
investment in New Mountain Finance Holdings, L.L.C. is the difference between the net asset value per share and the closing price per share for shares issued as part of the dividend reinvestment plan on the dividend payment date. This net change in
unrealized appreciation (depreciation) of investment in New Mountain Finance Holdings, L.L.C. includes the unrealized appreciation (depreciation) from the IPO. NMFC used the proceeds from its IPO and Concurrent Private Placement to purchase units in
the Operating Company at $13.75 per unit (its IPO price per share). At the IPO date, $13.75 per unit represented a discount to the actual net asset value per unit of the Operating Company. As a result, NMFC experienced immediate unrealized
appreciation on its investment. Concurrently, AIV Holdings experienced immediate unrealized depreciation on its investment in the Operating Company equal to the difference between NMFC’s IPO price of $13.75 per unit and the actual net asset
value per unit.
All expenses, including those of NMFC and AIV Holdings, are paid and recorded by the Operating Company.
Expenses are allocated to NMFC and AIV Holdings based on pro-rata ownership interest. In addition, the Operating Company paid all of the offering costs related to the IPO. NMFC and AIV Holdings have recorded their portion of the offering costs
excluding underwriters’ discounts or commissions as a direct reduction to net assets and the cost of their investment in the Operating Company.
F-34
Combined Notes to the Consolidated Financial Statements of
New Mountain Finance Holdings, L.L.C.,
the Financial Statements of New Mountain Finance Corporation and the Financial Statements
of
New Mountain Finance AIV Holdings Corporation (continued)
With respect to the expenses incident to any registration of shares of NMFC’s common stock issued in exchange for AIV Holdings’ units of the Operating Company, AIV Holdings is directly responsible for the
expenses of any demand registration (including underwriters’ discounts or commissions) and their pro-rata share of any “piggyback” registration expenses.
Interest and other credit facility expenses—Interest and other credit facility fees are recorded on an accrual basis by the Operating Company. See Note 7, Borrowing Facilities, for
details.
Deferred credit facility costs—The deferred credit facility costs of the Operating Company consist of
capitalized expenses related to the origination and amending of the Operating Company’s existing credit facilities. The Operating Company amortizes these costs into expense using the straight-line method over the stated life of the related
credit facility. See Note 7, Borrowing Facilities, for details.
Income taxes—NMF Holdings is treated as
a partnership for federal income tax purposes. Accordingly, no provision for income taxes has been made in the accompanying financial statements, as the partners are individually responsible for reporting income or loss based on their respective
share of the revenues and expenses. NMF Holdings files United States (“U.S.”) federal, state, and local income tax returns.
NMFC and AIV Holdings have elected to be treated, and intend to comply with the requirements to qualify annually, as RICs under subchapter M
of the Code. As RICs, NMFC and AIV Holdings are not subject to federal income tax on the portion of taxable income and gains timely distributed to stockholders; therefore, no provision for income taxes has been recorded.
To continue to qualify as RICs, NMFC and AIV Holdings are required to meet certain income and asset diversification tests in addition to
distributing at least 90.0% of their respective investment company taxable income, as defined by the Code. Since federal income tax regulations differ from GAAP, distributions in accordance with tax regulations may differ from net investment income
and realized gains recognized for financial reporting purposes.
Differences between taxable income and the results of operations for
financial reporting purposes may be permanent or temporary in nature. Permanent differences are reclassified among capital accounts in the financial statements to reflect their tax character. Differences in classification may also result from the
treatment of short-term gains as ordinary income for tax purposes.
For federal income tax purposes, distributions paid to stockholders
of NMFC and AIV Holdings are reported as ordinary income, return of capital, long term capital gains or a combination thereof.
NMFC and
AIV Holdings will be subject to a 4.0% nondeductible federal excise tax on certain undistributed income unless NMFC and AIV Holdings distribute, in a timely manner as required by the Code, an amount at least equal to the sum of (1) 98.0% of
their respective net ordinary income earned for the calendar year and (2) 98.2% of their respective capital gain net income for the one-year period ending October 31 in the calendar year.
The Companies have adopted the Income Taxes topic of the Codification (“ASC 740”). ASC 740 provides guidance for how uncertain income tax
positions should be recognized, measured, and disclosed in the financial statements. Based on their analyses, the Companies have determined that the adoption of ASC 740 did not have a material impact to the Companies’ financial statements.
F-35
Combined Notes to the Consolidated Financial Statements of
New Mountain Finance Holdings, L.L.C.,
the Financial Statements of New Mountain Finance Corporation and the Financial Statements
of
New Mountain Finance AIV Holdings Corporation (continued)
Dividends—Distributions to common unit holders of NMF Holdings and common stockholders of NMFC and AIV Holdings are recorded on the record date as set by the respective board of directors. In
order for NMFC and AIV Holdings to pay a dividend or other distribution to holders of their common stock, it must be accompanied by a prior distribution by NMF Holdings to all of its unit holders. NMF Holdings intends to make distributions to its
unit holders that will be sufficient to enable NMFC and AIV Holdings to pay quarterly distributions to their stockholders and to obtain and maintain their status as RICs. NMFC and AIV Holdings intend to distribute approximately all of their portion
of NMF Holdings’ adjusted net investment income (see Note 5, Agreements) on a quarterly basis and substantially all of their portion of NMF Holdings’ taxable income on an annual basis, except that NMFC may retain certain net
capital gains for reinvestment.
Under certain circumstances, the distributions that NMF Holdings makes to its members may not be
sufficient for AIV Holdings to satisfy the annual distribution requirement necessary for AIV Holdings to continue to qualify as a RIC. In that case, it is expected that Guardian AIV would consent to be treated as if it received distributions from
AIV Holdings sufficient to satisfy the annual distribution requirement. Guardian AIV would be required to include the consent dividend in its taxable income as a dividend from AIV Holdings, which would result in phantom (i.e., non-cash) taxable
income to Guardian AIV. AIV Holdings intends to make quarterly distributions to Guardian AIV, its sole stockholder, out of assets legally available for distribution each quarter.
NMF Holdings and NMFC are required to take certain actions in order to maintain, at all times, a one-to-one ratio between the number of units held
by NMFC and the number of shares of NMFC’s common stock outstanding. NMFC has adopted a dividend reinvestment plan that provides on behalf of its stockholders for reinvestment of any distributions declared, unless a stockholder elects to
receive cash. Cash distributions reinvested in additional shares of NMFC’s common stock will be automatically reinvested by NMFC into additional units of NMF Holdings. In addition, AIV Holdings does not intend to reinvest any distributions
received from NMF Holdings in additional units of NMF Holdings.
NMFC applies the following in implementing the dividend reinvestment
plan. If the price at which newly issued shares are to be credited to stockholders’ accounts is greater than 110.0% of the last determined net asset value of the shares, NMFC will use only newly issued shares to implement its dividend
reinvestment plan. Under such circumstances, the number of shares to be issued to a stockholder is determined by dividing the total dollar amount of the distribution payable to such stockholder by the market price per share of NMFC’s common
stock on the New York Stock Exchange (“NYSE”) on the distribution payment date. Market price per share on that date will be the closing price for such shares on the NYSE or, if no sale is reported for such day, the average of their
electronically reported bid and asked prices. If NMFC uses newly issued shares to implement the plan, NMFC will receive, on a one-for-one basis, additional units of NMF Holdings in exchange for cash distributions that are reinvested in shares of
NMFC’s common stock under the dividend reinvestment plan.
If the price at which newly issued shares are to be credited to
stockholders’ accounts is less than 110.0% of the last determined net asset value of the shares, NMFC will either issue new shares or instruct the plan administrator to purchase shares in the open market to satisfy the additional shares
required. Shares purchased in open market transactions by the plan administrator will be allocated to a stockholder based on the average purchase price, excluding any brokerage charges or other charges, of all shares of common stock purchased in the
open market. The number of shares of NMFC’s common stock to be outstanding after giving effect to payment of the distribution cannot be established until the value per share at which additional shares will be issued has been determined and
elections of NMFC’s stockholders have been tabulated.
F-36
Combined Notes to the Consolidated Financial Statements of
New Mountain Finance Holdings, L.L.C.,
the Financial Statements of New Mountain Finance Corporation and the Financial Statements
of
New Mountain Finance AIV Holdings Corporation (continued)
Foreign securities—The accounting records of the Operating Company are maintained in U.S. dollars. Investment securities denominated in foreign currencies are translated into U.S. dollars based
on the rate of exchange of such currencies on the date of valuation. Purchases and sales of investment securities and income and expense items denominated in foreign currencies are translated into U.S. dollars based on the rate of exchange of such
currencies on the respective dates of the transactions. The Operating Company does not isolate that portion of the results of operations resulting from changes in foreign exchange rates on investments from the fluctuations arising from changes in
market prices of securities held. Such fluctuations are included with “Net change in unrealized (depreciation) appreciation of investments” and “Net realized gains (losses) on investments” in the Operating Company’s
Consolidated Statements of Operations.
Investments denominated in foreign currencies may be negatively affected by movements in the
rate of exchange between the U.S. dollar and such foreign currencies. This movement is beyond the control of the Operating Company and cannot be predicted.
Use of estimates—The preparation of the Companies’ financial statements in conformity with GAAP requires management to make estimates and assumptions that affect the reported amounts of
assets and liabilities at the date of the Companies’ financial statements and the reported amounts of revenues and expenses during the reporting periods. Changes in the economic environment, financial markets, and other metrics used in
determining these estimates could cause actual results to differ from the estimates used, and the differences could be material.
Note 3.
Investments
At September 30, 2012 the Operating Company’s investments consisted of the following:
Investment Cost and Fair Value by Type
|
|
|
|
|
|
|
|
|
| |
|
Cost |
|
|
Fair Value |
|
| First lien |
|
$ |
512,728,758 |
|
|
$ |
516,696,669 |
|
| Second lien |
|
|
300,529,375 |
|
|
|
306,000,868 |
|
| Subordinated |
|
|
27,652,784 |
|
|
|
29,798,484 |
|
| Equity and other |
|
|
3,613,796 |
|
|
|
6,388,157 |
|
|
|
|
|
|
|
|
|
|
| Total investments |
|
$ |
844,524,713 |
|
|
$ |
858,884,178 |
|
|
|
|
|
|
|
|
|
|
F-37
Combined Notes to the Consolidated Financial Statements of
New Mountain Finance Holdings, L.L.C.,
the Financial Statements of New Mountain Finance Corporation and the Financial Statements
of
New Mountain Finance AIV Holdings Corporation (continued)
Investment Cost and Fair Value by Industry
|
|
|
|
|
|
|
|
|
| |
|
Cost |
|
|
Fair Value |
|
| Software |
|
$ |
211,165,998 |
|
|
$ |
215,457,937 |
|
| Education |
|
|
149,780,665 |
|
|
|
146,202,123 |
|
| Healthcare Services |
|
|
126,716,910 |
|
|
|
132,744,997 |
|
| Federal Services |
|
|
82,867,599 |
|
|
|
83,517,909 |
|
| Business Services |
|
|
57,744,926 |
|
|
|
60,316,516 |
|
| Media |
|
|
32,946,426 |
|
|
|
37,280,506 |
|
| Information Services |
|
|
32,334,098 |
|
|
|
32,813,581 |
|
| Healthcare Products |
|
|
31,125,366 |
|
|
|
32,325,000 |
|
| Consumer Services |
|
|
31,109,526 |
|
|
|
31,679,894 |
|
| Logistics |
|
|
25,475,267 |
|
|
|
24,930,000 |
|
| Industrial Services |
|
|
16,769,702 |
|
|
|
17,042,500 |
|
| Healthcare Information Technology |
|
|
14,616,427 |
|
|
|
13,299,722 |
|
| Retail |
|
|
11,614,165 |
|
|
|
12,060,709 |
|
| Energy |
|
|
10,414,096 |
|
|
|
10,657,658 |
|
| Information Technology |
|
|
6,460,378 |
|
|
|
6,276,585 |
|
| Power Generation |
|
|
3,383,164 |
|
|
|
2,278,541 |
|
|
|
|
|
|
|
|
|
|
| Total investments |
|
$ |
844,524,713 |
|
|
$ |
858,884,178 |
|
|
|
|
|
|
|
|
|
|
At December 31, 2011 the Operating Company’s investments consisted of the following:
Investment Cost and Fair Value by Type
|
|
|
|
|
|
|
|
|
| |
|
Cost |
|
|
Fair Value |
|
| First lien |
|
$ |
407,538,564 |
|
|
$ |
410,313,643 |
|
| Second lien |
|
|
262,532,416 |
|
|
|
262,701,495 |
|
| Subordinated |
|
|
26,672,980 |
|
|
|
27,648,951 |
|
| Equity and other |
|
|
3,120,824 |
|
|
|
2,849,471 |
|
|
|
|
|
|
|
|
|
|
| Total investments |
|
$ |
699,864,784 |
|
|
$ |
703,513,560 |
|
|
|
|
|
|
|
|
|
|
F-38
Combined Notes to the Consolidated Financial Statements of
New Mountain Finance Holdings, L.L.C.,
the Financial Statements of New Mountain Finance Corporation and the Financial Statements
of
New Mountain Finance AIV Holdings Corporation (continued)
Investment Cost and Fair Value by Industry
|
|
|
|
|
|
|
|
|
| |
|
Cost |
|
|
Fair Value |
|
| Software |
|
$ |
153,797,485 |
|
|
$ |
155,642,372 |
|
| Healthcare Services |
|
|
113,200,121 |
|
|
|
117,544,595 |
|
| Education |
|
|
104,237,094 |
|
|
|
101,794,083 |
|
| Business Services |
|
|
73,143,286 |
|
|
|
76,435,801 |
|
| Federal Services |
|
|
70,665,154 |
|
|
|
70,674,563 |
|
| Consumer Services |
|
|
29,357,183 |
|
|
|
29,764,430 |
|
| Information Services |
|
|
29,516,875 |
|
|
|
29,626,611 |
|
| Healthcare Products |
|
|
24,037,614 |
|
|
|
24,875,000 |
|
| Logistics |
|
|
25,407,419 |
|
|
|
24,610,002 |
|
| Industrial Services |
|
|
19,220,188 |
|
|
|
17,543,793 |
|
| Healthcare Information Technology |
|
|
14,704,271 |
|
|
|
14,108,263 |
|
| Media |
|
|
11,756,172 |
|
|
|
11,731,350 |
|
| Specialty Chemicals and Materials |
|
|
9,449,821 |
|
|
|
9,430,359 |
|
| Power Generation |
|
|
9,966,951 |
|
|
|
8,609,943 |
|
| Information Technology |
|
|
6,570,081 |
|
|
|
6,249,251 |
|
| Telecommunication |
|
|
4,835,069 |
|
|
|
4,873,144 |
|
|
|
|
|
|
|
|
|
|
| Total investments |
|
$ |
699,864,784 |
|
|
$ |
703,513,560 |
|
|
|
|
|
|
|
|
|
|
As of September 30, 2012, the Operating Company’s original first lien position in ATI Acquisition Company
remained on non-accrual status due to the inability of the portfolio company to service its interest payment for the quarter then ended and uncertainty about its ability to pay such amounts in the future. As of September 30, 2012, this first
lien debt investment had a cost basis of $4,306,437, a fair value of $332,438 and total unearned interest income of $154,682 and $451,916, respectively, for the three and nine months then ended. Additionally, the Operating Company has two super
priority first lien debt investments in ATI Acquisition Company with a combined cost basis of $1,610,357 and a combined fair value of $1,149,177 as of September 30, 2012. Unrealized gains include a fee that the Operating Company would receive
upon maturity of the two super priority first lien debt investments. During the third quarter of 2012, the Operating Company placed the super priority first lien positions on non-accrual status as well, resulting in the aggregate reversal of accrued
interest income of $232,147, of which $155,462 was previously earned and accrued in prior periods (prior to the quarter ended September 30, 2012 and dating back to October 1, 2011). No PIK was recorded during the quarter ended
September 30, 2012 related to the two super priority first lien positions. As of September 30, 2012, the Operating Company’s total investment in ATI Acquisition Company had an aggregate cost basis of $5,916,794 and an aggregate fair
value of $1,481,615, putting the entire ATI Acquisition Company positions on non-accrual. As of December 31, 2011, the Operating Company’s original first lien position in ATI Acquisition Company was put on non-accrual status, with a cost
basis of $4,351,747, a fair value of $783,617 and total unearned interest income of $139,793 for the quarter and year then ended. The Operating Company’s two super priority first lien debt investments in ATI Acquisition Company had a combined
cost basis and fair value of $1,576,066 as of December 31, 2011. As of December 31, 2011, the Operating Company’s total investment in ATI Acquisition Company had an aggregate cost basis of $5,927,813 and an aggregate fair value of
$2,359,683.
As of September 30, 2012, the Operating Company had unfunded commitments on revolving credit facilities and bridge
facilities of $13,858,500 and $0, respectively. The Operating Company did
F-39
Combined Notes to the Consolidated Financial Statements of
New Mountain Finance Holdings, L.L.C.,
the Financial Statements of New Mountain Finance Corporation and the Financial Statements
of
New Mountain Finance AIV Holdings Corporation (continued)
not have any unfunded commitments in the form of a delayed draw or other future funding commitments as of September 30, 2012. These unfunded commitments are disclosed on the Operating
Company’s Consolidated Schedule of Investments as of September 30, 2012.
As of December 31, 2011, the Operating Company
had unfunded commitments on revolving credit facilities and bridge facilities of $22,698,500 and $35,000,000, respectively. Additionally, the Operating Company had unfunded commitments in the form of a delayed draw or other future funding
commitments of $4,250,632 as of December 31, 2011. These unfunded commitments are disclosed on the Operating Company’s Consolidated Schedules of Investments as of December 31, 2011.
Investment Risk Factor—First and second lien debt that the Operating Company invests in is entirely, or almost entirely, rated
below investment grade or may be unrated. These loans are considered speculative because of the credit risk of the issuers. Such issuers are considered more likely than investment grade issuers to default on their payments of interest and principal
and such defaults could reduce the net asset value and income distributions of the Operating Company. First and second lien debt may also lose significant market value before a default occurs. Furthermore, an active trading market may not exist for
these first and second lien loans. This illiquidity may make it more difficult to value the debt.
Subordinated debt is generally
subject to similar risks as those associated with first and second lien debt, except that such debt is subordinated in payment and /or lower in lien priority. Subordinated debt is subject to the additional risk that the cash flow of the borrower and
the property securing the debt, if any, may be insufficient to meet scheduled payments after giving effect to the senior secured and unsecured obligations of the borrower.
Note 4. Fair Value
Fair value is the amount that would be received to sell an asset or
paid to transfer a liability in an orderly transaction between market participants at the measurement date. Accounting Standards Codification 820, Fair Value Measurements and Disclosures (“ASC 820”), establishes a fair value
hierarchy that prioritizes and ranks the inputs to valuation techniques used in measuring investments at fair value. The hierarchy classifies the inputs used in measuring fair value into three levels as follows:
Level I—Quoted prices (unadjusted) are available in active markets for identical investments and the Operating
Company has the ability to access such quotes as of the reporting date. The type of investments which would generally be included in Level I include active exchange-traded equity securities and exchange-traded derivatives. As required by ASC
820, the Operating Company, to the extent that it holds such investments, does not adjust the quoted price for these investments, even in situations where the Operating Company holds a large position and a sale could reasonably impact the quoted
price.
Level II—Pricing inputs are observable for the investments, either directly or indirectly, as of
the reporting date, but are not the same as those used in Level I. Level II inputs include the following:
| |
• |
|
Quoted prices for similar assets or liabilities in active markets; |
| |
• |
|
Quoted prices for identical or similar assets or liabilities in non-active markets (examples include corporate and municipal bonds, which trade infrequently);
|
F-40
Combined Notes to the Consolidated Financial Statements of
New Mountain Finance Holdings, L.L.C.,
the Financial Statements of New Mountain Finance Corporation and the Financial Statements
of
New Mountain Finance AIV Holdings Corporation (continued)
| |
• |
|
Pricing models whose inputs are observable for substantially the full term of the asset or liability (examples include most over-the-counter derivatives,
including foreign exchange forward contracts); and |
| |
• |
|
Pricing models whose inputs are derived principally from or corroborated by observable market data through correlation or other means for substantially the full
term of the asset or liability. |
Level III—Pricing inputs are unobservable for the
investment and include situations where there is little, if any, market activity for the investment.
The inputs used to measure fair
value may fall into different levels. In all instances when the inputs fall within different levels of the hierarchy, the level within which the fair value measurement is categorized is based on the lowest level of input that is significant to the
fair value measurement in its entirety. As such, a Level III fair value measurement may include inputs that are both observable (Levels I and II) and unobservable (Level III). Gains and losses for such assets categorized within
the Level III table below may include changes in fair value that are attributable to both observable inputs (Levels II and III) and unobservable inputs (Level III).
The inputs into the determination of fair value require significant judgment or estimation by management and consider factors specific to each
investment. A review of the fair value hierarchy classifications is conducted on a quarterly basis. Changes in the observability of valuation inputs may result in the reclassification of certain investments within the fair value hierarchy from
period to period. Reclassifications impacting the fair value hierarchy are reported as transfers in/out of the respective leveling categories as of the beginning of the quarter in which the reclassifications occur.
The following table summarizes the levels in the fair value hierarchy that the Operating Company’s portfolio investments fall into as of
September 30, 2012:
|
|
|
|
|
|
|
|
|
|
|
|
|
|
|
|
|
| |
|
Total |
|
|
Level I |
|
|
Level II |
|
|
Level III |
|
| First lien |
|
$ |
516,696,669 |
|
|
$ |
— |
|
|
$ |
466,135,619 |
|
|
$ |
50,561,050 |
|
| Second lien |
|
|
306,000,868 |
|
|
|
— |
|
|
|
262,745,568 |
|
|
|
43,255,300 |
|
| Subordinated |
|
|
29,798,484 |
|
|
|
— |
|
|
|
22,259,500 |
|
|
|
7,538,984 |
|
| Equity and other |
|
|
6,388,157 |
|
|
|
— |
|
|
|
— |
|
|
|
6,388,157 |
|
|
|
|
|
|
|
|
|
|
|
|
|
|
|
|
|
|
| Total investments |
|
$ |
858,884,178 |
|
|
$ |
— |
|
|
$ |
751,140,687 |
|
|
$ |
107,743,491 |
|
|
|
|
|
|
|
|
|
|
|
|
|
|
|
|
|
|
The following table summarizes the levels in the fair value hierarchy that the Operating Company’s portfolio
investments fall into as of December 31, 2011:
|
|
|
|
|
|
|
|
|
|
|
|
|
|
|
|
|
| |
|
Total |
|
|
Level I |
|
|
Level II |
|
|
Level III |
|
| First lien |
|
$ |
410,313,643 |
|
|
$ |
— |
|
|
$ |
377,172,906 |
|
|
$ |
33,140,737 |
|
| Second lien |
|
|
262,701,495 |
|
|
|
— |
|
|
|
214,296,195 |
|
|
|
48,405,300 |
|
| Subordinated |
|
|
27,648,951 |
|
|
|
— |
|
|
|
21,077,500 |
|
|
|
6,571,451 |
|
| Equity and other |
|
|
2,849,471 |
|
|
|
— |
|
|
|
— |
|
|
|
2,849,471 |
|
|
|
|
|
|
|
|
|
|
|
|
|
|
|
|
|
|
| Total investments |
|
$ |
703,513,560 |
|
|
$ |
— |
|
|
$ |
612,546,601 |
|
|
$ |
90,966,959 |
|
|
|
|
|
|
|
|
|
|
|
|
|
|
|
|
|
|
F-41
Combined Notes to the Consolidated Financial Statements of
New Mountain Finance Holdings, L.L.C.,
the Financial Statements of New Mountain Finance Corporation and the Financial Statements
of
New Mountain Finance AIV Holdings Corporation (continued)
The following table summarizes the changes in fair value of Level III portfolio investments for the three months ended September 30, 2012, as well as the portion of appreciation (depreciation) included in
income attributable to unrealized appreciation (depreciation) related to those assets and liabilities still held by the Operating Company at September 30, 2012:
|
|
|
|
|
|
|
|
|
|
|
|
|
|
|
|
|
|
|
|
|
| |
|
Total |
|
|
First Lien |
|
|
Second Lien |
|
|
Subordinated |
|
|
Equity and
other |
|
| Fair value, June 30, 2012 |
|
$ |
106,374,080 |
|
|
$ |
42,747,486 |
|
|
$ |
53,275,300 |
|
|
$ |
7,538,984 |
|
|
$ |
2,812,310 |
|
| Total gains or losses included in earnings: |
|
|
|
|
|
|
|
|
|
|
|
|
|
|
|
|
|
|
|
|
| Net realized gains (losses) on investments |
|
|
105,876 |
|
|
|
105,876 |
|
|
|
— |
|
|
|
— |
|
|
|
— |
|
| Net change in unrealized appreciation (depreciation) |
|
|
3,161,381 |
|
|
|
51,782 |
|
|
|
— |
|
|
|
— |
|
|
|
3,109,599 |
|
| Purchases, including capitalized PIK, revolver fundings and delayed draws |
|
|
11,460,000 |
|
|
|
11,460,000 |
|
|
|
— |
|
|
|
— |
|
|
|
— |
|
| Proceeds from sales and paydowns of investments |
|
|
(10,385,344 |
) |
|
|
(10,385,344 |
) |
|
|
— |
|
|
|
— |
|
|
|
— |
|
| Transfers into Level III(1) |
|
|
7,047,498 |
|
|
|
6,581,250 |
|
|
|
— |
|
|
|
— |
|
|
|
466,248 |
(2) |
| Transfers out of Level III(1) |
|
|
(10,020,000 |
) |
|
|
— |
|
|
|
(10,020,000 |
) |
|
|
— |
|
|
|
— |
|
|
|
|
|
|
|
|
|
|
|
|
|
|
|
|
|
|
|
|
|
|
| Fair value, September 30, 2012 |
|
$ |
107,743,491 |
|
|
$ |
50,561,050 |
|
|
$ |
43,255,300 |
|
|
$ |
7,538,984 |
|
|
$ |
6,388,157 |
|
|
|
|
|
|
|
|
|
|
|
|
|
|
|
|
|
|
|
|
|
|
| Unrealized appreciation (depreciation) for the period relating to those Level III assets that were still held
by the Operating Company at the end of the period: |
|
$ |
3,161,381 |
|
|
$ |
51,782 |
|
|
$ |
— |
|
|
$ |
— |
|
|
$ |
3,109,599 |
|
|
|
|
|
|
|
|
|
|
|
|
|
|
|
|
|
|
|
|
|
|
| (1) |
As of September 30, 2012, the portfolio investments were transferred into Level III from Level II and out of Level III into Level II at fair value as of the
beginning of the quarter in which the reclassifications occurred. |
| (2) |
This Level III transfer relates to the Operating Company’s investment in warrants of YP Equity Investors LLC, which was valued with YP Holdings LLC’s second lien debt
as of June 30, 2012. |
F-42
Combined Notes to the Consolidated Financial Statements of
New Mountain Finance Holdings, L.L.C.,
the Financial Statements of New Mountain Finance Corporation and the Financial Statements
of
New Mountain Finance AIV Holdings Corporation (continued)
The following table summarizes the changes in fair value of Level III portfolio investments for the three months ended September 30, 2011, as well as the portion of appreciation (depreciation) included in
income attributable to unrealized appreciation (depreciation) related to those assets and liabilities still held by the Operating Company at September 30, 2011:
|
|
|
|
|
|
|
|
|
|
|
|
|
|
|
|
|
|
|
|
|
| |
|
Total |
|
|
First Lien |
|
|
Second Lien |
|
|
Subordinated |
|
|
Equity and
other |
|
| Fair value, June 30, 2011 |
|
$ |
44,501,997 |
|
|
$ |
30,794,495 |
|
|
$ |
— |
|
|
$ |
13,231,138 |
|
|
$ |
476,364 |
|
| Total gains or losses included in earnings: |
|
|
|
|
|
|
|
|
|
|
|
|
|
|
|
|
|
|
|
|
| Net change in unrealized appreciation (depreciation) |
|
|
22,914 |
|
|
|
(1,083,701 |
) |
|
|
— |
|
|
|
1,181,247 |
|
|
|
(74,632 |
) |
| Purchases, including capitalized PIK and revolver fundings |
|
|
24,000,000 |
|
|
|
— |
|
|
|
24,000,000 |
|
|
|
— |
|
|
|
— |
|
| Proceeds from sales and paydowns of investments |
|
|
(535,593 |
) |
|
|
(535,593 |
) |
|
|
— |
|
|
|
— |
|
|
|
— |
|
| Transfers out of Level III(1) |
|
|
(14,700,000 |
) |
|
|
(14,700,000 |
) |
|
|
— |
|
|
|
— |
|
|
|
— |
|
|
|
|
|
|
|
|
|
|
|
|
|
|
|
|
|
|
|
|
|
|
| Fair value, September 30, 2011 |
|
$ |
53,289,318 |
|
|
$ |
14,475,201 |
|
|
$ |
24,000,000 |
|
|
$ |
14,412,385 |
|
|
$ |
401,732 |
|
|
|
|
|
|
|
|
|
|
|
|
|
|
|
|
|
|
|
|
|
|
| Unrealized appreciation (depreciation) for the period relating to those Level III assets that were still held by the Operating
Company at the end of the period: |
|
$ |
22,914 |
|
|
$ |
(1,083,701 |
) |
|
$ |
— |
|
|
$ |
1,181,247 |
|
|
$ |
(74,632 |
) |
|
|
|
|
|
|
|
|
|
|
|
|
|
|
|
|
|
|
|
|
|
| (1) |
As of September 30, 2011, the portfolio investments were transferred into Level III from Level II at fair value as of the beginning of the quarter in which the
reclassifications occurred. |
F-43
Combined Notes to the Consolidated Financial Statements of
New Mountain Finance Holdings, L.L.C.,
the Financial Statements of New Mountain Finance Corporation and the Financial Statements
of
New Mountain Finance AIV Holdings Corporation (continued)
The following table summarizes the changes in fair value of Level III portfolio investments for the nine months ended September 30, 2012, as well as the portion of appreciation (depreciation) included in
income attributable to unrealized appreciation (depreciation) related to those assets and liabilities still held by the Operating Company at September 30, 2012:
|
|
|
|
|
|
|
|
|
|
|
|
|
|
|
|
|
|
|
|
|
| |
|
Total |
|
|
First Lien |
|
|
Second Lien |
|
|
Subordinated |
|
|
Equity and
other |
|
| Fair value, December 31, 2011 |
|
$ |
90,966,959 |
|
|
$ |
33,140,737 |
|
|
$ |
48,405,300 |
|
|
$ |
6,571,451 |
|
|
$ |
2,849,471 |
|
| Total gains or losses included in earnings: |
|
|
|
|
|
|
|
|
|
|
|
|
|
|
|
|
|
|
|
|
| Net realized gains (losses) on investments |
|
|
4,274,695 |
|
|
|
4,252,079 |
|
|
|
22,616 |
|
|
|
— |
|
|
|
— |
|
| Net change in unrealized (depreciation) appreciation |
|
|
(1,001,118 |
) |
|
|
(3,851,021 |
) |
|
|
(173,235 |
) |
|
|
(22,576 |
) |
|
|
3,045,714 |
|
| Purchases, including capitalized PIK, revolver fundings and delayed draws |
|
|
57,088,933 |
|
|
|
46,051,481 |
|
|
|
10,020,619 |
|
|
|
990,109 |
|
|
|
26,724 |
|
| Proceeds from sales and paydowns of investments |
|
|
(29,501,938 |
) |
|
|
(24,501,938 |
) |
|
|
(5,000,000 |
) |
|
|
— |
|
|
|
— |
|
| Transfers into Level III(1) |
|
|
7,047,498 |
|
|
|
6,581,250 |
|
|
|
— |
|
|
|
— |
|
|
|
466,248 |
(2) |
| Transfers out of Level III(1) |
|
|
(21,131,538 |
) |
|
|
(11,111,538 |
) |
|
|
(10,020,000 |
) |
|
|
— |
|
|
|
— |
|
|
|
|
|
|
|
|
|
|
|
|
|
|
|
|
|
|
|
|
|
|
| Fair value, September 30, 2012 |
|
$ |
107,743,491 |
|
|
$ |
50,561,050 |
|
|
$ |
43,255,300 |
|
|
$ |
7,538,984 |
|
|
$ |
6,388,157 |
|
|
|
|
|
|
|
|
|
|
|
|
|
|
|
|
|
|
|
|
|
|
| Unrealized appreciation (depreciation) for the period relating to those Level III assets that were still
held by the Operating Company at the end of the period: |
|
$ |
2,612,648 |
|
|
$ |
(409,871 |
) |
|
$ |
(619 |
) |
|
$ |
(22,576 |
) |
|
$ |
3,045,714 |
|
|
|
|
|
|
|
|
|
|
|
|
|
|
|
|
|
|
|
|
|
|
| (1) |
As of September 30, 2012, the portfolio investments were transferred into Level III from Level II and out of Level III into Level II at fair value as of
the beginning of the quarter in which the reclassifications occurred. |
| (2) |
This Level III transfer relates to the Operating Company’s investment in warrants of YP Equity Investors LLC, which was valued with YP Holdings LLC’s second lien debt
as of June 30, 2012. |
F-44
Combined Notes to the Consolidated Financial Statements of
New Mountain Finance Holdings, L.L.C.,
the Financial Statements of New Mountain Finance Corporation and the Financial Statements
of
New Mountain Finance AIV Holdings Corporation (continued)
The following table summarizes the changes in fair value of Level III portfolio investments for the nine months ended September 30, 2011, as well as the portion of appreciation (depreciation) included in
income attributable to unrealized appreciation (depreciation) related to those assets and liabilities still held by the Operating Company at September 30, 2011:
|
|
|
|
|
|
|
|
|
|
|
|
|
|
|
|
|
|
|
|
|
| |
|
Total |
|
|
First Lien |
|
|
Second Lien |
|
|
Subordinated |
|
|
Equity and
other |
|
| Fair value, December 31, 2010 |
|
$ |
30,255,961 |
|
|
$ |
16,975,334 |
|
|
$ |
— |
|
|
$ |
12,747,764 |
|
|
$ |
532,863 |
|
| Total gains or losses included in earnings: |
|
|
|
|
|
|
|
|
|
|
|
|
|
|
|
|
|
|
|
|
| Net change in unrealized appreciation (depreciation) |
|
|
811,495 |
|
|
|
(487,407 |
) |
|
|
— |
|
|
|
1,452,203 |
|
|
|
(153,301 |
) |
| Purchases, including capitalized PIK and revolver fundings |
|
|
38,210,181 |
|
|
|
13,975,593 |
|
|
|
24,000,000 |
|
|
|
212,418 |
|
|
|
22,170 |
|
| Proceeds from sales and paydowns of investments |
|
|
(535,593 |
) |
|
|
(535,593 |
) |
|
|
— |
|
|
|
— |
|
|
|
— |
|
| Transfers into Level III(1) |
|
|
(752,726 |
) |
|
|
(752,726 |
) |
|
|
— |
|
|
|
— |
|
|
|
— |
|
| Transfers out of Level III(1) |
|
|
(14,700,000 |
) |
|
|
(14,700,000 |
) |
|
|
— |
|
|
|
— |
|
|
|
— |
|
|
|
|
|
|
|
|
|
|
|
|
|
|
|
|
|
|
|
|
|
|
| Fair value, September 30, 2011 |
|
$ |
53,289,318 |
|
|
$ |
14,475,201 |
|
|
$ |
24,000,000 |
|
|
$ |
14,412,385 |
|
|
$ |
401,732 |
|
|
|
|
|
|
|
|
|
|
|
|
|
|
|
|
|
|
|
|
|
|
| Unrealized appreciation (depreciation) for the period relating to those Level III assets that were still held by the Operating
Company at the end of the period: |
|
$ |
811,495 |
|
|
$ |
(487,407 |
) |
|
$ |
— |
|
|
$ |
1,452,203 |
|
|
$ |
(153,301 |
) |
|
|
|
|
|
|
|
|
|
|
|
|
|
|
|
|
|
|
|
|
|
| (1) |
As of September 30, 2011, the portfolio investments were transferred into Level III from Level II and out of Level III into Level II at fair value as of the
beginning of the quarter in which the reclassifications occurred. |
Except as noted in the tables above, there were no
other transfers in or out of Level I, II, or III during the three and nine months ended September 30, 2012 and September 30, 2011. Transfers into Level III occurred as quotations obtained through pricing services were not
deemed representative of fair value as of the balance sheet date and such assets were internally valued. As quotations obtained through pricing services were substantiated through additional market sources, investments were transferred out of
Level III. The Operating Company invests in revolving credit facilities. These investments are categorized as Level III investments as these assets are not actively traded and their fair values are often implied by the term loans of the
respective portfolio companies.
NMF Holdings generally uses the following framework when determining the fair value of investments
where there are little, if any, market activity or observable pricing inputs.
Company Performance, Financial Review, and
Analysis: Prior to investment, as part of its due diligence process, NMF Holdings evaluates the overall performance and financial stability of the
F-45
Combined Notes to the Consolidated Financial Statements of
New Mountain Finance Holdings, L.L.C.,
the Financial Statements of New Mountain Finance Corporation and the Financial Statements
of
New Mountain Finance AIV Holdings Corporation (continued)
portfolio company. Post investment, NMF Holdings analyzes each portfolio company’s current operating performance and relevant financial trends versus prior year and budgeted results,
including, but not limited to, factors affecting its revenue and earnings before interest, taxes, depreciation, and amortization (“EBITDA”) growth, margin trends, liquidity position, covenant compliance and changes to its capital
structure. NMF Holdings also attempts to identify and subsequently track any developments at the portfolio company, within its customer or vendor base or within the industry or the macroeconomic environment, generally, that may alter any material
element of its original investment thesis. This analysis is specific to each portfolio company. NMF Holdings leverages the knowledge gained from its original due diligence process, augmented by this subsequent monitoring, to continually refine its
outlook for each of its portfolio companies and ultimately form the valuation of its investment in each portfolio company.
Market
Based Approach: NMF Holdings typically estimates the total enterprise value of each portfolio company by utilizing market value cash flow (EBITDA) multiples of publicly traded comparable companies. NMF Holdings carefully considers numerous
factors when selecting the appropriate companies whose trading multiples are used to value its portfolio companies. These factors include, but are not limited to, the type of organization, similarity to the business being valued, relevant risk
factors, as well as size, profitability and growth expectations. NMF Holdings generally applies an average of various relevant comparable company EBITDA multiples to the portfolio company’s latest twelve month (“LTM”) EBITDA or
projected EBITDA to calculate portfolio company enterprise value. This is done in order to ensure that there is an appropriate level of value coverage for each investment. In applying the market based approach as of September 30, 2012, NMF
Holdings used a relevant EBITDA range of 3.50x to 11.60x for first lien debt investments and 5.50x to 8.00x for second lien and subordinated debt investments to determine the enterprise value of seven of its portfolio companies. NMF Holdings
believes this was a reasonable range in light of current comparable company trading levels and the specific companies involved.
Income Based Approach: NMF Holdings also typically uses a discounted cash flow analysis to estimate the fair value of the investment.
Projected cash flows represent the relevant security’s contractual interest, fee and principal payments plus the assumption of full principal recovery at the investment’s expected maturity date. These cash flows are discounted at a rate
established utilizing a yield calibration approach, which incorporates changes in the credit quality (as measured by relevant statistics) of the portfolio company, as compared to changes in the yield associated with comparable credit quality market
indices, between the date of origination and the valuation date. In applying the income based approach as of September 30, 2012, NMF Holdings used a discount range of 6.5% to 14.5% for first lien debt investments, 11.5% to 13.1% for second lien
debt investments and 17.0% to 22.1% for subordinated debt investments to value six of its portfolio companies.
Based on a comparison to
similar BDC credit facilities, the terms and conditions of the Holdings Credit Facility and the SLF Credit Facility are representative of market. Both facilities were amended and restated on May 8, 2012 to lower the applicable interest rate
spread by 0.25%. The carrying values of the Holdings Credit Facility and SLF Credit Facility approximate fair value as of September 30, 2012, as both facilities are continually monitored and examined by both the borrower and the lender. The
fair value of other financial assets and liabilities approximates their carrying value based on the short term nature of these items. The fair value disclosures discussed in this paragraph are considered Level III.
F-46
Combined Notes to the Consolidated Financial Statements of
New Mountain Finance Holdings, L.L.C.,
the Financial Statements of New Mountain Finance Corporation and the Financial Statements
of
New Mountain Finance AIV Holdings Corporation (continued)
Fair value risk factors—The Operating Company seeks investment opportunities that offer the possibility of attaining substantial capital appreciation. Certain events particular to each industry
in which the Operating Company’s portfolio companies conduct their operations, as well as general economic and political conditions, may have a significant negative impact on the operations and profitability of the Operating Company’s
investments and/or on the fair value of the Operating Company’s investments. The Operating Company’s investments are subject to the risk of non-payment of scheduled interest or principal, resulting in a reduction in income to the Operating
Company and thus the income of NMFC and AIV Holdings, and their corresponding fair valuations. Also, there may be risk associated with the concentration of investments in one geographic region or in certain industries. These events are beyond the
control of the Operating Company and cannot be predicted. Furthermore, the ability to liquidate investments and realize value is subject to uncertainties.
Note 5. Agreements
On May 19, 2011, NMFC entered into a
joinder agreement with respect to the Limited Liability Company Agreement, as amended and restated, of the Operating Company pursuant to which NMFC was admitted as a member of the Operating Company and agreed to acquire from the Operating Company a
number of units of the Operating Company equal to the number of shares of common stock outstanding of NMFC. Additionally on May 19, 2011, in connection with the contribution by Guardian AIV of its units to AIV Holdings, AIV Holdings entered
into a joinder agreement with respect to the Limited Liability Company Agreement, as amended and restated, of the Operating Company pursuant to which AIV Holdings was also admitted as a member of the Operating Company.
The Operating Company entered into an investment advisory and management agreement, as amended and restated (the “Investment Management
Agreement”) with the Investment Adviser. Under the Investment Management Agreement, the Investment Adviser manages the day-to-day operations of, and provides investment advisory services to, the Operating Company. For providing these services,
the Investment Adviser receives a fee from the Operating Company, consisting of two components—a base management fee and an incentive fee.
The base management fee is calculated at an annual rate of 1.75% of the Operating Company’s gross assets less (i) the borrowings under the SLF Credit Facility (as defined in Note 7, Borrowing
Facilities) and (ii) cash and cash equivalents. The base management fee is payable quarterly in arrears, and is calculated based on the average value of the Operating Company’s gross assets, borrowings under the SLF Credit Facility,
and cash and cash equivalents at the end of each of the two most recently completed calendar quarters, and appropriately adjusted on a pro rata basis for any equity capital raises or repurchases during the current calendar quarter.
The incentive fee consists of two parts. The first part is calculated and payable quarterly in arrears and equals 20.0% of the Operating
Company’s “Pre-Incentive Fee Adjusted Net Investment Income” for the immediately preceding quarter, subject to a “preferred return”, or “hurdle”, and a “catch-up” feature. “Pre-Incentive Fee Net
Investment Income” means interest income, dividend income and any other income (including any other fees (other than fees for providing managerial assistance), such as commitment, origination, structuring, diligence and consulting fees or other
fees that the Operating Company receives from portfolio companies) accrued during the calendar quarter, minus the Operating Company’s operating expenses for the quarter (including the base management fee, expenses payable under the
Administration Agreement, as amended and restated, with the
F-47
Combined Notes to the Consolidated Financial Statements of
New Mountain Finance Holdings, L.L.C.,
the Financial Statements of New Mountain Finance Corporation and the Financial Statements
of
New Mountain Finance AIV Holdings Corporation (continued)
Administrator, and any interest expense and distributions paid on any issued and outstanding preferred membership units (of which there are none as of September 30, 2012), but excluding the
incentive fee). Pre-Incentive Fee Net Investment Income includes, in the case of investments with a deferred interest feature (such as original issue discount, debt instruments with PIK interest and zero coupon securities), accrued income that the
Operating Company has not yet received in cash. Pre-Incentive Fee Net Investment Income does not include any realized capital gains, realized capital losses or unrealized capital appreciation or depreciation.
Under GAAP, NMFC’s IPO did not step-up the cost basis of the Operating Company’s existing investments to fair market value at the IPO
date. Since the total value of the Operating Company’s investments at the time of the IPO was greater than the investments’ cost basis, a larger amount of amortization of purchase or original issue discount, as well as different amounts in
realized gain and unrealized appreciation, may be recognized under GAAP in each period than if the step-up had occurred. This will remain until such predecessor investments are sold or mature in the future. The Operating Company tracks the
transferred (or fair market) value of each of its investments as of the time of the IPO and, for purposes of the incentive fee calculation, adjusts Pre-Incentive Fee Net Investment Income to reflect the amortization of purchase or original issue
discount on the Operating Company’s investments as if each investment was purchased at the date of the IPO, or stepped up to fair market value. This is defined as “Pre-Incentive Fee Adjusted Net Investment Income”. The Operating
Company also uses the transferred (or fair market) value of each of its investments as of the time of the IPO to adjust capital gains (“Adjusted Realized Capital Gains”) or losses (“Adjusted Realized Capital Losses”) and
unrealized capital appreciation (“Adjusted Unrealized Capital Appreciation”) and unrealized capital depreciation (“Adjusted Unrealized Capital Depreciation”).
Pre-Incentive Fee Adjusted Net Investment Income, expressed as a rate of return on the value of the Operating Company’s net assets at the end
of the immediately preceding calendar quarter, will be compared to a “hurdle rate” of 2.0% per quarter (8.0% annualized), subject to a “catch-up” provision measured as of the end of each calendar quarter. The hurdle rate is
appropriately pro-rated for any partial periods. The calculation of the Operating Company’s incentive fee with respect to the Pre-Incentive Fee Adjusted Net Investment Income for each quarter is as follows:
| |
Ÿ |
|
No incentive fee is payable to the Investment Adviser in any calendar quarter in which the Operating Company’s Pre-Incentive Fee Adjusted Net Investment
Income does not exceed the hurdle rate of 2.0% (the “preferred return” or “hurdle”). |
| |
Ÿ |
|
100.0% of the Operating Company’s Pre-Incentive Fee Adjusted Net Investment Income with respect to that portion of such Pre-Incentive Fee Adjusted Net
Investment Income, if any, that exceeds the hurdle rate but is less than or equal to 2.5% in any calendar quarter (10.0% annualized) is payable to the Investment Adviser. This portion of the Operating Company’s Pre-Incentive Fee Adjusted Net
Investment Income (which exceeds the hurdle rate but is less than or equal to 2.5%) is referred to as the “catch-up”. The catch-up provision is intended to provide the Investment Adviser with an incentive fee of 20.0% on all of the
Operating Company’s Pre-Incentive Fee Adjusted Net Investment Income as if a hurdle rate did not apply when the Operating Company’s Pre-Incentive Fee Adjusted Net Investment Income exceeds 2.5% in any calendar quarter.
|
| |
Ÿ |
|
20.0% of the amount of the Operating Company’s Pre-Incentive Fee Adjusted Net Investment Income, if any, that exceeds 2.5% in any calendar quarter (10.0%
annualized) is payable to the Investment Adviser once the hurdle is reached and the catch-up is achieved. |
F-48
Combined Notes to the Consolidated Financial Statements of
New Mountain Finance Holdings, L.L.C.,
the Financial Statements of New Mountain Finance Corporation and the Financial Statements
of
New Mountain Finance AIV Holdings Corporation (continued)
The second part will be determined and payable in arrears as of the end of each calendar year (or upon termination of the Investment Management Agreement) and will equal 20.0% of the Operating Company’s
Adjusted Realized Capital Gains, if any, on a cumulative basis from inception through the end of each calendar year, computed net of all Adjusted Realized Capital Losses and Adjusted Unrealized Capital Depreciation on a cumulative basis, less the
aggregate amount of any previously paid capital gain incentive fee.
In accordance with GAAP, NMF Holdings accrues a hypothetical
capital gains incentive fee based upon the cumulative net Adjusted Realized Capital Gains and Adjusted Realized Capital Losses and the cumulative net Adjusted Unrealized Capital Appreciation and Adjusted Unrealized Capital Depreciation on
investments held at the end of each period. Actual amounts paid to the Investment Adviser are consistent with the Investment Management Agreement and are based only on actual Adjusted Realized Capital Gains computed net of all Adjusted Realized
Capital Losses and Adjusted Unrealized Capital Depreciation on a cumulative basis from inception through the end of each calendar year as if the entire portfolio was sold at fair value.
The management fee and incentive fee incurred by the Operating Company were $2,767,649 and $5,561,173 for the three months ended September 30,
2012, which includes an accrual of $2,582,953 of capital gains incentive fees for the quarter then ended. The management fee and incentive fee incurred by the Operating Company were $7,887,506 and $11,693,825 for the nine months ended
September 30, 2012, which includes an accrual of $3,546,843 of capital gains incentive fees for the nine months then ended. These accrued capital gains incentive fees would be paid by the Operating Company if the Operating Company ceased
operations on September 30, 2012 and liquidated its investments at the current valuation. No accrual was required for the nine months ended September 30, 2011. The management fee and incentive fees incurred by the Operating Company were
$1,930,140 and $700,610 for the three months ended September 30, 2011 and $2,737,649 and $1,205,003 for the period from May 19, 2011 (effective date of the Investment Management Agreement) to September 30, 2011. For the three and nine
months ended September 30, 2011, there were no capital gains incentive fees incurred by the Operating Company. The Operating Company’s Consolidated Statement of Operations below is adjusted as if step-up in cost basis to fair market value
had occurred at the IPO date, May 19, 2011.
F-49
Combined Notes to the Consolidated Financial Statements of
New Mountain Finance Holdings, L.L.C.,
the Financial Statements of New Mountain Finance Corporation and the Financial Statements
of
New Mountain Finance AIV Holdings Corporation (continued)
The following Statement of Operations for the three and nine months ended September 30, 2012 is adjusted to reflect this step-up to fair market value.
|
|
|
|
|
|
|
|
|
|
|
|
|
| |
|
Three months ended
September 30, 2012 |
|
|
Adjustments |
|
|
Adjusted
three months ended
September 30, 2012 |
|
| Investment income |
|
|
|
|
|
|
|
|
|
|
|
|
| Interest income |
|
$ |
21,362,055 |
|
|
$ |
(805,520 |
) |
|
$ |
20,556,535 |
|
| Dividend income |
|
|
215,160 |
|
|
|
— |
|
|
|
215,160 |
|
| Other income |
|
|
174,515 |
|
|
|
— |
|
|
|
174,515 |
|
|
|
|
|
|
|
|
|
|
|
|
|
|
| Total investment income |
|
|
21,751,730 |
|
|
|
(805,520 |
) |
|
|
20,946,210 |
|
|
|
|
|
|
|
|
|
|
|
|
|
|
| Total expenses pre-incentive fee |
|
|
6,055,111 |
|
|
|
— |
|
|
|
6,055,111 |
|
|
|
|
|
|
|
|
|
|
|
|
|
|
| Pre-Incentive Fee Net Investment Income |
|
|
15,696,619 |
|
|
|
(805,520 |
) |
|
|
14,891,099 |
|
|
|
|
|
|
|
|
|
|
|
|
|
|
| Incentive fee(1) |
|
|
5,561,173 |
|
|
|
— |
|
|
|
5,561,173 |
|
|
|
|
|
|
|
|
|
|
|
|
|
|
| Post-Incentive Fee Net Investment Income |
|
|
10,135,446 |
|
|
|
(805,520 |
) |
|
|
9,329,926 |
|
|
|
|
|
|
|
|
|
|
|
|
|
|
| Net realized gains on investments |
|
|
1,615,032 |
|
|
|
(168,786 |
) |
|
|
1,446,246 |
|
| Net change in unrealized appreciation of investments |
|
|
10,494,213 |
|
|
|
974,306 |
|
|
|
11,468,519 |
|
|
|
|
|
|
|
|
|
|
|
|
|
|
| Net increase in capital resulting from operations |
|
$ |
22,244,691 |
|
|
|
|
|
|
$ |
22,244,691 |
|
|
|
|
|
|
|
|
|
|
|
|
|
|
| (1) |
For the three months ended September 30, 2012, the Operating Company incurred total incentive fees of $5,561,173, of which $2,582,953 related to capital gains incentive fees
on a hypothetical liquidation basis. |
|
|
|
|
|
|
|
|
|
|
|
|
|
| |
|
Nine months ended
September 30, 2012 |
|
|
Adjustments |
|
|
Adjusted
nine months ended
September 30, 2012 |
|
| Investment income |
|
|
|
|
|
|
|
|
|
|
|
|
| Interest income |
|
$ |
60,087,281 |
|
|
$ |
(2,653,558 |
) |
|
$ |
57,433,723 |
|
| Other income |
|
|
770,313 |
|
|
|
— |
|
|
|
770,313 |
|
| Dividend income |
|
|
215,160 |
|
|
|
— |
|
|
|
215,160 |
|
|
|
|
|
|
|
|
|
|
|
|
|
|
| Total investment income |
|
|
61,072,754 |
|
|
|
(2,653,558 |
) |
|
|
58,419,196 |
|
|
|
|
|
|
|
|
|
|
|
|
|
|
| Total expenses pre-incentive fee |
|
|
17,684,285 |
|
|
|
— |
|
|
|
17,684,285 |
|
|
|
|
|
|
|
|
|
|
|
|
|
|
| Pre-Incentive Fee Net Investment Income |
|
|
43,388,469 |
|
|
|
(2,653,558 |
) |
|
|
40,734,911 |
|
|
|
|
|
|
|
|
|
|
|
|
|
|
| Incentive fee(1) |
|
|
11,693,825 |
|
|
|
— |
|
|
|
11,693,825 |
|
|
|
|
|
|
|
|
|
|
|
|
|
|
| Post-Incentive Fee Net Investment Income |
|
|
31,694,644 |
|
|
|
(2,653,558 |
) |
|
|
29,041,086 |
|
|
|
|
|
|
|
|
|
|
|
|
|
|
| Net realized gains on investments |
|
|
14,590,819 |
|
|
|
(5,386,336 |
) |
|
|
9,204,483 |
|
| Net change in unrealized appreciation of investments |
|
|
10,710,689 |
|
|
|
8,039,894 |
|
|
|
18,750,583 |
|
|
|
|
|
|
|
|
|
|
|
|
|
|
| Net increase in capital resulting from operations |
|
$ |
56,996,152 |
|
|
|
|
|
|
$ |
56,996,152 |
|
|
|
|
|
|
|
|
|
|
|
|
|
|
| (1) |
For the nine months ended September 30, 2012, the Operating Company incurred total incentive fees of $11,693,825, of which $3,546,843 related to capital gains incentive fees
on a hypothetical liquidation basis. |
F-50
Combined Notes to the Consolidated Financial Statements of
New Mountain Finance Holdings, L.L.C.,
the Financial Statements of New Mountain Finance Corporation and the Financial Statements
of
New Mountain Finance AIV Holdings Corporation (continued)
The following Statement of Operations for the three months ended September 30, 2011 and the period May 19, 2011 (effective date of the Investment Management Agreement) to September 30, 2011 is
adjusted to reflect the step-up to fair market value.
|
|
|
|
|
|
|
|
|
|
|
|
|
| |
|
Three months ended
September 30, 2011 |
|
|
Adjustments |
|
|
Adjusted
three months ended
September 30, 2011 |
|
| Investment income |
|
|
|
|
|
|
|
|
|
|
|
|
| Interest income |
|
$ |
14,860,750 |
|
|
$ |
(1,189,611 |
) |
|
$ |
13,671,139 |
|
| Other income |
|
|
207,831 |
|
|
|
— |
|
|
|
207,831 |
|
|
|
|
|
|
|
|
|
|
|
|
|
|
| Total investment income |
|
|
15,068,581 |
|
|
|
(1,189,611 |
) |
|
|
13,878,970 |
|
|
|
|
|
|
|
|
|
|
|
|
|
|
| Total expenses pre-incentive fee |
|
|
4,366,253 |
|
|
|
— |
|
|
|
4,366,253 |
|
|
|
|
|
|
|
|
|
|
|
|
|
|
| Pre-Incentive Fee Net Investment Income |
|
|
10,702,328 |
|
|
|
(1,189,611 |
) |
|
|
9,512,717 |
|
|
|
|
|
|
|
|
|
|
|
|
|
|
| Incentive fee(1) |
|
|
700,610 |
|
|
|
— |
|
|
|
700,610 |
|
|
|
|
|
|
|
|
|
|
|
|
|
|
| Post-Incentive Fee Net Investment Income |
|
|
10,001,718 |
|
|
|
(1,189,611 |
) |
|
|
8,812,107 |
|
|
|
|
|
|
|
|
|
|
|
|
|
|
| Net realized gains on investments |
|
|
1,402,671 |
|
|
|
(1,396,525 |
) |
|
|
6,146 |
|
| Net change in unrealized (depreciation) appreciation of investments |
|
|
(22,657,239 |
) |
|
|
2,586,136 |
|
|
|
(20,071,103 |
) |
|
|
|
|
|
|
|
|
|
|
|
|
|
| Net decrease in capital resulting from operations |
|
$ |
(11,252,850 |
) |
|
|
|
|
|
$ |
(11,252,850 |
) |
|
|
|
|
|
|
|
|
|
|
|
|
|
| (1) |
For the three months ended September 30, 2011, the Operating Company had no incentive fees related to capital gains. |
|
|
|
|
|
|
|
|
|
|
|
|
|
| |
|
Period from May 19, 2011
to September 30, 2011 |
|
|
Adjustments |
|
|
Adjusted
period from May 19, 2011
to September 30, 2011 |
|
| Investment income |
|
|
|
|
|
|
|
|
|
|
|
|
| Interest income |
|
$ |
21,865,682 |
|
|
$ |
(1,748,300 |
) |
|
$ |
20,117,382 |
|
| Other income |
|
|
513,975 |
|
|
|
— |
|
|
|
513,975 |
|
|
|
|
|
|
|
|
|
|
|
|
|
|
| Total investment income |
|
|
22,379,657 |
|
|
|
(1,748,300 |
) |
|
|
20,631,357 |
|
|
|
|
|
|
|
|
|
|
|
|
|
|
| Total expenses pre-incentive fee |
|
|
6,594,310 |
|
|
|
— |
|
|
|
6,594,310 |
|
|
|
|
|
|
|
|
|
|
|
|
|
|
| Pre-Incentive Fee Net Investment Income |
|
|
15,785,347 |
|
|
|
(1,748,300 |
) |
|
|
14,037,047 |
|
|
|
|
|
|
|
|
|
|
|
|
|
|
| Incentive fee(1) |
|
|
1,205,003 |
|
|
|
— |
|
|
|
1,205,003 |
|
|
|
|
|
|
|
|
|
|
|
|
|
|
| Post-Incentive Fee Net Investment Income |
|
|
14,580,344 |
|
|
|
(1,748,300 |
) |
|
|
12,832,044 |
|
|
|
|
|
|
|
|
|
|
|
|
|
|
| Net realized gains (losses) on investments |
|
|
1,000,668 |
|
|
|
(1,181,204 |
) |
|
|
(180,536 |
) |
| Net change in unrealized (depreciation) appreciation of investments |
|
|
(21,557,011 |
) |
|
|
2,929,504 |
|
|
|
(18,627,507 |
) |
|
|
|
|
|
|
|
|
|
|
|
|
|
| Net decrease in capital resulting from operations |
|
$ |
(5,975,999 |
) |
|
|
|
|
|
$ |
(5,975,999 |
) |
|
|
|
|
|
|
|
|
|
|
|
|
|
| (1) |
For the period from May 19, 2011 to September 30, 2011, the Operating Company had no incentive fees related to capital gains. |
F-51
Combined Notes to the Consolidated Financial Statements of
New Mountain Finance Holdings, L.L.C.,
the Financial Statements of New Mountain Finance Corporation and the Financial Statements
of
New Mountain Finance AIV Holdings Corporation (continued)
The Companies have entered into an Administration Agreement, as amended and restated, with the Administrator under which the Administrator provides administrative services. The Administrator performs, or oversees
the performance of, the Companies’ financial records, prepares reports filed with the Securities and Exchange Commission, generally monitors the payment of the Companies’ expenses, and watches the performance of administrative and
professional services rendered by others. NMF Holdings will reimburse the Administrator for the Companies’ allocable portion of overhead and other expenses incurred by the Administrator in performing its obligations to the Companies under the
Administration Agreement, as amended and restated. Pursuant to the Administration Agreement, as amended and restated, and further restricted by the Operating Company, expenses payable to the Administrator by the Operating Company as well as other
direct and indirect expenses (excluding interest, other credit facility expenses, trading expenses and management and incentive fees) have been capped at $3,500,000 for the time period from April 1, 2012 to March 31, 2013.
The Operating Company incurred $438,882 and $1,386,587 in expenses in excess of the expense cap for the three months and nine months ended
September 30, 2012, of which $170,909 was receivable from an affiliate as of September 30, 2012. The Operating Company incurred $1,034,926 and $1,345,367 in expenses in excess of the expense cap for the three months and nine months ended
September 30, 2011, of which $816,530 was receivable from an affiliate as of September 30, 2011.
The Companies, the
Investment Adviser and the Administrator have also entered into a Trademark License Agreement, as amended, with New Mountain Capital, L.L.C., pursuant to which New Mountain Capital, L.L.C. has agreed to grant the Companies, the Investment Adviser
and the Administrator, a non-exclusive, royalty-free license to use the “New Mountain” and the “New Mountain Finance” names. Under the Trademark License Agreement, as amended, subject to certain conditions, the Companies, the
Investment Adviser and the Administrator will have a right to use the “New Mountain” and “New Mountain Finance” names, for so long as the Investment Adviser or one of its affiliates remains the investment adviser of the Operating
Company. Other than with respect to this limited license, the Companies, the Investment Adviser and the Administrator will have no legal right to the “New Mountain” or the “New Mountain Finance” names.
AIV Holdings entered into a Registration Rights Agreement with NMFC, Steven B. Klinsky (the Chairman of our board of directors), an entity related
to Steven B. Klinsky and the Investment Adviser. Subject to several exceptions, AIV Holdings and the Investment Adviser have the right to require NMFC to register for public resale under the Securities Act of 1933, as amended (the “Securities
Act of 1933”), all registerable securities that are held by any of them and that they request to be registered. Registerable securities subject to the Registration Rights Agreement are shares of NMFC’s common stock issued or issuable in
exchange for units and any other shares of NMFC’s common stock held by AIV Holdings, the Investment Adviser and any of their transferees. The rights under the Registration Rights Agreement can be conditionally exercised by AIV Holdings or the
Investment Adviser, meaning that prior to the effectiveness of the registration statement related to the shares, AIV Holdings or the Investment Adviser can withdraw their request to have the shares registered. AIV Holdings and the Investment Adviser
may each assign their rights to any person that acquires registerable securities subject to the Registration Rights Agreement and who agrees to be bound by the terms of the Registration Rights Agreement. Steven B. Klinsky and a related entity will
have the right to “piggyback”,
F-52
Combined Notes to the Consolidated Financial Statements of
New Mountain Finance Holdings, L.L.C.,
the Financial Statements of New Mountain Finance Corporation and the Financial Statements
of
New Mountain Finance AIV Holdings Corporation (continued)
or include their own registerable securities in such a registration. During the three months ended September 30, 2012, shares held by AIV Holdings and Steven B. Klinsky were registered on
the shelf registration statement on Form N-2.
AIV Holdings and the Investment Adviser may require NMFC to use its reasonable best
efforts to register under the Securities Act of 1933 all or any portion of these registerable securities upon a “demand request”. The demand registration rights are subject to certain limitations.
The Registration Rights Agreement includes limited blackout and suspension periods. In addition, AIV Holdings and the Investment Adviser may also
require NMFC to file a shelf registration statement on Form N-2 for the resale of their registerable securities if NMFC is eligible to use Form N-2 at that time.
Holders of registerable securities have “piggyback” registration rights, including AIV Holdings, which means that these holders may include their respective shares in any future registrations of
NMFC’s equity securities, whether or not that registration relates to a primary offering by NMFC or a secondary offering by or on behalf of any of NMFC’s stockholders. AIV Holdings, the Investment Adviser and Steven B. Klinsky (and a
related entity) have priority over NMFC in any registration that is an underwritten offering.
AIV Holdings, the Investment Adviser and
Steven B. Klinsky (and a related entity) will be responsible for the expenses of any demand registration (including underwriters’ discounts or commissions) and their pro-rata share of any “piggyback” registration. NMFC has agreed to
indemnify AIV Holdings, the Investment Adviser and Steven B. Klinsky (and a related entity) with respect to liabilities resulting from untrue statements or omissions in any registration statement filed pursuant to the Registration Rights Agreement,
other than untrue statements or omissions resulting from information furnished to NMFC by such parties. AIV Holdings, the Investment Adviser and Steven B. Klinsky (and a related entity) have also agreed to indemnify NMFC with respect to
liabilities resulting from untrue statements or omissions furnished by them to NMFC relating to them in any registration statement.
Note 6. Related
Parties
The Companies have entered into a number of business relationships with affiliated or related parties. NMFC and AIV Holdings
own all the outstanding units of the Operating Company. As of September 30, 2012, NMFC and AIV Holdings own approximately 56.1% and 43.9%, respectively, of the units of NMF Holdings.
NMF Holdings has entered into the Investment Management Agreement with the Investment Adviser, a wholly-owned subsidiary of New Mountain Capital.
Therefore, New Mountain Capital is entitled to any profits earned by the Investment Adviser, which includes any fees payable to the Investment Adviser under the terms of the Investment Management Agreement, less expenses incurred by the Investment
Adviser in performing its services under the Investment Management Agreement.
The Companies have entered into an Administration
Agreement, as amended and restated, with the Administrator, a wholly-owned subsidiary of New Mountain Capital. The Administrator arranges office space for the Companies and provides office equipment and administrative services necessary
F-53
Combined Notes to the Consolidated Financial Statements of
New Mountain Finance Holdings, L.L.C.,
the Financial Statements of New Mountain Finance Corporation and the Financial Statements
of
New Mountain Finance AIV Holdings Corporation (continued)
to conduct their respective day-to-day operations pursuant to the Administration Agreement, as amended and restated. NMF Holdings reimburses the Administrator for the allocable portion of
overhead and other expenses incurred by it in performing its obligations to the Companies under the Administration Agreement, as amended and restated, including rent, the fees and expenses associated with performing administrative, finance and
compliance functions, and the compensation of the Companies’ chief financial officer and chief compliance officer and their respective staffs. Pursuant to the Administration Agreement, as amended and restated, and further restricted by the
Operating Company, expenses payable to the Administrator by the Operating Company as well as other direct and indirect expenses (excluding interest, other credit facility expenses, trading expenses and management and incentive fees) have been capped
at $3,500,000 for the time period from April 1, 2012 to March 31, 2013.
The Companies, the Investment Adviser and the
Administrator have entered into a royalty-free Trademark License Agreement, as amended, with New Mountain Capital, L.L.C., pursuant to which New Mountain Capital, L.L.C. has agreed to grant the Companies, the Investment Adviser and the
Administrator, a non-exclusive, royalty-free license to use the name “New Mountain” and “New Mountain Finance”.
The
Companies have adopted a formal code of ethics that governs the conduct of their respective officers and directors. These officers and directors also remain subject to the duties imposed by the 1940 Act, the Delaware General Corporation Law and the
Delaware Limited Liability Company Act.
The Investment Adviser and its affiliates may also manage other funds in the future that may
have investment mandates that are similar, in whole and in part, with NMF Holdings’ investment mandates. The Investment Adviser and its affiliates may determine that an investment is appropriate for NMF Holdings and for one or more of those
other funds. In such event, depending on the availability of such investment and other appropriate factors, the Investment Adviser or its affiliates may determine that the Operating Company should invest side-by-side with one or more other funds.
Any such investments will be made only to the extent permitted by applicable law and interpretive positions of the Securities and Exchange Commission and its staff, and consistent with the Investment Adviser’s allocation procedures.
Concurrently with the IPO, NMFC sold an additional 2,172,000 shares of its common stock to certain executives and employees of, and other
individuals affiliated with, New Mountain Capital in the Concurrent Private Placement.
Note 7. Borrowing Facilities
Holdings Credit Facility—The Loan and Security Agreement, as amended and restated, dated May 19, 2011 (the “Holdings Credit
Facility”) among NMF Holdings as the Borrower and Collateral Administrator, Wells Fargo Securities, L.L.C. as the Administrative Agent, and Wells Fargo Bank, National Association, as the Collateral Custodian, is structured as a revolving credit
facility and matures on October 27, 2016, as amended on May 8, 2012. The maximum amount of revolving borrowings available under the Holdings Credit Facility is $185,000,000, as amended on August 7, 2012. The Operating Company is
permitted to borrow up to 45.0% or 25.0% of the purchase price of pledged first lien or non-first lien debt securities, and up to 67.0% and 45.0% of the purchase price of specified first lien debt securities and specified non-first lien debt
securities, respectively, subject to
F-54
Combined Notes to the Consolidated Financial Statements of
New Mountain Finance Holdings, L.L.C.,
the Financial Statements of New Mountain Finance Corporation and the Financial Statements
of
New Mountain Finance AIV Holdings Corporation (continued)
approval by Wells Fargo Bank, National Association. The credit facility is collateralized by all of the investments of the Operating Company on an investment by investment basis. All fees
associated with the origination or upsizing of the Holdings Credit Facility are capitalized on the Operating Company’s Consolidated Statement of Assets, Liabilities, and Members’ Capital and charged against income as other credit facility
expenses over the life of the Holdings Credit Facility. The Holdings Credit Facility contains certain customary affirmative and negative covenants and events of default, including the occurrence of a change in control. In addition, the Holdings
Credit Facility requires the Operating Company to maintain a minimum asset coverage ratio. However, the covenants are generally not tied to mark to market fluctuations in the prices of the Operating Company’s investments, but rather to the
performance of the underlying portfolio companies.
The Operating Company became a party to the Holdings Credit Facility upon the IPO of
NMFC. The Holdings Credit Facility amends and restates the credit facility of the Predecessor Entities (the “Predecessor Credit Facility”). The Predecessor Credit Facility consisted of two separate facilities. First, the Loan and Security
Agreement dated October 21, 2009 among New Mountain Guardian (Leveraged), L.L.C. as the Collateral Manager, New Mountain Guardian Debt Funding, L.L.C. as the Borrower, Wells Fargo Securities, L.L.C. as the Administrative Agent, and Wells Fargo
Bank, National Association, as the Collateral Custodian, was structured as a revolving credit facility that matured on October 21, 2014. The maximum amount of revolving borrowings available under this credit facility was $112,500,000. Second,
the Loan and Security Agreement dated November 19, 2009 among New Mountain Guardian Partners (Leveraged), L.L.C as the Collateral Manager, New Mountain Guardian Partners Debt Funding, L.L.C. as the Borrower, Wells Fargo Securities, L.L.C. as
the Administrative Agent, and Wells Fargo Bank, National Association, as the Collateral Custodian, is structured as a revolving credit facility that matures on October 21, 2014. The maximum amount of revolving borrowings available under this
credit facility was $7,500,000.
The Holdings Credit Facility (as well as the Predecessor Credit Facility) bears interest at a rate of
the London Interbank Offered Rate (“LIBOR”) plus 2.75% per annum, as amended on May 8, 2012, and charges a non-usage fee, based on the unused facility amount multiplied by the Non-Usage Fee Rate (as defined in the credit
agreement). Interest expense and non-usage fees were $807,007 and $178,602, respectively, for the three months ended September 30, 2012. Interest expense and non-usage fees were $2,919,801 and $251,460, respectively, for the nine months ended
September 30, 2012. Interest expense and non-usage fees were $268,851 and $163,564, respectively, for the three months ended September 30, 2011. Interest expense and non-usage fees were $1,162,756 and $538,464, respectively, for the nine
months ended September 30, 2011. The weighted average interest rate for the nine months ended September 30, 2012 and September 30, 2011 was 3.1% and 3.2%, respectively. The average debt outstanding for the nine months ended
September 30, 2012 and September 30, 2011 was $122,887,369 and $46,718,994, respectively. The outstanding balance as of September 30, 2012 and December 31, 2011 was $135,664,913 and $129,037,813, respectively. As of
September 30, 2012 and December 31, 2011, the Operating Company was in compliance with all financial and operational covenants required by the credit facilities existing on such dates.
SLF Credit Facility—The Operating Company’s senior loan fund’s Loan and Security Agreement, as amended and restated, dated
October 27, 2010 (the “SLF Credit Facility”) among NMF SLF as the Borrower, NMF Holdings as the Collateral Administrator, Wells Fargo Securities, L.L.C. as the Administrative Agent, and Wells Fargo Bank, National Association, as the
Collateral Custodian, is
F-55
Combined Notes to the Consolidated Financial Statements of
New Mountain Finance Holdings, L.L.C.,
the Financial Statements of New Mountain Finance Corporation and the Financial Statements
of
New Mountain Finance AIV Holdings Corporation (continued)
structured as a revolving credit facility and matures on October 27, 2016, as amended on May 8, 2012. The maximum amount of revolving borrowings available under the SLF Credit Facility
is $200,000,000, as amended on August 7, 2012. The SLF Credit Facility is non-recourse to NMF Holdings and is secured by all assets owned by NMF SLF on an investment by investment basis. All fees associated with the origination or upsizing of
the SLF Credit Facility are capitalized on the Consolidated Statement of Assets, Liabilities, and Members’ Capital and charged against income as other credit facility expenses over the life of the SLF Credit Facility. The SLF Credit Facility
contains certain customary affirmative and negative covenants and events of default, including the occurrence of a change in control. The covenants are generally not tied to mark to market fluctuations in the prices of our investments, but rather to
the performance of the underlying portfolio companies.
The SLF Credit Facility permits borrowings of up to 67.0% of the purchase price
of pledged debt securities subject to approval by Wells Fargo Bank, National Association. Due to a fifth amendment to the SLF Credit Facility on October 27, 2011, NMF SLF is no longer restricted from the purchase or sale of loans with an
affiliate. Therefore, specified first lien loans can be moved as collateral between the Holdings Credit Facility and the SLF Credit Facility.
The SLF Credit Facility bears interest at a rate of LIBOR plus 2.00% per annum, as amended on May 8, 2012. A non-usage fee is paid, based on the unused facility amount multiplied by the Non-Usage Fee Rate
(as defined in the credit agreement). Interest expense and non-usage fees were $1,051,466 and $7,458, respectively, for the three months ended September 30, 2012. Interest expense and non-usage fees were $3,138,462 and $19,828, respectively,
for the nine months ended September 30, 2012. Interest expense and non-usage fees were $955,702 and $24,574, respectively, for the three months ended September 30, 2011. Interest expense and non-usage fees were $2,305,096 and $82,742,
respectively, for the nine months ended September 30, 2011. The weighted average interest rate for the nine months ended September 30, 2012 and September 30, 2011 for the facility was 2.4% and 2.5%, respectively. The average debt
outstanding for the nine months ended September 30, 2012 and September 30, 2011 was $174,808,061 and $123,049,814, respectively. The outstanding balance as of September 30, 2012 and December 31, 2011 was $200,000,000 and
$165,928,000, respectively. As of September 30, 2012 and December 31, 2011, NMF SLF was in compliance with all financial and operational covenants required by the SLF Credit Facility.
Leverage risk factors—The Operating Company utilizes and may utilize leverage to the maximum extent permitted by the law for
investment and other general business purposes. The Operating Company’s lenders will have fixed dollar claims on certain assets that are superior to the claims of the Operating Company’s unit holders, and therefore NMFC’s common
stockholders, and the Operating Company would expect such lenders to seek recovery against these assets in the event of a default. The use of leverage also magnifies the potential for gain or loss on amounts invested. Leverage may magnify interest
rate risk (particularly on the Operating Company’s fixed-rate investments), which is the risk that the prices of portfolio investments will fall or rise if market interest rates for those types of securities rise or fall. As a result, leverage
may cause greater changes in the Operating Company’s net asset value. Similarly, leverage may cause a sharper decline in the Operating Company’s income than if the Operating Company had not borrowed. Such a decline could negatively affect
the Operating Company’s ability to make dividend payments to its unit holders. Leverage is generally considered a speculative investment technique. The Operating Company’s ability to service any debt incurred will depend largely on
financial performance and will be subject to prevailing economic conditions and competitive pressures.
F-56
Combined Notes to the Consolidated Financial Statements of
New Mountain Finance Holdings, L.L.C.,
the Financial Statements of New Mountain Finance Corporation and the Financial Statements
of
New Mountain Finance AIV Holdings Corporation (continued)
Note 8.
Regulation
NMFC and AIV Holdings have elected to be treated, and intend to comply with the requirements to continue to qualify
annually, as RICs under Subchapter M of the Code. In order to continue to qualify as RICs, among other things, NMFC and AIV Holdings are required to timely distribute to their stockholders at least 90.0% of investment company taxable income, as
defined by the Code, for each year. NMFC and AIV Holdings, among other things, intend to make and continue to make the requisite distributions to their stockholders, which will generally relieve NMFC and AIV Holdings from U.S. federal, state, and
local income taxes (excluding excise taxes which may be imposed under the Code). However, under certain circumstances, the distributions that the Operating Company makes to its members may not be sufficient for AIV Holdings to satisfy the annual
distribution requirement necessary for AIV Holdings to continue to qualify as a RIC. In that case, it is expected that Guardian AIV would consent to be treated as if it received distributions from AIV Holdings sufficient to satisfy the annual
distribution requirement. Guardian AIV would be required to include the consent dividend in its taxable income as dividend from AIV Holdings, which would result in phantom (i.e., non-cash) taxable income to Guardian AIV.
Additionally as BDCs, the Companies must not acquire any assets other than “qualifying assets” specified in the 1940 Act unless, at the
time the acquisition is made, at least 70.0% of its total assets are qualifying assets (with certain limited exceptions).
Note 9. Commitments and
Contingencies
In the normal course of business, the Companies may enter into contracts that contain a variety of representations and
warranties and which provide general indemnifications. The Operating Company may also enter into future funding commitments such as revolving credit facilities, bridge financing commitments, or delayed draw commitments. As of September 30,
2012, NMF Holdings had unfunded commitments on revolving credit facilities of $13,858,500 and no outstanding bridge financing commitments or other future funding commitments, all of which are disclosed on NMF Holdings’ Consolidated Schedule of
Investments. As of December 31, 2011, NMF Holdings had unfunded commitments on revolving credit facilities of $22,698,500, outstanding bridge financing commitments of $35,000,000 and other future funding commitments of $4,250,632, all of which
are disclosed on NMF Holdings’ Consolidated Schedule of Investments.
The Operating Company also has revolving borrowings available
under the Holdings Credit Facility and the SLF Credit Facility as of September 30, 2012. See Note 7, Borrowing Facilities, for details.
The Operating Company may from time to time enter into financing commitment letters. As of September 30, 2012 and December 31, 2011, the Operating Company did not enter into any commitment letters to
purchase debt investments, which could require funding in the future.
F-57
Combined Notes to the Consolidated Financial Statements of
New Mountain Finance Holdings, L.L.C.,
the Financial Statements of New Mountain Finance Corporation and the Financial Statements
of
New Mountain Finance AIV Holdings Corporation (continued)
Note 10.
Stockholders’ Equity
The table below illustrates the effect of certain transactions on the capital accounts of NMFC:
|
|
|
|
|
|
|
|
|
|
|
|
|
|
|
|
|
|
|
|
|
|
|
|
|
|
|
|
|
| |
|
Common Stock |
|
|
Paid in
Capital
in
Excess
of Par |
|
|
Undistributed
Net
Investment
Income |
|
|
Accumulated
Undistributed
Net Realized
Gains |
|
|
Net
Unrealized
Appreciation
(Depreciation)
|
|
|
Total
Stockholders’
Equity |
|
| |
|
Shares |
|
|
Par Amount |
|
|
|
|
|
|
| Balance at December 31, 2011 |
|
|
10,697,691 |
|
|
$ |
106,977 |
|
|
$ |
144,248,879 |
|
|
$ |
— |
|
|
$ |
286,307 |
|
|
$ |
844,658 |
|
|
$ |
145,486,821 |
|
| Issuances of common stock |
|
|
9,992,944 |
|
|
|
99,929 |
|
|
|
139,494,210 |
|
|
|
— |
|
|
|
— |
|
|
|
— |
|
|
|
139,594,139 |
|
| Deferred offering costs allocated from New Mountain Finance Holdings, L.L.C. |
|
|
— |
|
|
|
— |
|
|
|
(211,073 |
) |
|
|
— |
|
|
|
— |
|
|
|
— |
|
|
|
(211,073 |
) |
| Dividends declared |
|
|
— |
|
|
|
— |
|
|
|
— |
|
|
|
(12,032,700 |
) |
|
|
(3,140,573 |
) |
|
|
— |
|
|
|
(15,173,273 |
) |
| Net increase in stockholders’ equity resulting from operations |
|
|
— |
|
|
|
— |
|
|
|
— |
|
|
|
12,032,700 |
|
|
|
5,188,948 |
|
|
|
4,756,722 |
|
|
|
21,978,370 |
|
|
|
|
|
|
|
|
|
|
|
|
|
|
|
|
|
|
|
|
|
|
|
|
|
|
|
|
|
|
| Balance at September 30, 2012 |
|
|
20,690,635 |
|
|
$ |
206,906 |
|
|
$ |
283,532,016 |
|
|
$ |
— |
|
|
$ |
2,334,682 |
|
|
$ |
5,601,380 |
|
|
$ |
291,674,984 |
|
|
|
|
|
|
|
|
|
|
|
|
|
|
|
|
|
|
|
|
|
|
|
|
|
|
|
|
|
|
F-58
Combined Notes to the Consolidated Financial Statements of
New Mountain Finance Holdings, L.L.C.,
the Financial Statements of New Mountain Finance Corporation and the Financial Statements
of
New Mountain Finance AIV Holdings Corporation (continued)
The table below illustrates the effect of certain transactions on the capital accounts of AIV Holdings:
|
|
|
|
|
|
|
|
|
|
|
|
|
|
|
|
|
|
|
|
|
|
|
|
|
|
|
|
|
| |
|
Common Stock |
|
|
Paid in
Capital
in
Excess
of Par |
|
|
Undistributed
Net
Investment
Income |
|
|
Accumulated
Undistributed
Net Realized
(Losses)
Gains |
|
|
Net
Unrealized
(Depreciation)
Appreciation
|
|
|
Total
Stockholders’
Equity |
|
| |
|
Shares |
|
|
Par Amount |
|
|
|
|
|
|
| Balance at December 31, 2011 |
|
|
100 |
|
|
$ |
1 |
|
|
$ |
292,383,201 |
|
|
$ |
— |
|
|
$ |
(994,034 |
) |
|
$ |
(16,374,171 |
) |
|
$ |
275,014,997 |
|
| Dividends declared |
|
|
— |
|
|
|
— |
|
|
|
— |
|
|
|
(19,661,944 |
) |
|
|
(5,211,039 |
) |
|
|
— |
|
|
|
(24,872,983 |
) |
| Distribution to New Mountain Guardian AIV, L.P. |
|
|
— |
|
|
|
— |
|
|
|
(57,834,853 |
) |
|
|
— |
|
|
|
(381,614 |
) |
|
|
— |
|
|
|
(58,216,467 |
) |
| Deferred offering costs allocated from New Mountain Finance Holdings, L.L.C. |
|
|
— |
|
|
|
— |
|
|
|
(165,487 |
) |
|
|
— |
|
|
|
— |
|
|
|
— |
|
|
|
(165,487 |
) |
| Net increase in stockholders’ equity resulting from operations |
|
|
— |
|
|
|
— |
|
|
|
— |
|
|
|
19,661,944 |
|
|
|
9,783,485 |
|
|
|
7,474,467 |
|
|
|
36,919,896 |
|
|
|
|
|
|
|
|
|
|
|
|
|
|
|
|
|
|
|
|
|
|
|
|
|
|
|
|
|
|
| Balance at September 30, 2012 |
|
|
100 |
|
|
$ |
1 |
|
|
$ |
234,382,861 |
|
|
$ |
— |
|
|
$ |
3,196,798 |
|
|
$ |
(8,899,704 |
) |
|
$ |
228,679,956 |
|
|
|
|
|
|
|
|
|
|
|
|
|
|
|
|
|
|
|
|
|
|
|
|
|
|
|
|
|
|
Note 11. Earnings Per Share
The following information sets forth the computation of basic and diluted net increase in NMFC’s net assets per share resulting from operations for the three and nine months ended September 30, 2012:
|
|
|
|
|
|
|
|
|
| |
|
Three months ended
September 30, 2012 |
|
|
Nine months ended
September 30, 2012 |
|
| Numerator for basic earnings per share: |
|
$ |
9,954,928 |
|
|
$ |
21,978,370 |
|
| Denominator for basic weighted average share: |
|
|
16,177,442 |
|
|
|
12,537,607 |
|
|
|
|
|
|
|
|
|
|
| Basic earnings per share: |
|
$ |
0.62 |
|
|
$ |
1.75 |
|
|
|
|
|
|
|
|
|
|
| Numerator for diluted earnings per share(a): |
|
$ |
22,244,691 |
|
|
$ |
56,996,152 |
|
| Denominator for diluted weighted average share(b): |
|
|
36,138,511 |
|
|
|
32,671,954 |
|
|
|
|
|
|
|
|
|
|
| Diluted earnings per share: |
|
$ |
0.62 |
|
|
$ |
1.74 |
|
|
|
|
|
|
|
|
|
|
| (a) |
Includes full income at the Operating Company for the period. |
| (b) |
Assumes AIV Holdings exchanges its units in the Operating Company for public shares of NMFC as of December 31, 2011 (see Note 1, Formation and Business Purpose).
|
F-59
Combined Notes to the Consolidated Financial Statements of
New Mountain Finance Holdings, L.L.C.,
the Financial Statements of New Mountain Finance Corporation and the Financial Statements
of
New Mountain Finance AIV Holdings Corporation (continued)
The following information sets forth the computation of basic and diluted net increase in NMFC’s net assets per share resulting from operations for the three months ended September 30, 2011 and the period
May 19, 2011 to September 30, 2011:
|
|
|
|
|
|
|
|
|
| |
|
Three months ended
September 30, 2011 |
|
|
May 19, 2011
(commencement
of operations) to
September 30, 2011 |
|
| Numerator for basic earnings per share: |
|
$ |
(3,893,305 |
) |
|
$ |
4,152,918 |
|
| Denominator for basic weighted average share: |
|
|
10,697,691 |
|
|
|
10,697,691 |
|
|
|
|
|
|
|
|
|
|
| Basic earnings per share: |
|
$ |
(0.36 |
) |
|
$ |
0.39 |
|
|
|
|
|
|
|
|
|
|
| Numerator for diluted earnings per share(a): |
|
$ |
(11,252,850 |
) |
|
$ |
(5,975,999 |
) |
| Denominator for diluted weighted average share(b): |
|
|
30,919,629 |
|
|
|
30,919,629 |
|
|
|
|
|
|
|
|
|
|
| Diluted earnings per share: |
|
$ |
(0.36 |
) |
|
$ |
(0.19 |
) |
|
|
|
|
|
|
|
|
|
| (a) |
Includes full income at the Operating Company for the period. Does not include unrealized appreciation in the Operating Company resulting from the IPO. |
| (b) |
Assumes AIV Holdings exchanges its units in the Operating Company for public shares of NMFC on May 19, 2011 (see Note 1, Formation and Business Purpose).
|
Note 12. Financial Highlights
The following information sets forth the financial highlights for the Operating Company for the respective nine months ended September 30, 2012 and September 30, 2011.
|
|
|
|
|
|
|
|
|
| |
|
Nine months ended |
|
| |
|
September 30, 2012 |
|
|
September 30, 2011 |
|
| Total return based on net asset value (a) |
|
|
13.06 |
% |
|
|
5.82 |
% |
| Average net assets for the period |
|
$ |
450,716,451 |
|
|
$ |
346,162,848 |
|
| Ratio to average net assets (b): |
|
|
|
|
|
|
|
|
| Net investment income |
|
|
9.39 |
% |
|
|
11.20 |
% |
| Total expenses (gross) |
|
|
9.12 |
% |
|
|
4.54 |
% |
| Total expenses (net of reimbursable expenses) |
|
|
8.71 |
% |
|
|
4.02 |
% |
| Net assets, end of period |
|
$ |
520,354,940 |
|
|
$ |
411,921,204 |
|
| Average debt outstanding—Holdings Credit Facility |
|
$ |
122,887,369 |
|
|
$ |
46,718,994 |
|
| Average debt outstanding—SLF Credit Facility |
|
$ |
174,808,061 |
|
|
$ |
123,049,814 |
|
| Weighted average common membership units outstanding |
|
|
32,671,954 |
|
|
|
30,919,629 |
(c) |
| Asset coverage ratio |
|
|
255.02 |
% |
|
|
283.48 |
% |
| Portfolio turnover |
|
|
34.77 |
% |
|
|
35.46 |
% |
| (a) |
For the nine months ended September 30, 2012, total return is calculated assuming a purchase at net asset value on the opening of the first day of the year
and a sale at net asset value on the last day of the period. Dividends and distributions, if any, are assumed for purposes of this calculation, to be reinvested at the net asset value on the last day of the respective quarter. For the nine months
ended September 30, 2011, total return is calculated in two parts: (1) from the opening of the first day of the year to NMFC’s IPO date, total return is calculated based on net income over weighted average net assets and (2) from
NMFC’s IPO date to September 30, 2011, |
F-60
Combined Notes to the Consolidated Financial Statements of
New Mountain Finance Holdings, L.L.C.,
the Financial Statements of New Mountain Finance Corporation and the Financial Statements
of
New Mountain Finance AIV Holdings Corporation (continued)
| |
total return is calculated assuming a purchase at net asset value on NMFC’s IPO date and a sale at net asset value on the last day of the period. Dividends and distributions, if any, are
assumed for purposes of this calculation, to be reinvested at the net asset value on the last day of the respective quarter. |
| (b) |
Ratio to average net assets has been annualized. |
| (c) |
Weighted average common membership units outstanding presented from May 19, 2011 forward as the fund became unitized on that date, the IPO date. |
|
|
|
|
|
|
|
|
|
| |
|
Nine months ended
September 30, 2012 |
|
|
May 19, 2011
(commencement
of operations) to
September 30, 2011 |
|
| Per unit data for the Operating Company (a): |
|
|
|
|
|
|
|
|
| Net asset value, January 1, 2012 and May 19, 2011(b), respectively |
|
$ |
13.60 |
|
|
$ |
14.08 |
|
| Net investment income |
|
|
0.97 |
|
|
|
0.47 |
|
| Net realized and unrealized gains (losses) |
|
|
0.76 |
|
|
|
(0.67 |
) |
| Dividends from net investment income |
|
|
(1.23 |
) |
|
|
(0.56 |
) |
|
|
|
|
|
|
|
|
|
| Net increase (decrease) in net assets resulting from operations |
|
|
0.50 |
|
|
|
(0.76 |
) |
| Net asset value, September 30, 2012 and September 30, 2011, respectively |
|
$ |
14.10 |
|
|
$ |
13.32 |
|
|
|
|
|
|
|
|
|
|
| (a) |
Per unit data is based on weighted average common membership units outstanding. |
| (b) |
Data presented from May 19, 2011 forward as the fund became unitized on that date, the IPO date. |
F-61
Combined Notes to the Consolidated Financial Statements of
New Mountain Finance Holdings, L.L.C.,
the Financial Statements of New Mountain Finance Corporation and the Financial Statements
of
New Mountain Finance AIV Holdings Corporation (continued)
The following information sets forth the financial highlights for NMFC for the nine months ended September 30, 2012 and the period May 19, 2011 to September 30, 2011. The ratios to average net assets
have been annualized.
|
|
|
|
|
|
|
|
|
| |
|
Nine months ended
September 30, 2012 |
|
|
May 19, 2011
(commencement
of operations) to
September 30, 2011 |
|
| Per share data (a): |
|
|
|
|
|
|
|
|
| Net asset value, January 1, 2012 and May 19, 2011(b), respectively |
|
$ |
13.60 |
|
|
$ |
13.50 |
|
| Net increase in net assets resulting from operations allocated from New Mountain Finance Holdings, L.L.C.: |
|
|
|
|
|
|
|
|
| Net investment income |
|
|
0.97 |
|
|
|
0.47 |
|
| Net realized and unrealized gains (losses) |
|
|
0.76 |
|
|
|
(0.67 |
) |
|
|
|
|
|
|
|
|
|
| Total net increase (decrease) |
|
|
1.73 |
|
|
|
(0.20 |
) |
| Net change in unrealized appreciation of investment in New Mountain Finance Holdings, L.L.C. |
|
|
— |
|
|
|
0.58 |
|
| Dividends declared |
|
|
(1.23 |
) |
|
|
(0.56 |
) |
|
|
|
|
|
|
|
|
|
| Net asset value, September 30, 2012 and September 30, 2011, respectively |
|
$ |
14.10 |
|
|
$ |
13.32 |
|
|
|
|
|
|
|
|
|
|
| Per share market value, September 30, 2012 and September 30, 2011, respectively |
|
$ |
14.82 |
|
|
$ |
12.71 |
|
|
|
|
|
|
|
|
|
|
| Total return based on market value (c) |
|
|
20.27 |
% |
|
|
(3.46 |
)% |
| Total return based on net asset value (d) |
|
|
13.06 |
% |
|
|
(1.46 |
)% |
| Shares outstanding at end of period |
|
|
20,690,635 |
|
|
|
10,697,691 |
|
| Average weighted shares outstanding for the period |
|
|
12,537,607 |
|
|
|
10,697,691 |
|
| Average net assets for the period |
|
$ |
167,815,253 |
|
|
$ |
148,525,653 |
|
| Ratio to average net assets: |
|
|
|
|
|
|
|
|
| Total expenses (e) |
|
|
8.71 |
% |
|
|
4.91 |
% |
| Net investment income (e) |
|
|
9.39 |
% |
|
|
9.18 |
% |
| (a) |
Per share data is based on the summation of the per share results of operations items over the outstanding shares for the period in which the respective line items were realized
or earned. |
| (b) |
Data presented from May 19, 2011 forward as the fund became unitized on that date, the IPO date. |
| (c) |
For the nine months ended September 30, 2012, total return is calculated assuming a purchase of common stock at the opening of the first day of the year and a sale on the
closing of the last business day of the period. Dividends and distributions, if any, are assumed for purposes of this calculation, to be reinvested at prices obtained under NMFC’s dividend reinvestment plan. For the period May 19, 2011 to
September 30, 2011, total return is calculated assuming a purchase of common stock at IPO and a sale on the closing of the last business day of the period. Dividends and distributions, if any, are assumed for purposes of this calculation, to be
reinvested at prices obtained under NMFC’s dividend reinvestment plan. |
F-62
Combined Notes to the Consolidated Financial Statements of
New Mountain Finance Holdings, L.L.C.,
the Financial Statements of New Mountain Finance Corporation and the Financial Statements
of
New Mountain Finance AIV Holdings Corporation (continued)
| (d) |
For the nine months ended September 30, 2012, total return is calculated assuming a purchase at net asset value on the opening of the first day of the period and a sale at
net asset value on the last day of the period. Dividends and distributions, if any, are assumed for purposes of this calculation, to be reinvested at the net asset value on the last day of the respective quarter. For the period May 19, 2011 to
September 30, 2011, total return is calculated assuming a purchase at net asset value on the opening of the first day of the period and a sale at net asset value on the last business day of the period. Dividends and distributions, if any, are
assumed for purposes of this calculation, to be reinvested at the net asset value on the last day of the respective quarter. |
| (e) |
Average net assets for the nine months ended September 30, 2012 is based on the summation of the results of operations items over the net assets for the period in which the
respective line items were realized or earned. |
The following information sets forth the financial highlights for AIV
Holdings for the nine months ended September 30, 2012 and the period May 19, 2011 to September 30, 2011. The ratios to average net assets have been annualized.
|
|
|
|
|
|
|
|
|
| |
|
Nine months ended
September 30, 2012 |
|
|
May 19, 2011
(commencement
of operations) to
September 30,
2011 |
|
| Total return based on net asset value (a) |
|
|
14.45 |
% |
|
|
(3.56 |
)% |
| Average net assets for the period |
|
$ |
279,835,042 |
|
|
$ |
280,759,329 |
|
| Ratio to average net assets: |
|
|
|
|
|
|
|
|
| Total expenses (b) |
|
|
8.71 |
% |
|
|
4.91 |
% |
| Net investment income (b) |
|
|
9.39 |
% |
|
|
9.18 |
% |
| (a) |
For the nine months ended September 30, 2012, total return is calculated assuming a purchase at net asset value on the opening of the first day of the period and a sale at
net asset value on the last day of the period. Dividends and distributions, if any, are assumed for purposes of this calculation, to be reinvested at net asset value on the last day of the respective quarter. For the period May 19, 2011 to
September 30, 2011, total return is calculated assuming a purchase at net asset value on the opening of the first day of the period and a sale at net asset value on the last business day of the period. Dividends and distributions, if any, are
assumed for purposes of this calculation, to be reinvested at the net asset value on the last day of the respective quarter. |
| (b) |
Average net assets for the nine months ended September 30, 2012 is based on the summation of the results of operations items over the net assets for the period in which the
respective line items were realized or earned. |
Note 13. Subsequent Events
On November 6, 2012, the Operating Company’s board of directors, and subsequently NMFC’s board of directors, declared a fourth
quarter 2012 distribution of $0.34 per unit/share payable on December 28, 2012 to holders of record as of December 14, 2012. Subsequently, AIV Holdings’ board of directors declared a dividend payable on December 28, 2012 to
holders of record as of December 14, 2012 in an amount equal to $0.34 per unit multiplied by the total number of units owned by AIV Holdings of the Operating Company as of the record date.
F-63
REPORT OF INDEPENDENT REGISTERED PUBLIC ACCOUNTING FIRM
To the Boards of Directors of
New Mountain Finance Holdings,
L.L.C.,
New Mountain Finance Corporation and
New
Mountain Finance AIV Holdings Corporation
New York, New York
We have reviewed the accompanying Consolidated Statement of Assets, Liabilities and Members’ Capital of New Mountain Finance Holdings, L.L.C., including the Consolidated Schedule of Investments as of
September 30, 2012, and the related Consolidated Statements of Operations for the three and nine month periods ended September 30, 2012 and 2011, and the Consolidated Statements of Changes in Members’ Capital, and Cash Flows for the
nine month periods ended September 30, 2012 and 2011. Also, we have reviewed the Statements of Assets and Liabilities of New Mountain Finance Corporation and New Mountain Finance AIV Holdings Corporation as of September 30, 2012, and the
related Statements of Operations for the three month periods ended September 30, 2012 and 2011, the nine month period ended September 30, 2012 and for the period May 19, 2011 (commencement of operations) to September 30, 2011,
and the Statements of Changes in Net Assets and Cash Flows for the nine month period ended September 30, 2012 and for the period May 19, 2011 to September 30, 2011. These interim financial statements are the responsibility of the
management of New Mountain Finance Holdings, L.L.C., New Mountain Finance Corporation and New Mountain Finance AIV Holdings Corporation.
We conducted our reviews in accordance with the standards of the Public Company Accounting Oversight Board (United States). A review of interim
financial information consists principally of applying analytical procedures and making inquiries of persons responsible for financial and accounting matters. It is substantially less in scope than an audit conducted in accordance with the standards
of the Public Company Accounting Oversight Board (United States), the objective of which is the expression of an opinion regarding the financial statements taken as a whole. Accordingly, we do not express such an opinion.
Based on our reviews, we are not aware of any material modifications that should be made to such interim financial statements for them to be in
conformity with accounting principles generally accepted in the United States of America.
We have previously audited, in accordance
with the standards of the Public Company Accounting Oversight Board (United States), the Consolidated Statement of Assets, Liabilities and Members’ Capital of New Mountain Finance Holdings, L.L.C., including the Consolidated Schedule of
Investments as of December 31, 2011, the related Consolidated Statements of Operations, Changes in Members’ Capital, and Cash Flows for the year then ended (not presented herein), and the Statements of Assets and Liabilities of New
Mountain Finance Corporation and New Mountain Finance AIV Holdings Corporation as of December 31, 2011, the related Statements of Operations, Changes in Net Assets, and Cash Flows for the period May 19, 2011 (commencement of operations) to
December 31, 2011 (not presented herein); and in our reports dated March 7, 2012, we expressed unqualified opinions on those financial statements. In our opinion, the information set forth in the accompanying Consolidated Statement of
Assets, Liabilities and Members’ Capital of New Mountain Finance Holdings, L.L.C., including the Consolidated Schedule of Investments, and the Statements of Assets and Liabilities of New Mountain Finance Corporation and New Mountain Finance AIV
Holdings Corporation as of December 31, 2011, is fairly stated, in all material respects, in relation to the Consolidated Statement of Assets, Liabilities, and Members’ Capital of New Mountain Finance Holdings, L.L.C., including the
Consolidated Schedules of Investments, and the Statements of Assets and Liabilities of New Mountain Finance Corporation and New Mountain Finance AIV Holdings Corporation from which they have been derived.
DELOITTE & TOUCHE LLP
New York, New York
November 6, 2012
F-64
PROSPECTUS
New Mountain Finance Corporation
Common Stock
New Mountain Finance Corporation (“NMFC”) is a holding company with no direct operations of its own, and its only business and sole asset
is its ownership of common membership units of New Mountain Finance Holdings, L.L.C. (the “Operating Company”). The Operating Company is an externally managed business development company managed by New Mountain Finance Advisers BDC,
L.L.C. and is the operating company for NMFC’s business. NMFC and the Operating Company each have elected to be treated as a business development company under the Investment Company Act of 1940. The Operating Company’s investment
objective is to generate current income and capital appreciation through the sourcing and origination of debt securities at all levels of the capital structure, including first and second lien debt, notes, bonds and mezzanine securities. NMFC owns
approximately 34.6% of the common membership units of the Operating Company and New Mountain Finance AIV Holdings Corporation owns approximately 65.4% of the common membership units of the Operating Company.
NMFC may offer, from time to time, in one or more offerings, up to $150,000,000 of its common stock. The common stock may be offered at prices and
on terms to be described in one or more supplements to this prospectus. In addition, this prospectus relates to 22,393,938 shares of NMFC’s common stock that may be sold by the selling stockholders identified under “Selling
Stockholders”. Sales of NMFC’s common stock by the selling stockholders, which may occur at prices below the net asset value per share of NMFC’s common stock, may adversely affect the market price of NMFC’s common stock and may
make it more difficult for NMFC to raise capital.
The offering price per share of NMFC’s common stock less any underwriting
commissions or discounts will generally not be less than the net asset value per share of NMFC’s common stock at the time we make the offering. However, NMFC may issue shares of its common stock pursuant to this prospectus at a price per share
that is less than its net asset value per share (i) with the prior approval of the majority of its common stockholders or (ii) under such other circumstances as the Securities and Exchange Commission may permit.
The selling stockholders identified under “Selling Stockholders” acquired their respective shares of NMFC’s common stock either
through (i) the concurrent private placement to certain affiliates of NMFC in connection with NMFC’s initial public offering or (ii) the formation transactions completed immediately prior to NMFC’s initial public offering. Each offering by
the selling stockholders of their shares of NMFC’s common stock through agents, underwriters or dealers will be accompanied by a prospectus supplement that will identify the selling stockholders that are participating in such offering. NMFC and
the Operating Company will not receive any proceeds from the sale of shares of NMFC’s common stock by any of the selling stockholders.
NMFC’s common stock may be offered directly to one or more purchasers, or through agents designated from time to time by us, or to or through underwriters or dealers. The prospectus supplement relating to an
offering will identify any agents or underwriters involved in the sale of NMFC’s common stock, and will disclose any applicable purchase price, fee, commission or discount arrangement between NMFC and its agents or underwriters or among
NMFC’s underwriters or the basis upon which such amount may be calculated. See “Plan of Distribution”. NMFC may not sell any of its common stock through agents, underwriters or dealers without delivery of this prospectus and a
prospectus supplement describing the method and terms of the offering of such common stock.
NMFC’s common stock is traded on the
New York Stock Exchange under the symbol “NMFC”. On July 6, 2012, the last reported sales price on the New York Stock Exchange for NMFC’s common stock was $14.91 per share. Based on this last reported sales price of NMFC’s common
stock, the aggregate market value of the shares of NMFC’s common stock held by the selling stockholders identified under “Selling Stockholders” is approximately $333.9 million.
An investment in NMFC’s common stock is very risky and highly speculative. Shares of closed-end investment companies, including business
development companies, frequently trade at a discount to their net asset value. In addition, the companies in which NMFC invests, through the Operating Company, are subject to special risks. See “Risk Factors”
beginning on page 21 to read about factors you should consider, including the risk of leverage, before investing in NMFC’s common stock.
Neither the Securities
and Exchange Commission nor any state securities commission has approved or disapproved of these securities, or determined if this prospectus is truthful or complete. Any representation to the contrary is a criminal offense.
This prospectus may not be used to consummate sales of shares of common stock unless accompanied by a prospectus supplement.
Please read this prospectus and any accompanying prospectus supplements before investing and keep each for future reference. This prospectus and any
accompanying prospectus supplements contain important information about NMFC and the Operating Company that a prospective investor ought to know before investing in NMFC’s common stock. NMFC and the Operating Company file annual, quarterly and
current reports, proxy statements and other information with the Securities and Exchange Commission (http://www.sec.gov), which is available free of charge by contacting NMFC by mail at 787 Seventh Avenue, 48th Floor, New York, New York
10019 or on our website at http://www.newmountainfinance.com.
July 10, 2012
You should rely only on the information contained in this prospectus and any accompanying
prospectus supplement. We have not authorized any dealer, salesman or other person to give any information or to make any representation other than those contained in this prospectus or any prospectus supplement to this prospectus. You must not rely
upon any information or representation not contained in this prospectus or any such supplements as if we had authorized it. This prospectus and any such supplements do not constitute an offer to sell or a solicitation of any offer to buy any
security other than the registered securities to which they relate, nor do they constitute an offer to sell or a solicitation of an offer to buy any securities in any jurisdiction to any person to whom it is unlawful to make such an offer or
solicitation in such jurisdiction. The information contained in this prospectus and any such supplements is accurate as of the dates on their covers. Our business, financial condition, results of operations and prospects may have changed since then.
TABLE OF CONTENTS
i
ABOUT THIS PROSPECTUS
This prospectus is part of a registration statement that we have filed with the Securities and Exchange Commission (“SEC”), using the “shelf” registration process. Under the shelf registration
process, which constitutes a delayed offering in reliance on Rule 415 under the Securities Act of 1933, as amended (the “Securities Act”), NMFC may offer, from time to time, in one or more offerings, up to $150,000,000 of its common stock
on terms to be determined at the time of the offering. In addition, this prospectus relates to 22,393,938 shares of NMFC’s common stock that may be sold by the selling stockholders identified under “Selling Stockholders”. The shares
may be offered at prices and on terms described in one or more supplements to this prospectus. This prospectus provides you with a general description of the offerings of shares that NMFC may conduct pursuant to this prospectus. Each time NMFC uses
this prospectus to offer shares, we will provide a prospectus supplement that will contain specific information about the terms of that offering. A prospectus supplement may also add, update or change information contained in this prospectus.
Please carefully read this prospectus and any such supplements together with any exhibits and the additional information described
under “Available Information” and in the “Summary” and “Risk Factors” sections before you make an investment decision.
ii
PROSPECTUS SUMMARY
The following summary contains basic information about offerings pursuant to this prospectus. It may not contain all the information that is
important to you. For a more complete understanding of offerings pursuant to this prospectus, we encourage you to read this entire prospectus and the documents to which we have referred in this prospectus, together with any accompanying prospectus
supplements, including the risks set forth under the caption “Risk Factors” in this prospectus and any accompanying prospectus supplement and the information set forth under the caption “Available Information” in this prospectus.
In this prospectus, unless the context otherwise requires, references to:
| |
Ÿ |
|
“NMFC” refers to New Mountain Finance Corporation, a Delaware corporation, which was incorporated on June 29, 2010 in preparation for the
initial public offering; |
| |
Ÿ |
|
“NMF SLF” refers to New Mountain Finance SPV Funding, L.L.C.; |
| |
Ÿ |
|
“Operating Company” refers to New Mountain Finance Holdings, L.L.C., a Delaware limited liability company, which is the operating company for
our business. References to the Operating Company include New Mountain Finance Holdings, L.L.C.’s wholly-owned subsidiary, NMF SLF, unless the context otherwise requires. References to the Operating Company exclude NMF SLF when referencing the
Operating Company’s common membership units, board of directors, and credit facility or leverage; |
| |
Ÿ |
|
“Guardian AIV” refers to New Mountain Guardian AIV, L.P.; |
| |
Ÿ |
|
“AIV Holdings” refers to New Mountain Finance AIV Holdings Corporation, a Delaware corporation which was incorporated on March 11, 2011, of
which Guardian AIV is the sole stockholder; |
| |
Ÿ |
|
“New Mountain Finance Entities”, “we”, “us” and “our” refer to NMFC, the Operating Company and AIV Holdings,
collectively; except for references to the registration statement of which this prospectus forms a part and the offering of securities thereunder, in which case references to “we”, “us” and “our” refer to NMFC and the
Operating Company only. |
| |
Ÿ |
|
“Investment Adviser” refers to New Mountain Finance Advisers BDC, L.L.C., the Operating Company’s investment adviser;
|
| |
Ÿ |
|
“Administrator” refers to the New Mountain Finance Entities’ administrator, New Mountain Finance Administration, L.L.C.;
|
| |
Ÿ |
|
“New Mountain Capital” refers to New Mountain Capital Group, L.L.C. and its affiliates; |
| |
Ÿ |
|
“Predecessor Entities” refers to New Mountain Guardian (Leveraged), L.L.C. and New Mountain Guardian Partners, L.P., together with their
respective direct and indirect wholly-owned subsidiaries prior to the initial public offering; |
| |
Ÿ |
|
“Holdings Credit Facility” refers to the Operating Company’s Amended and Restated Loan and Security Agreement with Wells Fargo Bank, National
Association, dated May 19, 2011, as amended; |
| |
Ÿ |
|
“SLF Credit Facility” refers to NMF SLF’s Loan and Security Agreement with Wells Fargo Bank, National Association, dated October 27, 2010,
as amended; and |
| |
Ÿ |
|
“Credit Facilities” refers to the Holding Credit Facility and the SLF Credit Facility, collectively. |
1
Overview
The Operating Company is a Delaware limited liability company. The Operating Company is externally managed and has elected to be treated as a business development company (“BDC”) under the Investment
Company Act of 1940, as amended (the “1940 Act”). As such, the Operating Company is obligated to comply with certain regulatory requirements. The Operating Company intends to be treated as a partnership for federal income tax purposes for
so long as it has at least two members.
The Operating Company is externally managed by the Investment Adviser. The Administrator
provides the administrative services necessary for operations. The Investment Adviser and Administrator are wholly-owned subsidiaries of New Mountain Capital. New Mountain Capital is a firm with a track record of investing in the middle market and
with assets under management (which includes amounts committed, not all of which have been drawn down and invested to date) totaling approximately $9.0 billion as of March 31, 2012. New Mountain Capital focuses on investing in defensive growth
companies across its private equity, public equity, and credit investment vehicles. The Operating Company, formerly known as New Mountain Guardian (Leveraged), L.L.C., was originally formed as a subsidiary of Guardian AIV by New Mountain Capital in
October 2008. Guardian AIV was formed through an allocation of approximately $300.0 million of the $5.1 billion of commitments supporting New Mountain Partners III, L.P., a private equity fund managed by New Mountain Capital. In
February 2009, New Mountain Capital formed a co-investment vehicle, New Mountain Guardian Partners, L.P., comprising $20.4 million of commitments.
NMFC is a Delaware corporation that was originally incorporated on June 29, 2010. NMFC is a closed-end, non-diversified management investment company that has elected to be treated as a BDC under the 1940 Act.
As such, NMFC is obligated to comply with certain regulatory requirements. NMFC intends to be treated, and intends to comply with the requirements to qualify annually, as a regulated investment company (“RIC”) under Subchapter M of
the Internal Revenue Code of 1986, as amended, (the “Code”) commencing with its taxable year ending on December 31, 2011.
AIV
Holdings is a Delaware corporation that was originally incorporated on March 11, 2011. Guardian AIV, a Delaware limited partnership, is AIV Holdings’ sole stockholder. AIV Holdings is a closed-end, non-diversified management investment
company that has elected to be treated as a BDC under the 1940 Act. As such, AIV Holdings is obligated to comply with certain regulatory requirements. AIV Holdings intends to be treated, and intends to comply with the requirements to qualify
annually, as a RIC under the Code commencing with its taxable year ending on December 31, 2011.
On May 19, 2011, NMFC priced its
initial public offering (the “IPO”) of 7,272,727 shares of common stock at a public offering price of $13.75 per share. Concurrently with the closing of the IPO and at the public offering price of $13.75 per share, NMFC sold an additional
2,172,000 shares of its common stock to certain executives and employees of, and other individuals affiliated with, New Mountain Capital in a concurrent private placement (the “Concurrent Private Placement”). Additionally, 1,252,964 shares
were issued to the partners of New Mountain Guardian Partners, L.P. at that time for their ownership interest in the Predecessor Entities. In connection with NMFC’s IPO and through a series of transactions, the Operating Company owns all
of the operations of the Predecessor Entities, including all of the assets and liabilities related to such operations.
NMFC and AIV
Holdings are holding companies with no direct operations of their own, and their sole asset is their ownership in the Operating Company. NMFC and AIV Holdings each entered into a joinder agreement with respect to the Limited Liability Company
Agreement, as amended and restated, of the Operating Company, pursuant to which NMFC and AIV Holdings were admitted as members of the Operating Company. NMFC acquired from the Operating Company, with the gross proceeds of the
2
IPO and the Concurrent Private Placement, common membership units (“units”) of the Operating Company (the number of units are equal to the number of shares of NMFC’s common stock
sold in the IPO and the Concurrent Private Placement). Additionally, NMFC received units of the Operating Company equal to the number of shares of common stock of NMFC issued to the partners of New Mountain Guardian Partners, L.P. Guardian AIV
was the parent of the Operating Company prior to the IPO and, as a result of the transactions completed in connection with the IPO, obtained units in the Operating Company. Guardian AIV contributed its units in the Operating Company to its newly
formed subsidiary, AIV Holdings, in exchange for common stock of AIV Holdings. AIV Holdings has the right to exchange all or any portion of its units in the Operating Company for shares of NMFC’s common stock on a one-for-one basis at any time.
As of March 31, 2012, NMFC and AIV Holdings owned approximately 34.6% and 65.4%, respectively, of the units of the Operating Company.
The current structure was designed to generally prevent NMFC and its stockholders from being allocated taxable income with respect to
unrecognized gains that existed at the time of the IPO in the Predecessor Entities’ assets, and rather such amounts would be allocated generally to AIV Holdings and its stockholders. The result is that any distributions made to NMFC’s
stockholders that are attributable to such gains generally will not be treated as taxable dividends but rather as return of capital.
3
The diagram below depicts our current organizational structure.

The Operating Company’s investment objective is to generate current income and capital appreciation through
the sourcing and origination of debt securities at all levels of the capital structure, including first and second lien debt, notes, bonds and mezzanine securities. In some cases, the Operating Company’s investments may also include equity
interests. The primary focus is in the debt of defensive growth companies, which are defined as generally exhibiting the following characteristics: (i) sustainable secular growth drivers, (ii) high barriers to competitive entry,
(iii) high free cash flow after capital expenditure and working capital needs, (iv) high returns on assets and (v) niche market dominance.
As of March 31, 2012, the Operating Company’s net asset value was $434.3 million and its portfolio had a fair value of approximately $758.2 million in 57 portfolio companies, with a weighted average
Unadjusted and Adjusted Yield to Maturity of approximately 10.6% and 12.8%, respectively. “Adjusted Yield to Maturity” assumes that the investments in the Operating Company’s portfolio are purchased at fair value on March 31,
2012 and held until their respective maturities with no prepayments or losses and exited at par at maturity. This calculation excludes the impact of existing
4
leverage, except for the non-recourse debt of NMF SLF. NMF SLF is treated as a fully levered asset of the Operating Company, with NMF SLF’s net asset value being included for yield
calculation purposes. The actual yield to maturity may be higher or lower due to the future selection of the London Interbank Offered Rate (“LIBOR”) contracts by the individual companies in the Operating Company’s portfolio or other
factors. References to “Unadjusted Yield to Maturity” have the same assumptions as Adjusted Yield to Maturity except that NMF SLF is not treated as a fully levered asset of the Operating Company, but rather the assets themselves are
consolidated into the Operating Company.
The Investment Adviser
The Investment Adviser, a wholly-owned subsidiary of New Mountain Capital, manages the Operating Company’s day-to-day operations and provides
it with investment advisory and management services. In particular, the Investment Adviser is responsible for identifying attractive investment opportunities, conducting research and due diligence on prospective investments, structuring the
Operating Company’s investments and monitoring and servicing the Operating Company’s investments. We currently do not have, and do not intend to have, any employees. As of March 31, 2012, the Investment Adviser was supported by over 90
staff members of New Mountain Capital, including 58 investment professionals.
The Investment Adviser is managed by a five member
investment committee (the “Investment Committee”), which is responsible for approving purchases and sales of the Operating Company’s investments above $5.0 million in aggregate by issuer. The Investment Committee currently
consists of Steven B. Klinsky, Robert A. Hamwee, Adam Collins, Douglas Londal and Alok Singh. The Investment Committee is responsible for approving all of the Operating Company’s investment purchases above $5.0 million. The Investment
Committee also monitors investments in the Operating Company’s portfolio and approves all asset dispositions above $5.0 million. Purchases and dispositions below $5.0 million may be approved by the Operating Company’s Chief
Executive Officer. These approval thresholds are subject to change over time. We expect to benefit from the extensive and varied relevant experience of the investment professionals serving on the Investment Committee, which includes expertise in
private equity, primary and secondary leveraged credit, private mezzanine finance and distressed debt.
Competitive Advantages
We believe that we have the following competitive advantages over other capital providers to middle market companies:
Proven and Differentiated Investment Style With Areas of Deep Industry Knowledge
In making its investment decisions, the Investment Adviser applies New Mountain Capital’s long-standing, consistent investment approach that
has been in place since its founding more than 10 years ago. We focus on companies in less well followed defensive growth niches of the middle market space where we believe few debt funds have built equivalent research and operational size and
scale.
We benefit directly from New Mountain Capital’s private equity investment strategy that seeks to identify attractive
investment sectors from the top down and then works to become a well positioned investor in these sectors. New Mountain Capital focuses on companies and end markets with sustainable strengths in all economic cycles, particularly ones that are
defensive in nature, that are non-cyclical and can maintain pricing power in the midst of a recessionary and/or inflationary environment. New Mountain Capital focuses on companies within sectors in which it has significant
5
expertise (examples include federal services, software, education, niche healthcare, business services, energy and logistics) while typically avoiding investments in companies with end markets
that are highly cyclical, face secular headwinds, are overly-dependent on consumer demand or are commodity-like in nature.
In making
its investment decisions, the Investment Adviser has adopted the approach of New Mountain Capital, which is based on three primary investment principles:
1. A generalist approach, combined with proactive pursuit of the highest quality opportunities within carefully selected industries, identified via an intensive and structured ongoing research process;
2. Emphasis on strong downside protection and strict risk controls; and
3. Continued search for superior risk adjusted returns, combined with timely, intelligent exits and outstanding return performance.
Experienced Management Team and Established Platform
The Investment Adviser’s team members have extensive experience in the leveraged lending space. Steven B. Klinsky, New Mountain Capital’s Founder, Chief Executive Officer and Managing Director and
Chairman of the board of directors of the New Mountain Finance Entities, was a general partner of Forstmann Little & Co., a manager of debt and equity funds totaling multiple billions of dollars in the 1980s and 1990s. He was also a
co-founder of Goldman, Sachs & Co.’s Leverage Buyout Group in the period from 1981 to 1984. Robert A. Hamwee, Chief Executive Officer and President of the New Mountain Finance Entities and Managing Director of New Mountain
Capital, was formerly President of GSC Group, Inc. (“GSC”), where he was the portfolio manager of GSC’s distressed debt funds and led the development of GSC’s CLOs. Douglas Londal, Managing Director of New Mountain Capital,
was previously co-head of Goldman, Sachs & Co.’s United States (“U.S.”) mezzanine debt team. Alok Singh, Managing Director of New Mountain Capital, has extensive experience structuring debt products as a long-time
partner at Bankers Trust Company.
Many of the debt investments that the Operating Company has made to date have been in the same
companies with which New Mountain Capital has already conducted months of intensive acquisition due diligence related to potential private equity investments. We believe that private equity underwriting due diligence is usually more robust than
typical due diligence for loan underwriting. In its underwriting of debt investments, the Investment Adviser is able to utilize the research and hands-on operating experience that New Mountain Capital’s private equity underwriting teams possess
regarding the individual companies and industries. Business and industry due diligence is led by a team of investment professionals of the Investment Adviser that generally consists of three to seven individuals, typically based on their relevant
company and/or industry specific knowledge. Additionally, the Investment Adviser is also able to utilize its relationships with operating management teams and other private equity sponsors. We believe this differentiates us from many of our
competitors.
Significant Sourcing Capabilities and Relationships
We believe the Investment Adviser’s ability to source attractive investment opportunities is greatly aided by both New Mountain Capital’s historical and current reviews of private equity opportunities in
the business segments we target. To date, a significant majority of the investments that the Operating Company has made are in the debt of companies and industry sectors that were first identified and reviewed in connection with New Mountain
Capital’s private equity efforts, and the majority of our current pipeline reflects this as well. Furthermore, the Investment Adviser’s investment professionals
6
have deep and longstanding relationships in both the private equity sponsor community and the lending/agency community which they have and will continue to utilize to generate investment
opportunities.
Risk Management through Various Cycles
New Mountain Capital has emphasized tight control of risk since its inception and long before the recent global financial distress began. To date, New Mountain Capital has never experienced a bankruptcy of any of
its portfolio companies in its private equity efforts or with respect to the Predecessor Entities’ business. The Investment Adviser seeks to emphasize tight control of risk with our investments in several important ways, consistent with New
Mountain Capital’s historical approach. In particular, the Investment Adviser:
| |
Ÿ |
|
Emphasizes the origination or purchase of debt in what the Investment Adviser believes are defensive growth companies, which are less likely to be dependent on
macro-economic cycles; |
| |
Ÿ |
|
Targets investments in companies that are preeminent market leaders in their own industries, and when possible, investments in companies that have strong
management teams whose skills are difficult for competitors to acquire or reproduce; and |
| |
Ÿ |
|
Emphasizes capital structure seniority in the Investment Adviser’s underwriting process. |
Access to Non Mark to Market, Seasoned Leverage Facilities
The amounts available under the Credit Facilities are generally not subject to reduction as a result of mark to market fluctuations in the Operating Company’s portfolio investments. For a detailed discussion
of the Credit Facilities, see “Management’s Discussion and Analysis of Financial Conditions and Results of Operations—Liquidity and Capital Resources”.
Market Opportunity
We believe that the size of the market for investments that we target,
coupled with the demands of middle market companies for flexible sources of capital at competitive terms and rates, create an attractive investment environment for us.
| |
Ÿ |
|
The leverage finance market has a high level of financing needs over the next several years due to significant bank debt
maturities. We believe that the large dollar volume of loans that need to be refinanced will present attractive opportunities to invest capital in a manner consistent with our stated objectives.
|
| |
Ÿ |
|
Middle market companies continue to face difficulties in accessing the capital markets. We believe opportunities to serve the
middle market will continue to exist. While many middle market companies were formerly able to raise funds by issuing high-yield bonds, we believe this approach to financing has become more difficult in recent years as institutional investors have
sought to invest in larger, more liquid offerings. In addition, many private finance companies and hedge funds have reduced their middle market lending activities due to decreased availability of their own financing. |
| |
Ÿ |
|
Consolidation among commercial banks has reduced the focus on middle market lending. We believe that many traditional bank lenders
to middle market businesses have either exited or de-emphasized their service and product offerings in the middle market. These traditional lenders have instead focused on lending and providing other services to large corporate clients. We believe
this has resulted in fewer key players and the reduced availability of debt capital to the companies we target. |
7
| |
Ÿ |
|
Attractive pricing. Reduced access to, and availability of, debt capital typically increases the interest rates, or pricing, of
loans for middle market lenders. Recent primary debt transactions in this market often include upfront fees, prepayment protections and, in some cases, warrants to purchase common stock, all of which should enhance the profitability of new loans to
lenders. |
| |
Ÿ |
|
Conservative deal structures. As a result of the credit crisis, many lenders are requiring larger equity contributions from
financial sponsors. Larger equity contributions create an enhanced margin of safety for lenders because leverage is a lower percentage of the implied enterprise value of the company. |
| |
Ÿ |
|
Large pool of uninvested private equity capital available for new buyouts. We expect that private equity firms will continue to
pursue acquisitions and will seek to leverage their equity investments with mezzanine loans and/or senior loans (including traditional first and second lien, as well as unitranche loans) provided by companies such as ours.
|
Operating and Regulatory Structure
NMFC and the Operating Company are closed-end, non-diversified management investment companies that have elected to be treated as BDCs under the 1940 Act and are required to maintain an asset coverage ratio,
as defined in the 1940 Act, of at least 200.0%. NMFC has no material long-term liabilities itself and its only business and sole asset is its ownership of units of the Operating Company. As a result, NMFC looks to the Operating Company’s assets
for purposes of satisfying the requirements under the 1940 Act otherwise applicable to NMFC. See “Regulation”. The Operating Company and NMF SLF have long term liabilities related to the Credit Facilities.
NMFC intends to elect to be treated, and intends to comply with the requirements to qualify annually, as a RIC under Subchapter M of the Code,
commencing with its taxable year ending on December 31, 2011. See “Material Federal Income Tax Considerations”. As a RIC, NMFC generally will not have to pay corporate-level federal income taxes on any net ordinary income or capital gains
that it timely distributes to its stockholders as dividends if it meets certain source-of-income, distribution and asset diversification requirements. The Operating Company intends to make distributions to its unit holders that will be sufficient to
enable NMFC to pay quarterly distributions to its stockholders and to obtain and maintain its status as a RIC. NMFC intends to distribute to its stockholders substantially all of its annual taxable income, except that it may retain certain net
capital gains for reinvestment in units of the Operating Company.
Risks
An investment in NMFC’s common stock involves risk, including the risk of leverage and the risk that our operating policies and strategies may
change without prior notice to NMFC stockholders or prior stockholder approval. See “Risk Factors” and the other information included in this prospectus for a discussion of factors you should carefully consider before deciding to invest in
shares of NMFC’s common stock. The value of the Operating Company’s assets, as well as the market price of NMFC’s shares, will fluctuate. Our investments may be risky, and you may lose all or part of your investment in NMFC. Investing
in NMFC involves other risks, including the following:
| |
Ÿ |
|
We have a limited operating history; |
| |
Ÿ |
|
The Operating Company may suffer credit losses; |
| |
Ÿ |
|
The Operating Company does not expect to replicate the Predecessor Entities’ historical performance or the historical performance of other entities managed
or supported by New Mountain Capital; |
8
| |
Ÿ |
|
There is uncertainty as to the value of the Operating Company’s portfolio investments because most of its investments are, and may continue to be in private
companies and recorded at fair value. In addition, because NMFC is a holding company, the fair values of the Operating Company’s investments are determined by the Operating Company’s board of directors in accordance with the Operating
Company’s valuation policy; |
| |
Ÿ |
|
The Operating Company’s ability to achieve its investment objective depends on key investment personnel of the Investment Adviser. If the Investment Adviser
were to lose any of its key investment personnel, the Operating Company’s ability to achieve its investment objective could be significantly harmed; |
| |
Ÿ |
|
The Investment Adviser has limited experience managing a BDC or a RIC, which could adversely affect our business; |
| |
Ÿ |
|
The Operating Company operates in a highly competitive market for investment opportunities and may not be able to compete effectively;
|
| |
Ÿ |
|
Our business, results of operations and financial condition depends on the Operating Company’s ability to manage future growth effectively;
|
| |
Ÿ |
|
The Operating Company borrows money, which could magnify the potential for gain or loss on amounts invested in us and increase the risk of investing in us;
|
| |
Ÿ |
|
Changes in interest rates may affect the Operating Company’s cost of capital and net investment income; |
| |
Ÿ |
|
Regulations governing the operations of BDCs will affect our ability to raise additional equity capital as well as our ability to issue senior securities or
borrow for investment purposes, any or all of which could have a negative effect on our investment objectives and strategies; |
| |
Ÿ |
|
We may experience fluctuations in our annual and quarterly results due to the nature of our business; |
| |
Ÿ |
|
The Operating Company’s board of directors may change its investment objective, operating policies and strategies without prior notice or member approval,
the effects of which may be adverse to your interest as a stockholder; |
| |
Ÿ |
|
NMFC will be subject to corporate-level federal income tax on all of its income if it is unable to maintain RIC status under Subchapter M of the Code, which
would have a material adverse effect on its financial performance; |
| |
Ÿ |
|
NMFC may not be able to pay you distributions on its common stock, its distributions to you may not grow over time and a portion of its distributions to you may
be a return of capital for federal income tax purposes; |
| |
Ÿ |
|
The Operating Company’s investments in portfolio companies may be risky, and the Operating Company could lose all or part of any of its investments;
|
| |
Ÿ |
|
The lack of liquidity in the Operating Company’s investments may adversely affect our business; |
| |
Ÿ |
|
Economic recessions or downturns could impair the Operating Company’s portfolio companies and harm its operating results; |
| |
Ÿ |
|
NMFC is a holding company with no direct operations of its own, and will depend on distributions from the Operating Company to meet its ongoing obligations;
|
| |
Ÿ |
|
Any future exchange by AIV Holdings of units of the Operating Company for shares of NMFC’s common stock would significantly dilute the voting power of
NMFC’s current stockholders with |
9
| |
respect to the election of NMFC directors or other matters that require the approval of NMFC stockholders only. In addition, the interests of the partners of Guardian AIV following such exchange
by AIV Holdings may be adverse to the interests of NMFC’s current stockholders and could limit your ability to influence the outcome of key transactions, including any change of control; |
| |
Ÿ |
|
The market price of NMFC’s common stock may fluctuate significantly; and |
| |
Ÿ |
|
Sales of substantial amounts of NMFC’s common stock in the public market may have an adverse effect on the market price of its common stock.
|
Company Information
Our administrative and executive offices are located at 787 Seventh Avenue, 48th Floor, New York, New York 10019, and our telephone number is (212) 720-0300. We maintain a website at
http://www.newmountainfinance.com. Information contained on our website is not incorporated by reference into this prospectus, and you should not consider information contained on our website to be part of this prospectus.
Presentation of Historical Financial Information and Market Data
Historical Financial Information
Unless otherwise indicated, historical references
contained in this prospectus in “Selected Financial and Other Data”, “Selected Quarterly Data”, “Management’s Discussion and Analysis of Financial Condition and Results of Operations”, “Senior Securities”
and “Portfolio Companies” relate to the Operating Company, which is NMFC’s sole investment. The consolidated financial statements of New Mountain Finance Holdings, L.L.C., formerly known as New Mountain Guardian
(Leveraged), L.L.C., and New Mountain Guardian Partners, L.P. are the Operating Company’s historical consolidated financial statements.
Market Data
Statistical and market
data used in this prospectus has been obtained from governmental and independent industry sources and publications. We have not independently verified the data obtained from these sources, and we cannot assure you of the accuracy or completeness of
the data. Forward-looking information obtained from these sources is subject to the same qualifications and the additional uncertainties regarding the other forward-looking statements contained in this prospectus. See “Cautionary Statement
Regarding Forward-Looking Statements”.
10
THE OFFERING
We may offer, from time to time, up to $150,000,000 of NMFC’s common stock on terms to be determined at the time of each offering. We will
offer NMFC’s shares of common stock at prices and on terms to be set forth in one or more supplements to this prospectus. The offering price per share of NMFC’s shares, less any underwriting commissions or discounts, generally will not be
less than the net asset value per share of our common stock at the time of an offering. However, we may issue shares of NMFC’s common stock pursuant to this prospectus at a price per share that is less than NMFC’s net asset value per share
(i) with the prior approval of the majority of NMFC’s common stockholders or (ii) under such other circumstances as the SEC may permit. Any such issuance of shares of NMFC’s common stock below net asset value may be dilutive to the
net asset value of NMFC’s common stock. See “Risk Factors—Risks Relating to Offerings Pursuant to this Prospectus”. In addition, this prospectus relates to 22,393,938 shares of NMFC’s common stock that may be sold by the
selling stockholders identified under “Selling Stockholders”. Sales of NMFC’s common stock by the selling stockholders, which may occur at prices below the net asset value per share of NMFC’s common stock, may adversely affect
the market price of NMFC’s common stock and may make it more difficult for NMFC to raise capital.
NMFC’s shares may be
offered directly to one or more purchasers, or through agents designated from time to time by us, or to or through underwriters or dealers. The prospectus supplement relating to an offering will identify any agents or underwriters involved in the
sale of NMFC’s shares, and will disclose any applicable purchase price, fee, commission or discount arrangement between us and our agents or underwriters or among our underwriters or the basis upon which such amount may be calculated. See
“Plan of Distribution”. We may not sell any of NMFC’s shares through agents, underwriters or dealers without delivery of this prospectus and a prospectus supplement describing the method and terms of the offering of such shares of
common stock.
Set forth below is additional information regarding offerings of NMFC’s shares of common stock:
| Use of Proceeds |
Unless otherwise specified in a prospectus supplement, the Operating Company intends to use the net proceeds from the sale of NMFC’s common stock for new investments in portfolio companies in
accordance with the Operating Company’s investment objective and strategies described in this prospectus, to temporarily repay indebtedness (which will be subject to reborrowing), to pay our operating expenses and distributions to our
stockholders/unit holders and for general corporate purposes. Pending such use, the Operating Company will invest the net proceeds primarily in cash, cash equivalents, U.S. government securities and other high-quality investments that mature in one
year or less from the date of the investment. These securities may have lower yields than the types of investments we would typically make in accordance with our investment objective and, accordingly, may result in lower distributions, if any,
during such period. Each supplement to this prospectus relating to an offering will more fully identify the use of the proceeds from such offering. See “Use of Proceeds”. |
| |
We will not receive any proceeds from any sale of common stock by the selling stockholders identified under “Selling Stockholders”. |
11
| New York Stock Exchange Symbol |
“NMFC” |
| Investment Advisory Fees |
NMFC does not have an investment adviser. The Operating Company pays the Investment Adviser a fee for its services under an investment advisory and management agreement (the “Investment Management
Agreement”) consisting of two components—a base management fee and an incentive fee. The base management fee is payable quarterly in arrears and is calculated at an annual rate of 1.75% of the Operating Company’s gross assets less
(i) the borrowings under the SLF Credit Facility and (ii) cash and cash equivalents. The base management fee is calculated based on the average value of the Operating Company’s gross assets, borrowings under the SLF Credit Facility,
and the cash and cash equivalents at the end of each of the two most recently completed calendar quarters, and appropriately adjusted on a pro rata basis for any equity capital raises or repurchases during the current calendar quarter. The incentive
fee consists of two parts. The first part is calculated and payable quarterly in arrears and equals 20.0% of the Operating Company’s “Pre-Incentive Fee Adjusted Net Investment Income” for the immediately preceding quarter, subject to
a “preferred return”, or “hurdle”, and a “catch-up” feature. The second part will be determined and payable in arrears as of the end of each calendar year (or upon termination of the Investment Management Agreement) and
will equal 20.0% of the Operating Company’s “Adjusted Realized Capital Gains”, if any, on a cumulative basis from inception through the end of the year, computed net of all “Adjusted Realized Capital Losses” and
“Adjusted Unrealized Capital Depreciation” on a cumulative basis, less the aggregate amount of any previously paid capital gain incentive fee. See “Investment Management Agreement”. |
| Administrator |
The Administrator serves as the administrator for us and arranges office space for us and provides us with office equipment and administrative services. The Administrator performs, or oversees the
performance of, our financial records, prepares reports to our stockholders/unit holders and reports filed by us with the SEC, monitors the payment of our expenses, and oversees the performance of administrative and professional services rendered to
us by others. The Operating Company reimburses the Administrator for the New Mountain Finance Entities’ allocable portion of overhead and other expenses incurred by the Administrator in performing its obligations to the New Mountain Finance
Entities under an administration agreement, as amended and restated (the “Administration Agreement”). See “Administration Agreement”. |
| Distributions |
NMFC intends to pay quarterly distributions to its stockholders out of assets legally available for distribution. The quarterly distributions, if any, will be determined by NMFC’s board of
|
12
| |
directors. The distributions NMFC pays to its stockholders in a year may exceed its taxable income for that year and, accordingly, a portion of such distributions may constitute a return of
capital for federal income tax purposes. The specific tax characteristics of NMFC’s distributions will be reported to stockholders after the end of the calendar year. The Operating Company intends to make distributions to its members that will
be sufficient to enable NMFC to pay quarterly distributions to its stockholders. See “Distributions”. |
| Taxation of NMFC |
NMFC intends to elect to be treated, and intends to comply with the requirements to qualify annually thereafter, as a RIC under Subchapter M of the Code, commencing with its taxable year ending on
December 31, 2011. As a RIC, NMFC generally will not pay corporate-level federal income taxes on any net ordinary income or capital gains that it timely distributes to its stockholders as dividends. To obtain and maintain its RIC status, NMFC must
meet specified source-of-income and asset diversification requirements and distribute annually to its stockholders at least 90.0% of its net ordinary income and realized net short-term capital gains in excess of realized net long-term capital
losses, if any. The Operating Company intends to make distributions to its members that will be sufficient to enable NMFC to obtain and maintain its status as a RIC. See “Distributions” and “Material Federal Income Tax
Considerations”. |
| Taxation of Operating Company |
The Operating Company intends to be treated as a partnership for federal income tax purposes for as long as it has at least two members. As a result, the Operating Company will itself not be subject to
federal income tax. Rather, each of the Operating Company’s unit holders, including NMFC, will be required to take into account, for federal income tax purposes, its allocable share of the Operating Company’s items of income, gain, loss,
deduction and credit. NMF SLF expects to be treated as a disregarded entity for federal income tax purposes. As a result, NMF SLF will itself not be subject to federal income tax and, for federal income tax purposes, the Operating Company will take
into account all of NMF SLF’s assets and items of income, gain, loss, deduction and credit. See “Material Federal Income Tax Considerations”. |
| Dividend Reinvestment Plan |
NMFC has adopted an “opt out” dividend reinvestment plan for its stockholders. As a result, if NMFC declares a distribution, then your cash distributions will be automatically reinvested in
additional shares of NMFC’s common stock, unless you specifically “opt out” of the dividend reinvestment plan so as to receive cash distributions. Stockholders who receive distributions in the form of stock will be subject to the same
federal income tax consequences as stockholders who elect to receive their distributions in cash. Cash distributions reinvested in additional shares of NMFC’s common stock will be automatically reinvested
|
13
| |
by NMFC in additional units of the Operating Company. NMFC will use only newly issued shares to implement the plan if the price at which newly issued shares are to be credited is equal to or
greater than 110.0% of the last determined net asset value of the shares. NMFC reserves the right to purchase shares of its common stock in the open market in connection with its implementation of the plan if the price at which its newly issued
shares are to be credited does not exceed 110.0% of the last determined net asset value of the shares. See “Dividend Reinvestment Plan”. |
| Trading at a Discount |
Shares of closed-end investment companies frequently trade at a discount to their net asset value. The possibility that NMFC’s common stock may trade at a discount to its net asset value per share is
separate and distinct from the risk that its net asset value per share may decline. We cannot predict whether NMFC’s common stock will trade above, at or below net asset value. |
| License Agreement |
The New Mountain Finance Entities have entered into a royalty-free license agreement with New Mountain Capital, pursuant to which New Mountain Capital has agreed to grant the New Mountain Finance Entities
a non-exclusive license to use the names “New Mountain” and “New Mountain Finance”. See “License Agreement”. |
| Leverage |
We expect to continue to use leverage to make investments. As a result, we may continue to be exposed to the risks of leverage, which include that leverage may be considered a speculative investment
technique. The use of leverage magnifies the potential for gain and loss on amounts we invest and therefore, indirectly, increases the risks associated with investing in shares of NMFC’s common stock. See “Risk Factors”.
|
| Anti-Takeover Provisions |
The New Mountain Finance Entities’ respective boards of directors are divided into three classes of directors serving staggered three-year terms. This structure is intended to provide us with a
greater likelihood of continuity of management, which may be necessary for us to realize the full value of our investments. A staggered board of directors also may serve to deter hostile takeovers or proxy contests, as may certain other measures
that we may adopt. These measures may delay, defer or prevent a transaction or a change in control that might otherwise be in the best interests of NMFC stockholders. See “Description of NMFC’s Capital Stock—Delaware Law and Certain
Certificate of Incorporation and Bylaw Provisions; Anti-Takeover Measures”. |
| Available Information |
We have filed with the SEC a registration statement on Form N-2 together with all amendments and related exhibits under the Securities Act. The registration statement contains additional information
about us and the shares of common stock being offered by this prospectus. |
14
| |
We are required to file annual, quarterly and current reports, proxy statements and other information with the SEC under the Securities Exchange Act of 1934, as amended (the
“Exchange Act”). This information is available at the SEC’s public reference room at 100 F Street, NE, Washington, District of Columbia 20549 and on the SEC’s website at http://www.sec.gov. The public may obtain
information on the operation of the SEC’s public reference room by calling the SEC at 1-800-SEC-0330. This information is also available free of charge by contacting us at New Mountain Finance Corporation, 787 Seventh Avenue,
48th Floor, New York, New York 10019, by telephone at (212) 720-0300, or on our website at http://www.newmountainfinance.com. Information contained on our website or on the SEC’s web site about us is not incorporated into
this prospectus and you should not consider information contained on our website or on the SEC’s website to be part of this prospectus. |
15
FEES AND EXPENSES
The following table is intended to assist you in understanding the costs and expenses that you will bear directly or indirectly. We caution you
that some of the percentages indicated in the table below are estimates and may vary. Except where the context suggests otherwise, whenever this prospectus contains a reference to fees or expenses paid by “you”, “NMFC”, the
“Operating Company”, or “us” or that “we”, “NMFC”, or the “Operating Company” will pay fees or expenses, stockholders will indirectly bear such fees or expenses through NMFC’s investment in the
Operating Company.
|
|
|
|
|
| Stockholder transaction expenses: |
|
|
|
|
| Sales load (as a percentage of offering price) |
|
|
N/A |
(1) |
| Offering expenses borne by us (as a percentage of offering price) |
|
|
N/A |
(2) |
| Dividend reinvestment plan fees |
|
|
N/A |
(3) |
|
|
|
|
|
| Total stockholder transaction expenses (as a percentage of offering price) |
|
|
— |
% |
|
|
| Annual expenses (as a percentage of net assets attributable to common stock): |
|
|
|
|
| Base management fees |
|
|
2.3 |
%(4) |
| Incentive fees payable under the Investment Management Agreement |
|
|
3.1 |
%(5) |
| Interest payments on borrowed funds |
|
|
1.9 |
%(6) |
| Other expenses |
|
|
1.2 |
%(7) |
|
|
|
|
|
| Total annual expenses |
|
|
8.5 |
%(8) |
Example
The following example, required by the SEC, demonstrates the projected dollar amount of total cumulative expenses that would be incurred over various periods with respect to a hypothetical investment in NMFC’s
common stock. In calculating the following expense amounts, we have assumed that our borrowings and annual operating expenses would remain at the levels set forth in the table above. In the event that shares to which this prospectus relates are sold
to or through underwriters, a corresponding prospectus supplement will restate this example to reflect the applicable sales load and offering expenses.
|
|
|
|
|
|
|
|
|
|
|
|
|
|
|
|
|
| |
|
1 Year |
|
|
3 Years |
|
|
5 Years |
|
|
10 Years |
|
| You would pay the following expenses on a $1,000
investment, assuming a 5.0% annual return |
|
$ |
55 |
|
|
$ |
163 |
|
|
$ |
269 |
|
|
$ |
529 |
|
The example and the expenses in the tables above should not be considered a representation of future expenses,
and actual expenses may be greater or less than those shown.
While the example assumes, as required by the applicable rules of the
SEC, a 5.0% annual return, our performance will vary and may result in a return greater or less than 5.0%. The incentive fee under the Investment Management Agreement, which, assuming a 5.0% annual return, would either not be payable or would have
an insignificant impact on the expense amounts shown above, is not included in the above example. The above illustration assumes that we will not realize any capital gains (computed net of all realized capital losses and unrealized capital
depreciation) in any of the indicated time periods. If we achieve sufficient returns on our investments, including through the realization of capital gains, to trigger an incentive fee of a material amount, our expenses and returns to our investors
would be higher. For example, if we assumed that we received our 5.0% annual return completely in the form of net realized capital gains on our investments, computed net of all cumulative unrealized depreciation on our investments, the projected
dollar amount of total cumulative expenses set forth in the above illustration would be as follows:
|
|
|
|
|
|
|
|
|
|
|
|
|
|
|
|
|
| |
|
1 Year |
|
|
3 Years |
|
|
5 Years |
|
|
10 Years |
|
| You would pay the following expenses on a $1,000 investment, assuming a 5.0% annual return |
|
$ |
64 |
|
|
$ |
189 |
|
|
$ |
310 |
|
|
$ |
594 |
|
16
The example assumes no sales load. In addition, while the examples assume reinvestment of all
distributions at net asset value, participants in NMFC’s dividend reinvestment plan will receive a number of shares of NMFC’s common stock determined by dividing the total dollar amount of the distribution payable to a participant by the
market price per share of NMFC’s common stock at the close of trading on the dividend payment date. The market price per share of NMFC’s common stock may be at, above or below net asset value. See “Dividend Reinvestment Plan” for
additional information regarding the dividend reinvestment plan.
| (1) |
In the event that the shares to which this prospectus relates are sold to or through underwriters, a corresponding prospectus supplement will disclose the applicable sales load.
|
| (2) |
The prospectus supplement corresponding to each offering, including each underwritten offering by any of the selling stockholders identified under “Selling
Stockholders”, will disclose the applicable estimated amount of offering expenses, the offering price and the offering expenses borne by us as a percentage of the offering price. |
| (3) |
The de minimus expenses of the dividend reinvestment plan are included in “other expenses”. |
| (4) |
The base management fee under the Investment Management Agreement is based on an annual rate of 1.75% of the Operating Company’s average gross assets less (i) the
average borrowings under the SLF Credit Facility and (ii) average cash and cash equivalents for the two most recent quarters. The base management fees reflected in the table above is based on the three months ended March 31, 2012. See
“Investment Management Agreement”. |
| (5) |
Assumes that annual incentive fees earned by the Investment Adviser remain consistent with the incentive fees earned by the Investment Adviser during the three months ended March
31, 2012 and includes accrued capital gains incentive fee. These accrued capital gains incentive fees would be paid by the Operating Company if the Operating Company ceased operations on March 31, 2012 and liquidated its investments at the March 31,
2012 valuation. As we cannot predict whether the Operating Company will meet the thresholds for incentive fees under the Investment Management Agreement, the incentive fees paid in subsequent periods, if any, may be substantially different than the
fees incurred during the three months ended March 31, 2012. For more detailed information about the incentive fee calculations, see the “Investment Management Agreement” section of this prospectus. |
| (6) |
We may borrow funds from time to time to make investments to the extent we determine that additional capital would allow us to take advantage of additional investment
opportunities or if the economic situation is otherwise conducive to doing so. The costs associated with these borrowings are indirectly borne by NMFC’s stockholders through its investment in the Operating Company. As of March 31, 2012, the
Operating Company had $151.9 million and $175.0 million of indebtedness outstanding under the Holdings Credit Facility and the SLF Credit Facility, respectively. For purposes of this calculation, we have assumed the March 31, 2012 amounts
outstanding under these credit facilities, and have computed interest expense using an assumed interest rate of 3.0% for the Holdings Credit Facility and 2.2% for the SLF Credit Facility. These interest rates assume the rates payable as of March 31,
2012, adjusted downward by 0.25% per amendments to the Credit Facilities executed on May 8, 2012. See “Senior Securities”. |
| (7) |
“Other expenses” include the New Mountain Finance Entities’ overhead expenses, including payments by the Operating Company under the Administration Agreement based
on the allocable portion of overhead and other expenses incurred by the Administrator in performing its obligations to the New Mountain Finance Entities under the Administration Agreement. Pursuant to the Administration Agreement, and further
restricted by the Operating Company, expenses payable to the Administrator by the Operating Company as well as other direct and indirect expenses (excluding interest and other credit facility expenses and management and incentive fees) have been
capped at $3.5 million for the time period from April 1, 2012 to March 31, 2013. This expense ratio does not include the expense cap of $3.5 million. Assuming assumes $3.5 million of annual expense, the expense ratio would be 0.8%. See
“Administration Agreement”. |
| (8) |
The holders of shares of NMFC’s common stock indirectly bear the cost associated with our annual expenses through NMFC’s investment in the Operating Company.
|
17
SELECTED FINANCIAL AND OTHER DATA
The selected financial data should be read in conjunction with the respective financial statements and related combined notes thereto and
“Management’s Discussion and Analysis of Financial Condition and Results of Operations” included in this prospectus. Financial information for the years ended December 31, 2011, December 31, 2010, December 31, 2009 and
for the period October 29, 2008 (commencement of operations) to December 31, 2008 has been derived from our financial statements that were audited by Deloitte & Touche, LLP, an independent registered public accounting firm. The financial
information at and for the three months ended March 31, 2012 was derived from our unaudited financial statements and related notes. In the opinion of management, all adjustments, consisting solely of normal recurring accruals, considered
necessary for the fair presentation of financial statements for the interim periods, have been included. Our results for the interim period may not be indicative of our results for the full year. See “Management’s Discussion and Analysis
of Financial Condition and Results of Operations” and “Senior Securities” below for more information.
(in thousands except shares and
per share data)
|
|
|
|
|
|
|
|
|
|
|
|
|
|
|
|
|
|
|
|
|
| |
|
Three months ended
March
31, 2012
(unaudited) |
|
|
Year ended December 31, |
|
|
Period
from
October 29, 2008
(commencement of
operations) to
December 31,
2008 |
|
| |
|
2011 |
|
|
2010 |
|
|
2009 |
|
|
| New Mountain Finance Holdings, L.L.C.
Statement of Operations Data: |
|
|
|
|
|
|
|
|
|
|
|
|
|
|
|
|
|
|
|
|
| Total investment income |
|
$ |
19,022 |
|
|
$ |
56,523 |
|
|
$ |
41,375 |
|
|
$ |
21,767 |
|
|
$ |
256 |
|
| Net expenses |
|
|
9,109 |
|
|
|
17,998 |
|
|
|
3,911 |
|
|
|
1,359 |
|
|
|
— |
|
| Net investment income |
|
|
9,913 |
|
|
|
38,525 |
|
|
|
37,464 |
|
|
|
20,408 |
|
|
|
256 |
|
| Net realized and unrealized gains (losses) |
|
|
13,754 |
|
|
|
(6,848 |
) |
|
|
26,328 |
|
|
|
105,272 |
|
|
|
(1,435 |
) |
| Net increase (decrease) in net assets resulting from operations |
|
|
23,667 |
|
|
|
31,677 |
|
|
|
63,792 |
|
|
|
125,680 |
|
|
|
(1,179 |
) |
|
|
|
|
|
|
| Per share data: |
|
|
|
|
|
|
|
|
|
|
|
|
|
|
|
|
|
|
|
|
| Net asset value |
|
$ |
14.05 |
|
|
$ |
13.60 |
|
|
|
N/A |
|
|
|
N/A |
|
|
|
N/A |
|
| Net increase (decrease) in net assets resulting from operations (basic and diluted) |
|
|
0.77 |
|
|
|
1.02 |
|
|
|
N/A |
|
|
|
N/A |
|
|
|
N/A |
|
| Dividends paid(3) |
|
|
0.32 |
|
|
|
0.86 |
|
|
|
N/A |
|
|
|
N/A |
|
|
|
N/A |
|
|
|
|
|
|
|
| Balance sheet data: |
|
|
|
|
|
|
|
|
|
|
|
|
|
|
|
|
|
|
|
|
| Total assets |
|
$ |
788,617 |
|
|
$ |
730,579 |
|
|
$ |
460,224 |
|
|
$ |
330,558 |
|
|
$ |
61,669 |
|
| SLF Credit Facility |
|
|
175,000 |
|
|
|
165,928 |
|
|
|
56,936 |
|
|
|
— |
|
|
|
— |
|
| Holdings Credit Facility |
|
|
151,923 |
|
|
|
129,038 |
|
|
|
59,697 |
|
|
|
77,745 |
|
|
|
— |
|
| Total net assets |
|
|
434,274 |
|
|
|
420,502 |
|
|
|
241,927 |
|
|
|
239,441 |
|
|
|
30,354 |
|
|
|
|
|
|
|
| Other data: |
|
|
|
|
|
|
|
|
|
|
|
|
|
|
|
|
|
|
|
|
| Total return at net asset value(1) |
|
|
5.63 |
% |
|
|
10.09 |
% |
|
|
26.54 |
% |
|
|
76.38 |
% |
|
|
NM |
|
| Number of portfolio companies at period end (unaudited) |
|
|
57 |
|
|
|
55 |
|
|
|
43 |
|
|
|
24 |
|
|
|
6 |
|
| Total new investments for the period |
|
$ |
106,680 |
|
|
$ |
493,331 |
|
|
$ |
332,708 |
|
|
$ |
268,382 |
|
|
$ |
63,018 |
|
| Investment sales and prepayments for the period |
|
|
71,673 |
|
|
|
231,962 |
|
|
|
258,202 |
|
|
|
125,430 |
|
|
|
132 |
|
| Weighted average Adjusted Yield to Maturity on debt portfolio at period end (2) (unaudited) |
|
|
12.8 |
% |
|
|
13.1 |
% |
|
|
12.5 |
% |
|
|
12.7 |
% |
|
|
18.8 |
% |
| Weighted average shares outstanding at period end |
|
|
30,919,629 |
|
|
|
30,919,629 |
|
|
|
N/A |
|
|
|
N/A |
|
|
|
N/A |
|
| Portfolio turnover |
|
|
9.81 |
% |
|
|
42.13 |
% |
|
|
76.69 |
% |
|
|
57.50 |
% |
|
|
0.22 |
% |
N/A—Fund was
not unitized as of December 31, 2010, December 31, 2009 and December 31, 2008.
18
NM—Total return from commencement of operations through December 31, 2008 was deemed not meaningful due to the
scaling of operations during this short time period.
| (1) |
For the three months ended March 31, 2012, total return is calculated assuming a purchase at net asset value on the opening of the first day of the year and a sale at net asset
value on the last day of the period. For the year ended December 31, 2011, total return is calculated in two parts: (1) from the opening of the first day of the year to NMFC’s IPO date, total return was calculated based on net income over
weighted average net assets and (2) from NMFC’s IPO date to the last day of the year, total return was calculated assuming a purchase at net asset value on NMFC’s IPO date and a sale at net asset value on the last day of the year.
Dividends and distributions, if any, are assumed for purposes of this calculation, to be reinvested at net asset value on the last day of the respective periods. For the years ended December 31, 2010 and December 31, 2009, total return is
calculated based on an internal rate of return. |
| (2) |
The Operating Company’s weighted average Unadjusted Yield to Maturity was 10.6% and 10.7% for the three months ended March 31, 2012 and the year ended December 31, 2011,
respectively. |
| (3) |
Actual cash payment on the dividends declared for the quarter ended March 31, 2012, was made on April 4, 2012, to AIV Holdings only. |
|
|
|
|
|
|
|
|
|
| (in thousands except shares and per share data) |
|
|
|
|
|
|
New Mountain Finance Corporation
Statement of Operations Data: |
|
Three months ended
March 31, 2012
(unaudited) |
|
|
Period from
May 19, 2011
(commencement
of operations) to
December 31,
2011 |
|
| Total investment income allocated from the Operating Company |
|
$ |
6,581 |
|
|
$ |
13,669 |
|
| Net expenses allocated from the Operating Company |
|
|
3,151 |
|
|
|
5,324 |
|
| Net investment income allocated from the Operating Company |
|
|
3,430 |
|
|
|
8,345 |
|
| Net realized and unrealized gains (losses) allocated from the Operating Company |
|
|
4,758 |
|
|
|
(4,235 |
) |
| Unrealized appreciation in the Operating Company resulting from public offering price |
|
|
— |
|
|
|
6,221 |
|
| Net increase (decrease) in net assets resulting from operations |
|
|
8,188 |
|
|
|
10,331 |
|
|
|
|
| Per share data: |
|
|
|
|
|
|
|
|
| Net asset value |
|
$ |
14.05 |
|
|
$ |
13.60 |
|
| Net increase (decrease) in net assets resulting from operations (basic) |
|
|
0.77 |
|
|
|
0.97 |
|
| Net increase (decrease) in net assets resulting from operations (diluted) |
|
|
0.77 |
|
|
|
0.38 |
|
| Dividends paid |
|
|
0.32 |
|
|
|
0.86 |
|
|
|
|
| Balance sheet data: |
|
|
|
|
|
|
|
|
| Total assets |
|
$ |
150,252 |
|
|
$ |
145,487 |
|
| Total net assets |
|
|
150,252 |
|
|
|
145,487 |
|
|
|
|
| Other data: |
|
|
|
|
|
|
|
|
| Total return at market value(1) |
|
|
4.85 |
% |
|
|
4.16 |
% |
| Total return at net asset value(2) |
|
|
5.63 |
% |
|
|
2.82 |
% |
| Weighted average shares outstanding at year end |
|
|
10,697,691 |
|
|
|
10,697,691 |
|
| (1) |
For the three months ended March 31, 2012, total return is calculated assuming a purchase of common stock on the opening of the first day of the year and a sale on the closing of
the last business day of the period. For the period ended December 31, 2011, total return was calculated assuming a purchase of common stock at IPO and a sale on the closing of the last business day of the period. Dividends and distributions, if
any, are assumed for purposes of this calculation, to be reinvested at prices obtained under NMFC’s dividend reinvestment plan. |
| (2) |
For the three months ended March 31, 2012, total return is calculated assuming a purchase at net asset value on the opening of the first day of the year and a sale at net asset
value on the last business day of the period. For the period ended December 31, 2011, total return was calculated assuming a purchase at net asset value on the opening of the first day of the period and a sale at net asset value on the last day of
the period. Dividends and distributions, if any, are assumed for purposes of this calculation, to be reinvested at the net asset value on the last day of the respective quarter. |
19
SELECTED QUARTERLY FINANCIAL DATA
The following table sets forth certain quarterly financial data for the quarter ended March 31, 2012 and for each of the quarters
for the fiscal years ended December 31, 2011, December 31, 2010 and December 31, 2009 of the Operating Company and for the quarter ended March 31, 2012 and for each of the quarters from May 19, 2011 (commencement of
operations) through December 31, 2011 of NMFC. This data is derived from our unaudited financial statements. Results for any quarter are not necessarily indicative of results for the full year or for any future quarter.
The below selected quarterly financial data is for the Operating Company.
|
|
|
|
|
|
|
|
|
|
|
|
|
|
|
|
|
|
|
|
|
|
|
|
|
|
|
|
|
|
|
|
|
| (in thousands except for per unit data) |
|
|
|
|
|
|
|
|
|
|
|
|
|
|
|
|
|
|
|
|
|
|
| |
|
Investment Income |
|
|
Net Investment
Income |
|
|
Total Net Realized
Gains
and
Net Changes
in Unrealized
Appreciation
(Depreciation) of
Investments |
|
|
Net Increase
(Decrease) in
Capital Resulting
from Operations |
|
| Quarter Ended |
|
Total |
|
|
Per
Unit |
|
|
Total |
|
|
Per
Unit |
|
|
Total |
|
|
Per
Unit |
|
|
Total |
|
|
Per
Unit |
|
| March 31, 2012 |
|
$ |
19,022 |
|
|
$ |
0.62 |
|
|
$ |
9,913 |
|
|
$ |
0.32 |
|
|
$ |
13,754 |
|
|
$ |
0.45 |
|
|
$ |
23,667 |
|
|
$ |
0.77 |
|
|
|
|
|
|
|
|
|
|
| December 31, 2011 |
|
$ |
17,127 |
|
|
$ |
0.55 |
|
|
$ |
9,540 |
|
|
$ |
0.31 |
|
|
$ |
8,317 |
|
|
$ |
0.27 |
|
|
$ |
17,857 |
|
|
$ |
0.58 |
|
| September 30, 2011 |
|
|
15,069 |
|
|
|
0.49 |
|
|
|
10,002 |
|
|
|
0.32 |
|
|
|
(21,255 |
) |
|
|
(0.68 |
) |
|
|
(11,253 |
) |
|
|
(0.36 |
) |
| June 30, 2011 |
|
|
13,116 |
|
|
|
0.42 |
|
|
|
9,554 |
|
|
|
0.31 |
|
|
|
(899 |
) |
|
|
(0.03 |
) |
|
|
8,655 |
|
|
|
0.28 |
|
| March 31, 2011 |
|
|
11,212 |
|
|
|
N/A |
|
|
|
9,429 |
|
|
|
N/A |
|
|
|
6,990 |
|
|
|
N/A |
|
|
|
16,419 |
|
|
|
N/A |
|
|
|
|
|
|
|
|
|
|
| December 31, 2010 |
|
$ |
9,820 |
|
|
|
N/A |
|
|
$ |
8,335 |
|
|
|
N/A |
|
|
$ |
7,978 |
|
|
|
N/A |
|
|
$ |
16,313 |
|
|
|
N/A |
|
| September 30, 2010 |
|
|
13,881 |
|
|
|
N/A |
|
|
|
13,145 |
|
|
|
N/A |
|
|
|
5,560 |
|
|
|
N/A |
|
|
|
18,705 |
|
|
|
N/A |
|
| June 30, 2010 |
|
|
8,597 |
|
|
|
N/A |
|
|
|
7,777 |
|
|
|
N/A |
|
|
|
(5,349 |
) |
|
|
N/A |
|
|
|
2,428 |
|
|
|
N/A |
|
| March 31, 2010 |
|
|
9,077 |
|
|
|
N/A |
|
|
|
8,208 |
|
|
|
N/A |
|
|
|
18,138 |
|
|
|
N/A |
|
|
|
26,346 |
|
|
|
N/A |
|
|
|
|
|
|
|
|
|
|
| December 31, 2009 |
|
$ |
7,617 |
|
|
|
N/A |
|
|
$ |
6,617 |
|
|
|
N/A |
|
|
$ |
1,617 |
|
|
|
N/A |
|
|
$ |
8,234 |
|
|
|
N/A |
|
| September 30, 2009 |
|
|
6,148 |
|
|
|
N/A |
|
|
|
6,030 |
|
|
|
N/A |
|
|
|
33,709 |
|
|
|
N/A |
|
|
|
39,739 |
|
|
|
N/A |
|
| June 30, 2009 |
|
|
5,092 |
|
|
|
N/A |
|
|
|
4,877 |
|
|
|
N/A |
|
|
|
42,562 |
|
|
|
N/A |
|
|
|
47,439 |
|
|
|
N/A |
|
| March 31, 2009 |
|
|
2,910 |
|
|
|
N/A |
|
|
|
2,883 |
|
|
|
N/A |
|
|
|
27,385 |
|
|
|
N/A |
|
|
|
30,268 |
|
|
|
N/A |
|
N/A—Not
applicable, as the Operating Company was not unitized until May 19, 2011.
The below selected quarterly financial data is for NMFC.
|
|
|
|
|
|
|
|
|
|
|
|
|
|
|
|
|
|
|
|
|
|
|
|
|
| (in thousands except for per share data) |
|
|
|
|
|
|
|
|
|
|
|
|
|
|
|
|
| |
|
Net Investment
Income allocated
from the Operating
Company |
|
|
Total Net
Realized and Unrealized
Gains
(Losses) |
|
|
Net Increase
(Decrease) in Net
Assets
Resulting from Operations |
|
| Quarter Ended |
|
Total |
|
|
Per Share |
|
|
Total |
|
|
Per Share |
|
|
Total |
|
|
Per Share |
|
| March 31, 2012 |
|
$ |
3,430 |
|
|
$ |
0.32 |
|
|
$ |
4,758 |
|
|
$ |
0.45 |
|
|
$ |
8,188 |
|
|
$ |
0.77 |
|
|
|
|
|
|
|
|
| December 31, 2011 |
|
$ |
3,301 |
|
|
$ |
0.31 |
|
|
$ |
2,877 |
|
|
$ |
0.27 |
|
|
$ |
6,178 |
|
|
$ |
0.58 |
|
| September 30, 2011 |
|
|
3,460 |
|
|
|
0.32 |
|
|
|
(7,353 |
) |
|
|
(0.69 |
) |
|
|
(3,893 |
) |
|
|
(0.36 |
) |
| June 30, 2011 |
|
|
1,584 |
|
|
|
0.15 |
|
|
|
6,462 |
|
|
|
0.60 |
|
|
|
8,046 |
|
|
|
0.75 |
|
| March 31, 2011 |
|
|
N/A |
|
|
|
N/A |
|
|
|
N/A |
|
|
|
N/A |
|
|
|
N/A |
|
|
|
N/A |
|
N/A—Not
applicable, as NMFC did not commence operations until May 19, 2011.
20
RISK FACTORS
Investing in NMFC’s common stock involves a number of significant risks. In addition to the other information contained in this prospectus
and any accompanying prospectus supplement, you should consider carefully the following information before making an investment in NMFC’s common stock. The risks set out below are not the only risks we face. Additional risks and uncertainties
not presently known to us or not presently deemed material by us might also impair our operations and performance. If any of the following events occur, our business, financial condition and results of operations could be materially and adversely
affected. In such case, our net asset value and the trading price of NMFC’s common stock could decline, and you may lose all or part of your investment.
RISKS IN THE CURRENT ECONOMIC ENVIRONMENT
The downgrade of the U.S. credit rating and the economic
crisis in Europe could negatively impact the Operating Company’s liquidity, financial condition and earnings, thus affecting the financial condition and earnings of NMFC.
The U.S. debt ceiling and budget deficit concerns, together with signs of deteriorating sovereign debt conditions in Europe, have increased the
possibility of additional credit-rating downgrades and economic slowdowns. Although U.S. lawmakers passed legislation to raise the federal debt ceiling, Standard & Poor’s Ratings Services lowered its long-term sovereign credit rating
on the U.S. from “AAA” to “AA+” in August 2011. The impact of this or any further downgrades to the U.S. government’s sovereign credit rating, or its perceived creditworthiness, and the impact of the current crisis in
Europe with respect to the ability of certain European Union countries to continue to service their sovereign debt obligations is inherently unpredictable and could adversely affect the U.S. and global financial markets and economic conditions.
There can be no assurance that governmental or other measures to aid economic recovery will be effective. These developments, and the government’s credit concerns in general, could cause interest rates and borrowing costs to rise, which may
negatively impact both the perception of credit risk associated with the Operating Company’s debt portfolio and its ability to access the debt markets on favorable terms. In addition, the decreased credit rating could create broader financial
turmoil and uncertainty, which may weigh heavily on NMFC’s stock price. Continued adverse economic conditions could have a material adverse effect on the New Mountain Finance Entities’ business, financial condition and results of
operations.
RISKS RELATED TO OUR BUSINESS AND STRUCTURE
We have a limited operating history.
NMFC is a newly-formed entity while the Operating
Company commenced operations in October 2008, owning all of the operations, including all of the assets and liabilities, of the Predecessor Entities. NMFC is a holding company with no direct operations of its own, and its only business and sole
asset is its ownership of units of the Operating Company. As a result, we are subject to many of the business risks and uncertainties associated with any new business, including the risk that we may not achieve the Operating Company’s
investment objective and that, as a result, the value of NMFC’s common stock and the Operating Company’s units could decline substantially.
The Operating Company may suffer credit losses.
Investments in small and middle market businesses are highly speculative and involve a high degree of risk of credit loss. These risks are likely to increase during volatile economic periods, such as the U.S. and
many other economies have recently been experiencing.
21
The Operating Company does not expect to replicate the Predecessor Entities’ historical performance or the
historical performance of other entities managed or supported by the New Mountain Capital.
The Operating Company does not expect
to replicate the Predecessor Entities’ historical performance or the historical performance of New Mountain Capital’s investments. The Operating Company’s investment returns may be substantially lower than the returns achieved by the
Predecessor Entities. Although the Predecessor Entities commenced operations during otherwise unfavorable economic conditions, this was a favorable environment in which the Operating Company could conduct its business in light of its investment
objectives and strategy. In addition, the Operating Company’s investment strategies may differ from those of New Mountain Capital or its affiliates. The New Mountain Finance Entities, as BDCs, and NMFC as a RIC, are subject to certain
regulatory restrictions that do not apply to New Mountain Capital or its affiliates.
The Operating Company is generally not permitted
to invest in any portfolio company in which New Mountain Capital or any of its affiliates currently have an investment or to make any co-investments with New Mountain Capital or its affiliates, except to the extent permitted by the 1940 Act. This
may adversely affect the pace at which the Operating Company makes investments. Moreover, the Operating Company may operate with a different leverage profile than the Predecessor Entities. Furthermore, none of the prior results from the Predecessor
Entities were from public reporting companies, and all or a portion of these results were achieved in particularly favorable market conditions for the Operating Company’s investment strategy which may never be repeated. Finally, we can offer no
assurance that the Operating Company’s investment team will be able to continue to implement its investment objective with the same degree of success as it has had in the past.
There is uncertainty as to the value of the Operating Company’s portfolio investments because most of its investments are, and may continue to be in private companies and recorded at fair value. In
addition, because NMFC is a holding company, the fair values of the Operating Company’s investments are determined by the Operating Company’s board of directors in accordance with the Operating Company’s valuation policy.
Some of the Operating Company’s investments are and may be in the form of securities or loans that are not publicly traded.
The fair value of these investments may not be readily determinable. Under the 1940 Act, the Operating Company is required to carry its portfolio investments at market value or, if there is no readily available market value, at fair value as
determined in good faith by its board of directors, including to reflect significant events affecting the value of its securities. The Operating Company values its investments for which it does not have readily available market quotations quarterly,
or more frequently as circumstances require, at fair value as determined in good faith by its board of directors in accordance with its valuation policy, which is at all times consistent with GAAP.
The Operating Company’s board of directors utilizes the services of one or more independent third-party valuation firms to aid it in
determining the fair value with respect to its material unquoted assets in accordance with its valuation policy. The inputs into the determination of fair value of these investments may require significant management judgment or estimation. Even if
observable market data is available, such information may be the result of consensus pricing information or broker quotes, which include a disclaimer that the broker would not be held to such a price in an actual transaction. The non-binding nature
of consensus pricing and/or quotes accompanied by disclaimers materially reduces the reliability of such information.
The types of
factors that the board of directors takes into account in determining the fair value of its investments generally include, as appropriate: available market data, including relevant and applicable market trading and transaction comparables,
applicable market yields and multiples, security covenants, call protection provisions, information rights, the nature and realizable value of any
22
collateral, the portfolio company’s ability to make payments, its earnings and discounted cash flows and the markets in which it does business, comparisons of financial ratios of peer
companies that are public, comparable merger and acquisition transactions and the principal market and enterprise values. Since these valuations, and particularly valuations of private securities and private companies, are inherently uncertain, may
fluctuate over short periods of time and may be based on estimates, the Operating Company’s determinations of fair value may differ materially from the values that would have been used if a ready market for these securities existed.
Due to this uncertainty, the Operating Company’s fair value determinations may cause its net asset value and, consequently, NMFC’s net
asset value, on any given date, to materially understate or overstate the value that the Operating Company may ultimately realize upon the sale of one or more of our investments. In addition, investors purchasing NMFC’s common stock based on an
overstated net asset value would pay a higher price than the realizable value of our investments might warrant. Since NMFC is a holding company and its only business and sole asset is its ownership of units of the Operating Company, NMFC’s net
asset value is based on the Operating Company’s valuation and its percentage interest in the Operating Company.
Although the
Operating Company’s current board of directors is comprised of the same individuals as NMFC’s board of directors, there can be no assurances that the Operating Company’s board composition will remain the same as NMFC. As a result, the
value of your investment in NMFC could be similarly understated or overstated based on the Operating Company’s fair value determinations. However, in the event that NMFC’s board of directors believes that a different fair value for the
Operating Company’s investments is appropriate, NMFC’s board of directors may discuss the differences in the valuations with the Operating Company’s board of directors for the purposes of resolving the differences in valuation. The
valuation procedures of NMFC are substantially similar to those utilized by the Operating Company described above.
The Operating
Company may adjust quarterly the valuation of its portfolio to reflect its board of directors’ determination of the fair value of each investment in its portfolio. Any changes in fair value are recorded in the Operating Company’s statement
of operations as net change in unrealized appreciation or depreciation.
The Operating Company’s ability to achieve its investment objective
depends on key investment personnel of the Investment Adviser. If the Investment Adviser were to lose any of its key investment personnel, the Operating Company’s ability to achieve its investment objective could be significantly harmed.
The Operating Company depends on the investment judgment, skill and relationships of the investment professionals of the
Investment Adviser, particularly Steven B. Klinsky and Robert A. Hamwee, as well as other key personnel to identify, evaluate, negotiate, structure, execute, monitor and service its investments. The Investment Adviser, as an affiliate of New
Mountain Capital, is supported by New Mountain Capital’s team, which as of March 31, 2012 consisted of over 90 staff members, including 58 investment professionals, of New Mountain Capital and its affiliates to fulfill its obligations to the
Operating Company under the Investment Management Agreement. The Investment Adviser may also depend upon New Mountain Capital to obtain access to investment opportunities originated by the professionals of New Mountain Capital and its affiliates.
The Operating Company’s future success depends to a significant extent on the continued service and coordination of the key investment personnel of the Investment Adviser. The departure of any of these individuals could have a material adverse
effect on the Operating Company’s ability to achieve its investment objective.
The Investment Committee, which provides oversight
over the Operating Company’s investment activities, is provided by the Investment Adviser. The Investment Committee currently consists of five
23
members. The loss of any member of the Investment Committee or of other senior professionals of the Investment Adviser and its affiliates without suitable replacement could limit the Operating
Company’s ability to achieve its investment objective and operate as we anticipate. This could have a material adverse effect on our financial condition, results of operation and cash flows. To achieve the Operating Company’s investment
objective, the Investment Adviser may hire, train, supervise and manage new investment professionals to participate in its investment selection and monitoring process. If the Investment Adviser is unable to find investment professionals or do so in
a timely manner, our business, financial condition and results of operations could be adversely affected.
The Investment Adviser has limited
experience managing a BDC or a RIC, which could adversely affect our business.
Other than the New Mountain Finance Entities, the
Investment Adviser has not previously managed a BDC or a RIC. The 1940 Act and the Code impose numerous constraints on the operations of BDCs and RICs that do not apply to the other investment vehicles previously managed by the investment
professionals of the Investment Adviser. For example, under the 1940 Act, BDCs are required to invest at least 70.0% of their total assets primarily in securities of qualifying U.S. private or thinly traded companies, cash, cash equivalents, U.S.
government securities and other high quality debt investments that mature in one year or less. Moreover, qualification for taxation as a RIC under subchapter M of the Code requires satisfaction of source-of-income, asset diversification and
annual distribution requirements. NMFC has no assets other than its ownership of units of the Operating Company and has no material long-term liabilities. As a result, NMFC looks to the Operating Company’s assets and income for purposes of
satisfying the requirements under the 1940 Act applicable to BDCs and the requirements under the Code applicable to RICs. The failure to comply with these provisions in a timely manner could prevent NMFC and the Operating Company from qualifying as
BDCs or NMFC from qualifying as a RIC and could force us to pay unexpected taxes and penalties, which would have a material adverse effect on our performance. The Investment Adviser’s lack of experience in managing a portfolio of assets under
the constraints applicable to BDCs and RICs may hinder its ability to take advantage of attractive investment opportunities and, as a result, achieve the Operating Company’s investment objective. If the Operating Company fails to maintain its
status as a BDC or operate in a manner consistent with NMFC’s status as a RIC, its operating flexibility could be significantly reduced and NMFC may be unable to maintain its status as a BDC or RIC.
The Operating Company operates in a highly competitive market for investment opportunities and may not be able to compete effectively.
The Operating Company competes for investments with other BDCs and investment funds (including private equity and hedge funds), as well as
traditional financial services companies such as commercial banks and other sources of funding. Many of its competitors are substantially larger and have considerably greater financial, technical and marketing resources than it does. For example,
some competitors may have a lower cost of capital and access to funding sources that are not available to the Operating Company. In addition, some of the Operating Company’s competitors may have higher risk tolerances or different risk
assessments than the Operating Company has. Furthermore, many of the Operating Company’s competitors have greater experience operating under, or are not subject to, the regulatory restrictions that the 1940 Act imposes on the New Mountain
Finance Entities as BDCs or the source-of-income, asset diversification and distribution requirements that NMFC must satisfy to obtain and maintain its RIC status. These characteristics could allow the Operating Company’s competitors to
consider a wider variety of investments, establish more relationships and offer better pricing and more flexible structuring than the Operating Company is able to do. There are a number of new BDCs that have recently completed their initial public
offerings or that have filed registration statements with the SEC, which could create increased competition for investment opportunities.
24
The Operating Company may lose investment opportunities if it does not match its competitors’
pricing, terms and structure. With respect to the investments the Operating Company makes, it does not seek to compete based primarily on the interest rates it may offer, and we believe that some of the Operating Company’s competitors may make
loans with interest rates that may be lower than the rates it offers. In the secondary market for acquiring existing loans, we expect the Operating Company to compete generally on the basis of pricing terms. If the Operating Company matches its
competitors’ pricing, terms and structure, it may experience decreased net interest income, lower yields and increased risk of credit loss. If the Operating Company is forced to match its competitors’ pricing, terms and structure, it may
not be able to achieve acceptable returns on its investments or may bear substantial risk of capital loss. Part of the Operating Company’s competitive advantage stems from the fact that we believe the market for middle market lending is
underserved by traditional bank lenders and other financial sources. A significant increase in the number and/or the size of the Operating Company’s competitors in this target market could force it to accept less attractive investment terms.
The Operating Company may also compete for investment opportunities with accounts managed by the Investment Adviser or its affiliates. Although the Investment Adviser allocates opportunities in accordance with its policies and procedures,
allocations to such other accounts reduces the amount and frequency of opportunities available to the Operating Company and may not be in the best interests of the Operating Company and, consequently, NMFC’s stockholders. Moreover, the
performance of investment opportunities is not known at the time of allocation. If the Operating Company is not able to compete effectively, its business, financial condition and results of operations may be adversely affected, thus affecting the
business, financial condition and results of operations of NMFC. Because of this competition, there can be no assurance that the Operating Company will be able to identify and take advantage of attractive investment opportunities that it identifies
or that it will be able to fully invest its available capital.
Our business, results of operations and financial condition depends on the
Operating Company’s ability to manage future growth effectively.
The Operating Company’s ability to achieve its
investment objective and to grow depends on the Investment Adviser’s ability to identify, invest in and monitor companies that meet the Operating Company’s investment criteria. Accomplishing this result on a cost-effective basis is largely
a function of the Investment Adviser’s structuring of the investment process, its ability to provide competent, attentive and efficient services to the Operating Company and its ability to access financing on acceptable terms. The Investment
Adviser has substantial responsibilities under the Investment Management Agreement and may also be called upon to provide managerial assistance to the Operating Company’s portfolio companies. These demands on the time of the Investment Adviser
and its investment professionals may distract them or slow the Operating Company’s rate of investment. In order to grow, the Operating Company and the Investment Adviser may need to retain, train, supervise and manage new investment
professionals. However, these investment professionals may not be able to contribute effectively to the work of the Investment Adviser. If the Operating Company is unable to manage its future growth effectively, our business, results of operations
and financial condition could be materially adversely affected.
The incentive fee may induce the Investment Adviser to make speculative
investments.
The incentive fee payable to the Investment Adviser may create an incentive for the Investment Adviser to pursue
investments that are risky or more speculative than would be the case in the absence of such compensation arrangement, which could result in higher investment losses, particularly during cyclical economic downturns. The incentive fee payable to the
Investment Adviser is calculated based on a percentage of the Operating Company’s return on investment capital. This may encourage the Investment Adviser to use leverage to increase the return on the Operating Company’s investments. In
addition, because the base management fee is payable based upon the Operating
25
Company’s gross assets, which includes any borrowings for investment purposes, but excludes cash and cash equivalents for investment purposes, the Investment Adviser may be further
encouraged to use leverage to make additional investments. Under certain circumstances, the use of leverage may increase the likelihood of default, which would impair the value of NMFC’s units of the Operating Company and, consequently, the
value of NMFC’s common stock.
The incentive fee payable to the Investment Adviser also may create an incentive for the Investment
Adviser to invest in instruments that have a deferred interest feature, even if such deferred payments would not provide the cash necessary for the Operating Company to make distributions to NMFC that enable NMFC to pay current distributions to its
stockholders. Under these investments, the Operating Company would accrue the interest over the life of the investment but would not receive the cash income from the investment until the end of the investment’s term, if at all. The Operating
Company’s net investment income used to calculate the income portion of the incentive fee, however, includes accrued interest. Thus, a portion of the incentive fee would be based on income that the Operating Company has not yet received in cash
and may never receive in cash if the portfolio company is unable to satisfy such interest payment obligations. In addition, the “catch-up” portion of the incentive fee may encourage the Investment Adviser to accelerate or defer interest
payable by portfolio companies from one calendar quarter to another, potentially resulting in fluctuations in timing and dividend amounts.
The
Operating Company may be obligated to pay the Investment Adviser incentive compensation even if the Operating Company incurs a loss.
The Investment Adviser is entitled to incentive compensation for each fiscal quarter in an amount equal to a percentage of the excess of the Operating Company’s Pre-Incentive Fee Adjusted Net Investment Income
for that quarter (before deducting incentive compensation) above a performance threshold for that quarter. Accordingly, since the performance threshold is based on a percentage of the Operating Company’s net asset value, decreases in the
Operating Company’s net asset value makes it easier to achieve the performance threshold. The Operating Company’s Pre-Incentive Fee Adjusted Net Investment Income for incentive compensation purposes excludes realized and unrealized capital
losses or depreciation that it may incur in the fiscal quarter, even if such capital losses or depreciation result in a net loss on the Operating Company’s statement of operations for that quarter. Thus, the Operating Company may be required to
pay the Investment Adviser incentive compensation for a fiscal quarter even if there is a decline in the value of its portfolio or the Operating Company incurs a net loss for that quarter.
The Operating Company borrows money, which could magnify the potential for gain or loss on amounts invested in us and increase the risk of investing in us.
The Operating Company borrows money as part of its business plan. Borrowings, also known as leverage, magnify the potential for gain or loss on
invested equity capital and may, consequently, increase the risk of investing in us. We expect the Operating Company to continue to use leverage to finance its investments, through senior securities issued by banks and other lenders. The Operating
Company is restricted from incurring additional indebtedness under the Credit Facilities, without lender consent. Lenders of these senior securities have fixed dollar claims on the Operating Company’s assets that are superior to NMFC’s
claim as a member of the Operating Company, and, consequently, superior to claims of NMFC’s common stockholders. If the value of the Operating Company’s assets decreases, leveraging would cause its net asset value and, consequently,
NMFC’s net asset value, to decline more sharply than it otherwise would have had it not leveraged. Similarly, any decrease in the Operating Company’s income would cause its net income and consequently NMFC’s net income to decline more
sharply than they would have had it not borrowed. Such a decline could adversely affect the Operating Company’s ability to make distributions to its members and, consequently, NMFC’s
26
ability to make common stock dividend payments. In addition, because the Operating Company’s investments may be illiquid, the Operating Company may be unable to dispose of them or to do so
at a favorable price in the event it needs to do so if it is unable to refinance any indebtedness upon maturity and, as a result, we may suffer losses. Leverage is generally considered a speculative investment technique.
The Operating Company’s ability to service any debt that it incurs depends largely on its financial performance and is subject to prevailing
economic conditions and competitive pressures. Moreover, as the Investment Adviser’s management fee is payable to the Investment Adviser based on gross assets, including those assets acquired through the use of leverage, the Investment Adviser
may have a financial incentive to incur leverage which may not be consistent with NMFC’s interests and the interests of its common stockholders. In addition, holders of NMFC’s common stock will, indirectly, bear the burden of any increase
in the Operating Company’s expenses as a result of leverage, including any increase in the management fee payable to the Investment Adviser.
At March 31, 2012, the Operating Company had $151.9 million and $175.0 million of indebtedness outstanding under the Holdings Credit Facility and the SLF Credit Facility, respectively. The Holdings Credit
Facility had a weighted average interest rate of 3.3% for the three months ended March 31, 2012 and the SLF Credit Facility had a weighted average interest rate of 2.5% for the three months ended March 31, 2012.
Illustration. The following table illustrates the effect of leverage on returns from an investment in NMFC’s
common stock assuming various annual returns, net of expenses and adjusted for unsettled securities purchased. The calculations in the table below are hypothetical. Actual returns may be higher or lower than those appearing below and will also
depend on NMFC’s ownership interest in the Operating Company. The calculation assumes (i) $788.6 million in total assets, (ii) a weighted average cost of borrowings of 2.9%, (iii) $326.9 million in debt outstanding and
(iv) $434.3 million in stockholders’ equity.
Assumed Return on Our Portfolio
(net of expenses)
|
|
|
|
|
|
|
|
|
|
|
|
|
|
|
|
|
|
|
|
|
| |
|
-10.0% |
|
|
-5.0% |
|
|
0% |
|
|
5.0% |
|
|
10.0% |
|
| Corresponding return to stockholder |
|
|
(20.3)% |
|
|
|
(11.2)% |
|
|
|
(2.2)% |
|
|
|
6.9% |
|
|
|
16.0% |
|
We may need to raise additional capital to grow.
All of the proceeds from the IPO and the Concurrent Private Placement were contributed to the Operating Company in exchange for NMFC’s
acquisition of units of the Operating Company. The Operating Company may need additional capital to fund new investments and grow its portfolio of investments once the Operating Company has fully invested these proceeds. NMFC may access the capital
markets periodically to issue equity securities, which would in turn increase the equity capital available to the Operating Company. In addition, the Operating Company may also issue debt securities or borrow from financial institutions in order to
obtain such additional capital. However, the Operating Company is restricted from incurring additional indebtedness under the Credit Facilities, without lender consent. NMFC is not permitted to own any other securities other than its units of the
Operating Company. As a result, any proceeds from offerings by NMFC of equity securities would be contributed to the Operating Company. Unfavorable economic conditions could increase NMFC and the Operating Company’s funding costs and limit
their access to the capital markets or result in a decision by lenders not to extend credit to the Operating Company. A reduction in the availability of new capital could limit the Operating Company’s ability to grow. In addition, NMFC is
required to distribute at least 90.0% of its net ordinary income and net short-term capital gains in excess of net
27
long-term capital losses, if any, to its stockholders to obtain and maintain its RIC status. As a result, these earnings will not be available to fund new investments. If NMFC or the Operating
Company is unable to access the capital markets or if the Operating Company is unable to borrow from financial institutions, the Operating Company may be unable to grow its business and execute its business strategy fully and our earnings, if any,
could decrease which could have an adverse effect on the value of NMFC’s securities.
If the Operating Company is unable to comply with the
covenants or restrictions in the Credit Facilities, our business could be materially adversely affected.
The Credit Facilities
include covenants that, subject to exceptions, among other things, restrict the Operating Company’s ability to incur additional indebtedness, pay distributions, create liens on assets, make investments, make acquisitions and engage in mergers
or consolidations. The Credit Facilities also include change of control provisions that accelerate the indebtedness under the facility in the event of certain change of control events. Complying with these restrictions may prevent the Operating
Company from taking actions that we believe would help it to grow its business or are otherwise consistent with its investment objective. These restrictions could also limit the Operating Company’s ability to plan for or react to market
conditions or meet extraordinary capital needs or otherwise restrict corporate activities. In addition, the restrictions contained in the Credit Facilities could limit the Operating Company’s ability to make distributions to its members in
certain circumstances which could result in NMFC failing to qualify as a RIC and thus becoming subject to corporate-level federal income tax (and any applicable state and local taxes).
The breach of any of the covenants or restrictions unless cured within the applicable grace period, would result in a default under the respective
Credit Facilities that would permit the lender to declare all amounts outstanding to be due and payable. In such an event, the Operating Company may not have sufficient assets to repay such indebtedness. As a result, any default could have serious
consequences to our financial condition. An event of default or an acceleration under the Credit Facilities could also cause a cross-default or cross-acceleration of another debt instrument or contractual obligation, which would adversely impact the
Operating Company’s liquidity. An event of default under the Holdings Credit Facility will trigger an event of default under the SLF Credit Facility. The Operating Company may not be granted waivers or amendments to the Credit Facilities if for
any reason it is unable to comply with it, and the Operating Company may not be able to refinance the Credit Facilities on terms acceptable to it, or at all.
The Operating Company may enter into reverse repurchase agreements, which are another form of leverage.
Subject to limitations in the Credit Facilities, the Operating Company may enter into reverse repurchase agreements as part of its management of its investment portfolio. Under a reverse repurchase agreement, the
Operating Company will effectively pledge its assets as collateral to secure a short-term loan. Generally, the other party to the agreement makes the loan in an amount equal to a percentage of the fair value of the pledged collateral. At the
maturity of the reverse repurchase agreement, the payor will be required to repay the loan and correspondingly receive back its collateral. While used as collateral, the assets continue to pay principal and interest which are for the benefit of the
Operating Company.
The Operating Company’s use of reverse repurchase agreements, if any, involves many of the same risks involved
in its use of leverage, as the proceeds from reverse repurchase agreements generally will be invested in additional securities. There is a risk that the market value of the securities acquired with the proceeds of a reverse repurchase agreement may
decline below the price of the securities that it has sold but remains obligated to repurchase under the reverse repurchase agreement. In addition, there is a risk that the market value of the securities effectively pledged by the
28
Operating Company may decline. If a buyer of securities under a reverse repurchase agreement were to file for bankruptcy or experience insolvency, the Operating Company may be adversely affected.
Also, in entering into reverse repurchase agreements, the Operating Company would bear the risk of loss to the extent that the proceeds of such agreements at settlement are more than the fair value of the underlying securities being pledged. In
addition, due to the interest costs associated with reverse repurchase agreements transactions, the Operating Company’s net asset value would decline, and, in some cases, we may be worse off than if such instruments had not been used.
If the Operating Company is unable to obtain additional debt financing, or if its borrowing capacity is materially reduced, our business could be
materially adversely affected.
The Operating Company may want to obtain additional debt financing, or need to do so upon
maturity of its Credit Facilities, in order to obtain funds which may be made available for investments. The Operating Company is restricted from incurring additional indebtedness under the Credit Facilities without lender consent. The revolving
period under the Holdings Credit Facility ends on October 21, 2013, and the Holdings Credit Facility matures on October 21, 2015. The revolving period under the SLF Credit Facility ends on October 27, 2013, and the SLF Credit Facility
matures on October 27, 2015. If the Operating Company is unable to increase, renew or replace any such facility and enter into a new debt financing facility or other debt financing on commercially reasonable terms, its liquidity may be reduced
significantly. In addition, if the Operating Company is unable to repay amounts outstanding under any such facilities and is declared in default or is unable to renew or refinance these facilities, it may not be able to make new investments or
operate our business in the normal course. These situations may arise due to circumstances that the Operating Company may be unable to control, such as lack of access to the credit markets, a severe decline in the value of the U.S. dollar, a further
economic downturn or an operational problem that affects third parties or the Operating Company, and could materially damage the Operating Company’s business operations and, consequently, NMFC’s business, results of operations and
financial condition.
An extended continuation of the disruption in the capital markets and the credit markets could adversely affect our
business.
As BDCs, NMFC and the Operating Company must maintain its ability to raise additional capital for investment purposes.
If NMFC or the Operating Company is unable to access the capital markets or credit markets, the Operating Company may be forced to curtail its business operations and may be unable to pursue new investment opportunities. The capital markets and the
credit markets have experienced extreme volatility in recent periods, and, as a result, there has been and will likely continue to be uncertainty in the financial markets in general. Disruptions in the capital markets increased the spread between
the yields realized on risk-free and higher risk securities, resulting in illiquidity in parts of the capital markets. In addition, a prolonged period of market illiquidity may cause the Operating Company to reduce the volume of loans it originates
and/or funds and adversely affect the value of our portfolio investments. Unfavorable economic conditions could also increase the Operating Company’s funding costs, limit its access to the capital markets or result in a decision by lenders not
to extend credit to the Operating Company. These events could limit the Operating Company’s investment originations, limit its ability to grow and negatively impact our operating results. Ongoing disruptive conditions in the financial industry
and the impact of new legislation in response to those conditions could restrict the Operating Company’s business operations and, consequently, could adversely impact NMFC’s business, results of operations and financial condition.
If the fair value of the Operating Company’s assets declines substantially, it may fail to maintain the asset coverage ratios
imposed upon it by the 1940 Act and contained in its Credit Facilities. Any such failure would affect the Operating Company’s ability to issue senior securities, including borrowings, draw on its Credit Facilities and pay distributions, which
could materially impair its business operations. The Operating Company’s liquidity could be impaired further by NMFC or the
29
Operating Company’s inability to access the capital or credit markets. For example, we cannot be certain that the Operating Company will be able to renew its credit facilities as they mature
or to consummate new borrowing facilities to provide capital for normal operations, including new originations. Reflecting concern about the stability of the financial markets, many lenders and institutional investors have reduced or ceased
providing funding to borrowers. This market turmoil and tightening of credit have led to increased market volatility and widespread reduction of business activity generally. In addition, adverse economic conditions due to these disruptive conditions
could materially impact the Operating Company’s ability to comply with the financial and other covenants in any existing or future credit facilities. If the Operating Company is unable to comply with these covenants, its business could be
materially adversely affected, which could, as a result, materially adversely affect NMFC’s business, results of operations and financial condition.
Changes in interest rates may affect the Operating Company’s cost of capital and net investment income.
To the extent the Operating Company borrows money to make investments, the Operating Company’s net investment income depend, in part, upon the
difference between the rate at which it borrows funds and the rate at which it invests those funds. As a result, a significant change in market interest rates may have a material adverse effect on the Operating Company’s net investment income
in the event it uses debt to finance its investments. In periods of rising interest rates, the Operating Company’s cost of funds would increase, which could reduce its net investment income. The Operating Company may use interest rate risk
management techniques in an effort to limit its exposure to interest rate fluctuations. These techniques may include various interest rate hedging activities to the extent permitted by the 1940 Act.
The incentive fee the Operating Company pays to the Investment Adviser with respect to capital gains may be effectively greater than 20.0%.
As a result of the operation of the cumulative method of calculating the capital gains portion of the incentive fee the
Operating Company pays to the Investment Adviser, the cumulative aggregate capital gains fee received by the Investment Adviser could be effectively greater than 20.0%, depending on the timing and extent of subsequent net realized capital losses or
net unrealized depreciation. We cannot predict whether, or to what extent, this payment calculation would affect your investment in NMFC common stock.
RISKS RELATED TO OUR OPERATIONS
Because the Operating
Company intends to make distributions to its members that will be sufficient to enable NMFC to obtain and maintain its status as a RIC, and because NMFC intends to distribute substantially all of its income to its stockholders to obtain and maintain
its status as a RIC, the Operating Company will continue to need additional capital to finance its growth. If additional funds are unavailable or not available on favorable terms, the Operating Company’s ability to grow may be impaired.
In order for NMFC to qualify for the tax benefits available to RICs and to avoid payment of excise taxes, the Operating Company
intends to make distributions to its members that will be sufficient to enable NMFC to obtain and maintain its status as a RIC, and NMFC intends to distribute to its stockholders substantially all of its annual taxable income, except that NMFC may
retain certain net capital gains for reinvestment in units of the Operating Company, and treat such amounts as deemed distributions to its stockholders. If NMFC elects to treat any amounts as deemed distributions, NMFC must pay income taxes at the
corporate rate on such deemed distributions on behalf of its stockholders. As a result of these requirements, NMFC and the Operating Company may need to raise capital from other sources to grow its business.
30
As a BDC, the Operating Company is required to meet a coverage ratio of total assets, less
liabilities and indebtedness not represented by senior securities, to total senior securities, which includes all of the Operating Company’s borrowings and any outstanding preferred membership units, of at least 200.0%. The Operating Company
consolidates the assets and liabilities of NMF SLF for the purposes of its financial statements and calculating compliance with the 200.0% asset coverage ratio. Since NMFC has no assets other than its ownership of units of the Operating Company and
has no material long-term liabilities, NMFC looks to the Operating Company’s assets for purposes of satisfying this test. These requirements limit the amount that the Operating Company may borrow. Because the Operating Company continues to need
capital to grow its investment portfolio, these limitations may prevent the Operating Company from incurring debt and require NMFC to raise additional equity at a time when it may be disadvantageous to do so. While we expect the Operating Company
will be able to borrow and to issue additional debt securities and expect that NMFC will be able to issue additional equity securities, which would in turn increase the equity capital available to the Operating Company, we cannot assure you that
debt and equity financing will be available to the Operating Company on favorable terms, or at all. In addition, as a BDC, NMFC generally is not permitted to issue equity securities priced below net asset value without stockholder approval. If
additional funds are not available to NMFC or the Operating Company, the Operating Company may be forced to curtail or cease new investment activities, and the Operating Company’s net asset value and, consequently, NMFC’s net asset value,
could decline.
Our ability to enter into transactions with our affiliates is restricted.
As BDCs, the New Mountain Finance Entities are prohibited under the 1940 Act from participating in certain transactions with their respective
affiliates without the prior approval of their respective independent directors and, in some cases, the SEC. Any person that owns, directly or indirectly, 5.0% or more of NMFC’s outstanding voting securities is an affiliate of the New Mountain
Finance Entities for purposes of the 1940 Act. The New Mountain Finance Entities are generally prohibited from buying or selling any securities (other than their respective securities) from or to an affiliate. The 1940 Act also prohibits certain
“joint” transactions with an affiliate, which could include investments in the same portfolio company (whether at the same or different times), without prior approval of independent directors and, in some cases, the SEC. If a person
acquires more than 25.0% of NMFC’s voting securities, the New Mountain Finance Entities are prohibited from buying or selling any security (other than their respective securities) from or to such person or certain of that person’s
affiliates, or entering into prohibited joint transactions with such persons, absent the prior approval of the SEC. Similar restrictions limit the New Mountain Finance Entities’ ability to transact business with their respective officers or
directors or their affiliates. As a result of these restrictions, the Operating Company may be prohibited from buying or selling any security from or to any portfolio company of a private equity fund managed by any affiliate of the Investment
Adviser without the prior approval of the SEC, which may limit the scope of investment opportunities that would otherwise be available to the Operating Company.
The Investment Adviser has significant potential conflicts of interest with NMFC and the Operating Company and, consequently, your interests as stockholders which could adversely impact our investment
returns.
The New Mountain Finance Entities’ executive officers and directors, as well as the current or future investment
professionals of the Investment Adviser, serve or may serve as officers, directors or principals of entities that operate in the same or a related line of business as we do or of investment funds managed by the New Mountain Finance Entities’
affiliates. Accordingly, they may have obligations to investors in those entities, the fulfillment of which might not be in your interests as stockholders. Although we are currently New Mountain Capital’s only vehicle focused primarily on
investing in the investments that we target, in the future, the investment professionals of the Investment Adviser and/or New Mountain Capital employees that provide services pursuant to the
31
Investment Management Agreement may manage other funds which may from time to time have overlapping investment objectives with our own and, accordingly, may invest in, whether principally or
secondarily, asset classes similar to those targeted by us. If this occurs, the Investment Adviser may face conflicts of interest in allocating investment opportunities to the Operating Company and such other funds. Although the investment
professionals endeavor to allocate investment opportunities in a fair and equitable manner, it is possible that the Operating Company may not be given the opportunity to participate in certain investments made by the Investment Adviser or persons
affiliated with the Investment Adviser or that certain of these investment funds may be favored over the Operating Company. When these investment professionals identify an investment, they may be forced to choose which investment fund should make
the investment.
If the Investment Adviser forms other affiliates in the future, the Operating Company may co-invest on a concurrent
basis with such other affiliate, subject to compliance with applicable regulations and regulatory guidance or an exemptive order from the SEC and the Operating Company’s allocation procedures. In addition, the Operating Company pays management
and incentive fees to the Investment Adviser and reimburses the Investment Adviser for certain expenses it incurs. As a result, investors in NMFC’s common stock invest in NMFC and indirectly in the Operating Company, on a “gross”
basis and receive distributions on a “net” basis after NMFC’s pro rata share of the Operating Company’s expenses. Also, the incentive fee payable to the Investment Adviser may create an incentive for the Investment Adviser to
pursue investments that are riskier or more speculative than would be the case in the absence of such compensation arrangements. Any potential conflict of interest arising as a result of the arrangements with the Investment Adviser could have a
material adverse effect on our business, results of operations and financial condition.
The Investment Committee, the Investment Adviser or its
affiliates may, from time to time, possess material non-public information, limiting the Operating Company’s investment discretion.
The Investment Adviser’s investment professionals, Investment Committee or their respective affiliates may serve as directors of, or in a similar capacity with, companies in which we invest through the
Operating Company, the securities of which are purchased or sold on the Operating Company’s behalf. In the event that material non-public information is obtained with respect to such companies, or we become subject to trading restrictions under
the internal trading policies of those companies or as a result of applicable law or regulations, the Operating Company could be prohibited for a period of time from purchasing or selling the securities of such companies, and this prohibition may
have an adverse effect on the Operating Company and, consequently, your interests as stockholders of NMFC.
The valuation process for certain of
the Operating Company’s portfolio holdings creates a conflict of interest.
Some of the Operating Company’s portfolio
investments are made in the form of securities that are not publicly traded. As a result, the Operating Company’s board of directors determines the fair value of these securities in good faith. In connection with this determination, investment
professionals from the Investment Adviser may provide the Operating Company’s board of directors with portfolio company valuations based upon the most recent portfolio company financial statements available and projected financial results of
each portfolio company. In addition, Steven B. Klinsky, a member of the New Mountain Finance Entities’ board of directors, has an indirect pecuniary interest in the Investment Adviser. The participation of the Investment Adviser’s
investment professionals in the Operating Company’s valuation process, and the indirect pecuniary interest in the Investment Adviser by a member of the New Mountain Finance Entities’ board of directors, could result in a conflict of
interest as the Investment Adviser’s management fee is based, in part, on the Operating Company’s gross assets and incentive fees are based, in part, on unrealized gains and losses.
32
Conflicts of interest may exist related to other arrangements with the Investment Adviser or its affiliates.
The New Mountain Finance Entities have entered into a royalty-free license agreement with New Mountain Capital under which New
Mountain Capital has agreed to grant the New Mountain Finance Entities a non-exclusive, royalty-free license to use the name “New Mountain”. In addition, the Operating Company reimburses the Administrator for the allocable portion of
overhead and other expenses incurred by the Administrator in performing its obligations to the New Mountain Finance Entities under the Administration Agreement, such as rent and the allocable portion of the cost of the New Mountain Finance
Entities’ chief financial officer and chief compliance officer and their respective staffs. This could create conflicts of interest that the Operating Company’s board of directors must monitor.
The Investment Management Agreement with the Investment Adviser and the Administration Agreement with the Administrator were not negotiated on an arm’s
length basis.
The Investment Management Agreement and the Administration Agreement were negotiated between related parties. In
addition, the New Mountain Finance Entities may choose not to enforce, or to enforce less vigorously, their respective rights and remedies under these agreements because of their desire to maintain their ongoing relationship with the Investment
Adviser, the Administrator and their respective affiliates. Any such decision, however, could cause NMFC to breach its fiduciary obligations to its stockholders.
The Investment Adviser’s liability is limited under the Investment Management Agreement, and the Operating Company has agreed to indemnify the Investment Adviser against certain liabilities, which may
lead the Investment Adviser to act in a riskier manner than it would when acting for its own account.
Under the Investment
Management Agreement, the Investment Adviser does not assume any responsibility other than to render the services called for under that agreement, and it is not responsible for any action of the Operating Company’s board of directors in
following or declining to follow the Investment Adviser’s advice or recommendations. Under the terms of the Investment Management Agreement, the Investment Adviser, its officers, members, personnel, any person controlling or controlled by the
Investment Adviser are not liable to the New Mountain Finance Entities, their subsidiaries or any of their respective directors, members or stockholders or any subsidiary’s stockholders or partners for acts or omissions performed in accordance
with and pursuant to the Investment Management Agreement, except those resulting from acts constituting gross negligence, willful misconduct, bad faith or reckless disregard of the Investment Adviser’s duties under the Investment Management
Agreement. In addition, the Operating Company has agreed to indemnify the Investment Adviser and each of its officers, directors, members, managers and employees from and against any claims or liabilities, including reasonable legal fees and other
expenses reasonably incurred, arising out of or in connection with our business and operations or any action taken or omitted pursuant to authority granted by the Investment Management Agreement, except where attributable to gross negligence,
willful misconduct, bad faith or reckless disregard of such person’s duties under the Investment Management Agreement. These protections may lead the Investment Adviser to act in a riskier manner than it would when acting for its own account.
The Investment Adviser can resign upon 60 days’ notice, and a suitable replacement may not be found within that time, resulting in
disruptions in the Operating Company’s operations that could adversely affect our business, results of operations and financial condition.
Under the Investment Management Agreement, the Investment Adviser has the right to resign at any time upon 60 days’ written notice, whether a replacement has been found or not. If the Investment Adviser
resigns, the Operating Company may not be able to find a new investment adviser or hire internal management with similar expertise and ability to provide the same or equivalent services on
33
acceptable terms within 60 days, or at all. If a replacement is not able to be found on a timely basis, our business, results of operations and financial condition and the Operating
Company’s ability to pay distributions are likely to be materially adversely affected and the market price of NMFC’s common stock may decline. In addition, if the Operating Company is unable to identify and reach an agreement with a single
institution or group of executives having the expertise possessed by the Investment Adviser and its affiliates, the coordination of its internal management and investment activities is likely to suffer. Even if the Operating Company is able to
retain comparable management, whether internal or external, their integration into the Operating Company’s business and lack of familiarity with the Operating Company’s investment objective may result in additional costs and time delays
that may materially adversely affect our business, results of operations and financial condition.
The Administrator can resign upon 60 days
notice from its role as Administrator under the Administration Agreement, and a suitable replacement may not be found, resulting in disruptions that could adversely affect our business, results of operations and financial condition.
The Administrator has the right to resign under the Administration Agreement upon 60 days’ written notice, whether a
replacement has been found or not. If the Administrator resigns, it may be difficult to find a new administrator or hire internal management with similar expertise and ability to provide the same or equivalent services on acceptable terms, or at
all. If a replacement is not found quickly, our business, results of operations and financial condition as well as the Operating Company’s ability to pay distributions are likely to be adversely affected and the market price of NMFC’s
common stock may decline. In addition, the coordination of the New Mountain Finance Entities’ internal management and administrative activities is likely to suffer if they are unable to identify and reach an agreement with a service provider or
individuals with the expertise possessed by the Administrator. Even if a comparable service provider or individuals to perform such services are retained, whether internal or external, their integration into the Operating Company’s business and
lack of familiarity with the Operating Company’s investment objective may result in additional costs and time delays that may materially adversely affect our business, results of operations and financial condition.
If the New Mountain Finance Entities fail to maintain their status as BDCs, our business and operating flexibility could be significantly reduced.
The New Mountain Finance Entities qualify as BDCs under the 1940 Act. The 1940 Act imposes numerous constraints on the
operations of BDCs. For example, BDCs are required to invest at least 70.0% of their total assets in specified types of securities, primarily in private companies or thinly-traded U.S. public companies, cash, cash equivalents, U.S. government
securities and other high quality debt investments that mature in one year or less. Failure to comply with the requirements imposed on BDCs by the 1940 Act could cause the SEC to bring an enforcement action against the New Mountain Finance
Entities and/or expose the New Mountain Finance Entities to claims of private litigants. In addition, upon approval of a majority of NMFC’s stockholders, or, in the Operating Company’s case, a majority of its members voting on a pass
through basis, the New Mountain Finance Entities may elect to withdraw their respective election as a BDC. If the New Mountain Finance Entities decide to withdraw their election, or if the New Mountain Finance Entities otherwise fail to qualify, or
maintain their qualification, as BDCs, the New Mountain Finance Entities may be subject to the substantially greater regulation under the 1940 Act as a closed-end investment company. Compliance with these regulations would significantly decrease our
operating flexibility and could significantly increase our cost of doing business.
34
If the Operating Company does not invest a sufficient portion of its assets in qualifying assets, it could be
precluded from investing in certain assets or could be required to dispose of certain assets, which could have a material adverse effect on our business, financial condition and results of operations.
As a BDC, the Operating Company is prohibited from acquiring any assets other than “qualifying assets” unless, at the time of and after
giving effect to such acquisition, at least 70.0% of our total assets are qualifying assets. We may acquire in the future other investments that are not “qualifying assets” to the extent permitted by the 1940 Act. If the Operating Company
does not invest a sufficient portion of its assets in qualifying assets, it would be prohibited from investing in additional assets, which could have a material adverse effect on our business, financial condition and results of operations.
Similarly, these rules could prevent the Operating Company from making follow-on investments in existing portfolio companies (which could result in the dilution of its position) or could require the Operating Company to dispose of investments at
inopportune times in order to come into compliance with the 1940 Act. If the Operating Company needs to dispose of these investments quickly, it may be difficult to dispose of such investments on favorable terms. For example, the Operating Company
may have difficulty in finding a buyer and, even if a buyer is found, it may have to sell the investments at a substantial loss.
The Operating
Company’s ability to invest in public companies may be limited in certain circumstances.
To maintain the Operating
Company’s status, and consequently, NMFC’s status as a BDC, the Operating Company is not permitted to acquire any assets other than “qualifying assets” specified in the 1940 Act unless, at the time the acquisition is made, at
least 70.0% of its total assets are qualifying assets (with certain limited exceptions). Subject to certain exceptions for follow-on investments and distressed companies, an investment in an issuer that has outstanding securities listed on a
national securities exchange may be treated as qualifying assets only if such issuer has a common equity market capitalization that is less than $250.0 million at the time of such investment.
Regulations governing the operations of BDCs will affect our ability to raise additional equity capital as well as our ability to issue senior securities or
borrow for investment purposes, any or all of which could have a negative effect on our investment objectives and strategies.
Our business requires a substantial amount of capital. The Operating Company may acquire additional capital from the issuance of senior securities,
including borrowing or other indebtedness. In addition, NMFC may also issue additional equity capital, which would in turn increase the equity capital available to the Operating Company. Under the 1940 Act, NMFC is not permitted to own any other
securities other than units of the Operating Company. As a result, any proceeds from offerings of NMFC’s equity securities would be contributed to the Operating Company and subsequently used by the Operating Company for investment purposes.
However, NMFC and the Operating Company may not be able to raise additional capital in the future on favorable terms or at all.
The
Operating Company may issue debt securities, other evidences of indebtedness or preferred membership units, and it may borrow money from banks or other financial institutions, which we refer to collectively as “senior securities”, up to
the maximum amount permitted by the 1940 Act. The 1940 Act permits the Operating Company to issue senior securities in amounts such that its asset coverage, as defined in the 1940 Act, equals at least 200.0% after each issuance of senior securities.
The Operating Company consolidates the assets and liabilities of NMF SLF for purposes of its financial statements and calculating compliance with the 200.0% asset coverage ratio. If the Operating Company’s asset coverage ratio is not at least
200.0%, it would be unable to issue senior securities, and if it had senior securities outstanding (other than any indebtedness issued in consideration of a privately arranged loan, such as any indebtedness outstanding under the Credit Facilities),
it would be
35
unable to make distributions to its members and, consequently, NMFC would be unable to pay dividends. However, at December 31, 2011, the only senior securities outstanding were indebtedness
under the Credit Facilities and therefore at December 31, 2011, the Operating Company would not have been precluded from paying distributions. If the value of the Operating Company’s or NMF SLF’s assets declines, the Operating Company
may be unable to satisfy this test. If that happens, the Operating Company or NMF SLF may be required to liquidate a portion of its investments and repay a portion of its indebtedness at a time when such sales may be disadvantageous.
The Holdings Credit Facility matures on October 21, 2015 and permits borrowings of $160.0 million. The Holdings Credit Facility had
$151.9 million in debt outstanding as of March 31, 2012. The SLF Credit Facility matures on October 27, 2015 and permits borrowings of $175.0 million. The SLF Credit Facility had $175.0 million in debt outstanding as of March 31,
2012.
In addition, the Operating Company may in the future seek to securitize other portfolio securities to generate cash for funding
new investments. To securitize loans, the Operating Company would likely create a wholly-owned subsidiary and contribute a pool of loans to the subsidiary. The Operating Company would then sell interests in the subsidiary on a non-recourse basis to
purchasers and it would retain all or a portion of the equity in the subsidiary. If the Operating Company is unable to successfully securitize its loan portfolio, which must be done in compliance with the relevant restrictions in the Credit
Facilities, its ability to grow its business or fully execute its business strategy could be impaired and our earnings, if any, could decrease. The securitization market is subject to changing market conditions and the Operating Company may not be
able to access this market when it would otherwise deem appropriate. Moreover, the successful securitization of the Operating Company’s portfolio might expose the Operating Company to losses as the residual investments in which it does not sell
interests will tend to be those that are riskier and more apt to generate losses. The 1940 Act also may impose restrictions on the structure of any securitization.
NMFC may also obtain capital for use by the Operating Company through the issuance of additional equity capital, which would in turn increase the equity capital available to the Operating Company. As a BDC, NMFC
generally is not able to issue or sell its common stock at a price below net asset value per share. If NMFC’s common stock trades at a discount to its net asset value per share, this restriction could adversely affect its ability to raise
equity capital. NMFC may, however, sell its common stock, or warrants, options or rights to acquire its common stock, at a price below its net asset value per share of the common stock if its board of directors and independent directors determine
that such sale is in its best interests and the best interests of its stockholders, and its stockholders approve such sale. In any such case, the price at which NMFC’s securities are to be issued and sold may not be less than a price that, in
the determination of NMFC’s board of directors, closely approximates the market value of such securities (less any underwriting commission or discount). If NMFC raises additional funds by issuing more shares of its common stock or if the
Operating Company issues senior securities convertible into, or exchangeable for, NMFC’s common stock, the percentage ownership of NMFC’s stockholders may decline and you may experience dilution. Any proceeds from the issuance of
additional shares of NMFC’s common stock would be contributed to the Operating Company and used to purchase, on a one-for-one basis, additional units of the Operating Company.
The Operating Company’s business model in the future may depend to an extent upon our referral relationships with private equity sponsors, and the inability of the investment professionals of the
Investment Adviser to maintain or develop these relationships, or the failure of these relationships to generate investment opportunities, could adversely affect its business strategy.
If the investment professionals of the Investment Adviser fail to maintain existing relationships or develop new relationships with other sponsors
or sources of investment opportunities, the Operating
36
Company may not be able to grow our investment portfolio. In addition, individuals with whom the investment professionals of the Investment Adviser have relationships are not obligated to provide
the Operating Company with investment opportunities, and, therefore, there is no assurance that any relationships they currently or may in the future have will generate investment opportunities for the Operating Company.
We may experience fluctuations in our annual and quarterly results due to the nature of our business.
We could experience fluctuations in our annual and quarterly operating results due to a number of factors, some of which are beyond our control,
including the ability or inability of the Operating Company to make investments in companies that meet its investment criteria, the interest rate payable on the debt securities acquired and the default rate on such securities, the level of the
Operating Company’s expenses, variations in and the timing of the recognition of realized and unrealized gains or losses, the degree to which the Operating Company encounters competition in the markets in which it operates and general economic
conditions. As a result of these factors, results for any period should not be relied upon as being indicative of performance in future periods.
The Operating Company’s board of directors may change its investment objective, operating policies and strategies without prior notice or member
approval, the effects of which may be adverse to your interest as a stockholder.
The Operating Company’s board of directors
has the authority, except as otherwise provided in the 1940 Act, to modify or waive certain of its operating policies and strategies without prior notice and without member approval. As a result, the Operating Company’s board of directors may
be able to change its investment policies and objectives without any input from NMFC’s stockholders. However, absent member approval, voting on a pass through basis, the Operating Company may not change the nature of its business so as to cease
to be, or withdraw its election as, a BDC. Under Delaware law and the Operating Company’s Limited Liability Company Agreement, the Operating Company also cannot be dissolved without prior member approval, voting on a pass through basis. The
stockholders of NMFC collectively own approximately 34.6% of the units of the Operating Company. As a result, the stockholders of NMFC, collectively, may not be able to influence the outcome of matters requiring a vote, on a pass through basis and
your ability to terminate the Investment Management Agreement may be limited. We cannot predict the effect any changes to the Operating Company’s current operating policies and strategies would have on our business, operating results and the
market price of NMFC’s common stock. Nevertheless, any such changes could adversely affect our business and impair the Operating Company’s ability to make distributions to its members, and, consequently, NMFC’s ability to make
distributions to its stockholders.
NMFC will be subject to corporate-level federal income tax on all of its income if it is unable to maintain
RIC status under Subchapter M of the Code, which would have a material adverse effect on its respective financial performance.
Although NMFC intends to qualify annually as a RIC under Subchapter M of the Code, commencing with its taxable year ending on December 31, 2011, no assurance can be given that NMFC will be able to maintain its
RIC status. To maintain RIC status and be relieved of federal income taxes on income and gains distributed to its stockholders, NMFC must meet the annual distribution, source-of-income and asset diversification requirements described below. However,
NMFC has no assets, other than its direct ownership of units of the Operating Company, and no source of cash flow, other than distributions from the Operating Company. NMFC is not permitted to conduct any business or ventures, other than in
connection with the acquisition, ownership or disposition of units of the
37
Operating Company and its operation as a public reporting company. Accordingly, NMFC looks to the assets and income of the Operating Company, and relies on the distributions made by the Operating
Company to their members, for purposes of satisfying these requirements.
| |
Ÿ |
|
The annual distribution requirement for a RIC will be satisfied if NMFC distributes to its stockholders on an annual basis at least 90.0% of its net ordinary
income and realized net short-term capital gains in excess of realized net long-term capital losses, if any. Because the Operating Company and NMF SLF use debt financing, the Operating Company is subject to an asset coverage ratio requirement under
the 1940 Act, and the Operating Company and NMF SLF are subject to certain financial covenants contained in the Credit Facilities and other debt financing agreements (as applicable). This asset coverage ratio requirement and these financial
covenants could, under certain circumstances, restrict NMF SLF from making distributions to the Operating Company, and/or restrict the Operating Company from making distributions to its members, which distributions are necessary for NMFC to satisfy
the distribution requirement. If the Operating Company is unable to obtain cash from other sources, and thus is unable to make sufficient distributions to its members, NMFC could fail to qualify for RIC tax treatment and thus become subject to
corporate-level federal income tax (and any applicable state and local taxes). |
| |
Ÿ |
|
The source-of-income requirement will be satisfied if at least 90.0% of NMFC’s allocable share of the Operating Company’s gross income for each year is
derived from dividends, interest, gains from the sale of stock or securities or similar sources. |
| |
Ÿ |
|
The asset diversification requirement will be satisfied if NMFC meets certain asset diversification requirements at the end of each quarter of its taxable year.
To satisfy this requirement, at least 50.0% of the value of NMFC’s assets must consist of cash, cash equivalents, U.S. government securities, securities of other RICs, and other acceptable securities; and no more than 25.0% of the value of
NMFC’s assets can be invested in the securities, other than U.S. government securities or securities of other RICs, of one issuer, of two or more issuers that are controlled, as determined under applicable Code rules, by it and that are engaged
in the same or similar or related trades or businesses or of certain “qualified publicly traded partnerships”. Failure to meet these requirements may result in the Operating Company having to dispose of certain investments quickly in order
to prevent the loss of NMFC’s RIC status. Because most of the Operating Company’s investments are intended to be in private companies, and therefore may be relatively illiquid, any such dispositions could be made at disadvantageous prices
and could result in substantial losses. |
Although there is no authority directly applicable to NMFC and thus the
matter is not free from doubt, it is expected that NMFC is treated as if it directly invested in its pro rata share of the Operating Company’s assets for purposes of satisfying the asset diversification requirement. However, there can be no
assurance that the IRS will not successfully assert that NMFC does not meet the asset diversification requirement because it is unable to look to the Operating Company’s assets for purpose of that requirement. In that case, NMFC would fail to
qualify as a RIC and thus become subject to corporate-level federal income tax (and any applicable state and local taxes).
If NMFC
fails to qualify for or maintain its RIC status for any reason, and NMFC does not qualify for certain relief provisions under the Code, NMFC would be subject to corporate-level federal income tax (and any applicable state and local taxes). In this
event, the resulting taxes could substantially reduce NMFC’s net assets, the amount of income available for distribution and the amount of its distributions, which would have a material adverse effect on its financial performance.
You may have current tax liabilities on distributions you reinvest in common stock of NMFC.
Under the dividend reinvestment plan, if you own shares of common stock of NMFC registered in your own name, you will have all cash distributions
automatically reinvested in additional shares of
38
common stock of NMFC unless you opt out of the dividend reinvestment plan by delivering notice by phone, internet or in writing to the plan administrator at least three days prior to the payment
date of the next dividend or distribution. If you have not “opted out” of the dividend reinvestment plan, you will be deemed to have received, and for federal income tax purposes will be taxed on, the amount reinvested in common stock of
NMFC to the extent the amount reinvested was not a tax-free return of capital. As a result, you may have to use funds from other sources to pay your federal income tax liability on the value of the common stock received.
NMFC may not be able to pay you distributions on its common stock, its distributions to you may not grow over time and a portion of their distributions to
you may be a return of capital for federal income tax purposes.
NMFC intends to pay quarterly distributions to its stockholders
out of assets legally available for distribution. We cannot assure you that we will continue to achieve investment results that will allow NMFC to make a specified level of cash distributions or year-to-year increases in cash distributions. If the
Operating Company is unable to satisfy the asset coverage test applicable to it as a BDC, or if it violates certain covenants under the Credit Facilities, the Operating Company’s ability to pay distributions to its members could be limited,
thereby limiting NMFC’s ability to pay distributions to its stockholders. All distributions are paid at the discretion of the Operating Company’s board of directors and depend on its earnings, financial condition, maintenance of
NMFC’s RIC status, compliance with applicable BDC regulations, compliance with covenants under the Credit Facilities, and such other factors as the Operating Company’s board of directors may deem relevant from time to time. The
distributions NMFC pays to its stockholders in a year may exceed its taxable income for that year and, accordingly, a portion of such distributions may constitute a return of capital for federal income tax purposes.
In addition, because NMFC is a holding company, NMFC is only able to pay distributions on its common stock from distributions received from the
Operating Company. The Operating Company intends to make distributions to its members that will be sufficient to enable NMFC to pay quarterly distributions to its stockholders and to obtain and maintain its status as a RIC. However, there can be no
assurances that the Operating Company will make distributions to its members in the future. Accordingly, NMFC cannot assure you that it will pay distributions to you in the future.
NMFC may have difficulty paying its required distributions if the Operating Company recognizes taxable income before or without receiving cash representing such income.
For federal income tax purposes, NMFC includes in its taxable income its allocable share of certain amounts that the Operating Company has not yet
received in cash, such as original issue discount or accruals on a contingent payment debt instrument, which may occur if the Operating Company receives warrants in connection with the origination of a loan or possibly in other circumstances or
contracted payment-in-kind (“PIK”) interest, which generally represents contractual interest added to the loan balance and due at the end of the loan term. NMFC’s allocable share of such original issue discount and PIK interest are
included in NMFC’s taxable income before the Operating Company receives any corresponding cash payments. NMFC also may be required to include in its taxable income their allocable share of certain other amounts that the Operating Company will
not receive in cash.
Because in certain cases the Operating Company may recognize taxable income before or without receiving cash
representing such income, the Operating Company may have difficulty making distributions to the Operating Company’s members that will be sufficient to enable NMFC to meet the annual distribution requirement necessary for NMFC to qualify as a
RIC. Accordingly, the Operating Company may need to sell some of its assets at times and/or at prices that it would not consider advantageous, NMFC or the Operating Company may need to raise additional equity or debt capital, or
39
the Operating Company may need to forego new investment opportunities or otherwise take actions that are disadvantageous to its business (or be unable to take actions that are advantageous to its
business) to enable the Operating Company to make distributions to its members that will be sufficient to enable NMFC to meet the annual distribution requirement. If NMFC or the Operating Company are unable to obtain cash from other sources to
enable NMFC to meet the annual distribution requirement, NMFC may fail to qualify for the federal income tax benefits allowable to RICs and, thus, become subject to a corporate-level federal income tax (and any applicable state and local taxes).
Changes in laws or regulations governing the Operating Company’s operations may adversely affect our business or cause the Operating Company
to alter its business strategy.
Changes in the laws or regulations or the interpretations of the laws and regulations that
govern BDCs, RICs or non-depository commercial lenders could significantly affect our operations and our cost of doing business. The New Mountain Finance Entities and the Operating Company’s portfolio companies are subject to federal, state and
local laws and regulations. New legislation may be enacted or new interpretations, rulings or regulations could be adopted, any of which could materially adversely affect our business, including with respect to the types of investments the Operating
Company is permitted to make, and your interest as a stockholder potentially with retroactive effect. In addition, any changes to the laws and regulations governing the Operating Company’s operations relating to permitted investments may cause
the Operating Company to alter its investment strategy in order to avail itself of new or different opportunities. These changes could result in material changes to the strategies and plans set forth in this prospectus and may result in the
Operating Company’s investment focus shifting from the areas of expertise of the Investment Adviser to other types of investments in which the Investment Adviser may have less expertise or little or no experience. Any such changes, if they
occur, could have a material adverse effect on our business, results of operations and financial condition and, consequently, the value of your investment in us.
On July 21, 2010, the Dodd-Frank Wall Street Reform and Consumer Protection Act, or Dodd-Frank, became law. The scope of Dodd-Frank impacts many aspects of the financial services industry, and it requires the
development and adoption of many implementing regulations over the next several months and years. The effects of Dodd-Frank on the financial services industry will depend upon the timing and substance of regulations adopted by the various regulatory
authorities to implement Dodd-Frank.
The affect of global climate change may impact the operations of the Operating Company’s portfolio
companies.
There may be evidence of global climate change. Climate change creates physical and financial risk and some of the
Operating Company’s portfolio companies may be adversely affected by climate change. For example, the needs of customers of energy companies vary with weather conditions, primarily temperature and humidity. To the extent weather conditions are
affected by climate change, energy use could increase or decrease depending on the duration and magnitude of any changes. Increases in the cost of energy could adversely affect the cost of operations of the Operating Company’s portfolio
companies if the use of energy products or services is material to their business. A decrease in energy use due to weather changes may affect some of the Operating Company’s portfolio companies’ financial condition, through decreased
revenues. Extreme weather conditions in general require more system backup, adding to costs, and can contribute to increased system stresses, including service interruptions.
NMFC incurs significant costs as a result of being a publicly traded company.
As a
publicly traded company, NMFC incurs legal, accounting and other expenses, which are paid by the Operating Company, including costs associated with the periodic reporting requirements
40
applicable to a company whose securities are registered under the Exchange Act, as well as additional corporate governance requirements, including requirements under the Sarbanes-Oxley Act of
2002, or the “Sarbanes-Oxley Act”, and other rules implemented by the SEC.
Efforts to comply with Section 404 of the
Sarbanes-Oxley Act involve significant expenditures, and non-compliance with Section 404 of the Sarbanes-Oxley Act may adversely affect NMFC and the market price of NMFC’s common stock.
The New Mountain Finance Entities are subject to the Sarbanes-Oxley Act, and the related rules and regulations promulgated by the SEC. Under current
SEC rules, beginning with our fiscal year ending December 31, 2012, the Operating Company’s management will be required to report on their internal control over financial reporting pursuant to Section 404 of the Sarbanes-Oxley Act,
and rules and regulations of the SEC thereunder. The New Mountain Finance Entities will be required to review on an annual basis their respective internal control over financial reporting, and on a quarterly and annual basis to evaluate and disclose
changes in our respective internal control over financial reporting. As a result, the New Mountain Finance Entities expect to incur significant additional expenses in the near term, which may negatively impact the Operating Company’s financial
performance and the Operating Company’s ability to make distributions to its members and, consequently, NMFC’s ability to make distributions to its stockholders. This process also may result in a diversion of management’s time and
attention. We cannot be certain as to the timing of completion of any evaluation, testing and remediation actions or the impact of the same on our operations and neither of the New Mountain Finance Entities may be able to ensure that the process is
effective or that our internal control over financial reporting is or will be effective in a timely manner. In the event that the New Mountain Finance Entities are unable to maintain or achieve compliance with Section 404 of the Sarbanes-Oxley
Act and related rules, the Operating Company and, consequently, the market price of NMFC’s common stock may be adversely affected.
The
Operating Company’s business is highly dependent on information systems and systems failures could significantly disrupt our business, which may, in turn, negatively affect the market price of NMFC’s common stock and its ability to pay
dividends.
The Operating Company’s business is highly dependent on the communications and information systems of the
Investment Adviser and its affiliates. Any failure or interruption of such systems could cause delays or other problems in the Operating Company’s activities. This, in turn, could have a material adverse effect on the Operating Company’s
operating results and, consequently, negatively affect the market price of NMFC’s common stock and its ability to pay dividends to its stockholders. In addition, because many of the Operating Company’s portfolio companies operate and rely
on network infrastructure and enterprise applications and internal technology systems for development, marketing, operational, support and other business activities, a disruption or failure of any or all of these systems in the event of a major
telecommunications failure, cyber-attack, fire, earthquake, severe weather conditions or other catastrophic event could cause system interruptions, delays in product development and loss of critical data and could otherwise disrupt their business
operations.
RISKS RELATING TO THE OPERATING COMPANY’S INVESTMENTS
The Operating Company’s investments in portfolio companies may be risky, and the Operating Company could lose all or part of any of its investments.
Investing in middle market businesses involves a number of significant risks. Among other things, these companies:
| |
Ÿ |
|
may have limited financial resources and may be unable to meet their obligations under their debt instruments that the Operating Company holds, which may be
accompanied by a deterioration in the value of any collateral and a reduction in the likelihood of the Operating |
41
| |
Company realizing any guarantees from subsidiaries or affiliates of its portfolio companies that the Operating Company may have obtained in connection with its investment, as well as a
corresponding decrease in the value of any equity components of its investments; |
| |
Ÿ |
|
may have shorter operating histories, narrower product lines, smaller market shares and/or more significant customer concentrations than larger businesses, which
tend to render them more vulnerable to competitors’ actions and market conditions, as well as general economic downturns; |
| |
Ÿ |
|
are more likely to depend on the management talents and efforts of a small group of persons; therefore, the death, disability, resignation or termination of one
or more of these persons could have a material adverse impact on the Operating Company’s portfolio company and, in turn, on us; |
| |
Ÿ |
|
generally have less predictable operating results, may from time to time be parties to litigation, may be engaged in rapidly changing businesses with products
subject to a substantial risk of obsolescence; |
| |
Ÿ |
|
may require substantial additional capital to support their operations, finance expansion or maintain their competitive position; and
|
| |
Ÿ |
|
generally have less publicly available information about their businesses, operations and financial condition. |
In addition, in the course of providing significant managerial assistance to certain of the Operating Company’s portfolio companies, certain
of the Operating Company’s officers and directors may serve as directors on the boards of such companies. To the extent that litigation arises out of the Operating Company’s investments in these companies, the Operating Company’s
officers and directors may be named as defendants in such litigation, which could result in an expenditure of funds (through the Operating Company’s indemnification of such officers and directors) and the diversion of management time and
resources.
The Operating Company’s investment strategy, which is focused primarily on privately held companies, presents certain challenges,
including the lack of available information about these companies.
The Operating Company invests primarily in privately held
companies. There is generally little public information about these companies, and, as a result, the Operating Company must rely on the ability of the Investment Adviser to obtain adequate information to evaluate the potential returns from, and
risks related to, investing in these companies. If the Operating Company is unable to uncover all material information about these companies, it may not make a fully informed investment decision, and it may lose money on its investments. Also,
privately held companies frequently have less diverse product lines and smaller market presence than larger competitors. They are, thus, generally more vulnerable to economic downturns and may experience substantial variations in operating results.
These factors could adversely affect the Operating Company’s investment returns.
If the Operating Company makes unsecured investments, those
investments might not generate sufficient cash flow to service their debt obligations to the Operating Company.
The Operating
Company may make unsecured investments. Unsecured investments may be subordinated to other obligations of the obligor. Unsecured investments often reflect a greater possibility that adverse changes in the financial condition of the obligor or
general economic conditions (including, for example, a substantial period of rising interest rates or declining earnings) or both may impair the ability of the obligor to make payment of principal and interest. If the Operating Company
42
makes an unsecured investment in a portfolio company, that portfolio company may be highly leveraged, and its relatively high debt-to-equity ratio may increase the risk that its operations might
not generate sufficient cash to service its debt obligations.
If the Operating Company invests in the securities and obligations of distressed
and bankrupt issuers, it might not receive interest or other payments.
From time to time, the Operating Company may invest in
other types of investments which are not its primary focus, including investments in the securities and obligations of distressed and bankrupt issuers, including debt obligations that are in covenant or payment default. Such investments generally
are considered speculative. The repayment of defaulted obligations is subject to significant uncertainties. Defaulted obligations might be repaid only after lengthy workout or bankruptcy proceedings, during which the issuer of those obligations
might not make any interest or other payments.
The lack of liquidity in the Operating Company’s investments may adversely affect our
business.
The Operating Company invests, and will continue to invest, in companies whose securities are not publicly traded and
whose securities will be subject to legal and other restrictions on resale or will otherwise be less liquid than publicly traded securities. The illiquidity of these investments may make it difficult for the Operating Company to sell these
investments when desired. In addition, if the Operating Company is required or otherwise chooses to liquidate all or a portion of its portfolio quickly, it may realize significantly less than the value at which it had previously recorded these
investments. The Operating Company’s investments are usually subject to contractual or legal restrictions on resale or are otherwise illiquid because there is usually no established trading market for such investments. Because most of the
Operating Company’s investments are illiquid, the Operating Company may be unable to dispose of them in which case NMFC could fail to qualify as a RIC and/or BDC, or the Operating Company may be unable to do so at a favorable price, and, as a
result, the Operating Company and NMFC may suffer losses.
Price declines and illiquidity in the corporate debt markets may adversely affect the
fair value of the Operating Company’s portfolio investments, reducing the Operating Company’s net asset value through increased net unrealized depreciation.
As a BDC, the Operating Company is required to carry its investments at market value or, if no market value is ascertainable, at fair value as determined in good faith by its board of directors. Because NMFC is a
holding company with no direct operations of its own, and its only business and sole asset is its ownership of units of the Operating Company, NMFC’s net asset value will be based on the Operating Company’s valuation of its investments and
its percentage interest in the Operating Company. As part of the valuation process, the Operating Company may take into account the following types of factors, if relevant, in determining the fair value of its investments:
| |
Ÿ |
|
a comparison of the portfolio company’s securities to publicly traded securities; |
| |
Ÿ |
|
the enterprise value of a portfolio company; |
| |
Ÿ |
|
the nature and realizable value of any collateral; |
| |
Ÿ |
|
the portfolio company’s ability to make payments and its earnings and discounted cash flow; |
| |
Ÿ |
|
the markets in which the portfolio company does business; and |
| |
Ÿ |
|
changes in the interest rate environment and the credit markets generally that may affect the price at which similar investments may be made in the future and
other relevant factors. |
43
When an external event such as a purchase transaction, public offering or subsequent sale occurs, the
Operating Company will use the pricing indicated by the external event to corroborate its valuation. The Operating Company will record decreases in the market values or fair values of its investments as unrealized depreciation. Declines in prices
and liquidity in the corporate debt markets may result in significant net unrealized depreciation in its portfolio. The effect of all of these factors on the Operating Company’s portfolio may reduce the Operating Company’s net asset value,
and, indirectly, NMFC’s net asset value based on its percentage interest in the Operating Company, by increasing net unrealized depreciation in the Operating Company’s portfolio. Depending on market conditions, the Operating Company could
incur substantial realized losses and may suffer additional unrealized losses in future periods, which could have a material adverse effect on its business, financial condition, results of operations and cash flows.
If the Operating Company is unable to make follow-on investments in its portfolio companies, the value of the Operating Company’s investment portfolio
could be adversely affected.
Following an initial investment in a portfolio company, the Operating Company may make additional
investments in that portfolio company as “follow-on” investments, in order to (i) increase or maintain in whole or in part its equity ownership percentage, (ii) exercise warrants, options or convertible securities that were
acquired in the original or subsequent financing or (iii) attempt to preserve or enhance the value of its investment. The Operating Company may elect not to make follow-on investments or may otherwise lack sufficient funds to make these
investments. The Operating Company has the discretion to make follow-on investments, subject to the availability of capital resources. If the Operating Company fails to make follow-on investments, the continued viability of a portfolio company and
its investment may, in some circumstances, be jeopardized and we could miss an opportunity for the Operating Company to increase its participation in a successful operation. Even if the Operating Company has sufficient capital to make a desired
follow-on investment, it may elect not to make a follow-on investment because it may not want to increase its concentration of risk, either because it prefers other opportunities or because it is subject to BDC requirements that would prevent such
follow-on investments or such follow-on investments would adversely impact NMFC’s ability to maintain its RIC status.
The Operating
Company’s portfolio companies may incur debt that ranks equally with, or senior to, its investments in such companies.
The
Operating Company invests in portfolio companies at all levels of the capital structure. The Operating Company’s portfolio companies may have, or may be permitted to incur, other debt that ranks equally with, or senior to, the debt in which the
Operating Company invests. By their terms, these debt instruments may entitle the holders to receive payment of interest or principal on or before the dates on which the Operating Company is entitled to receive payments with respect to the debt
instruments in which it invests. In addition, in the event of insolvency, liquidation, dissolution, reorganization or bankruptcy of a portfolio company, holders of debt instruments ranking senior to the Operating Company’s investment in that
portfolio company would typically be entitled to receive payment in full before it receives any distribution. After repaying the senior creditors, the portfolio company may not have any remaining assets to use for repaying its obligation to the
Operating Company. In the case of debt ranking equally with debt instruments in which the Operating Company invests, it would have to share on an equal basis any distributions with other creditors holding such debt in the event of an insolvency,
liquidation, dissolution, reorganization or bankruptcy of the relevant portfolio company.
The disposition of the Operating Company’s
investments may result in contingent liabilities.
Most of the Operating Company’s investments will involve private
securities. In connection with the disposition of an investment in private securities, the Operating Company may be required to make
44
representations about the business and financial affairs of the portfolio company typical of those made in connection with the sale of a business. The Operating Company may also be required to
indemnify the purchasers of such investment to the extent that any such representations turn out to be inaccurate or with respect to certain potential liabilities. These arrangements may result in contingent liabilities that ultimately yield funding
obligations that must be satisfied through the Operating Company’s return of certain distributions previously made to it.
There may be
circumstances where our debt investments could be subordinated to claims of other creditors or the Operating Company could be subject to lender liability claims.
Even though the Operating Company may have structured certain of its investments as senior loans, if one of its portfolio companies were to go bankrupt, depending on the facts and circumstances, including the
extent to which the Operating Company actually provided managerial assistance to that portfolio company, a bankruptcy court might re-characterize its debt investment and subordinate all or a portion of the Operating Company’s claim to that of
other creditors. The Operating Company may also be subject to lender liability claims for actions taken by it with respect to a borrower’s business or instances where it exercises control over the borrower. It is possible that the Operating
Company could become subject to a lender’s liability claim, including as a result of actions taken in rendering significant managerial assistance.
Second priority liens on collateral securing loans that the Operating Company makes to its portfolio companies may be subject to control by senior creditors
with first priority liens. If there is a default, the value of the collateral may not be sufficient to repay in full both the first priority creditors and the Operating Company.
Certain loans to portfolio companies will be secured on a second priority basis by the same collateral securing senior secured debt of such
companies. The first priority liens on the collateral will secure the portfolio company’s obligations under any outstanding senior debt and may secure certain other future debt that may be permitted to be incurred by the portfolio company under
the agreements governing the loans. The holders of obligations secured by the first priority liens on the collateral will generally control the liquidation of and be entitled to receive proceeds from any realization of the collateral to repay their
obligations in full before the Operating Company. In addition, the value of the collateral in the event of liquidation will depend on market and economic conditions, the availability of buyers and other factors. There can be no assurance that the
proceeds, if any, from the sale or sales of all of the collateral would be sufficient to satisfy the loan obligations secured by the second priority liens after payment in full of all obligations secured by the first priority liens on the
collateral. If such proceeds are not sufficient to repay amounts outstanding under the loan obligations secured by the second priority liens, then the Operating Company, to the extent not repaid from the proceeds of the sale of the collateral, will
only have an unsecured claim against the portfolio company’s remaining assets, if any.
The rights the Operating Company may have
with respect to the collateral securing the loans it makes to its portfolio companies with senior debt outstanding may also be limited pursuant to the terms of one or more intercreditor agreements entered into with the holders of first priority
senior debt. Under an intercreditor agreement, at any time that obligations that have the benefit of the first priority liens are outstanding, any of the following actions that may be taken in respect of the collateral will be at the direction of
the holders of the obligations secured by the first priority liens: the ability to cause the commencement of enforcement proceedings against the collateral, the ability to control the conduct of such proceedings, the approval of amendments to
collateral documents; releases of liens on the collateral and waivers of past defaults under collateral documents. The Operating Company may not have the ability to control or direct these actions, even if its rights are adversely affected.
45
The Operating Company generally does not control its portfolio companies.
The Operating Company does not, and does not expect to, control most of its portfolio companies, even though the Operating Company may have board
representation or board observation rights, and its debt agreements may contain certain restrictive covenants that limit the business and operations of its portfolio companies. As a result, the Operating Company is subject to the risk that a
portfolio company may make business decisions with which the Operating Company disagrees and the management of such company, in which the Operating Company invests as representatives of the holders of their common equity, may take risks or otherwise
act in ways that do not serve the Operating Company’s interests as debt investors. Due to the lack of liquidity of the investments that the Operating Company typically holds in its portfolio companies, it may not be able to dispose of its
investments in the event that the Operating Company disagrees with the actions of a portfolio company as readily as it would otherwise like to or at favorable prices which could decrease the value of its investments.
Economic recessions or downturns could impair the Operating Company’s portfolio companies and harm its operating results.
Many of the Operating Company’s portfolio companies may be susceptible to economic slowdowns or recessions and may be unable to repay its debt
investments during these periods. Therefore, the Operating Company’s non-performing assets are likely to increase, and the value of the Operating Company’s portfolio is likely to decrease during these periods. Adverse economic conditions
also may decrease the value of collateral securing some of the Operating Company’s debt investments and the value of its equity investments. Economic slowdowns or recessions could lead to financial losses in the Operating Company’s
portfolio and a decrease in revenues, net income and assets. Unfavorable economic conditions also could increase the Operating Company’s funding costs, limit NMFC’s and the Operating Company’s access to the capital markets or result
in a decision by lenders not to extend credit to the Operating Company. These events could prevent the Operating Company from increasing investments and harm its operating results.
Defaults by the Operating Company’s portfolio companies may harm its operating results.
A portfolio company’s failure to satisfy financial or operating covenants imposed by the Operating Company or other lenders could lead to defaults and, potentially, termination of its loans and foreclosure on
its secured assets, which could trigger cross-defaults under other agreements and jeopardize a portfolio company’s ability to meet its obligations under the debt or equity securities that the Operating Company holds.
The Operating Company may incur expenses to the extent necessary to seek recovery upon default or to negotiate new terms, which may include the
waiver of certain financial covenants, with a defaulting portfolio company. In addition, lenders in certain cases can be subject to lender liability claims for actions taken by them when they become too involved in the borrower’s business or
exercise control over a borrower. It is possible that the Operating Company could become subject to a lender’s liability claim, including as a result of actions taken if it renders significant managerial assistance to the borrower. Furthermore,
if one of the Operating Company’s portfolio companies were to file for bankruptcy protection, even though the Operating Company may have structured its investment as senior secured debt, depending on the facts and circumstances, including the
extent to which the Operating Company provided managerial assistance to that portfolio company, a bankruptcy court might re-characterize its debt holding and subordinate all or a portion of the Operating Company’s claim to claims of other
creditors.
46
Prepayments of the Operating Company’s debt investments by its portfolio companies could adversely impact
the Operating Company’s results of operations and reduce its return on equity.
The Operating Company is subject to the risk
that the investments it makes in its portfolio companies may be repaid prior to maturity. When this occurs, subject to maintenance of NMFC’s RIC status, the Operating Company will generally reinvest these proceeds in temporary investments,
pending their future investment in new portfolio companies. These temporary investments will typically have substantially lower yields than the debt being prepaid and the Operating Company could experience significant delays in reinvesting these
amounts. Any future investment in a new portfolio company may also be at lower yields than the debt that was repaid. As a result, the Operating Company’s results of operations could be materially adversely affected if one or more of its
portfolio companies elect to prepay amounts owed to the Operating Company. Additionally, prepayments could negatively impact the Operating Company’s return on equity, which could result in a decline in the market price of NMFC’s common
stock.
The Operating Company may not realize gains from its equity investments.
When the Operating Company invests in portfolio companies, it may acquire warrants or other equity securities of portfolio companies as well. The
Operating Company may also invest in equity securities directly. To the extent the Operating Company holds equity investments, it will attempt to dispose of them and realize gains upon its disposition of them. However, the equity interests the
Operating Company receives may not appreciate in value and, in fact, may decline in value. As a result, the Operating Company may not be able to realize gains from its equity interests, and any gains that it does realize on the disposition of any
equity interests may not be sufficient to offset any other losses it experiences. The Operating Company also may be unable to realize any value if a portfolio company does not have a liquidity event, such as a sale of the business, recapitalization
or public offering, which would allow the Operating Company to sell the underlying equity interests.
The performance of the Operating
Company’s portfolio companies may differ from its historical performance as its investment strategy will include primary originations in addition to secondary market purchases.
Historically, the Operating Company’s investment strategy consisted primarily of secondary market purchases in debt securities. The Operating
Company recently adjusted its investment strategy to also include primary originations. While loans the Operating Company originates and loans its purchases in the secondary market face many of the same risks associated with the financing of
leveraged companies, the Operating Company may be exposed to different risks depending on specific business considerations for secondary market purchases or origination of loans. As a result, this strategy may result in different returns from these
investments than the types of returns it has historically experienced from secondary market purchases of debt securities.
The Operating Company
may be subject to additional risks if it invests in foreign securities and/or engage in hedging transactions.
The 1940 Act
generally requires that 70.0% of the Operating Company’s investments be in issuers each of whom is organized under the laws of, and has its principal place of business in, any state of the United States, the District of Columbia, Puerto Rico,
the Virgin Islands or any other possession of the United States. The Operating Company’s investment strategy does not presently contemplate significant investments in securities of non-U.S. companies. However, the Operating Company may desire
to make such investments in the future, to the extent that such transactions and investments are permitted under the 1940 Act. The Operating Company expects that these investments would focus on the same types of investments that it makes in U.S.
middle market companies and accordingly would be complementary to its overall strategy and enhance the diversity
47
of its holdings. Investing in foreign companies could expose the Operating Company to additional risks not typically associated with investing in U.S. companies. These risks include changes in
exchange control regulations, political and social instability, expropriation, imposition of foreign taxes, less liquid markets and less available information than is generally the case in the United States, higher transaction costs, less government
supervision of exchanges, brokers and issuers, less developed bankruptcy laws, difficulty in enforcing contractual obligations, lack of uniform accounting and auditing standards and greater price volatility. Investments denominated in foreign
currencies would be subject to the risk that the value of a particular currency will change in relation to one or more other currencies. Among the factors that may affect currency values are trade balances, the level of short-term interest rates,
differences in relative values of similar assets in different currencies, long-term opportunities for investment and capital appreciation and political developments. The Operating Company may employ hedging techniques to minimize these risks, but it
can offer no assurance that it will, in fact, hedge currency risk, or that if it does, such strategies will be effective.
Engaging in
hedging transactions would also, indirectly, entail additional risks to NMFC’s stockholders. Although it is not currently anticipated that the Operating Company would engage in hedging transactions as a principal investment strategy, if the
Operating Company determined to engage in hedging transactions it generally would seek to hedge against fluctuations of the relative values of its portfolio positions from changes in market interest rates or currency exchange rates. Hedging against
a decline in the values of the Operating Company’s portfolio positions would not eliminate the possibility of fluctuations in the values of such positions or prevent losses if the values of the positions declined. However, such hedging could
establish other positions designed to gain from those same developments, thereby offsetting the decline in the value of such portfolio positions.
These hedging transactions could also limit the opportunity for gain if the values of the underlying portfolio positions increased. Moreover, it might not be possible to hedge against an exchange rate or interest
rate fluctuation that was so generally anticipated that the Operating Company would not be able to enter into a hedging transaction at an acceptable price. If the Operating Company chooses to engage in hedging transactions, there can be no
assurances that the Operating Company will achieve the intended benefits of such transactions and, depending on the degree of exposure such transactions could create, such transactions may expose the Operating Company and, indirectly, NMFC to risk
of loss.
While the Operating Company may enter into these types of transactions to seek to reduce currency exchange rate and interest
rate risks, unanticipated changes in currency exchange rates or interest rates could result in poorer overall investment performance than if it had not engaged in any such hedging transactions. In addition, the degree of correlation between price
movements of the instruments used in a hedging strategy and price movements in the portfolio positions being hedged could vary. Moreover, for a variety of reasons, the Operating Company might not seek to establish a perfect correlation between the
hedging instruments and the portfolio holdings being hedged. Any imperfect correlation could prevent the Operating Company from achieving the intended hedge and expose the Operating Company and NMFC to risk of loss. In addition, it might not be
possible to hedge fully or perfectly against currency fluctuations affecting the value of securities denominated in non-U.S. currencies because the value of those securities would likely fluctuate as a result of factors not related to currency
fluctuations.
RISKS RELATING TO OUR CORPORATE STRUCTURE
NMFC is a holding company with no direct operations of its own, and will depend on distributions from the Operating Company to meet its ongoing obligations.
NMFC is a holding company with no direct operations of its own, and its only business and sole asset is its direct ownership of units of the
Operating Company. As a result, all investment decisions relating to the Operating Company’s portfolio will be made by the Investment Adviser under the
48
supervision of the Operating Company’s board of directors, which may be different from NMFC’s board of directors. Although the Operating Company’s Limited Liability Company
Operating Agreement provides that in accordance with the 1940 Act and to the extent required thereby, NMFC will “pass through” its votes on all matters subject to a member vote, including with respect to the election of the Operating
Company’s directors, NMFC will not, and indirectly, the stockholders of NMFC will not, have any control over the Operating Company’s day-to-day operations and investment decisions.
NMFC also does not have any independent ability to generate revenue, and its only sources of cash flow from operations are distributions from the
Operating Company. Consequently, NMFC relies on the Operating Company to cover the expenses of its day-to-day business, including expenses incident to NMFC’s status as a public company. Pursuant to the Administration Agreement, the Operating
Company will reimburse the Administrator for NMFC’s allocable portion of overhead and other expenses incurred by the Administrator in performing its obligations to NMFC under the Administration Agreement. However, if the Operating Company
cannot or does not make the payments required pursuant to the Administration Agreement, NMFC may be unable to cover these expenses.
In
addition, since NMFC is a holding company, its ability to pay distributions to its stockholders depends on the prior distribution from the Operating Company of cash in an amount sufficient to pay quarterly distributions and to obtain and maintain
its status as a RIC. The distribution of cash flows by the Operating Company to NMFC is subject to statutory restrictions under the Delaware Limited Liability Company Act, the 1940 Act and contractual restrictions under the Credit Facilities or any
other debt financing facility that may limit the Operating Company’s or NMF SLF’s ability to make distributions. In addition, any distributions and payments of fees or costs will be based upon the Operating Company’s financial
performance. Any distributions of cash will be made on a pro rata basis to all of the Operating Company’s members, including NMFC, in accordance with each unit holders’ respective percentage interest.
New Mountain Capital or its affiliates may have interests that differ from your interests as stockholders of NMFC.
Guardian AIV indirectly owns, through AIV Holdings, approximately 65.4% of the units of the Operating Company. New Mountain’s interests, the
interests of the partners in Guardian AIV and the interests of those persons affiliated with New Mountain Capital that participated in the Concurrent Private Placement may differ from, or conflict with, your interests as stockholders of NMFC. For
example, conflicts arising under the Registration Rights Agreement will be resolved as set forth therein. Under the Registration Rights Agreement, AIV Holdings and the Operating Company’s Chairman and a related entity will have priority over
NMFC or any other NMFC stockholder when selling any shares of NMFC common stock pursuant to their exercise of registration rights under that agreement.
Circumstances may arise in the future when the interests of the Operating Company’s members conflict with the interests of NMFC’s stockholders. The Operating Company’s board of directors and the
board of directors of NMFC are comprised of the same members. However, the Operating Company’s board of directors owes fiduciary duties to its members that could conflict with the fiduciary duties NMFC’s board of directors owes to its
stockholders.
49
Any future exchange by AIV Holdings of units of the Operating Company for shares of NMFC’s common stock
would significantly dilute the voting power of NMFC’s current stockholders with respect to the election of NMFC directors or other matters that require the approval of NMFC stockholders only. In addition, the interests of the partners of
Guardian AIV following such exchange by AIV Holdings may be adverse to the interests of NMFC’s stockholders and could limit your ability to influence the outcome of key transactions, including any change of control.
Pursuant to the terms of the Operating Company’s Limited Liability Company Operating Agreement, AIV Holdings will have the right to exchange
its units for shares of NMFC’s common stock on a one-for-one basis. Guardian AIV indirectly owns, through AIV Holdings, approximately 65.4% of the units of the Operating Company. If AIV Holdings exercised its exchange rights with respect to a
significant number of units, the voting power of NMFC’s stockholders would be significantly diluted. As a result, Guardian AIV, indirectly through AIV Holdings, would retain significant influence over decisions that require the approval of
NMFC’s stockholders exclusively (such as the election of its directors and the approval of mergers or other significant corporate transactions) regardless of whether or not NMFC’s other stockholders believe that such decisions are in
NMFC’s own best interests. If AIV Holdings exercised its exchange rights in full, Guardian AIV, indirectly through AIV Holdings would own approximately 65.4% of all outstanding shares of NMFC’s common stock. However, these entities would
not exercise voting control over their shares of common stock because the right to vote those shares would be passed through to the partners of these entities. These investors, along with those persons affiliated with New Mountain Capital that
participated in the Concurrent Private Placement, may have interests that differ from your interests, and they may vote in a way with which you disagree and that may be adverse to your interests as stockholders of NMFC. The concentration of
ownership of NMFC’s common stock following the exercise of AIV Holdings’ exchange right may also have the effect of delaying, preventing or deterring a change of control of NMFC, could deprive NMFC’s stockholders of an opportunity to
receive a premium for their common stock as part of a sale of NMFC and may adversely affect the market price of NMFC’s common stock.
RISKS
RELATING TO NMFC’S COMMON STOCK
The market price of NMFC’s common stock may fluctuate significantly.
The market price and liquidity of the market for shares of NMFC’s common stock may be significantly affected by numerous factors, some of which
are beyond our control and may not be directly related to the Operating Company’s operating performance. These factors include:
| |
Ÿ |
|
price and volume fluctuations in the overall stock market or in the market for BDCs from time to time; |
| |
Ÿ |
|
investor demand for shares of NMFC’s common stock; |
| |
Ÿ |
|
significant volatility in the market price and trading volume of securities of registered closed-end management investment companies, BDCs or other financial
services companies, which is not necessarily related to the operating performance of these companies; |
| |
Ÿ |
|
the inability to raise equity capital; |
| |
Ÿ |
|
the Operating Company’s inability to borrow money or deploy or invest its capital; |
| |
Ÿ |
|
fluctuations in interest rates; |
| |
Ÿ |
|
any shortfall in revenue or net income or any increase in losses from levels expected by investors or securities analysts; |
| |
Ÿ |
|
operating performance of companies comparable to the Operating Company; |
| |
Ÿ |
|
changes in regulatory policies or tax guidelines with respect to RICs or BDCs; |
50
| |
Ÿ |
|
NMFC’s or the Operating Company’s loss of status as or ability to operate as BDCs; |
| |
Ÿ |
|
NMFC’s failure to qualify as a RIC, loss of RIC status or ability operate as a RIC; |
| |
Ÿ |
|
actual or anticipated changes in the Operating Company’s earnings or fluctuations in its operating results; |
| |
Ÿ |
|
changes in the value of the Operating Company’s portfolio of investments; |
| |
Ÿ |
|
general economic conditions, trends and other external factors; |
| |
Ÿ |
|
departures of key personnel; or |
| |
Ÿ |
|
loss of a major source of funding. |
Investing in NMFC’s common stock may involve an above average degree of risk.
The investments the Operating Company may make may result in a higher amount of risk, volatility or loss of principal than alternative investment
options. These investments in portfolio companies may be highly speculative and aggressive, and therefore, an investment in NMFC’s common stock may not be suitable for investors with lower risk tolerance.
Sales of substantial amounts of NMFC’s common stock in the public market may have an adverse effect on the market price of its common stock.
Sales of substantial amounts of NMFC’s common stock, including by itself directly, AIV Holdings, if it exercises its right
to exchange its units of the Operating Company for shares of NMFC’s common stock on a one-for-one basis, or New Mountain Guardian Partners, L.P. or its transferees or the perception that such sales could occur, could materially adversely
affect the prevailing market prices for NMFC’s common stock. AIV Holdings currently intends to sell its interest in the Operating Company’s business as soon as practicable from time to time, depending on market conditions and any
applicable contractual or legal restrictions. AIV Holdings, and the Investment Adviser, if applicable with respect to any units received as payment of the incentive fee, have the right, subject to certain conditions, to require NMFC to register
under the federal securities laws the sale of any shares of NMFC’s common stock held by them or that may be issued to and held by them upon exercise by AIV Holdings of the exchange right.
In addition, NMFC has granted AIV Holdings, the Operating Company’s Chairman, an entity related to the Operating Company’s Chairman and
the Investment Adviser, if applicable with respect to any units received as payment of the incentive fee, and their permitted transferees certain “piggyback” registration rights which allow them to include their shares in any future
registrations of NMFC equity securities, whether or not that registration relates to a primary offering by NMFC or a secondary offering by or on behalf of any of NMFC’s stockholders or AIV Holdings. In particular, these parties will have
priority over NMFC and any other of its stockholders in any registration that is an underwritten offering. Any such filing or the perception that such a filing may occur, could cause the prevailing market price of NMFC’s common stock to decline
and may impact NMFC’s ability to sell equity to finance the Operating Company’s operations. If substantial amounts of NMFC’s common stock were sold, this could impair its ability to raise additional capital through the sale of
securities should NMFC desire to do so.
51
Certain provisions of NMFC’s certificate of incorporation and bylaws, the Delaware General Corporation Law
as well as other aspects of our structure, including Guardian AIV’s substantial interest in the Operating Company, could deter takeover attempts and have an adverse impact on the price of NMFC’s common stock.
NMFC’s certificate of incorporation and bylaws as well as the Delaware General Corporation Law contain provisions that may have the effect of
discouraging a third party from making an acquisition proposal for us. Among other things, NMFC’s certificate of incorporation and bylaws:
| |
Ÿ |
|
provide for a classified board of directors, which may delay the ability of NMFC’s stockholders to change the membership of a majority of its board of
directors; |
| |
Ÿ |
|
authorize the issuance of “blank check” preferred stock that could be issued by NMFC’s board of directors to thwart a takeover attempt;
|
| |
Ÿ |
|
do not provide for cumulative voting; |
| |
Ÿ |
|
provide that vacancies on the board of directors, including newly created directorships, may be filled only by a majority vote of directors then in office;
|
| |
Ÿ |
|
provide that NMFC’s directors may be removed only for cause; |
| |
Ÿ |
|
require supermajority voting to effect certain amendments to NMFC’s certificate of incorporation and bylaws; and |
| |
Ÿ |
|
require stockholders to provide advance notice of new business proposals and director nominations under specific procedures. |
These anti-takeover provisions may inhibit a change in control in circumstances that could give the holders of NMFC’s common stock the
opportunity to realize a premium over the market price for its common stock. The Credit Facilities also include covenants that, among other things, restrict its ability to dispose of assets, incur additional indebtedness, make restricted payments,
create liens on assets, make investments, make acquisitions and engage in mergers or consolidations. The Credit Facilities also include change of control provisions that accelerate the indebtedness under this facility in the event of certain change
of control events. In addition, certain aspects of our structure, including Guardian AIV’s substantial interest in the Operating Company may have the effect of discouraging a third party from making an acquisition proposal for NMFC.
Shares of NMFC’s common stock have traded at a discount from net asset value and may do so in the future.
Shares of closed-end investment companies have frequently traded at a market price that is less than the net asset value that is attributable to
those shares. In part as a result of adverse economic conditions and increasing pressure within the financial sector of which we are a part, NMFC’s common stock has at times traded below its net asset value per share since NMFC’s IPO on
May 19, 2011. NMFC’s shares could once again trade at a discount to net asset value. The possibility that NMFC’s shares of common stock may trade at a discount from net asset value over the long term is separate and distinct from the
risk that our net asset value will decrease. We cannot predict whether shares of NMFC’s common stock will trade above, at or below its net asset value. If NMFC’s common stock trades below its net asset value, we will generally not be able
to issue additional shares of NMFC’s common stock at its market price without first obtaining the approval for such issuance from our stockholders and our independent directors. If additional funds are not available to us, we could be forced to
curtail or cease the Operating Company’s new lending and investment activities, and our net asset value could decrease and our level of distributions could be impacted.
52
You may not receive dividends or our dividends may decline or may not grow over time.
We cannot assure you that we will achieve investment results or maintain a tax status that will allow or require any specified level of cash
distributions or year-to-year increases in cash distributions. In particular, our future dividends are dependent upon the investment income we receive on the Operating Company’s portfolio investments. To the extent such investment income
declines, our ability to pay future dividends may be harmed.
We will have broad discretion over the use of proceeds of any offering made pursuant
to this prospectus, to the extent it is successful.
We will have significant flexibility in applying the proceeds of any
offering made pursuant to this prospectus. We will also pay operating expenses, and may pay other expenses such as due diligence expenses of potential new investments, from net proceeds. Our ability to achieve our investment objective may be limited
to the extent that the net proceeds of the offering, pending full investment, are used to pay operating expenses. In addition, we can provide you no assurance that the current offering will be successful, or that by increasing the size of our
available equity capital our aggregate expenses, and correspondingly, our expense ratio, will be lowered.
53
CAUTIONARY STATEMENT REGARDING
FORWARD-LOOKING STATEMENTS
This prospectus contains forward-looking statements that involve substantial risks and uncertainties.
These forward-looking statements are not historical facts, but rather are based on current expectations, estimates and projections about us, the Operating Company’s current and prospective portfolio investments, our industry, our beliefs, and
our assumptions. Words such as “anticipates”, “expects”, “intends”, “plans”, “will”, “may”, “continue”, “believes”, “seeks”, “estimates”,
“would”, “could”, “should”, “targets”, “projects” or variations of these words and similar expressions are intended to identify forward-looking statements. The forward-looking statements contained in
this prospectus involve risks and uncertainties, including statements as to:
| |
Ÿ |
|
our future operating results; |
| |
Ÿ |
|
the Operating Company’s business prospects and the prospects of its portfolio companies; |
| |
Ÿ |
|
the impact of investments that the Operating Company expects to make; |
| |
Ÿ |
|
our contractual arrangements and relationships with third parties; |
| |
Ÿ |
|
the dependence of our future success on the general economy and its impact on the industries in which we invest; |
| |
Ÿ |
|
the ability of the Operating Company’s portfolio companies to achieve their objectives; |
| |
Ÿ |
|
the Operating Company’s expected financings and investments; |
| |
Ÿ |
|
the adequacy of our cash resources and working capital; and |
| |
Ÿ |
|
the timing of cash flows, if any, from the operations of the Operating Company’s portfolio companies. |
These statements are not guarantees of future performance and are subject to risks, uncertainties, and other factors, some of which are beyond our
control and difficult to predict and could cause actual results to differ materially from those expressed or forecasted in the forward-looking statements, including without limitation:
| |
Ÿ |
|
an economic downturn could impair the Operating Company’s portfolio companies’ ability to continue to operate, which could lead to the loss of some or
all of the Operating Company’s investments in such portfolio companies; |
| |
Ÿ |
|
a contraction of available credit and/or an inability to access the equity markets could impair our lending and investment activities;
|
| |
Ÿ |
|
interest rate volatility could adversely affect our results, particularly if we elect to use leverage as part of our investment strategy;
|
| |
Ÿ |
|
currency fluctuations could adversely affect the results of the Operating Company’s investments in foreign companies, particularly to the extent that we
receive payments denominated in foreign currency rather than U.S. dollars; and |
| |
Ÿ |
|
the risks, uncertainties and other factors we identify in “Risk Factors” and elsewhere in this prospectus and in our filings with the SEC.
|
Although we believe that the assumptions on which these forward-looking statements are based are reasonable, any of
those assumptions could prove to be inaccurate, and as a result, the forward-looking statements based on those assumptions also could be inaccurate. Important assumptions include the Operating Company’s ability to originate new loans and
investments, certain margins and levels of profitability and the availability of additional capital. In light of these and other uncertainties, the inclusion of a projection or forward-looking statement in this prospectus should not be regarded as
54
a representation by us that our plans and objectives will be achieved. These risks and uncertainties include those described or identified in “Risk Factors” and elsewhere in this
prospectus. You should not place undue reliance on these forward-looking statements, which apply only as of the date of this prospectus. However, we will update this prospectus to reflect any material changes to the information contained herein. The
forward-looking statements and projections contained in this prospectus are excluded from the safe harbor protection provided by Section 27A of the Securities Act.
55
USE OF PROCEEDS
The Operating Company intends to use the net proceeds from the sale of NMFC’s common stock pursuant to this prospectus for new
investments in portfolio companies in accordance with the Operating Company’s investment objective and strategies described in this prospectus, to temporarily repay indebtedness (which will be subject to reborrowing), to pay our operating
expenses, to pay distributions to our stockholders/unit holders and for general corporate purposes. The Operating Company is continuously identifying, reviewing and, to the extent consistent with its investment objective, funding new investments. As
a result, we typically raise capital as we deem appropriate to fund such new investments. The supplement to this prospectus relating to an offering will more fully identify the use of the proceeds from such offering.
We estimate that it will take less than six months for the Operating Company to substantially invest the net proceeds of any offering made pursuant
to this prospectus, depending on the availability of attractive opportunities, market conditions and the amount raised. However, we can offer no assurance that we will be able to achieve this goal.
Proceeds not immediately used for new investments or the temporary repayment of debt will be invested primarily in cash, cash equivalents, U.S.
government securities and other high-quality investments that mature in one year or less from the date of investment. These temporary investments are expected to provide a lower net return than we hope to achieve from the Operating Company’s
target investments.
We will not receive any proceeds from any sale of common stock by the selling stockholders identified under
“Selling Stockholders”.
56
PRICE RANGE OF COMMON STOCK AND DISTRIBUTIONS
NMFC’s common stock is traded on the New York Stock Exchange (“NYSE”) under the symbol “NMFC”. The
following table sets forth the net asset value (“NAV”) per share of NMFC’s common stock, the high and low closing sale price for NMFC’s common stock, the closing sale price as a percentage of NAV and the quarterly dividend
distributions per share for each fiscal quarter since NMFC’s IPO on May 19, 2011.
|
|
|
|
|
|
|
|
|
|
|
|
|
|
|
|
|
|
|
|
|
|
|
|
|
| Fiscal Year Ended |
|
NAV
Per Share(2) |
|
|
Closing Sales
Price(4) |
|
|
Premium or
Discount of
High Sales to
NAV(5) |
|
|
Premium or
Discount of
Low Sales to
NAV(5) |
|
|
Declared
Dividends
Per Share(6) |
|
| |
|
High |
|
|
Low |
|
|
|
|
| December 31, 2012 |
|
|
|
|
|
|
|
|
|
|
|
|
|
|
|
|
|
|
|
|
|
|
|
|
| Third Quarter(1) |
|
|
* |
|
|
$ |
14.91 |
|
|
$ |
14.77 |
|
|
|
* |
|
|
|
* |
|
|
|
* |
|
| Second Quarter |
|
|
* |
|
|
$ |
14.29 |
|
|
$ |
13.28 |
|
|
|
* |
|
|
|
* |
|
|
$ |
0.57 |
(8) |
| First Quarter |
|
$ |
14.05 |
|
|
$ |
13.75 |
|
|
$ |
13.14 |
|
|
|
-2.14 |
% |
|
|
-6.48 |
% |
|
$ |
0.32 |
|
| December 31, 2011(2) |
|
|
|
|
|
|
|
|
|
|
|
|
|
|
|
|
|
|
|
|
|
|
|
|
| Fourth Quarter |
|
$ |
13.60 |
|
|
$ |
13.41 |
|
|
$ |
12.27 |
|
|
|
-1.40 |
% |
|
|
-9.78 |
% |
|
$ |
0.30 |
|
| Third Quarter |
|
$ |
13.32 |
|
|
$ |
13.37 |
|
|
$ |
10.77 |
|
|
|
0.38 |
% |
|
|
-19.14 |
% |
|
$ |
0.29 |
|
| Second Quarter(7) |
|
$ |
14.25 |
|
|
$ |
13.55 |
|
|
$ |
12.35 |
|
|
|
-4.91 |
% |
|
|
-13.33 |
% |
|
$ |
0.27 |
|
| (1) |
Period from July 1, 2012 through July 6, 2012. |
| (2) |
NMFC was not unitized until the IPO date of May 19, 2011. |
| (3) |
NAV is determined as of the last date in the relevant quarter and therefore may not reflect the NAV per share on the date of the high and low sales prices. The NAVs shown are
based on outstanding shares at the end of each period. |
| (4) |
Closing sales price is determined as the high or low closing sales price noted within the respective quarter, not adjusted for dividends. |
| (5) |
Calculated as of the respective high or low sales price divided by the quarter end NAV. |
| (6) |
Represents the dividend paid for the specified quarter. |
| (7) |
Period from May 19, 2011 through June 30, 2011 (excludes IPO price of $13.75). |
| (8) |
Includes a special dividend of $0.23 per share payable on May 31, 2012 and a second quarter dividend of $0.34 per share payable on June 29, 2012. |
| * |
Not determinable at the time of filing. |
On July 6,
2012, the last reported sales price of NMFC’s common stock was $14.91 per share. As of March 31, 2012, the Operating Company had two record holders, which were NMFC and AIV Holdings, whereas NMFC had approximately 22 stockholders of record
and approximately four beneficial owners whose shares are held in the names of brokers, dealers, funds, trusts and clearing agencies. The Operating Company is not a publicly traded entity.
Shares of BDCs may trade at a market price that is less than the value of the net assets attributable to those shares. The possibility that
NMFC’s shares of common stock will trade at a discount from net asset value or at premiums that are unsustainable over the long term are separate and distinct from the risk that our net asset value will decrease. Since NMFC’s initial
public offering on May 19, 2011, NMFC’s shares of common stock have traded at times at a discount to the net assets attributable to those shares. As of July 6, 2012, NMFC’s shares of common stock traded at a premium of approximately
6.12% of the net asset value attributable to those shares as of March 31, 2012. It is not possible to predict whether the shares offered hereby will trade at, above, or below net asset value.
Since NMFC is a holding company, distributions will be paid on NMFC’s common stock from distributions received from the Operating Company. The
Operating Company intends to make distributions to its unit holders that will be sufficient to enable NMFC to pay quarterly distributions to NMFC’s stockholders and to obtain and maintain NMFC’s status as a regulated investment company.
57
NMFC intends to distribute approximately its entire portion of the Operating Company’s Adjusted Net Investment Income on a quarterly basis and substantially its entire portion of the
Operating Company’s taxable income on an annual basis, except that they may retain certain net capital gains for reinvestment.
NMFC has adopted an “opt out” dividend reinvestment plan on behalf of its stockholders, whereas NMFC stockholders’ cash dividends
will be automatically reinvested in additional shares of NMFC’s common stock, unless the stockholder elects to receive cash. Cash dividends reinvested in additional shares of NMFC’s common stock will be automatically reinvested by NMFC
into additional units of the Operating Company.
NMFC applies the following in implementing the dividend reinvestment plan. If the price
at which newly issued shares are to be credited to stockholders’ accounts is greater than 110.0% of the last determined net asset value of the shares, NMFC will use only newly issued shares to implement its dividend reinvestment plan. Under
such circumstances, the number of shares to be issued to a stockholder is determined by dividing the total dollar amount of the distribution payable to such stockholder by the market price per share of NMFC’s common stock on the NYSE on the
distribution payment date. Market price per share on that date will be the closing price for such shares on the NYSE or, if no sale is reported for such day, the average of their electronically reported bid and asked prices. If NMFC uses newly
issued shares to implement the plan, NMFC will receive, on a one-for-one basis, additional units of the Operating Company in exchange for cash distributions that are reinvested in shares of NMFC’s common stock under the dividend reinvestment
plan.
If the price at which newly issued shares are to be credited to stockholders’ accounts is less than 110.0% of the last
determined net asset value of the shares, NMFC will either issue new shares or instruct the plan administrator to purchase shares in the open market to satisfy the additional shares required. Shares purchased in open market transactions by the plan
administrator will be allocated to a stockholder based on the average purchase price, excluding any brokerage charges or other charges, of all shares of common stock purchased in the open market. The number of shares of NMFC’s common stock to
be outstanding after giving effect to payment of the distribution cannot be established until the value per share at which additional shares will be issued has been determined and elections of NMFC’s stockholders have been tabulated.
The following table reflects the cash distributions, including dividends and returns of capital, if any, per unit/share that have been
declared by the Operating Company’s board of directors, and subsequently NMFC’s board of directors, since NMFC’s IPO:
|
|
|
|
|
|
|
|
|
| Date Declared |
|
Record Date |
|
Payment Date |
|
Amount |
|
| May 8, 2012 |
|
June 15, 2012 |
|
June 29, 2012 |
|
$ |
0.34 |
|
| May 8, 2012(1) |
|
May 21, 2012 |
|
May 31, 2012 |
|
|
0.23 |
|
| March 7, 2012 |
|
March 15, 2012 |
|
March 30, 2012 |
|
|
0.32 |
|
| November 8, 2011 |
|
December 15, 2011 |
|
December 30, 2011 |
|
|
0.30 |
|
| August 10, 2011 |
|
September 15, 2011 |
|
September 30, 2011 |
|
|
0.29 |
|
| August 10, 2011 |
|
August 22, 2011 |
|
August 31, 2011 |
|
|
0.27 |
|
|
|
|
|
|
|
|
|
|
| Total |
|
|
|
|
|
$ |
1.75 |
|
|
|
|
|
|
|
|
|
|
| (1) |
Special dividend related to estimated realized capital gains attributable to the Operating Company’s investments in Lawson Software, Inc. and Infor Lux Bond Company.
|
Tax characteristics of all dividends paid by NMFC are reported to stockholders on Form 1099 after the end of the
calendar year. Future quarterly dividends, if any, for the New Mountain Finance Entities will be determined by their respective board of directors.
58
MANAGEMENT’S DISCUSSION AND ANALYSIS OF
FINANCIAL CONDITION AND RESULTS OF OPERATIONS
The information contained in this section should be read in conjunction with the Selected Financial and Other Data and our Financial Statements and notes thereto appearing elsewhere in this prospectus. In
addition to historical information, the following discussion and other parts of this prospectus contain forward-looking information that involves risks and uncertainties. Our actual results could differ materially from those anticipated by such
forward-looking information due to the factors discussed under “Risk Factors” and “Cautionary Statement Regarding Forward-Looking Statements” appearing elsewhere in this prospectus.
Overview
The Operating
Company is a Delaware limited liability company. The Operating Company is externally managed and has elected to be treated as a BDC under the 1940 Act. As such, the Operating Company is obligated to comply with certain regulatory requirements. The
Operating Company intends to be treated as a partnership for federal income tax purposes for so long as it has at least two members.
The Operating Company is externally managed by the Investment Adviser. The Administrator provides the administrative services necessary for
operations. The Investment Adviser and Administrator are wholly-owned subsidiaries of New Mountain Capital. New Mountain Capital is a firm with a track record of investing in the middle market and with assets under management (which includes amounts
committed, not all of which have been drawn down and invested to date) totaling approximately $9.0 billion as of March 31, 2012 and December 31, 2011. New Mountain Capital focuses on investing in defensive growth companies across its
private equity, public equity, and credit investment vehicles. The Operating Company, formerly known as New Mountain Guardian (Leveraged), L.L.C., was originally formed as a subsidiary of Guardian AIV by New Mountain Capital in October 2008.
Guardian AIV was formed through an allocation of approximately $300.0 million of the $5.1 billion of commitments supporting New Mountain Partners III, L.P., a private equity fund managed by New Mountain Capital. In February 2009, New
Mountain Capital formed a co-investment vehicle, New Mountain Guardian Partners, L.P., comprising $20.4 million of commitments.
NMFC is a Delaware corporation that was originally incorporated on June 29, 2010. NMFC is a closed-end, non-diversified management investment
company that has elected to be treated as a BDC under the 1940 Act. As such, NMFC is obligated to comply with certain regulatory requirements. NMFC intends to be treated, and intends to comply with the requirements to qualify annually, as a RIC
under Subchapter M of the Code commencing with its taxable year ending on December 31, 2011.
AIV Holdings is a Delaware
corporation that was originally incorporated on March 11, 2011. Guardian AIV, a Delaware limited partnership, is AIV Holdings’ sole stockholder. AIV Holdings is a closed-end, non-diversified management investment company that has elected
to be treated as a BDC under the 1940 Act. As such, AIV Holdings is obligated to comply with certain regulatory requirements. AIV Holdings intends to be treated, and intends to comply with the requirements to qualify annually, as a RIC under the
Code commencing with its taxable year ending on December 31, 2011.
On May 19, 2011, NMFC priced its IPO of 7,272,727 shares of
common stock at a public offering price of $13.75 per share. Concurrently with the closing of the IPO and at the public offering price of $13.75 per share, NMFC sold an additional 2,172,000 shares of its common stock to certain executives and
employees of, and other individuals affiliated with, New Mountain Capital in the Concurrent Private Placement. Additionally, 1,252,964 shares were issued to the partners of New Mountain Guardian Partners, L.P. at that time for their ownership
interest in the Predecessor Entities. In connection with
59
NMFC’s IPO and through a series of transactions, the Operating Company owns all of the operations of the Predecessor Entities, including all of the assets and liabilities related to such
operations.
NMFC and AIV Holdings are holding companies with no direct operations of their own, and their sole asset is their ownership
in the Operating Company. NMFC and AIV Holdings each entered into a joinder agreement with respect to the Limited Liability Company Agreement, as amended and restated, of the Operating Company, pursuant to which NMFC and AIV Holdings were admitted
as members of the Operating Company. NMFC acquired from the Operating Company, with the gross proceeds of the IPO and the Concurrent Private Placement, units of the Operating Company (the number of units are equal to the number of shares of
NMFC’s common stock sold in the IPO and the Concurrent Private Placement). Additionally, NMFC received units of the Operating Company equal to the number of shares of common stock of NMFC issued to the partners of New Mountain Guardian
Partners, L.P. Guardian AIV was the parent of the Operating Company prior to the IPO and, as a result of the transactions completed in connection with the IPO, obtained units in the Operating Company. Guardian AIV contributed its units in the
Operating Company to its newly formed subsidiary, AIV Holdings, in exchange for common stock of AIV Holdings. AIV Holdings has the right to exchange all or any portion of its units in the Operating Company for shares of NMFC’s common stock on a
one-for-one basis.
As of March 31, 2012 and December 31, 2011, NMFC and AIV Holdings owned approximately 34.6% and 65.4%,
respectively, of the units of the Operating Company.
The current structure was designed to generally prevent NMFC and its stockholders
from being allocated taxable income with respect to unrecognized gains that existed at the time of the IPO in the Predecessor Entities’ assets, and rather such amounts would be allocated generally to AIV Holdings and its stockholders. The
result is that any distributions made to NMFC’s stockholders that are attributable to such gains generally will not be treated as taxable dividends but rather as return of capital.
60
The diagram below depicts our current organizational structure.

Our investment objective is to generate current income and capital appreciation through the sourcing and
origination of debt securities at all levels of the capital structure, including first and second lien debt, notes, bonds and mezzanine securities. In some cases, our investments may also include equity interests. The primary focus is in the debt of
defensive growth companies, which are defined as generally exhibiting the following characteristics: (i) sustainable secular growth drivers, (ii) high barriers to competitive entry, (iii) high free cash flow after capital expenditure
and working capital needs, (iv) high returns on assets and (v) niche market dominance.
As of March 31, 2012, the
Operating Company’s net asset value was $434.3 million and its portfolio had a fair value of approximately $758.2 million in 57 portfolio companies, with a weighted average Unadjusted and Adjusted Yield to Maturity of approximately 10.6%
and 12.8%, respectively. “Adjusted Yield to Maturity” assumes that the investments in the Operating Company’s portfolio are purchased at fair value on March 31, 2012 and held until their respective maturities with no prepayments
or losses and exited at par at maturity. This calculation excludes the impact of existing leverage, except for the non-recourse debt of NMF SLF. NMF SLF is treated as a fully levered asset of the Operating Company, with NMF SLF’s net asset
value being included for yield calculation purposes. The actual yield to maturity may be higher or lower due to the future selection of the LIBOR contracts
61
by the individual companies in the Operating Company’s portfolio or other factors. References to “Unadjusted Yield to Maturity” have the same assumptions as Adjusted Yield to
Maturity except that NMF SLF is not treated as a fully levered asset of the Operating Company, but rather the assets themselves are consolidated into the Operating Company.
As of December 31, 2011, the Operating Company’ net asset value was $420.5 million and its portfolio had a fair value of approximately $703.5 million in 55 portfolio companies, with a weighted
average Unadjusted and Adjusted Yield to Maturity of approximately 10.7% and 13.1%, respectively. “Adjusted Yield to Maturity” assumes that the investments in the Operating Company’s portfolio are purchased at fair value on
December 31, 2011 and held until their respective maturities with no prepayments or losses and exited at par at maturity. This calculation excludes the impact of existing leverage, except for the non-recourse debt of NMF SLF. NMF SLF is treated
as a fully levered asset of the Operating Company, with NMF SLF’s net asset value being included for yield calculation purposes. The actual yield to maturity may be higher or lower due to the future selection of LIBOR contracts by the
individual companies in the Operating Company’s portfolio or other factors. References to “Unadjusted Yield to Maturity” have the same assumptions as Adjusted Yield to Maturity except that NMF SLF is not treated as a fully levered
asset of the Operating Company, but rather the assets themselves are consolidated into the Operating Company.
Recent Developments
On May 8, 2012, the Operating Company’s board of directors, and subsequently NMFC’s board of directors, declared a
second quarter 2012 distribution of $0.34 per unit/share payable on June 29, 2012 to holders of record as of June 15, 2012.
On May 8, 2012, the Operating Company’s board of directors, and subsequently NMFC’s board of directors, declared a special
distribution of $0.23 per unit/share payable on May 31, 2012 to holders of record as of May 21, 2012 related to estimated realized capital gains attributable to the Operating Company’s investments in Lawson Software, Inc. and Infor
Lux Bond Company. As of this record date, NMFC and AIV Holdings will own 10,697,691 units and 20,221,938 units, respectively, of the Operating Company and will receive a total dividend of $2.5 million and $4.6 million, respectively.
On May 8, 2012, the Operating Company entered into a sixth amendment to the Holdings Credit Facility. This amendment
lowered the applicable interest rate spread by 0.25% to 2.75% from 3.00% and extended the maturity date by one year to October 27, 2016.
On May 8, 2012, NMF SLF entered into a ninth amendment to the SLF Credit Facility. This amendment lowered the applicable interest rate spread by 0.25% to 2.00% from 2.25% and extended the maturity date by
one year to October 27, 2016.
Critical Accounting Policies
The preparation of financial statements and related disclosures in conformity with GAAP requires management to make estimates and assumptions that
affect the reported amounts of assets and liabilities, disclosure of contingent assets and liabilities at the date of the financial statements, and revenues and expenses during the periods reported. Actual results could materially differ from those
estimates. We have identified the following items as critical accounting policies.
62
Basis of Accounting
The Operating Company consolidates its wholly-owned subsidiary, NMF SLF. NMFC does not consolidate the Operating Company. NMFC applies investment company master-feeder financial statement presentation, as described
in Accounting Standards Codification 946, Financial Services—Investment Companies, (“ASC 946”) to its interest in the Operating Company. NMFC observes that it is industry practice to follow the presentation prescribed for a
Master Fund-Feeder fund structure in ASC 946 in instances in which a Master Fund is owned by more than one feeder fund and that such presentation provides stockholders of NMFC with a clearer depiction of their investment in the Master Fund.
Valuation and Leveling of Portfolio Investments
The Operating Company conducts the valuation of assets, pursuant to which its net asset value, and, consequently, NMFC’s net asset value is determined, at all times consistent with GAAP and the 1940 Act.
The Operating Company values its assets on a quarterly basis, or more frequently if required under the 1940 Act. In all cases, the
Operating Company’s board of directors is ultimately and solely responsible for determining the fair value of its portfolio investments on a quarterly basis in good faith, including investments that are not publicly traded, those whose market
prices are not readily available, and any other situation where its portfolio investments require a fair value determination. Security transactions are accounted for on a trade date basis. The Operating Company’s quarterly valuation procedures
are set forth in more detail below:
(1) Investments for which market quotations are readily available on an exchange are
valued at such market quotations based on the closing price indicated from independent pricing services.
(2) Investments
for which indicative prices are obtained from various pricing services and/or brokers or dealers are valued through a multi-step valuation process, as described below, to determine whether the quote(s) obtained is representative of fair value in
accordance with GAAP.
a. Bond quotes are obtained through independent pricing services. Analytics are performed by the
investment professionals of the Investment Adviser to ensure that the quote obtained is representative of fair value in accordance with GAAP and if so, the quote is used. If the Investment Adviser is unable to sufficiently validate the quote(s)
internally and if the investment’s par value exceeds the materiality threshold, the investment is valued similarly to those assets with no readily available quotes (see (3) below); and
b. For investments other than bonds, the investment professionals of the Investment Adviser look at the number of quotes readily
available and perform the following:
i. Investments for which more than two quotes are received from a pricing service
are valued using the mean of the mean of the bid and ask of the quotes obtained;
ii. Investments for which one or two
quotes are received from a pricing service are validated internally. The investment professionals of the Investment Adviser analyze the market quotes obtained using an array of valuation methods (further described below) to validate the fair value.
If the Investment Adviser is unable to sufficiently validate the quote(s) internally and if the investment’s par value exceeds the materiality threshold, the investment is valued similarly to those assets with no readily available quotes (see
(3) below).
(3) Investments for which quotations are not readily available through exchanges, pricing services,
brokers, or dealers are valued through a multi-step valuation process:
a. Each portfolio company or investment is
initially valued by the investment professionals of the Investment Adviser responsible for the credit monitoring;
63
b. Preliminary valuation conclusions will then be documented and discussed with the
Operating Company’s senior management;
c. If an investment falls into (3) above for four consecutive quarters
and if the investment’s par value exceeds the materiality threshold, then at least once each fiscal year, the valuation for each portfolio investment for which the investment professionals of the Investment Adviser do not have a readily
available market quotation will be reviewed by an independent valuation firm engaged by the Operating Company’s board of directors; and
d. Also, when deemed appropriate by the Operating Company’s management, an independent valuation firm may be engaged to review and value investment(s) of a portfolio company, without any preliminary valuation
being performed by the Investment Adviser. The investment professionals of the Investment Adviser will review and validate the value provided.
Valuation methods may include comparisons of financial ratios of the portfolio companies that issued such private securities to peer companies that are public, the nature of and the realizable value of any
collateral, the portfolio company’s earnings, discounted cash flows, the ability to make payments, the markets in which the portfolio company conducts business, and other relevant factors, including available market data such as relevant and
applicable market trading and transaction comparables; applicable market yields and multiples; security covenants; call protection provisions; information rights; comparable merger and acquisition transactions; and the principal market and
enterprise values. When an external event such as a purchase transaction, public offering or subsequent sale occurs, we will consider the pricing indicated by the external event to corroborate the private valuation.
The values assigned to investments are based upon available information and do not necessarily represent amounts which might ultimately be
realized, since such amounts depend on future circumstances and cannot be reasonably determined until the individual positions are liquidated. Due to the inherent uncertainty of determining the fair value of investments that do not have a readily
available market value, the fair value of certain investments may fluctuate from period to period.
GAAP fair value measurement guidance
classifies the inputs used in measuring fair value into three levels as follows:
Level I—Quoted prices
(unadjusted) are available in active markets for identical investments and the Operating Company has the ability to access such quotes as of the reporting date. The type of investments which would generally be included in Level I include active
exchange-traded equity securities and exchange-traded derivatives. As required by Accounting Standards Codification 820, Fair Value Measurements and Disclosures (“ASC 820”), the Operating Company, to the extent that we hold
such investments, does not adjust the quoted price for these investments, even in situations where the Operating Company holds a large position and a sale could reasonably impact the quoted price.
Level II—Pricing inputs are observable for the investments, either directly or indirectly, as of the reporting date, but
are not the same as those used in Level I. Level II inputs include the following:
| |
Ÿ |
|
Quoted prices for similar assets or liabilities in active markets; |
| |
Ÿ |
|
Quoted prices for identical or similar assets or liabilities in non-active markets (examples include corporate and municipal bonds, which trade infrequently);
|
| |
Ÿ |
|
Pricing models whose inputs are observable for substantially the full term of the asset or liability (examples include most over-the-counter derivatives,
including foreign exchange forward contracts); and |
| |
Ÿ |
|
Pricing models whose inputs are derived principally from or corroborated by observable market data through correlation or other means for substantially the full
term of the asset or liability. |
64
Level III—Pricing inputs are unobservable for the investment and include
situations where there is little, if any, market activity for the investment.
The inputs into the determination of fair value require
significant judgment or estimation by management. A review of the fair value hierarchy classifications is conducted on a quarterly basis. Changes in the observability of valuation inputs may result in the reclassification of certain investments
within the fair value hierarchy from period to period.
The following table summarizes the levels in the fair value hierarchy that the
Operating Company’s portfolio investments fall into as of March 31, 2012:
|
|
|
|
|
|
|
|
|
|
|
|
|
|
|
|
|
| (in thousands) |
|
|
|
|
|
|
|
|
|
|
|
|
|
|
|
|
|
| |
|
Total |
|
|
Level I |
|
|
Level II |
|
|
Level III |
|
| First lien |
|
$ |
426,983 |
|
|
$ |
— |
|
|
$ |
376,414 |
|
|
$ |
50,569 |
|
| Second lien |
|
|
275,333 |
|
|
|
— |
|
|
|
232,078 |
|
|
|
43,255 |
|
| Subordinated |
|
|
53,052 |
|
|
|
— |
|
|
|
46,481 |
|
|
|
6,571 |
|
| Equity and other |
|
|
2,850 |
|
|
|
— |
|
|
|
— |
|
|
|
2,850 |
|
|
|
|
|
|
|
|
|
|
|
|
|
|
|
|
|
|
| Total investments |
|
$ |
758,218 |
|
|
$ |
— |
|
|
$ |
654,973 |
|
|
$ |
103,245 |
|
|
|
|
|
|
|
|
|
|
|
|
|
|
|
|
|
|
The following table summarizes the levels in the fair value hierarchy that the Operating Company’s portfolio
investments fall into as of December 31, 2011:
|
|
|
|
|
|
|
|
|
|
|
|
|
|
|
|
|
| (in thousands) |
|
|
|
|
|
|
| |
|
Total |
|
|
Level I |
|
|
Level II |
|
|
Level III |
|
| First lien |
|
$ |
410,314 |
|
|
$ |
— |
|
|
$ |
377,173 |
|
|
$ |
33,141 |
|
| Second lien |
|
|
262,701 |
|
|
|
— |
|
|
|
214,296 |
|
|
|
48,405 |
|
| Subordinated |
|
|
27,649 |
|
|
|
— |
|
|
|
21,078 |
|
|
|
6,571 |
|
| Equity and other |
|
|
2,850 |
|
|
|
— |
|
|
|
— |
|
|
|
2,850 |
|
|
|
|
|
|
|
|
|
|
|
|
|
|
|
|
|
|
| Total investments |
|
$ |
703,514 |
|
|
$ |
— |
|
|
$ |
612,547 |
|
|
$ |
90,967 |
|
|
|
|
|
|
|
|
|
|
|
|
|
|
|
|
|
|
NMFC is a holding company with no direct operations of its own, and its sole asset is its ownership in the
Operating Company. NMFC’s investments in the Operating Company are carried at fair value and represent the pro-rata interest in the net assets of the Operating Company as of the applicable reporting date. NMFC values its ownership interest on a
quarterly basis, or more frequently if required under the 1940 Act.
The Operating Company generally uses the following framework when
determining the fair value of investments where there is little, if any, market activity or observable pricing inputs.
Company
Performance, Financial Review, and Analysis: Prior to investment, as part of its due diligence process, the Operating Company evaluates the overall performance and financial stability of the portfolio company. Post
investment, the Operating Company analyzes each portfolio company’s current operating performance and relevant financial trends versus prior year and budgeted results, including, but not limited to, factors affecting its revenue and earnings
before interest, taxes, depreciation, and amortization (“EBITDA”) growth, margin trends, liquidity position, covenant compliance and changes to its capital structure. The Operating Company also attempts to identify and subsequently track
any developments at the portfolio company, within its customer or vendor base or within the industry or the macroeconomic environment, generally that may alter any material element of its original investment thesis. This analysis is specific to each
portfolio company. The Operating Company leverages the knowledge gained from its original due diligence process, augmented by this subsequent monitoring, to continually refine its outlook for each of its portfolio companies and ultimately form the
valuation of its investment in each portfolio company.
65
Market Based Approach: The Operating Company typically estimates the
total enterprise value of each portfolio company by utilizing market value cash flow (EBITDA) multiples of publicly traded comparable companies. The Operating Company carefully considers numerous factors when selecting the appropriate companies
whose trading multiples are used to value its portfolio companies. These factors include, but are not limited to, the type of organization, similarity to the business being valued, relevant risk factors, as well as size, profitability and growth
expectations. The Operating Company generally applies an average of various relevant comparable company EBITDA multiples to the portfolio company’s latest twelve month (“LTM”) EBITDA or projected EBITDA to calculate portfolio company
enterprise value. This is done in order to ensure that there is an appropriate level of value coverage for each investment. In applying the market based approach as of March 31, 2012, the Operating Company used a range of 3.5x to 9.0x relevant
EBITDA to determine the enterprise value of its investments. The Operating Company believes this was a reasonable range in light of current comparable company trading levels and the specific companies involved.
Income Based Approach: The Operating Company also typically uses a discounted cash flow analysis to estimate the fair
value of the investment. Projected cash flows represent the relevant security’s contractual interest, fee and principal payments plus the assumption of full principal recovery at the investment’s expected maturity date. These cash flows
are discounted at a rate established utilizing a yield calibration approach, which incorporates changes in the credit quality (as measured by relevant statistics) of the portfolio company, as compared to changes in the yield associated with
comparable credit quality market indices, between the date of origination and the valuation date. In applying the income based approach as of March 31, 2012, the Operating Company used a discount range of 6.3% to 23.4% to value its investments.
Revenue Recognition
The
Operating Company’s revenue recognition policies are as follows:
Sales and paydowns of
investments: Realized gains and losses on investments are determined on the specific identification method.
Interest income: Interest income, including amortization of premium and discount using the effective interest method, is recorded on the accrual basis and periodically assessed for
collectability. Interest income also includes interest earned from cash on hand. Upon the prepayment of a loan or debt security, any prepayment penalties are recorded as part of interest income. The Operating Company has loans in the portfolio that
contain a PIK provision. PIK represents interest that is accrued and recorded as interest income at the contractual rates, added to the loan principal on the respective capitalization dates, and generally due at maturity.
Non-accrual income: Loans are placed on non-accrual status when principal or interest payments are
past due 30 days or more and when there is reasonable doubt that principal or interest will be collected. Accrued cash and un-capitalized PIK interest is generally reversed when a loan is placed on non-accrual status. Previously capitalized PIK
interest was not reversed when an investment was placed on non-accrual status. Interest payments received on non-accrual loans may be recognized as income or applied to principal depending upon management’s judgment of the ultimate outcome.
Non-accrual loans are restored to accrual status when past due principal and interest is paid and, in management’s judgment, are likely to remain current.
Other income: Other income represents delayed compensation, consent or amendment fees, revolver fees and other miscellaneous fees received. Delayed compensation is income earned from
counterparties on trades that do not settle within a set number of business days after trade date. Other income may also include fees from bridge loans. The Operating Company may from time to time enter into bridge financing commitments, an
obligation to provide interim financing to a counterparty until permanent credit can be obtained. These commitments are short-term in nature and may expire unfunded. A fee is received by the Operating Company for providing such financing.
66
NMFC’s revenue recognition policy is as follows:
Revenue, expenses, and capital gains (losses): At each quarterly valuation date, the Operating
Company’s investment income, expenses, net realized gains (losses), and net increase (decrease) in unrealized appreciation (depreciation) are allocated to NMFC based on its pro-rata interest in the net assets of the Operating Company. This is
recorded on NMFC’s Statements of Operations. NMFC used the proceeds from its IPO and Concurrent Private Placement to purchase units in the Operating Company at $13.75 per unit (its IPO price per share). At the IPO date, $13.75 per unit
represented a discount to the actual net asset value per unit of the Operating Company. As a result, NMFC experienced immediate unrealized appreciation on its investment.
All expenses are paid and recorded by the Operating Company. Expenses are allocated to NMFC based on pro-rata ownership interest. In
addition, the Operating Company paid all of the offering costs related to the IPO. NMFC has recorded its portion of the offering costs as a direct reduction to net assets and the cost of its investment in the Operating Company.
With respect to the expenses incident to any registration of shares of NMFC’s common stock issued in exchange for AIV
Holdings’ units of the Operating Company, AIV Holdings is directly responsible for the expenses of any demand registration (including underwriters’ discounts or commissions) and their pro-rata share of any “piggyback”
registration expenses. No shares have been exchanged since formation.
Monitoring of Portfolio Investments
The Operating Company monitors the performance and financial trends of its portfolio companies on at least a quarterly basis. The Operating Company
attempts to identify any developments at the portfolio company or within the industry or the macroeconomic environment that may alter any material element of its original investment strategy.
The Operating Company uses an investment rating system to characterize and monitor the credit profile and expected level of returns on each
investment in the portfolio. The Operating Company uses a four-level numeric rating scale as follows:
| |
Ÿ |
|
Investment Rating 1—Investment is performing materially above expectations; |
| |
Ÿ |
|
Investment Rating 2—Investment is performing materially in-line with expectations. All new loans are rated 2 at initial purchase;
|
| |
Ÿ |
|
Investment Rating 3—Investment is performing materially below expectations and risk has increased materially since the original investment; and
|
| |
Ÿ |
|
Investment Rating 4—Investment is performing substantially below expectations and risks have increased substantially since the original investment. Payments
may be delinquent. There is a meaningful possibility that the Operating Company will not recoup its original cost basis in the investment and may realize a substantial loss upon exit. |
As of March 31, 2012 and December 31, 2011, all investments in the Operating Company’s portfolio had an Investment Rating of 1 or 2 with the
exception of one investment. As of March 31, 2012 and December 31, 2011, the Operating Company’s original first lien position in ATI Acquisition Company had an Investment Rating of 4 due to the underlying business encountering significant
regulatory headwinds which have led to the portfolio company’s underperformance. At March 31, 2012 and December 31, 2011, the Operating Company’s original first lien position in ATI Acquisition Company was also on non-accrual status due to
the inability of the portfolio company to service its interest payments for the quarters then ended and uncertainty about its ability to pay such amounts in the future.
67
As of March 31, 2012, this first lien debt investment had a cost basis of $4.3 million, a fair value
of $0.4 million and total unearned interest income of $0.1 million for the quarter then ended. Additionally, the Operating Company has two super priority first lien debt investments in ATI Acquisition Company with a combined cost basis of $1.6
million and a combined fair value of $1.8 million as of March 31, 2012. Unrealized gains include a fee that the Operating Company would receive upon maturity of the two super priority first lien debt investments. Neither super priority first lien
positions are on non-accrual status. As of March 31, 2012, the Operating Company’s total investment in ATI Acquisition Company had an aggregate cost basis of $5.9 million and an aggregate fair value of $2.2 million.
As of December 31, 2011, this first lien debt investment had a cost basis of $4.4 million and a fair value of $0.8 million.
Additionally, the Operating Company has two super priority first lien debt investments in ATI Acquisition Company with a combined cost basis and fair value of $1.6 million as of December 31, 2011. Neither super priority first lien
positions are on non-accrual status. As of December 31, 2011, the Operating Company’s total investment in ATI Acquisition Company had an aggregate cost basis of $5.9 million and an aggregate fair value of $2.4 million.
Portfolio and Investment Activity
The fair value of the Operating Company’s investments was approximately $758.2 million in 57 portfolio companies at March 31, 2012, $703.5 million in 55 portfolio companies at December 31, 2011,
$441.1 million in 43 portfolio companies at December 31, 2010 and $320.5 million in 24 portfolio companies at December 31, 2009. For the three months ended March 31, 2012, the Operating Company made approximately $106.7 million
of new investments in 11 portfolio companies. For the three months ended March 31, 2011, the Operating Company made approximately $87.3 million of new investments in 11 portfolio companies. For the year ended December 31, 2011, the Operating
Company made approximately $493.3 million of new investments in 37 portfolio companies. For the year ended December 31, 2010, the Operating Company made approximately $332.7 million of new investments in 34 portfolio companies. For
the year ended December 31, 2009, the Operating Company made approximately $268.4 million of new investments in 29 portfolio companies.
For the three months ended March 31, 2012, the Operating Company had approximately $22.9 million in debt repayments in existing portfolio companies and sales of securities in nine portfolio companies aggregating
approximately $48.8 million. In addition, during the three months ended March 31, 2012, the Operating Company had a change in unrealized appreciation on 39 portfolio companies totaling approximately $15.4 million, which was offset by a change
in unrealized depreciation on 23 portfolio companies totaling approximately $2.7 million. For the three months ended March 31, 2011, the Operating Company had approximately $51.4 million in debt repayments in existing portfolio companies and sales
of securities in four portfolio companies aggregating approximately $25.9 million. During the three months ended March 31, 2011, the Operating Company had a change in unrealized appreciation on 31 portfolio companies totaling approximately $7.4
million, which was offset by a change in unrealized depreciation on 17 portfolio companies totaling approximately $6.3 million.
For the
year ended December 31, 2011, the Operating Company had approximately $146.4 million in debt repayments in existing portfolio companies and sales of securities in 17 portfolio companies aggregating approximately $85.6 million. In
addition, during the year ended December 31, 2011, the Operating Company had a change in unrealized appreciation on 17 portfolio companies totaling approximately $6.1 million, which was offset by a change in unrealized depreciation on 48
portfolio companies totaling approximately $29.2 million. For the year ended December 31, 2010, the Operating Company had approximately $40.3 million in debt repayments in existing portfolio companies and sales of securities in 16
portfolio companies aggregating approximately $217.9 million. During the year ended December 31, 2010, the Operating Company had a change in unrealized
68
appreciation on 36 portfolio companies totaling approximately $13.0 million, which was offset by a change in unrealized depreciation on 18 portfolio companies totaling approximately
$53.0 million. For the year ended December 31, 2009, the Operating Company had approximately $10.1 million in debt repayments in existing portfolio companies and sales of securities in 12 portfolio companies aggregating approximately
$115.3 million. During the year ended December 31, 2009, the Operating Company had a change in unrealized appreciation on 21 portfolio companies totaling approximately $69.3 million, which was offset by a change in unrealized
depreciation on four portfolio companies totaling approximately $1.2 million.
At March 31, 2012, the Operating Company’s
weighted average Unadjusted and Adjusted Yield to Maturity was approximately 10.6% and 12.8%, respectively.
At December 31, 2011,
the Operating Company’s weighted average Unadjusted and Adjusted Yield to Maturity was approximately 10.7% and 13.1%, respectively.
Recent Accounting Standards Updates
In May 2011, the Financial Accounting Standards Board (“FASB”) issued Accounting Standards Update No. 2011-04, Amendments to Achieve Common Fair Value Measurement and Disclosure Requirements in
U.S. GAAP and IFRSs (“ASU 2011-04”), which provides clarification about how to measure fair value and improves comparability of fair value measurements presented and disclosed in accordance with GAAP and International Financial
Reporting Standards. The amendments included in ASU 2011-04 clarify the FASB’s intent about the application of existing fair value measurement and disclosure requirements outlined in ASC 820, as well as include some instances of changes to
particular principles or requirements. ASU 2011-04 clarifies that (i) the concept of the highest and best use valuation premise applies only to nonfinancial assets, (ii) instruments classified in stockholders’ equity should be valued
from the perspective of a market participant that holds that instrument as an asset, and (iii) quantitative information should be disclosed about unobservable inputs used in a fair value measurement that is categorized within Level III of
the fair value hierarchy. ASU 2011-04 changes the guidance in (i) permitting an exception to ASC 820 by allowing an entity to measure the fair value of a group of financial assets and financial liabilities exposed to market and credit risks to
be consistent with the entity’s net risk exposures, instead of gross risk, (ii) applying premiums and discounts in a fair value measurement lacking a Level I inputs to be consistent with the ASC 820 requirements of fair value
measurement but that applying premiums and discounts in a fair value measurement related to size as a characteristic of the holding rather than as a characteristic of the asset or liability is not permitted, and (iii) requiring additional
disclosures about fair value measurements categorized within Level III of the fair value hierarchy, including the valuation processes used and the sensitivity of the fair value measurement to changes in unobservable inputs and the
interrelationships between those unobservable inputs. ASU 2011-04 is effective for the interim and annual periods beginning after December 15, 2011. The adoption of ASU 2011-04 did not have a significant impact on the New Mountain Finance
Entities’ financial statements. Additional disclosure was added where applicable.
Results of Operations
Since NMFC is a holding company with no direct operations of its own, and its only business and sole asset is its ownership of units of the
Operating Company, NMFC’s results of operations are based on the Operating Company’s results of operations.
Under GAAP,
NMFC’s IPO did not step-up the cost basis of the Operating Company’s existing investments to fair market value at the IPO date. Since the total value of the Operating Company’s investments at the time of the IPO was greater than the
investments’ cost basis, a larger amount of
69
amortization of purchase or original issue discount, and different amounts in realized gain and unrealized appreciation, may be recognized under GAAP in each period than if the step-up had
occurred. This will remain until such predecessor investments are sold or mature in the future. The Operating Company tracks the transferred (or fair market) value of each of its investment as of the time of the IPO and, for purposes of the
incentive fee calculation, adjusts income as if each investment was purchased at the date of the IPO (or stepped up to fair market value). The respective “Adjusted Net Investment Income” (defined as net investment income adjusted to
reflect income as if the cost basis of investments held at the IPO date had stepped-up to fair market value as of the IPO date) is used in calculating both the incentive fee and dividend payments. The Operating Company also uses the transferred (or
fair market) value of each of its investments as of the time of the IPO to adjust capital gains (“Adjusted Realized Capital Gains”) or losses (“Adjusted Realized Capital Losses”) and unrealized capital appreciation
(“Adjusted Unrealized Capital Appreciation”) and unrealized capital depreciation (“Adjusted Unrealized Capital Depreciation”). See note 5 to the financial statements appearing elsewhere in this prospectus for additional details.
The following table for the Operating Company for the three months ended March 31, 2012 is adjusted to reflect the step-up to fair
market value and the allocation of the incentive fees related to hypothetical capital gains out of the adjusted post-incentive fee net investment income.
|
|
|
|
|
|
|
|
|
|
|
|
|
|
|
|
|
| (in thousands) |
|
|
|
|
|
|
|
|
|
|
|
|
| |
|
Three months ended
March 31, 2012 |
|
|
Stepped-up cost
basis adjustments |
|
|
Incentive fee
adjustments(1) |
|
|
Adjusted
three months ended
March 31,
2012 |
|
| Investment income |
|
|
|
|
|
|
|
|
|
|
|
|
|
|
|
|
| Interest income |
|
$ |
18,601 |
|
|
$ |
(1,023 |
) |
|
$ |
— |
|
|
$ |
17,578 |
|
| Other income |
|
|
421 |
|
|
|
— |
|
|
|
— |
|
|
|
421 |
|
|
|
|
|
|
|
|
|
|
|
|
|
|
|
|
|
|
| Total investment income |
|
|
19,022 |
|
|
|
(1,023 |
) |
|
|
— |
|
|
|
17,999 |
|
|
|
|
|
|
|
|
|
|
|
|
|
|
|
|
|
|
| Total expenses pre-incentive fee |
|
|
5,748 |
|
|
|
— |
|
|
|
— |
|
|
|
5,748 |
|
|
|
|
|
|
|
|
|
|
|
|
|
|
|
|
|
|
| Pre-Incentive Fee Net Investment Income |
|
|
13,274 |
|
|
|
(1,023 |
) |
|
|
— |
|
|
|
12,251 |
|
|
|
|
|
|
|
|
|
|
|
|
|
|
|
|
|
|
| Incentive fee |
|
|
3,361 |
|
|
|
— |
|
|
|
(911 |
) |
|
|
2,450 |
|
|
|
|
|
|
|
|
|
|
|
|
|
|
|
|
|
|
| Post-Incentive Fee Net Investment Income |
|
|
9,913 |
|
|
|
(1,023 |
) |
|
|
911 |
|
|
|
9,801 |
|
|
|
|
|
|
|
|
|
|
|
|
|
|
|
|
|
|
| Realized gain (loss) on investments |
|
|
1,007 |
|
|
|
(713 |
) |
|
|
— |
|
|
|
294 |
|
| Net change in unrealized appreciation (depreciation) of investments |
|
|
12,747 |
|
|
|
1,736 |
|
|
|
— |
|
|
|
14,483 |
|
| Capital gains incentive fee |
|
|
— |
|
|
|
— |
|
|
|
(911 |
) |
|
|
(911 |
) |
|
|
|
|
|
|
|
|
|
|
|
|
|
|
|
|
|
| Net increase in capital resulting from operations |
|
$ |
23,667 |
|
|
|
|
|
|
|
|
|
|
$ |
23,667 |
|
|
|
|
|
|
|
|
|
|
|
|
|
|
|
|
|
|
| (1) |
For the three months ended March 31, 2012, the Operating Company incurred total incentive fees of $3.4 million, of which $0.9 million related to capital gains incentive fees
on a hypothetical liquidation basis. |
70
For the three months ended March 31, 2012, the Operating Company had a $1.0 million adjustment to
interest income for amortization, a decrease of $0.7 million to realized gains and an increase of $1.7 million to unrealized appreciation to adjust for the stepped-up cost basis of the transferred investments as discussed above. The Operating
Company’s Adjusted Net Investment Income was $9.8 million for the three months ended March 31, 2012.
In accordance with GAAP,
the Operating Company accrued $0.9 million of hypothetical capital gains incentive fee based upon the cumulative net Adjusted Realized Capital Gains and Adjusted Realized Capital Losses and the cumulative net Adjusted Unrealized Capital Appreciation
and Adjusted Unrealized Capital Depreciation on investments held at the end of each period. Actual amounts paid to the Investment Adviser are consistent with the Investment Management Agreement and are based only on actual Adjusted Realized Capital
Gains computed net of all Adjusted Realized Capital Losses and Adjusted Unrealized Capital Depreciation on a cumulative basis from inception through the end of each calendar year as if the entire portfolio was sold at fair value. As of March 31,
2012, no actual capital gains incentive fee was owed under the Investment Management Agreement, cumulative net Adjusted Realized Gains did not exceed cumulative Adjusted Unrealized Depreciation.
The following table for the Operating Company for the three months ended December 31, 2011 is adjusted to reflect the step-up to fair market value.
|
|
|
|
|
|
|
|
|
|
|
|
|
| (in thousands) |
|
|
|
|
|
| |
|
Three months ended
December 31, 2011 |
|
|
Adjustments |
|
|
Adjusted
three months ended
December 31,
2011 |
|
| Investment income |
|
|
|
|
|
|
|
|
|
|
|
|
| Interest income |
|
$ |
16,971 |
|
|
$ |
(271 |
) |
|
$ |
16,700 |
|
| Other income |
|
|
156 |
|
|
|
— |
|
|
|
156 |
|
|
|
|
|
|
|
|
|
|
|
|
|
|
| Total investment income |
|
|
17,127 |
|
|
|
(271 |
) |
|
|
16,856 |
|
|
|
|
|
|
|
|
|
|
|
|
|
|
| Total expenses pre-incentive fee |
|
|
5,269 |
|
|
|
— |
|
|
|
5,269 |
|
|
|
|
|
|
|
|
|
|
|
|
|
|
| Pre-Incentive Fee Net Investment Income |
|
|
11,858 |
|
|
|
(271 |
) |
|
|
11,587 |
|
|
|
|
|
|
|
|
|
|
|
|
|
|
| Incentive fee |
|
|
2,317 |
|
|
|
— |
|
|
|
2,317 |
|
|
|
|
|
|
|
|
|
|
|
|
|
|
| Post-Incentive Fee Net Investment Income |
|
|
9,541 |
|
|
|
(271 |
) |
|
|
9,270 |
|
|
|
|
|
|
|
|
|
|
|
|
|
|
| Realized gain (loss) on investments |
|
|
2,297 |
|
|
|
(1,240 |
) |
|
|
1,057 |
|
| Net change in unrealized appreciation (depreciation) of investments |
|
|
6,019 |
|
|
|
1,511 |
|
|
|
7,530 |
|
|
|
|
|
|
|
|
|
|
|
|
|
|
| Net increase in capital resulting from operations |
|
$ |
17,857 |
|
|
|
|
|
|
$ |
17,857 |
|
|
|
|
|
|
|
|
|
|
|
|
|
|
For the three months ended December 31, 2011, the Operating Company had a $0.3 million adjustment to
interest income for amortization, a decrease of $1.2 million to realized gains and an increase of $1.5 million to unrealized appreciation to adjust for the stepped-up cost basis of the transferred investments as discussed above. The
Operating Company’s Adjusted Net Investment Income was $9.3 million for the three months ended December 31, 2011.
71
The following table for the Operating Company for the period May 19, 2011 (effective date of the
Investment Management Agreement) to December 31, 2011 is adjusted to reflect the step-up to fair market value.
|
|
|
|
|
|
|
|
|
|
|
|
|
| (in thousands) |
|
|
|
|
|
| |
|
Period from
May 19, 2011
to December 31, 2011 |
|
|
Adjustments |
|
|
Adjusted period
from May 19, 2011
to December 31, 2011 |
|
| Investment income |
|
|
|
|
|
|
|
|
|
|
|
|
| Interest income |
|
$ |
38,836 |
|
|
$ |
(2,019 |
) |
|
$ |
36,817 |
|
| Other income |
|
|
670 |
|
|
|
— |
|
|
|
670 |
|
|
|
|
|
|
|
|
|
|
|
|
|
|
| Total investment income |
|
|
39,506 |
|
|
|
(2,019 |
) |
|
|
37,487 |
|
|
|
|
|
|
|
|
|
|
|
|
|
|
| Total expenses pre-incentive fee |
|
|
11,863 |
|
|
|
— |
|
|
|
11,863 |
|
|
|
|
|
|
|
|
|
|
|
|
|
|
| Pre-Incentive Fee Net Investment Income |
|
|
27,643 |
|
|
|
(2,019 |
) |
|
|
25,624 |
|
|
|
|
|
|
|
|
|
|
|
|
|
|
| Incentive fee |
|
|
3,522 |
|
|
|
— |
|
|
|
3,522 |
|
|
|
|
|
|
|
|
|
|
|
|
|
|
| Post-Incentive Fee Net Investment Income |
|
|
24,121 |
|
|
|
(2,019 |
) |
|
|
22,102 |
|
|
|
|
|
|
|
|
|
|
|
|
|
|
| Realized gain (loss) on investments |
|
|
3,298 |
|
|
|
(2,422 |
) |
|
|
876 |
|
| Net change in unrealized (depreciation) appreciation of investments |
|
|
(15,538 |
) |
|
|
4,441 |
|
|
|
(11,097 |
) |
|
|
|
|
|
|
|
|
|
|
|
|
|
| Net decrease in capital resulting from operations |
|
$ |
11,881 |
|
|
|
|
|
|
$ |
11,881 |
|
|
|
|
|
|
|
|
|
|
|
|
|
|
For the period May 19, 2011 (effective
date of the Investment Management Agreement) to December 31, 2011, the Operating Company had a $2.0 million adjustment to interest income for amortization, a decrease of $2.4 million to realized gains and an increase of
$4.4 million to unrealized depreciation to adjust for the stepped-up cost basis of the transferred investments as discussed above. The Operating Company’s Adjusted Net Investment Income was $22.1 million for the period May 19,
2011 (effective date of the Investment Management Agreement) to December 31, 2011.
Results of Operations for the Operating
Company for the Three Months Ended March 31, 2012 and March 31, 2011
Revenue
|
|
|
|
|
|
|
|
|
|
|
|
|
| (in thousands) |
|
| |
|
Three months ended |
|
|
Percent
Change |
|
| |
|
March 31, 2012 |
|
|
March 31, 2011 |
|
|
| Interest income |
|
$ |
18,601 |
|
|
$ |
11,168 |
|
|
|
67 |
% |
| Other income |
|
|
421 |
|
|
|
44 |
|
|
|
NM |
* |
|
|
|
|
|
|
|
|
|
|
|
|
|
| Total investment income |
|
$ |
19,022 |
|
|
$ |
11,212 |
|
|
|
|
|
|
|
|
|
|
|
|
|
|
|
|
|
|
The Operating Company’s total
investment income increased by $7.8 million for the three months ended March 31, 2012 as compared to the three months ended March 31, 2011. The increase in investment income from the three months ended March 31, 2011 to the three months ended March
31, 2012 was primarily attributable to larger invested balances, driven by the proceeds of the IPO on May 19, 2011 and the Operating Company’s use of leverage from its revolving credit facilities to invest in debt. Additionally in 2012,
the Operating Company’s other income increased due to commitment fees received associated with the closing of its two bridge facilities held as of December 31, 2011.
72
Operating Expenses
|
|
|
|
|
|
|
|
|
|
|
|
|
| (in thousands) |
|
|
|
|
|
|
|
|
|
| |
|
Three months ended |
|
|
Percent
Change |
|
| |
|
March 31, 2012 |
|
|
March 31, 2011 |
|
|
| Incentive fee(1) |
|
$ |
3,361 |
|
|
$ |
— |
|
|
|
N/A |
|
| Management fee |
|
|
2,514 |
|
|
|
34 |
|
|
|
NM |
* |
| Interest and other credit facility expenses |
|
|
2,483 |
|
|
|
1,547 |
|
|
|
61 |
% |
| Professional fees |
|
|
202 |
|
|
|
53 |
|
|
|
281 |
% |
| Other expenses |
|
|
549 |
|
|
|
148 |
|
|
|
271 |
% |
|
|
|
|
|
|
|
|
|
|
|
|
|
| Total operating expenses |
|
$ |
9,109 |
|
|
$ |
1,782 |
|
|
|
|
|
|
|
|
|
|
|
|
|
|
|
|
|
|
| (1) |
For the three months ended March 31, 2012, the total incentive fees incurred of $3.4 million included $0.9 million related to capital gains incentive fees on a hypothetical
liquidation basis. |
The Operating Company’s total operating expenses increased by $7.3 million for the three months
ended March 31, 2012 as compared to the three months ended March 31, 2011. Interest and other credit facility expenses increased by $0.9 million during the three months ended March 31, 2012, because the average debt outstanding increased from $62.6
million to $129.0 million for the Holdings Credit Facility and from $98.5 million to $172.1 million for the SLF Credit Facility for the three months ended March 31, 2011 compared to March 31, 2012.
Additionally, the Operating Company’s management fees and incentive fees increased by $2.5 million and $3.4 million, respectively, for the
three months ended March 31, 2012 as compared to the three months ended March 31, 2011. As a result of the IPO on May 19, 2011, the Operating Company pays management fees and incentive fees under its Investment Management Agreement, which provides a
different basis for the calculation of these fees as compared to amounts previously paid prior to the completion of the IPO. Prior to the IPO, an affiliate of the Predecessor Entities paid a majority of the management and incentive fees. In
addition, historical operating expenses do not reflect the allocation of certain professional fees, administrative and other expenses that have been incurred following the completion of the IPO. Accordingly, the Operating Company’s historical
operating expenses are not comparable to its operating expenses after the completion of the IPO.
Realized Gains and Net Change in Unrealized
Appreciation (Depreciation)
|
|
|
|
|
|
|
|
|
|
|
|
|
| (in thousands) |
|
|
|
|
|
|
|
|
|
| |
|
Three months ended |
|
|
Percent
Change |
|
| |
|
March 31, 2012 |
|
|
March 31, 2011 |
|
|
| Realized gains on investments |
|
$ |
1,007 |
|
|
$ |
5,892 |
|
|
|
(83 |
)% |
| Net change in unrealized appreciation (depreciation) of investments |
|
|
12,747 |
|
|
|
1,097 |
|
|
|
NM |
* |
|
|
|
|
|
|
|
|
|
|
|
|
|
| Total net realized gains and net change in unrealized appreciation (depreciation) of investments |
|
$ |
13,754 |
|
|
$ |
6,989 |
|
|
|
|
|
|
|
|
|
|
|
|
|
|
|
|
|
|
The Operating Company’s net
realized and unrealized gains or losses resulted in a net gain of $13.8 million for the three months ended March 31, 2012 compared to a net gain of $7.0 million for the same period in 2011. We look at total realized and unrealized gains or losses
together as movement in unrealized appreciation or depreciation can be the result of realizations. The net gain for the three months ended March 31, 2012 was primarily related to the overall increase in the market, directly impacting the prices of
the Operating Company’s portfolio. The net gain for the three months ended
73
March 31, 2011 was primarily driven by the appreciation of the Operating Company’s portfolio and the sale or repayment of investments with fair values in excess of December 31, 2010
valuations, resulting in realized gains being greater than the reversal of the cumulative unrealized gains for those investments.
Results of Operations for the Operating Company for the Years Ended December 31, 2011, December 31, 2010 and December 31, 2009
Revenue
|
|
|
|
|
|
|
|
|
|
|
|
|
| (in thousands) |
|
|
|
|
| |
|
Years ended December 31, |
|
| |
|
2011 |
|
|
2010 |
|
|
2009 |
|
| Interest income |
|
$ |
55,809 |
|
|
$ |
40,485 |
|
|
$ |
21,109 |
|
| Other income |
|
|
714 |
|
|
|
890 |
|
|
|
658 |
|
|
|
|
|
|
|
|
|
|
|
|
|
|
| Total investment income |
|
$ |
56,523 |
|
|
$ |
41,375 |
|
|
$ |
21,767 |
|
|
|
|
|
|
|
|
|
|
|
|
|
|
The Operating Company’s total investment income increased by $15.1 million for the year ended
December 31, 2011 as compared to the year ended December 31, 2010. The 36.6% increase in investment income from the year ended 2010 to the year ended 2011 was primarily attributable to larger invested balances, which was mainly driven by
the proceeds of the IPO on May 19, 2011 and the formation of NMF SLF. NMF SLF, formed on October 7, 2010, uses cash injected by the Operating Company and leverage from its revolving credit facility to invest primarily in first lien debt
securities. Additionally in 2011, the Operating Company’s interest income increased due to prepayment premiums associated with the refinancing and early repayment of the debt of multiple portfolio companies.
The Operating Company’s total investment income increased by $19.6 million for the year ended December 31, 2010 as compared to the
year ended December 31, 2009. The 90.1% increase in investment income was primarily attributed to the larger invested balance during 2010. Additionally, there was an increase during 2010 in the number of investments with higher fixed interest
rates relative to 2009. As of December 31, 2010, fixed interest rate investments made up approximately 13.1% of the par value of the portfolio with a weighted average fixed rate of approximately 12.9%. As of December 31, 2009, fixed
interest rate investments made up approximately 6.6% of the par value of the portfolio with a weighted average fixed rate of approximately 11.9%.
Operating Expenses
|
|
|
|
|
|
|
|
|
|
|
|
|
| (in thousands) |
|
|
|
|
|
|
|
|
|
| |
|
Years ended December 31, |
|
| |
|
2011 |
|
|
2010 |
|
|
2009 |
|
| Interest and other credit facility expenses |
|
$ |
7,086 |
|
|
$ |
2,948 |
|
|
$ |
490 |
|
| Management fee |
|
|
4,938 |
|
|
|
71 |
|
|
|
135 |
|
| Incentive fee |
|
|
3,522 |
|
|
|
— |
|
|
|
— |
|
| Professional fees |
|
|
722 |
|
|
|
327 |
|
|
|
382 |
|
| Other expenses |
|
|
1,730 |
|
|
|
565 |
|
|
|
352 |
|
|
|
|
|
|
|
|
|
|
|
|
|
|
| Total operating expenses |
|
$ |
17,998 |
|
|
$ |
3,911 |
|
|
$ |
1,359 |
|
|
|
|
|
|
|
|
|
|
|
|
|
|
74
The Operating Company’s total operating expenses increased by $14.1 million for the year
ended December 31, 2011 as compared to the year ended December 31, 2010. Interest and other credit facility expenses increased by $4.1 million during the year ended December 31, 2011. The credit facility of NMF SLF was originally
executed in October 2010 and, therefore, it was not outstanding for the full year ended December 31, 2010. Costs associated with the closing of the credit facility of NMF SLF are capitalized and charged against income as other credit facility
expenses.
Additionally, the Operating Company’s management fees and incentive fees increased by $4.9 million and
$3.5 million, respectively, for the year ended December 31, 2011 as compared to the year ended December 31, 2010. As a result of the IPO on May 19, 2011, the Operating Company pays management fees and incentive fees under its
Investment Management Agreement, which provides a different basis for the calculation of these fees as compared to amounts previously paid prior to the completion of the IPO. Prior to the IPO, an affiliate of the Predecessor Entities paid a majority
of the management and incentive fees. In addition, historical operating expenses do not reflect the allocation of certain professional fees, administrative and other expenses that have been incurred following the completion of the IPO. Accordingly,
the Operating Company’s historical operating expenses are not comparable to its operating expenses after the completion of the IPO.
The Operating Company’s total operating expenses increased by $2.6 million for the year ended December 31, 2010 as compared to the
year ended December 31, 2009. Interest and other credit facility expenses increased $2.5 million during the year ended December 31, 2010 as compared to the year ended December 31, 2009. The two credit agreements that comprise the
original $120.0 million credit facility of the Predecessor Entities existing prior to the IPO (the “Predecessor Credit Facility”) were executed in October and November of 2009 and therefore were only outstanding for part of the year
in 2009. During 2010, the Predecessor Credit Facility had varying amounts outstanding throughout the whole year. Additionally, the SLF Credit Facility was originally executed in October of 2010. The increase in professional fees and other expenses
of $0.1 million for the year ended December 31, 2010 as compared to the year ended December 31, 2009 was primarily due to an increase in fees paid to third-party vendors.
Realized Gains and Net Change in Unrealized (Depreciation) Appreciation
|
|
|
|
|
|
|
|
|
|
|
|
|
| (in thousands) |
|
|
|
|
|
|
|
|
|
| |
|
Years ended December 31, |
|
| |
|
2011 |
|
|
2010 |
|
|
2009 |
|
| Realized gains on investments |
|
$ |
16,252 |
|
|
$ |
66,287 |
|
|
$ |
37,129 |
|
| Net change in unrealized (depreciation) appreciation of investments |
|
|
(23,100 |
) |
|
|
(39,959 |
) |
|
|
68,143 |
|
|
|
|
|
|
|
|
|
|
|
|
|
|
| Total net realized gains and net change in unrealized (depreciation) appreciation of investments |
|
$ |
(6,848 |
) |
|
$ |
26,328 |
|
|
$ |
105,272 |
|
|
|
|
|
|
|
|
|
|
|
|
|
|
The Operating Company’s net realized and unrealized gains or losses resulted in a net loss of
$6.8 million for the year ended December 31, 2011 compared to a net gain of $26.3 million for the same period in 2010, and a net gain of $105.3 million for the same period in 2009. We look at total realized and unrealized gains
or losses together as movement in unrealized appreciation or depreciation can be the result of realizations. The net loss for the year ended December 31, 2011 was primarily related to the overall market decline, directly impacting the prices of
the Operating Company’s portfolio. The net gain for the year ended December 31, 2010 was primarily driven by the continued appreciation of the Operating Company’s portfolio and the sale of investments with fair values in excess of
December 31, 2009 valuations, resulting in realized gains being greater than the reversal of the cumulative unrealized gains for those investments. The net gain during the year ended December 31, 2009 was primarily driven by the sharp rise
in market prices.
75
Liquidity and Capital Resources
The primary use of existing funds and any funds raised in the future is expected to be for the Operating Company’s repayment of indebtedness,
the Operating Company’s investments in portfolio companies, cash distributions to the Operating Company’s unit holders or for other general corporate purposes.
Guardian AIV and New Mountain Guardian Partners, L.P. contributed a portfolio to the Operating Company in connection with the IPO of NMFC, receiving 20,221,938 units of the Operating Company and 1,252,964
shares of NMFC, respectively. On May 19, 2011, NMFC priced its initial offering of 7,272,727 shares of common stock at a public offering price of $13.75 per share. Concurrently with the closing of the IPO and at the public offering price of
$13.75 per share, NMFC sold an additional 2,172,000 shares of its common stock to certain executives and employees of, and other individuals affiliated with, New Mountain Capital in the Concurrent Private Placement. NMFC used the gross proceeds from
the IPO and Concurrent Private Placement to acquire units in the Operating Company.
The Operating Company’s liquidity is generated
and generally available through advances from the revolving credit facilities, from cash flows from operations, and, we expect, through periodic follow-on equity offerings of NMFC.
At March 31, 2012, the Operating Company had cash and cash equivalents of approximately $13.6 million. Cash (used in) operating activities for the
three months ended March 31, 2012 and March 31, 2011 was approximately $(30.1) million and $(70.5) million, respectively. We expect that all current liquidity needs by the Operating Company will be met with cash flows from operations and other
activities.
At December 31, 2011, December 31, 2010 and December 31, 2009, the Operating Company had cash and cash
equivalents of approximately $15.3 million, $10.7 million and $4.1 million, respectively. Cash (used in) provided by operating activities for the years ended December 31, 2011, December 31, 2010 and December 31, 2009
was approximately $(316.3) million, $29.1 million and $(157.2) million, respectively.
Credit Facilities
Holdings Credit Facility—The Holdings Credit Facility among the Operating Company as the Borrower and Collateral Administrator, Wells
Fargo Securities, L.L.C. as the Administrative Agent, and Wells Fargo Bank, National Association, as the Collateral Custodian, is structured as a revolving credit facility and matures on October 21, 2015. The maximum amount of revolving borrowings
available under the Holdings Credit Facility is $160.0 million. The Operating Company is permitted to borrow up to 45.0% or 25.0% of the purchase price of pledged first lien or non-first lien debt securities, and up to 67.0% and 45.0% of the
purchase price of specified first lien debt securities and specified non-first lien debt securities, respectively, subject to approval by Wells Fargo Bank, National Association. The Holdings Credit Facility is collateralized by all of the
investments of the Operating Company on an investment by investment basis. All fees associated with the origination or upsizing of the facility are capitalized on the Operating Company’s Consolidated Statement of Assets, Liabilities, and
Members’ Capital and charged against income as other credit facility expenses over the life of the Holdings Credit Facility. The Holdings Credit Facility contains certain customary affirmative and negative covenants and events of default,
including the occurrence of a change in control. In addition, the Holdings Credit Facility requires the Operating Company to maintain a minimum asset coverage ratio. However, the covenants are generally not tied to mark to market fluctuations in the
prices of the Operating Company’s investments, but rather to the performance of the underlying portfolio companies.
76
The Holdings Credit Facility bears interest at a rate of LIBOR plus 3.0% per annum and charges a
non-usage fee, based on the unused facility amount multiplied by the Non-Usage Fee Rate (as defined in the credit agreement). Interest expense and non-usage fees were $1.1 million and $39.2 thousand, respectively, for the three months ended
March 31, 2012. Interest expense and non-usage fees were $0.5 million and $0.2 million, respectively, for the three months ended March 31, 2011. Interest expense and non-usage fees were $2.0 million and $0.6 million, respectively, for the year
ended December 31, 2011. Interest expense and non-usage fees were $2.2 million and $0.3 million, respectively, for the year ended December 31, 2010. Interest expense and non-usage fees were $0.4 million and $0.1 million, respectively, for the year
ended December 31, 2009.
The weighted average interest rate for the three months ended March 31, 2012 and March 31, 2011 was 3.3%
and 3.3%, respectively. The weighted average interest rate for the years ended December 31, 2011, December 31, 2010 and December 31, 2009 was 3.2%, 3.3% and 3.2%, respectively.
The average debt outstanding for the three months ended March 31, 2012 and March 31, 2011 was $129.0 million and $62.6 million, respectively. The
average debt outstanding for the years ended December 31, 2011, December 31, 2010 and December 31, 2009 was $61.6 million, $68.3 million and $65.0 million, respectively. The outstanding balance of Holdings Credit Facility as of March 31, 2012,
December 31, 2011, December 31, 2010 and December 31, 2009 was $151.9 million, $129.0 million, $59.7 million and $77.7 million, respectively. As of March 31, 2012, December 31, 2011, December 31, 2010 and December 31, 2009, the Operating Company was
in compliance with all financial and operational covenants required by the Holdings Credit Facility.
SLF Credit
Facility—The SLF Credit Facility among NMF SLF as the Borrower, the Operating Company as the Collateral Administrator, Wells Fargo Securities, L.L.C. as the Administrative Agent, and Wells Fargo Bank, National Association, as the Collateral
Custodian, is structured as a revolving credit facility and matures on October 27, 2015. The maximum amount of revolving borrowings available under the SLF Credit Facility is $175.0 million. The loan is non-recourse to the Operating Company and
secured by all assets owned by the borrower on an investment by investment basis. All fees associated with the origination or upsizing of the SLF Credit Facility are capitalized on the Consolidated Statement of Assets, Liabilities, and Members’
Capital and charged against income as other credit facility expenses over the life of the SLF Credit Facility. The SLF Credit Facility contains certain customary affirmative and negative covenants and events of default, including the occurrence of a
change in control. The covenants are generally not tied to mark to market fluctuations in the prices of our investments, but rather to the performance of the underlying portfolio companies.
The SLF Credit Facility permits borrowings of up to 67.0% of the purchase price of pledged debt securities subject to approval by Wells Fargo Bank,
National Association. Due to a fifth amendment to the SLF Credit Facility on October 27, 2011, NMF SLF is no longer restricted from the purchase or sale of loans with an affiliate. Therefore, specified first lien loans can be moved as
collateral between the Holdings Credit Facility and the SLF Credit Facility.
The SLF Credit Facility bears interest at a rate of LIBOR
plus 2.25% per annum. A non-usage fee is paid, based on the unused facility amount multiplied by the Non-Usage Fee Rate (as defined in the credit agreement). Interest expense and non-usage fees were $1.1 million and $3.7 thousand, respectively,
for the three months ended March 31, 2012. Interest expense and non-usage fees were $0.6 million and $17.9 thousand, respectively, for the three months ended March 31, 2011. Interest expense and non-usage fees were $3.4 million and $0.1
million, respectively, for the year ended December 31, 2011. For the period October 7, 2010 (commencement of NMF SLF operations) through December 31, 2010, interest expense and non-usage fees for the SLF Credit Facility were $0.1 million and $0.1
million, respectively.
77
The weighted average interest rate for the three months ended March 31, 2012 and March 31, 2011
was 2.5% and 2.5%, respectively. The weighted average interest rate for the year ended December 31, 2011 and for the period October 7, 2010 (commencement of NMF SLF operations) through December 31, 2010 for the facility was 2.5% and 2.5%,
respectively.
The average debt outstanding for the three months ended March 31, 2012 and March 31, 2011 was $172.1 million and
$98.5 million, respectively. The average debt outstanding for the year ended December 31, 2011 and the period October 7, 2010 (commencement of NMF SLF operations) through December 31, 2010 was $133.8 million and $27.7 million, respectively. The SLF
Credit Facility did not exist for the full year ended December 31, 2010 and did not exist in the year ended December 31, 2009. The outstanding balance as of March 31, 2012, December 31, 2011 and December 31, 2010 was $175.0 million, $165.9 million
and $56.9 million, respectively. As of March 31, 2012, December 31, 2011 and December 31, 2010, NMF SLF was in compliance with all financial and operational covenants required by the SLF Credit Facility.
Off-Balance Sheet Arrangements
The
Operating Company may become a party to financial instruments with off-balance sheet risk in the normal course of business to meet the financial needs of its portfolio companies. These instruments may include commitments to extend credit and
involve, to varying degrees, elements of liquidity and credit risk in excess of the amount recognized in the balance sheet. As of March 31, 2012, December 31, 2011 and December 31, 2010, the Operating Company had outstanding commitments to
third parties to fund investments totaling $22.7 million, $27.0 million and $12.2 million, respectively, under various undrawn revolving credit facilities, delayed draw commitments or other future funding commitments.
The Operating Company may from time to time enter into financing commitment letters or bridge financing commitments. As of March 31, 2012 and
December 31, 2011, the Operating Company did not enter into any commitment letters to purchase debt investments. As of March 31, 2012, December 31, 2011 and December 31, 2010, the Operating Company entered into bridge financing
commitments in an aggregate par amount of $0 million, $35.0 million and $0, respectively, which could require funding in the future.
Borrowings
The Operating Company had
borrowings of $151.9 million, $129.0 million and $59.7 million outstanding as of March 31, 2012, December 31, 2011 and December 31, 2010, respectively, under the Holdings Credit Facility. The Operating Company had borrowings of
$175.0 million, $165.9 million and $56.9 million outstanding as of March 31, 2012, December 31, 2011 and December 31, 2010, respectively, under the SLF Credit Facility.
Contractual Obligations
A summary of the Operating Company’s significant
contractual payment obligations as of March 31, 2012 is as follows:
|
|
|
|
|
|
|
|
|
|
|
|
|
|
|
|
|
|
|
|
|
| |
|
|
|
|
Contractual Obligations
Payments Due by Period
(in thousands) |
|
|
|
|
| |
|
Total |
|
|
Less than
1 Year |
|
|
1 - 3
Years |
|
|
3 - 5
Years |
|
|
More than
5 Years |
|
| Holdings Credit Facility(1) |
|
$ |
151,923 |
|
|
$ |
— |
|
|
$ |
— |
|
|
$ |
151,923 |
|
|
$ |
— |
|
| SLF Credit Facility(2) |
|
|
175,000 |
|
|
|
— |
|
|
|
— |
|
|
|
175,000 |
|
|
|
— |
|
|
|
|
|
|
|
|
|
|
|
|
|
|
|
|
|
|
|
|
|
|
| Total Contractual Obligations |
|
$ |
326,923 |
|
|
$ |
— |
|
|
$ |
— |
|
|
$ |
326,923 |
|
|
$ |
— |
|
|
|
|
|
|
|
|
|
|
|
|
|
|
|
|
|
|
|
|
|
|
78
| (1) |
Under the terms of the $160.0 million Holdings Credit Facility, all outstanding borrowings under that facility ($151.9 million as of March 31, 2012) must be repaid on
or before October 21, 2015. As of March 31, 2012, there was approximately $8.1 million of possible capacity remaining under the Holdings Credit Facility. |
| (2) |
Under the terms of the $175.0 million SLF Credit Facility, all outstanding borrowings under that facility ($175.0 million as of March 31, 2012) must be repaid on or
before October 27, 2015. As of March 31, 2012, there was $0 million of possible capacity remaining under the SLF Credit Facility. |
A summary of the Operating Company’s significant contractual payment obligations as of December 31, 2011 is as follows:
|
|
|
|
|
|
|
|
|
|
|
|
|
|
|
|
|
|
|
|
|
| |
|
|
|
|
Contractual Obligations
Payments Due by Period
(in
thousands) |
|
|
|
|
| |
|
Total |
|
|
Less than
1 Year |
|
|
1 - 3
Years |
|
|
3 - 5
Years |
|
|
More than
5 Years |
|
| Holdings Credit Facility(1) |
|
$ |
129,038 |
|
|
$ |
— |
|
|
$ |
— |
|
|
$ |
129,038 |
|
|
$ |
— |
|
| SLF Credit Facility(2) |
|
|
165,928 |
|
|
|
— |
|
|
|
— |
|
|
|
165,928 |
|
|
|
— |
|
|
|
|
|
|
|
|
|
|
|
|
|
|
|
|
|
|
|
|
|
|
| Total Contractual Obligations |
|
$ |
294,966 |
|
|
$ |
— |
|
|
$ |
— |
|
|
$ |
294,966 |
|
|
$ |
— |
|
|
|
|
|
|
|
|
|
|
|
|
|
|
|
|
|
|
|
|
|
|
| (1) |
Under the terms of the $160.0 million Holdings Credit Facility, all outstanding borrowings under that facility ($129.0 million as of December 31, 2011) were required to be repaid
on or before October 21, 2015. As of December 31, 2011, there was approximately $31.0 million of possible capacity remaining under the Holdings Credit Facility. |
| (2) |
Under the terms of the $175.0 million SLF Credit Facility, all outstanding borrowings under that facility ($165.9 million as of December 31, 2011) must be repaid
on or before October 27, 2015. As of December 31, 2011, there was approximately $9.1 million of possible capacity remaining under the SLF Credit Facility. |
The Operating Company has certain contracts under which it has material future commitments. The Operating Company has $22.7 million of undrawn
funding commitments as of March 31, 2012 related to its participation as a lender in revolving credit facilities, delayed draw commitments or other future funding commitments of the Operating Company’s portfolio companies. As of March 31, 2012,
the Operating Company did not enter into any bridge financing commitments, which could require funding in the future. The Operating Company had $27.0 million of undrawn funding commitments as of December 31, 2011 related to its
participation as a lender in revolving credit facilities, delayed draw commitments or other future funding commitments of the Operating Company’s portfolio companies. As of December 31, 2011, the Operating Company entered into bridge
financing commitments in an aggregate par amount of $35.0 million, which could require funding in the future.
The Operating
Company has entered into the Investment Management Agreement with the Investment Adviser in accordance with the 1940 Act. Under the Investment Management Agreement, the Investment Adviser has agreed to provide the Operating Company with investment
advisory and management services. The Operating Company has agreed to pay for these services (1) a management fee and (2) an incentive fee based on its performance.
We have also entered into the Administration Agreement with the Administrator. Under the Administration Agreement, the Administrator has agreed to arrange office space for us and provide office equipment and
clerical, bookkeeping and record keeping services and other administrative services necessary to conduct our respective day-to-day operations. The Administrator has also agreed to perform, or oversee the performance of, our financial records, our
reports to stockholders/unit holders and reports filed with the SEC.
79
If any of the contractual obligations discussed above are terminated, our costs under any new
agreements that are entered into may increase. In addition, we would likely incur significant time and expense in locating alternative parties to provide the services we expect to receive under the Investment Management Agreement and the
Administration Agreement.
Distributions and Dividends
Dividends declared to stockholders/unit holders of the New Mountain Finance Entities for the three months ended March 31, 2012 totaled $9.9 million, of which $6.5 million remained as an outstanding payable as of
March 31, 2012 to AIV Holdings only and its stockholders, and for the year ended December 31, 2011 totaled $26.6 million. Tax characteristics of all dividends paid by NMFC are reported to stockholders on Form 1099 after the end of the
calendar year. Future quarterly dividends, if any, for the New Mountain Finance Entities will be determined by their respective board of directors.
The following table summarizes the Operating Company’s and NMFC’s quarterly cash distributions, including dividends and returns of capital, if any, per unit/share that have been declared by the Operating
Company’s board of directors, and subsequently NMFC’s board of directors, since NMFC’s IPO:
|
|
|
|
|
|
|
|
|
|
|
| Fiscal Year Ended |
|
Date Declared |
|
Record Date |
|
Payment Date |
|
Per Share/
Unit Amount |
|
| December 31, 2012 |
|
|
|
|
|
|
|
|
|
|
| Second Quarter |
|
May 8, 2012 |
|
June 15, 2012 |
|
June 29, 2012 |
|
$ |
0.34 |
|
| Second Quarter(1) |
|
May 8, 2012 |
|
May 21, 2012 |
|
May 31, 2012 |
|
|
0.23 |
|
| First Quarter |
|
March 7, 2012 |
|
March 15, 2012 |
|
March 30, 2012 |
|
|
0.32 |
|
| December 31, 2011 |
|
|
|
|
|
|
|
|
|
|
| Fourth Quarter |
|
November 8, 2011 |
|
December 15, 2011 |
|
December 30, 2011 |
|
$ |
0.30 |
|
| Third Quarter |
|
August 10, 2011 |
|
September 15, 2011 |
|
September 30, 2011 |
|
|
0.29 |
|
| Second Quarter |
|
August 10, 2011 |
|
August 22, 2011 |
|
August 31, 2011 |
|
|
0.27 |
|
|
|
|
|
|
|
|
|
|
|
|
| Total |
|
|
|
|
|
|
|
$ |
1.75 |
|
|
|
|
|
|
|
|
|
|
|
|
| (1) |
Special dividend related to estimated realized capital gains attributable to the Operating Company’s investments in Lawson Software, Inc. and Infor Lux Bond Company.
|
Since NMFC is a holding company, all distributions on its common stock will be paid from distributions received from the
Operating Company. The Operating Company intends to make distributions to its unit holders that will be sufficient to enable NMFC to pay quarterly distributions to its stockholders and to obtain and maintain its status as a RIC. NMFC intends to
distribute approximately its entire portion of the Operating Company’s Adjusted Net Investment Income on a quarterly basis and substantially its entire portion of the Operating Company’s taxable income on an annual basis, except that it
may retain certain net capital gains for reinvestment.
NMFC maintains an “opt out” dividend reinvestment plan for its common
stockholders. As a result, if the Operating Company declares a dividend, then NMFC stockholders’ cash dividends will be automatically reinvested in additional shares of NMFC’s common stock, unless they specifically “opt out” of
the dividend reinvestment plan so as to receive cash dividends. Cash dividends reinvested in additional shares of NMFC’s common stock will be automatically reinvested by NMFC in the Operating Company in exchange for additional units of the
Operating Company. See Note 2, Summary of Significant Accounting Policies to the financial statements appearing elsewhere in this prospectus for additional details regarding NMFC’s dividend reinvestment plan.
80
Related Parties
The New Mountain Finance Entities have entered into a number of business relationships with affiliated or related parties, including the following:
| |
Ÿ |
|
Together, NMFC and AIV Holdings own all the outstanding units of the Operating Company. As of March 31, 2012 and December 31, 2011, NMFC and AIV Holdings
owned approximately 34.6% and 65.4%, respectively, of the units of the Operating Company. |
| |
Ÿ |
|
The Operating Company has entered into the Investment Management Agreement with the Investment Adviser, a wholly-owned subsidiary of New Mountain Capital.
Therefore, New Mountain Capital is entitled to any profits earned by the Investment Adviser, which includes any fees payable to the Investment Adviser under the terms of the Investment Management Agreement, less expenses incurred by the Investment
Adviser in performing its services under the Investment Management Agreement. |
| |
Ÿ |
|
The New Mountain Finance Entities have entered into the Administration Agreement, with the Administrator, a wholly-owned subsidiary of New Mountain Capital. The
Administrator arranges office space for the New Mountain Finance Entities and provides office equipment and administrative services necessary to conduct their respective day-to-day operations pursuant to the Administration Agreement. The Operating
Company reimburses the Administrator for the allocable portion of overhead and other expenses incurred by it in performing its obligations to the New Mountain Finance Entities under the Administration Agreement, including rent, the fees and expenses
associated with performing administrative, finance, and compliance functions, and the compensation of the Operating Company’s chief financial officer and chief compliance officer and their respective staffs. Pursuant to the Administration
Agreement, as amended and restated, and further restricted by the Operating Company, expenses payable to the Administrator by the Operating Company as well as other direct and indirect expenses (excluding interest and other credit facility expenses
and management and incentive fees) has been capped at $3.0 million for the time period from April 1, 2011 to March 31, 2012 and capped at $3.5 million for the time period from April 1, 2012 to March 31, 2013.
|
| |
Ÿ |
|
The New Mountain Finance Entities, the Investment Adviser and the Administrator have entered into a royalty-free Trademark License Agreement, as amended, with
New Mountain Capital, pursuant to which New Mountain Capital has agreed to grant the New Mountain Finance Entities, the Investment Adviser and the Administrator, a non-exclusive, royalty-free license to use the name “New Mountain” and
“New Mountain Finance”. |
In addition, NMFC and the Operating Company have adopted a formal code of ethics
that governs the conduct of their respective officers and directors. These officers and directors also remain subject to the duties imposed by the 1940 Act, the Delaware General Corporation Law and the Delaware Limited Liability Company Act.
The Investment Adviser and its affiliates may also manage other funds in the future that may have investment mandates that are similar,
in whole and in part, with the Operating Company’s investment mandates. The Investment Adviser and its affiliates may determine that an investment is appropriate for the Operating Company and for one or more of those other funds. In such event,
depending on the availability of such investment and other appropriate factors, the Investment Adviser or its affiliates may determine that we should invest side-by-side with one or more other funds. Any such investments will be made only to the
extent permitted by applicable law and interpretive positions of the SEC and its staff, and consistent with the Investment Adviser’s allocation procedures.
Concurrently with the IPO, NMFC sold an additional 2,172,000 shares of its common stock to certain executives and employees of, and other individuals affiliated with, New Mountain Capital in the Concurrent Private
Placement.
81
Quantitative and Qualitative Disclosures About Market Risk
The Operating Company is subject to certain financial market risks, such as interest rate fluctuations. During the three months ended March 31,
2012, certain of the loans held in the Operating Company’s portfolio had floating interest rates. Interest rates on the loans held within the Operating Company’s portfolio of investments are typically based on floating LIBOR, with many of
these assets also having a LIBOR floor. Additionally, the Operating Company’s senior secured revolving credit facilities are also subject to floating interest rates and are currently paid based on 1-month floating LIBOR rates.
The following table estimates the potential changes in net cash flow generated from interest income and expenses, should interest rates increase by
100, 200 or 300 basis points, or decrease by 25 basis points. Interest income was calculated as revenue from interest generated from the Operating Company’s portfolio of investments held on March 31, 2012. Interest expense was calculated based
on the terms of the Operating Company’s two outstanding revolving credit facilities. For the Operating Company’s floating rate credit facilities, it used the outstanding balance as of March 31, 2012. Interest expense on the Operating
Company’s floating rate credit facilities are calculated using the interest rate as of March 31, 2012, adjusted for the hypothetical changes in rates, as shown below. The base interest rate case assumed the rates on the Operating Company’s
portfolio investments remain unchanged from the actual effective interest rates as of March 31, 2012. These hypothetical calculations are based on a model of the investments in our portfolio, held as of March 31, 2012, and are only adjusted for
assumed changes in the underlying base interest rates.
Actual results could differ significantly from those estimated in the table.
|
|
|
|
|
|
|
| Change in Interest Rates |
|
Estimated
Percentage
Change in
Interest
Income Net of
Interest
Expense (unaudited) |
|
| -25 Basis Points |
|
|
1.3 |
% |
| Base Interest Rate |
|
|
— |
% |
| +100 Basis Points |
|
|
(4.6 |
)% |
| +200 Basis Points |
|
|
— |
*% |
| +300 Basis Points |
|
|
7.0 |
% |
| * |
Percent change is less than 0.1%. |
The Operating
Company was not exposed to any foreign currency exchange risks as of March 31, 2012.
82
SENIOR SECURITIES
Information about the Operating Company’s senior securities is shown in the following table as of December 31, 2011, 2010
and 2009. Deloitte & Touche, LLP’s report on the December 31, 2011, 2010 and 2009 information included in this senior securities table is attached as an exhibit to the registration statement of which this prospectus is a
part.
|
|
|
|
|
|
|
|
|
|
|
|
|
|
|
|
|
| Class and Year |
|
Total Amount
Outstanding
Exclusive of
Treasury
Securities(1)
(in millions) |
|
|
Asset
Coverage
Per Unit(2) |
|
|
Involuntary
Liquidating
Preference
Per Unit(3) |
|
|
Average
Market Value
Per Unit(4) |
|
| December 31, 2011 |
|
|
|
|
|
|
|
|
|
|
|
|
|
|
|
|
| Holdings Credit Facility |
|
$ |
129.0 |
|
|
$ |
2,426 |
|
|
$ |
— |
|
|
|
N/A |
|
| SLF Credit Facility |
|
|
165.9 |
|
|
|
2,426 |
|
|
|
— |
|
|
|
N/A |
|
| December 31, 2010(5) |
|
|
|
|
|
|
|
|
|
|
|
|
|
|
|
|
| Holdings Credit Facility |
|
|
59.7 |
|
|
|
3,074 |
|
|
|
— |
|
|
|
N/A |
|
| SLF Credit Facility |
|
|
56.9 |
|
|
|
3,074 |
|
|
|
— |
|
|
|
N/A |
|
| December 31, 2009(5) |
|
|
|
|
|
|
|
|
|
|
|
|
|
|
|
|
| Holdings Credit Facility |
|
|
77.7 |
|
|
|
4,080 |
|
|
|
— |
|
|
|
N/A |
|
| (1) |
Total amount of each class of senior securities outstanding at the end of the period presented. |
| (2) |
Asset coverage per unit is the ratio of the carrying value of our total assets, less all liabilities excluding indebtedness represented by senior securities in this table, to the
aggregate amount of senior securities representing indebtedness. Asset coverage per unit is expressed in terms of dollar amounts per $1,000 of indebtedness and is calculated on a consolidated basis. |
| (3) |
The amount to which such class of senior security would be entitled upon the voluntary liquidation of the issuer in preference to any security junior to it. The
“—” in this column indicates that the SEC expressly does not require this information to be disclosed for certain types of senior securities. |
| (4) |
Not applicable because the senior securities are not registered for public trading. |
| (5) |
Prior to NMFC’s IPO on May 19, 2011, these credit facilities existed at the Predecessor Entities. |
83
BUSINESS
The Company
The Operating
Company is a Delaware limited liability company. The Operating Company is externally managed and has elected to be treated as a BDC under the 1940 Act. As such, the Operating Company is obligated to comply with certain regulatory requirements. The
Operating Company intends to be treated as a partnership for federal income tax purposes for so long as it has at least two members.
The Operating Company is externally managed by the Investment Adviser. The Administrator provides the administrative services necessary for
operations. The Investment Adviser and Administrator are wholly-owned subsidiaries of New Mountain Capital (defined as New Mountain Capital Group, L.L.C. and its affiliates). New Mountain Capital is a firm with a track record of investing in the
middle market and with assets under management (which includes amounts committed, not all of which have been drawn down and invested to date) totaling approximately $9.0 billion as of March 31, 2012. New Mountain Capital focuses on investing in
defensive growth companies across its private equity, public equity, and credit investment vehicles. The Operating Company, formerly known as New Mountain Guardian (Leveraged), L.L.C., was originally formed as a subsidiary of Guardian AIV by New
Mountain Capital in October 2008. Guardian AIV was formed through an allocation of approximately $300.0 million of the $5.1 billion of commitments supporting New Mountain Partners III, L.P., a private equity fund managed by New
Mountain Capital. In February 2009, New Mountain Capital formed a co-investment vehicle, New Mountain Guardian Partners, L.P., comprising $20.4 million of commitments. New Mountain Guardian (Leveraged), L.L.C. and New Mountain Guardian
Partners, L.P., together with their respective direct and indirect wholly-owned subsidiaries, are defined as the “Predecessor Entities”.
NMFC is a Delaware corporation that was originally incorporated on June 29, 2010. NMFC is a closed-end, non-diversified management investment company that has elected to be treated as a BDC under the 1940 Act.
As such, NMFC is obligated to comply with certain regulatory requirements. NMFC intends to be treated, and intends to comply with the requirements to qualify annually, as a RIC under Subchapter M of the Code commencing with its taxable year
ending on December 31, 2011.
AIV Holdings is a Delaware corporation that was originally incorporated on March 11, 2011. Guardian
AIV, a Delaware limited partnership, is AIV Holdings’ sole stockholder. AIV Holdings is a closed-end, non-diversified management investment company that has elected to be treated as a BDC under the 1940 Act. As such, AIV Holdings is obligated
to comply with certain regulatory requirements. AIV Holdings intends to be treated, and intends to comply with the requirements to qualify annually, as a RIC under the Code commencing with its taxable year ending on December 31, 2011.
On May 19, 2011, NMFC priced its IPO of 7,272,727 shares of common stock at a public offering price of $13.75 per share. Concurrently with the
closing of the IPO and at the public offering price of $13.75 per share, NMFC sold an additional 2,172,000 shares of its common stock to certain executives and employees of, and other individuals affiliated with, New Mountain Capital in the
Concurrent Private Placement. Additionally, 1,252,964 shares were issued to the partners of New Mountain Guardian Partners, L.P. at that time for their ownership interest in the Predecessor Entities. In connection with NMFC’s IPO and
through a series of transactions, the Operating Company owns all of the operations of the Predecessor Entities, including all of the assets and liabilities related to such operations.
NMFC and AIV Holdings are holding companies with no direct operations of their own, and their sole asset is their ownership in the Operating
Company. NMFC and AIV Holdings each entered into a joinder agreement with respect to the Limited Liability Company Agreement, as amended and restated, of the Operating Company, pursuant to which NMFC and AIV Holdings were admitted as members of the
Operating Company. NMFC acquired from the Operating Company, with the gross proceeds of the IPO and the Concurrent Private Placement, units of the Operating Company (the number of units are
84
equal to the number of shares of NMFC’s common stock sold in the IPO and the Concurrent Private Placement). Additionally, NMFC received units of the Operating Company equal to the number of
shares of common stock of NMFC issued to the partners of New Mountain Guardian Partners, L.P. Guardian AIV was the parent of the Operating Company prior to the IPO and, as a result of the transactions completed in connection with the IPO,
obtained units in the Operating Company. Guardian AIV contributed its units in the Operating Company to its newly formed subsidiary, AIV Holdings, in exchange for common stock of AIV Holdings. AIV Holdings has the right to exchange all or any
portion of its units in the Operating Company for shares of NMFC’s common stock on a one-for-one basis.
As of March 31, 2012, NMFC
and AIV Holdings own approximately 34.6% and 65.4%, respectively, of the units of the Operating Company.
The current structure was
designed to generally prevent NMFC and its stockholders from being allocated taxable income with respect to unrecognized gains that existed at the time of the IPO in the Predecessor Entities’ assets, and rather such amounts would be allocated
generally to AIV Holdings and its stockholders. The result is that any distributions made to NMFC’s stockholders that are attributable to such gains generally will not be treated as taxable dividends but rather as return of capital.
The diagram below depicts our current organizational structure.

85
The Operating Company is a party to the Holdings Credit Facility pursuant to a secured credit
agreement with Wells Fargo Bank, National Association. The Holdings Credit Facility, which matures on October 21, 2015, provides for potential borrowings up to $160.0 million. Unlike many credit facilities for BDCs the amount available
under the Holdings Credit Facility is not subject to reduction as a result of mark to market fluctuations in its portfolio investments. The Operating Company is permitted to borrow up to 45.0% or 25.0% of the purchase price of pledged first lien or
non-first lien debt securities, and up to 67.0% and 45.0% of the purchase price of specified first lien debt securities and specified non-first lien debt securities, respectively, subject to approval by Wells Fargo Bank, National Association. The
Holdings Credit Facility bears interest at a rate of LIBOR plus 3.0% per annum and charges a non-usage fee, based on the unused facility amount multiplied by the Non-Usage Fee Rate (as defined in the credit agreement). As of March 31, 2012,
$151.9 million was outstanding under the Holdings Credit Facility.
The SLF Credit Facility among NMF SLF as the Borrower, the
Operating Company as the Collateral Administrator, Wells Fargo Securities, L.L.C. as the Administrative Agent, and Wells Fargo Bank, National Association, as the Collateral Custodian, is structured as a revolving credit facility and matures on
October 27, 2015. The maximum amount of revolving borrowings available under the SLF Credit Facility is $175.0 million. The loan is non-recourse to the Operating Company and secured by all assets owned by the borrower on an investment
by investment basis. The SLF Credit Facility permits borrowings of up to 67.0% of the purchase price of pledged debt securities subject to approval by Wells Fargo Bank, National Association. Due to a fifth amendment to the SLF Credit Facility on
October 27, 2011, NMF SLF is no longer restricted from the purchase or sale of loans with an affiliate. Therefore, specified first lien loans can be moved as collateral between the Holdings Credit Facility and the SLF Credit Facility. The SLF
Credit Facility bears interest at a rate of LIBOR plus 2.25% per annum. A non-usage fee is paid, based on the unused facility amount multiplied by the Non-Usage Fee Rate (as defined in the credit agreement). As of March 31, 2012, $175.0 million
was outstanding under the SLF Credit Facility.
For a detailed discussion of the Holdings Credit Facility and the SLF Credit Facility,
see “Management’s Discussion and Analysis of Financial Conditions and Results of Operations—Liquidity and Capital Resources.”
We expect to continue to finance our investments using both debt and equity, including proceeds from equity issued by NMFC, which will be contributed to the Operating Company.
New Mountain Capital
New
Mountain Capital manages private equity, public equity and debt investments with aggregate assets under management (which includes amounts committed, not all of which have been drawn down and invested to date) totaling approximately
$9.0 billion as of March 31, 2012.
New Mountain Capital’s first private equity fund, the $770.0 million New Mountain
Partners, L.P., or “Fund I”, began its investment period in January 2000. New Mountain Capital’s second private equity fund, the $1.6 billion New Mountain Partners II, L.P., or “Fund II”, began its investment
period in January 2005. New Mountain Capital’s third private equity fund, Fund III, with over $5.1 billion of aggregate commitments, began its investment period in August 2007. New Mountain Capital manages public equity portfolios of
approximately $1.7 billion through New Mountain Vantage Advisers, L.L.C., which is designed to apply New Mountain Capital’s established strengths toward non-control positions in the U.S. public equity markets generally. New Mountain
Capital manages its debt portfolio through the Operating Company, and the Operating Company is currently New Mountain Capital’s only vehicle focused primarily on investing in the investments that we target.
86
New Mountain Capital’s mission is to be “best in class” in the new generation of
investment managers as measured by returns, control of risk, service to investors and the quality of the businesses in which New Mountain Capital invests. All of New Mountain Capital’s efforts emphasize intensive fundamental research and the
proactive creation of proprietary investment advantages in carefully selected industry sectors. New Mountain Capital is a generalist firm but has developed particular competitive advantages in what New Mountain Capital believes to be particularly
attractive sectors, such as education, healthcare, logistics, business and industrial services, federal IT services, media, software, insurance, consumer products, financial services and technology, infrastructure and energy. New Mountain Capital is
focused on systematically establishing expertise in new sectors in which it believes it will have a competitive advantage over time.
The Investment Adviser
The
Investment Adviser, a wholly-owned subsidiary of New Mountain Capital, manages the Operating Company’s day-to-day operations and provides it with investment advisory and management services. In particular, the Investment Adviser is responsible
for identifying attractive investment opportunities, conducting research and due diligence on prospective investments, structuring the Operating Company’s investments and monitoring and servicing the Operating Company’s investments. We do
not have, and do not intend to have, any employees. As of March 31, 2012, the Investment Adviser was supported by over 90 staff members of New Mountain Capital, including 58 investment professionals.
The Investment Adviser is managed by the five member Investment Committee, which is responsible for approving purchases and sales of the Operating
Company’s investments above $5.0 million in aggregate by issuer. The Investment Committee currently consists of Steven B. Klinsky, Robert A. Hamwee, Adam Collins, Douglas Londal and Alok Singh. The Investment Committee is responsible for
approving all of the Operating Company’s investment purchases above $5.0 million. The Investment Committee also monitors investments in the Operating Company’s portfolio and approves all asset dispositions above $5.0 million.
Purchases and dispositions below $5.0 million may be approved by the Operating Company’s Chief Executive Officer. These approval thresholds are subject to change over time. We expect to benefit from the extensive and varied relevant
experience of the investment professionals serving on the Investment Committee, which includes expertise in private equity, primary and secondary leveraged credit, private mezzanine finance and distressed debt.
Investment Objectives and Portfolio
The Operating Company’s investment objective is to generate current income and capital appreciation through the sourcing and origination of debt securities at all levels of the capital structure, including
first and second lien debt, notes, bonds and mezzanine securities. In some cases, the Operating Company’s investments may also include equity interests such as preferred stock, common stock, warrants or options received in connection with the
Operating Company’s debt investments or may include a direct investment in the equity of private companies.
The Operating Company
makes investments through both primary originations and open-market secondary purchases. The Operating Company primarily targets loans to, and invests in, the United States middle market businesses, a market segment we believe continues to be
underserved by other lenders. We define middle market businesses as those businesses with annual earnings before interest, taxes, depreciation, and amortization (“EBITDA”) between $20.0 million and $200.0 million. The primary
focus is in the debt of defensive growth companies, which are defined as generally exhibiting the following characteristics: (i) sustainable secular growth drivers, (ii) high barriers to competitive entry, (iii) high free cash flow
after capital expenditure and working capital needs, (iv) high returns on assets and (v) niche market dominance. The Operating Company’s targeted investments
87
typically have maturities of between five and ten years and generally range in size between $10.0 million and $50.0 million. This investment size may vary proportionately as the size of
the Operating Company’s capital base changes. At March 31, 2012, the Operating Company’s portfolio consisted of 57 portfolio companies and was invested 56.3% in first lien loans, 36.3% in second lien loans, 7.0% in subordinated debt and
0.4% in equity and other, as measured at fair value.
The fair value of the Operating Company’s investments was approximately
$758.2 million in 57 portfolio companies at March 31, 2012. For the three months ended March 31, 2012, the Operating Company made approximately $106.7 million of new investments in 11 portfolio companies.
For the three months ended March 31, 2012, the Operating Company had approximately $22.9 million in debt repayments in existing portfolio
companies and sales of securities in nine portfolio companies aggregating approximately $48.8 million. In addition, during the three months ended March 31, 2012, the Operating Company had a change in unrealized appreciation on 39 portfolio
companies totaling approximately $15.4 million, which was offset by a change in unrealized depreciation on 23 portfolio companies totaling approximately $2.7 million.
At March 31, 2012, the Operating Company’s weighted average Unadjusted and Adjusted Yield to Maturity was approximately 10.6% and 12.8%,
respectively. “Adjusted Yield to Maturity” assumes that the investments in the Operating Company’s portfolio are purchased at fair value on March 31, 2012 and held until their respective maturities with no prepayments or losses and
exited at par at maturity. This calculation excludes the impact of existing leverage, except for the non-recourse debt of the Operating Company’s wholly-owned subsidiary, NMF SLF. NMF SLF is treated as a fully levered asset of the Operating
Company, with NMF SLF’s net asset value being included for yield calculation purposes. The actual yield to maturity may be higher or lower due to the future selection of LIBOR contracts by the individual companies in the Operating
Company’s portfolio or other factors. References to “Unadjusted Yield to Maturity” have the same assumptions as Adjusted Yield to Maturity except that NMF SLF is not treated as a fully levered asset of the Operating Company, but
rather the assets themselves are consolidated into the Operating Company.
The following summarizes the Operating Company’s ten
largest portfolio company investments and top ten industries in which the Operating Company was invested as of March 31, 2012, calculated as a percentage of total assets as of March 31, 2012.
|
|
|
|
|
| Portfolio Company |
|
Percent of
Total Assets |
|
| Decision Resources, LLC |
|
|
4.0 |
% |
| Global Knowledge Training LLC |
|
|
3.9 |
% |
| Meritas Schools Holdings, LLC |
|
|
3.7 |
% |
| Managed Health Care Associates, Inc. |
|
|
3.6 |
% |
| Lawson Software, Inc. (fka SoftBrands, Inc.) |
|
|
3.2 |
% |
| Insight Pharmaceuticals LLC |
|
|
3.1 |
% |
| Novell, Inc. (fka Attachmate Corporation, NetIQ Corporation) |
|
|
3.0 |
% |
| Renaissance Learning, Inc. |
|
|
2.6 |
% |
| Learning Care Group (US), Inc. |
|
|
2.5 |
% |
| Transplace Texas, L.P. / U.S. Healthworks Holding Company, Inc.(1) |
|
|
2.5 |
% |
| (1) |
As of March 31, 2012, both Transplace Texas, L.P. and U.S. Healthworks Holding Company, Inc. held the tenth ranking for the Operating Company’s top ten largest portfolio
company investments, with 2.5% of total assets, respectively. |
88
|
|
|
|
|
| Industry |
|
Percent of
Total Assets |
|
| Software |
|
|
20.2 |
% |
| Healthcare Services |
|
|
17.3 |
% |
| Education |
|
|
13.5 |
% |
| Business Services |
|
|
11.9 |
% |
| Federal Services |
|
|
9.0 |
% |
| Healthcare Products |
|
|
4.1 |
% |
| Consumer Services |
|
|
3.8 |
% |
| Information Services |
|
|
3.8 |
% |
| Logistics |
|
|
3.1 |
% |
| Industrial Services |
|
|
2.4 |
% |
Competitive Advantages
We believe that we have the following competitive advantages over other capital providers to middle market companies:
Proven and Differentiated Investment Style With Areas of Deep Industry Knowledge
In making its investment decisions, the Investment Adviser applies New Mountain Capital’s long-standing, consistent investment approach that
has been in place since its founding more than 10 years ago. We focus on companies in less well followed defensive growth niches of the middle market space where we believe few debt funds have built equivalent research and operational size and
scale.
We benefit directly from New Mountain Capital’s private equity investment strategy that seeks to identify attractive
investment sectors from the top down and then works to become a well positioned investor in these sectors. New Mountain Capital focuses on companies and end markets with sustainable strengths in all economic cycles, particularly ones that are
defensive in nature, that are non-cyclical and can maintain pricing power in the midst of a recessionary and/or inflationary environment. New Mountain Capital focuses on companies within sectors in which it has significant expertise (examples
include federal services, software, education, niche healthcare, business services, energy and logistics) while typically avoiding investments in companies with end markets that are highly cyclical, face secular headwinds, are overly-dependent on
consumer demand or are commodity-like in nature.
In making its investment decisions, the Investment Adviser has adopted the approach of
New Mountain Capital, which is based on three primary investment principles:
1. A generalist approach, combined with
proactive pursuit of the highest quality opportunities within carefully selected industries, identified via an intensive and structured ongoing research process;
2. Emphasis on strong downside protection and strict risk controls; and
3. Continued search for superior risk adjusted returns, combined with timely, intelligent exits and outstanding return performance.
Experienced Management Team and Established Platform
The Investment Adviser’s team members have extensive experience in the leveraged lending space. Steven B. Klinsky, New Mountain Capital’s Founder, Chief Executive Officer and Managing Director and
Chairman of the board of directors of the New Mountain Finance Entities, was a general partner of Forstmann Little & Co., a manager of debt and equity funds totaling multiple billions of dollars in the 1980s and 1990s. He was also a
co-founder of Goldman, Sachs & Co.’s Leverage Buyout Group in the period from 1981 to 1984. Robert A. Hamwee, Chief Executive Officer and
89
President of the New Mountain Finance Entities and Managing Director of New Mountain Capital, was formerly President of GSC, where he was the portfolio manager of GSC’s distressed debt funds
and led the development of GSC’s CLOs. Douglas Londal, Managing Director of New Mountain Capital, was previously co-head of Goldman, Sachs & Co.’s U.S. mezzanine debt team. Alok Singh, Managing Director of New Mountain
Capital, has extensive experience structuring debt products as a long-time partner at Bankers Trust Company.
Many of the debt
investments that the Operating Company has made to date have been in the same companies with which New Mountain Capital has already conducted months of intensive acquisition due diligence related to potential private equity investments. We believe
that private equity underwriting due diligence is usually more robust than typical due diligence for loan underwriting. In its underwriting of debt investments, the Investment Adviser is able to utilize the research and hands-on operating experience
that New Mountain Capital’s private equity underwriting teams possess regarding the individual companies and industries. Business and industry due diligence is led by a team of investment professionals of the Investment Adviser that generally
consists of three to seven individuals, typically based on their relevant company and/or industry specific knowledge. Additionally, the Investment Adviser is also able to utilize its relationships with operating management teams and other private
equity sponsors. We believe this differentiates us from many of our competitors.
Significant Sourcing Capabilities and Relationships
We believe the Investment Adviser’s ability to source attractive investment opportunities is greatly aided by both New
Mountain Capital’s historical and current reviews of private equity opportunities in the business segments we target. To date, a significant majority of the investments that the Operating Company has made are in the debt of companies and
industry sectors that were first identified and reviewed in connection with New Mountain Capital’s private equity efforts, and the majority of our current pipeline reflects this as well. Furthermore, the Investment Adviser’s investment
professionals have deep and longstanding relationships in both the private equity sponsor community and the lending/agency community which they have and will continue to utilize to generate investment opportunities.
Risk Management through Various Cycles
New Mountain Capital has emphasized tight control of risk since its inception and long before the recent global financial distress began. To date,
New Mountain Capital has never experienced a bankruptcy of any of its portfolio companies in its private equity efforts or with respect to the Predecessor Entities’ business. The Investment Adviser will seek to emphasize tight control of risk
with our investments in several important ways, consistent with New Mountain Capital’s historical approach. In particular, the Investment Adviser intends to:
| |
Ÿ |
|
Emphasize the origination or purchase of debt in what the Investment Adviser believes are defensive growth companies, which are less likely to be dependent on
macro-economic cycles; |
| |
Ÿ |
|
Target investments in companies that are preeminent market leaders in their own industries, and when possible, investments in companies that have strong
management teams whose skills are difficult for competitors to acquire or reproduce; and |
| |
Ÿ |
|
Emphasize capital structure seniority in the Investment Adviser’s underwriting process. |
Access to Non Mark to Market, Seasoned Leverage Facilities
The amounts available under the Credit Facilities are generally not subject to reduction as a result of mark to market fluctuations in the Operating Company’s portfolio investments. For a detailed discussion
of the Credit Facilities, see “Management’s Discussion and Analysis of Financial Conditions and Results of Operations—Liquidity and Capital Resources”.
90
Market Opportunity
We believe that the size of the market for investments that we target, coupled with the demands of middle market companies for flexible sources of capital at competitive terms and rates, create an attractive
investment environment for us.
| |
Ÿ |
|
The leverage finance market has a high level of financing needs over the next several years due to significant bank debt
maturities. We believe that the large dollar volume of loans that need to be refinanced will present attractive opportunities to invest capital in a manner consistent with our stated objectives.
|
| |
Ÿ |
|
Middle market companies continue to face difficulties in accessing the capital markets. We believe opportunities to serve the
middle market will continue to exist. While many middle market companies were formerly able to raise funds by issuing high-yield bonds, we believe this approach to financing has become more difficult in recent years as institutional investors have
sought to invest in larger, more liquid offerings. In addition, many private finance companies and hedge funds have reduced their middle market lending activities due to decreased availability of their own financing. |
| |
Ÿ |
|
Consolidation among commercial banks has reduced the focus on middle market lending. We believe that many traditional bank lenders
to middle market businesses have either exited or de-emphasized their service and product offerings in the middle market. These traditional lenders have instead focused on lending and providing other services to large corporate clients. We believe
this has resulted in fewer key players and the reduced availability of debt capital to the companies we target. |
| |
Ÿ |
|
Attractive pricing. Reduced access to, and availability of, debt capital typically increases the interest rates, or pricing, of
loans for middle market lenders. Recent primary debt transactions in this market often include upfront fees, prepayment protections and, in some cases, warrants to purchase common stock, all of which should enhance the profitability of new loans to
lenders. |
| |
Ÿ |
|
Conservative deal structures. As a result of the credit crisis, many lenders are requiring larger equity contributions from
financial sponsors. Larger equity contributions create an enhanced margin of safety for lenders because leverage is a lower percentage of the implied enterprise value of the company. |
| |
Ÿ |
|
Large pool of uninvested private equity capital available for new buyouts. We expect that private equity firms will continue to
pursue acquisitions and will seek to leverage their equity investments with mezzanine loans and/or senior loans (including traditional first and second lien, as well as unitranche loans) provided by companies such as ours.
|
Investment Criteria
The Investment Adviser has identified the following investment criteria and guidelines for use in evaluating prospective portfolio companies. However, not all of these criteria and guidelines were, or will be, met
in connection with each of the Operating Company’s investments.
| |
Ÿ |
|
Defensive growth industries. The Operating Company seeks to invest in industries that can succeed in both robust and weak economic
environments but which are also sufficiently large and growing to achieve high valuations providing enterprise value cushion for our targeted debt securities. |
| |
Ÿ |
|
High barriers to competitive entry. The Operating Company targets industries and companies that have well defined end-markets and
well established, understandable barriers to competitive entry. |
91
| |
Ÿ |
|
Recurring revenue. Where possible, the Operating Company focuses on companies that have a high degree of predictability in future
revenue. |
| |
Ÿ |
|
Flexible cost structure. The Operating Company seeks to invest in businesses that have limited fixed costs and therefore modest
operating leverage. |
| |
Ÿ |
|
Strong free cash flow and high return on assets. The Operating Company focuses on businesses with a demonstrated ability to produce
meaningful free cash flow from operations. The Operating Company typically targets companies that are not asset intensive and that have minimal capital expenditure and minimal working capital growth needs. |
| |
Ÿ |
|
Sustainable business and niche market dominance. The Operating Company seeks to invest in businesses that exert niche market
dominance in their industry and that have a demonstrated history of sustaining market leadership over time. |
| |
Ÿ |
|
Established companies. The Operating Company seeks to invest in established companies with sound historical financial performance.
The Operating Company does not intend to invest in start-up companies or companies with speculative business plans. |
| |
Ÿ |
|
Private equity sponsorship. The Operating Company generally seeks to invest in companies in conjunction with private equity
sponsors who it knows and trusts and who have proven capabilities in building value. |
| |
Ÿ |
|
Seasoned management team. The Operating Company generally requires that its portfolio companies have a seasoned management team
with strong corporate governance. Oftentimes the Operating Company has a historical relationship with or direct knowledge of key managers from previous investment experience. |
Investment Selection and Process
The Investment Adviser believes it has developed a proven, consistent and replicable investment process to execute our investment strategy. The Investment Adviser seeks to identify the most attractive investment
sectors from the top down and then works to become the most advantaged investor in these sectors. The steps in the Investment Adviser’s process include:
Identifying attractive investment sectors top down: The Investment Adviser works continuously and in a variety of ways to proactively identify the most attractive sectors for
investment opportunities. The investment professionals of the Investment Adviser participate in this process through both individual and group efforts, formal and informal. The Investment Adviser has also worked with consultants, investment bankers
and public equity managers to supplement its internal analyses, although the prime driver of sector ideas has been the Investment Adviser itself.
Creating competitive advantages in the selected industry sectors: Once a sector has been identified, the Investment Adviser works to make itself the most advantaged and
knowledgeable investor in that sector. An internal working team is assigned to each project. The team may spend months confirming the sector thesis and building the Investment Adviser’s leadership in this sector. In general, the Investment
Adviser seeks to construct proprietary databases and to utilize the best specialized industry consultants. The Investment Adviser particularly stresses the establishment of close relationships with operating managers in each field in order to gain
the deepest possible level of understanding. When advisable, industry executives have been placed on New Mountain Capital’s Management Advisory Board or have been hired on salary as “executives in residence”. When the Investment
Adviser considers specific investment ideas in its chosen sectors, it can triangulate its own views against the views of its management relationships, consultants, brokers, bankers and others. The Investment Adviser believes this multi-front
analysis leads to strong decision making and company identification. The Investment Adviser also believes that its “flexible specialization” approach gives the
92
Operating Company all the benefits of a narrow-based sector fund without forcing the Operating Company to invest in any industry sector at an inappropriate time for that sector. The Investment
Adviser can also become a leading investment expert in lesser known or smaller sectors that would not support an entire fund dedicated solely to them.
Targeting companies with leading market share and attractive business models in its chosen sectors: The Investment Adviser, consistent with New Mountain Capital’s
historical approach, typically follows a “good to great” approach, seeking to invest in debt securities of companies in its chosen sectors that it believes are already safe and successful but where the Investment Adviser sees an
opportunity for further increases in enterprise value due to special circumstances existing at the time of the financing or through value that a sponsor can add. The investment professionals of the Investment Adviser have been successful in
targeting companies with leading market shares, rapid growth, high free cash flows, high operating margins, high barriers to entry and which produce goods or services that are of value to their customers.
Utilizing this research platform, the Operating Company has largely invested in the debt of companies and industries that have been researched by
New Mountain Capital’s private equity efforts. In many instances, the Operating Company has studied the specific debt issuer with which New Mountain Capital has already conducted months of intensive acquisition due diligence related to a
potential private equity investment. In other situations, while New Mountain Capital may not have specifically analyzed the issuer in the past, the Operating Company has deep knowledge of the company’s industry through New Mountain
Capital’s private equity work. We expect the Investment Adviser to continue this approach in the future.
Beyond the foregoing, the
investment professionals of the Investment Adviser have deep and longstanding relationships in both the private equity sponsor community and the lending/agency community. The Operating Company has sourced and we expect the Operating Company to
continue sourcing new investment opportunities from both private equity sponsors and other lenders and agents. In private equity, the Operating Company has strong, personal relationships with principals at a significant majority of relevant
sponsors, and we expect that the Operating Company will continue to utilize those relationships to generate investment opportunities. In the same fashion, the Operating Company has an extensive relationship network with lenders and agents, including
commercial banks, investment banks, loan funds, mezzanine funds and a wide range of smaller agents that seek debt capital on behalf of their clients. In addition to newly issued primary opportunities, the Operating Company has extensive experience
in sourcing investment opportunities from the secondary market, and will continue to actively monitor that large, and often volatile, area for appropriate investment opportunities.
This team performs the core underwriting function to determine the attractiveness of the target’s business model, focusing on the investment
criteria described above. The team ultimately develops a forecast of a target’s likely operating and financial performance. Team members have diverse backgrounds in investment management, investment banking, consulting, and operations. We
believe the presence within New Mountain Capital of numerous former CEOs and other senior operating executives, and their active involvement in the Operating Company’s underwriting process, combined with New Mountain Capital’s experience
as a majority stockholder owning and directing a wide range of businesses and overseeing operating companies in the same or related industries, is a key differentiator for us versus typical debt investment vehicles.
In addition to performing rigorous business due diligence, the Investment Adviser also thoroughly reviews and/or structures the relevant credit
documentation, including bank credit agreements and bond indentures, to ensure that any securities the Operating Company invests in have appropriate credit rights, protections and remedies. There is a strong focus on appropriate covenant packages.
This part of the process, as well as the determination of the appropriate price/yield parameters for
93
individual securities, is led by Robert A. Hamwee, John Kline and James Stone with significant input as needed from other professionals with extensive credit experience, such as Steven B.
Klinsky, New Mountain Capital’s Managing Director, Founder and Chief Executive Officer, Douglas Londal, a New Mountain Capital Managing Director who was formerly co-head of Goldman, Sachs & Co.’s mezzanine debt group, Alok
Singh, a New Mountain Capital Managing Director who has extensive experience structuring debt products as a long-time partner at Bankers Trust Company, and others.
Investment Committee
The Investment Committee currently consists of Steven B. Klinsky, Robert
A. Hamwee, Adam Collins, Douglas Londal and Alok Singh. The Investment Committee is responsible for approving all of the Operating Company’s investment purchases above $5.0 million. The Investment Committee also monitors investments in the
Operating Company’s portfolio and approves all asset dispositions above $5.0 million. Purchases and dispositions below $5.0 million may be approved by the Operating Company’s Chief Executive Officer. These approval thresholds are
subject to change over time. We expect to benefit from the extensive and varied relevant experience of the investment professionals serving on the Investment Committee, which includes expertise in private equity, primary and secondary leveraged
credit, private mezzanine finance and distressed debt.
The purpose of the Investment Committee is to evaluate and approve, as deemed
appropriate, all investments by the Investment Adviser, subject to certain thresholds. The Investment Committee process is intended to bring the diverse experience and perspectives of the Investment Committee’s members to the analysis and
consideration of every investment. The Investment Committee also serves to provide investment consistency and adherence to the Investment Adviser’s investment philosophies and policies. The Investment Committee also determines appropriate
investment sizing and suggests ongoing monitoring requirements.
In addition to reviewing investments, the Investment Committee meetings
serve as a forum to discuss credit views and outlooks. Potential transactions and investment opportunities are also reviewed on a regular basis. Members of the Operating Company’s investment team are encouraged to share information and views on
credits with the committee early in their analysis. This process improves the quality of the analysis and assists the deal team members to work more efficiently.
Investment Structure
The Operating Company targets debt investments that will yield
meaningful current income and occasionally provide the opportunity for capital appreciation through equity securities. The Operating Company’s debt investments are typically structured with the maximum seniority and collateral that the
Operating Company can reasonably obtain while seeking to achieve its total return target.
Debt Investments
The terms of the Operating Company’s debt investments are tailored to the facts and circumstances of the transaction and prospective portfolio
company and structured to protect its rights and manage its risk while creating incentives for the portfolio company to achieve its business plan. A substantial source of return is the cash interest that the Operating Company collects on its debt
investments.
| |
Ÿ |
|
First Lien Loans and Bonds. First lien loans and bonds generally have terms of four to seven years, provide for a variable or fixed
interest rate, may contain prepayment penalties and are secured by a first priority security interest in all existing and future assets of the borrower. |
94
| |
Ÿ |
|
Second Lien Loans and Bonds. Second lien loans and bonds generally have terms of five to eight years, provide for a variable or
fixed interest rate, may contain prepayment penalties and are secured by a second priority security interest in all existing and future assets of the borrower. These second lien loans and bonds may include PIK interest, which represents contractual
interest accrued and added to the principal that generally becomes due at maturity. |
| |
Ÿ |
|
Unsecured Senior, Subordinated and “Mezzanine” Loans and Bonds. Any unsecured investments are generally expected to have
terms of five to ten years and provide for a fixed interest rate. Unsecured investments may include PIK interest, which represents contractual interest accrued and added to the principal that generally becomes due at maturity, and may have an equity
component, such as warrants to purchase common stock in the portfolio company. |
In addition, from time to time the
Operating Company may also enter into bridge or other commitments which can result in providing future financing to a portfolio company.
Equity
Investments
When the Operating Company makes a debt investment, it may be granted equity in the portfolio company in the same
class of security as the sponsor receives upon funding. In addition, the Operating Company may from time to time make non-control, equity co-investments in conjunction with private equity sponsors. The Operating Company generally seeks to structure
its equity investments, such as direct equity co-investments, to provide it with minority rights provisions and event-driven put rights. The Operating Company also seeks to obtain limited registration rights in connection with these investments,
which may include “piggyback” registration rights.
Portfolio Company Monitoring
The Operating Company monitors the performance and financial trends of its portfolio companies on at least a quarterly basis. The Operating Company
attempts to identify any developments within the portfolio company, the industry or the macroeconomic environment that may alter any material element of its original investment strategy. The Operating Company uses several methods of evaluating and
monitoring the performance of its investments, including but not limited to, the following:
| |
Ÿ |
|
review of monthly and quarterly financial statements and financial projections for portfolio companies provided by its management; |
| |
Ÿ |
|
ongoing dialogue with and review of original diligence sources; |
| |
Ÿ |
|
periodic contact with portfolio company management (and, if appropriate the private equity sponsor) to discuss financial position, requirements and
accomplishments; and |
| |
Ÿ |
|
assessment of business development success, including product development, profitability and the portfolio company’s overall adherence to its business plan.
|
The Operating Company uses an investment rating system to characterize and monitor the credit profile and expected
level of returns on each investment in the portfolio. The Operating Company uses a four-level numeric rating scale as follows:
| |
Ÿ |
|
Investment Rating 1—Investment is performing materially above expectations; |
| |
Ÿ |
|
Investment Rating 2—Investment is performing materially in-line with expectations. All new loans are rated 2 at initial purchase;
|
| |
Ÿ |
|
Investment Rating 3—Investment is performing materially below expectations and risk has increased materially since the original investment; and
|
95
| |
Ÿ |
|
Investment Rating 4—Investment is performing substantially below expectations and risks have increased substantially since the original investment. Payments
may be delinquent. There is a meaningful possibility that the Operating Company will not recoup its original cost basis in the investment and may realize a substantial loss upon exit. |
The following table shows the distribution of the Operating Company’s investments on the 1 to 4 investment rating scale at fair value as of
March 31, 2012:
|
|
|
|
|
|
|
|
|
|
|
|
|
|
|
|
|
| |
|
As of March 31, 2012 |
|
| Investment Rating |
|
Par
Value(1) |
|
|
Percent |
|
|
Fair
Value |
|
|
Percent |
|
| Investment Rating 1 |
|
$ |
135.4 |
|
|
|
17.0 |
% |
|
$ |
124.2 |
|
|
|
16.4 |
% |
| Investment Rating 2 |
|
|
654.9 |
|
|
|
82.4 |
% |
|
|
633.6 |
|
|
|
83.5 |
% |
| Investment Rating 3 |
|
|
— |
|
|
|
— |
% |
|
|
— |
|
|
|
— |
% |
| Investment Rating 4 |
|
|
4.4 |
|
|
|
0.6 |
% |
|
|
0.4 |
|
|
|
0.1 |
% |
|
|
|
|
|
|
|
|
|
|
|
|
|
|
|
|
|
|
|
$ |
794.7 |
|
|
|
100.0% |
|
|
$ |
758.2 |
|
|
|
100.0% |
|
| (1) |
Excludes shares and warrants. |
Exit
Strategies/Refinancing
The Operating Company exits its investments typically through one of four scenarios: (i) the sale of
the portfolio company itself resulting in repayment of all outstanding debt, (ii) the recapitalization of the portfolio company in which the Operating Company’s loan is replaced with debt or equity from a third party or parties (in some
cases, the Operating Company may choose to participate in the newly issued loan(s)), (iii) the repayment of the initial or remaining principal amount of the Operating Company’s loan then outstanding at maturity or (iv) the sale of the
debt investment by the Operating Company. In some investments, there may be scheduled amortization of some portion of the Operating Company’s loan which would result in a partial exit of its investment prior to the maturity of the loan.
Managerial Assistance
In order to count portfolio securities as qualifying assets for the purpose of the 70.0% test, the Operating Company must either control the issuer of the securities or must offer to make available to the issuer of
the securities (other than small and solvent companies described above) significant managerial assistance, except that, where the Operating Company purchases such securities in conjunction with one or more other persons acting together, one of the
other persons in the group may make available such managerial assistance. Making available managerial assistance means, among other things, any arrangement whereby the BDC offers to provide, and, if accepted, does so provide, significant guidance
and counsel concerning the management, operations or business objectives and policies of a portfolio company. The Administrator or its affiliate provides such managerial assistance on the Operating Company’s behalf to portfolio companies that
request this assistance.
Competition
The Operating Company competes for investments with a number of BDCs and investment funds (including private equity and hedge funds), as well as traditional financial services companies such as commercial banks and
other sources of financing. Many of these entities have greater financial and managerial resources than we do. We believe the Operating Company is able to be competitive with these entities primarily on the basis of the experience and contacts of
its management team, the Operating Company’s responsive and efficient investment analysis and decision-making processes,
96
the investment terms the Operating Company offers, the leveraged model that the Operating Company employs to perform its due diligence with the broader New Mountain Capital team and the Operating
Company’s model of investing in companies and industries it knows well.
We believe that some of the Operating Company’s
competitors may make investments with interest rates and returns that are comparable to or lower than the rates and returns that the Operating Company targets. Therefore, the Operating Company does not seek to compete solely on the interest rates
and returns that it offers to potential portfolio companies. For additional information concerning the competitive risks we face, see “Risk Factors—Risks Relating to Our Business.”
Employees
We do not have
any employees. Day-to-day investment operations that are conducted by the Operating Company are managed by the Investment Adviser. See “Investment Management Agreement”. The Operating Company reimburses the Administrator for the allocable
portion of overhead and other expenses incurred by it in performing its obligations to the New Mountain Finance Entities under the Administration Agreement, including the compensation of the New Mountain Finance Entities’ chief financial
officer and chief compliance officer, and their respective staffs. For a more detailed discussion of the Administration Agreement, see “Administration Agreement”.
Properties
Our executive office is located at 787 Seventh Avenue, 48th Floor, New
York, New York 10019. We believe that our current office facilities are adequate for our business as we intend to conduct it.
Legal
Proceedings
The New Mountain Finance Entities, the Investment Adviser and the Administrator are not currently subject to any
material legal proceedings, although these entities may, from time to time, be involved in litigation arising out of operations in the normal course of business or otherwise.
97
PORTFOLIO COMPANIES
The following table sets forth certain information as of March 31, 2012, for each portfolio company in which the Operating Company had a debt or
equity investment. Other than these investments, the Operating Company’s only formal relationships with its portfolio companies are the managerial assistance ancillary to its investments that the Operating Company may provide, if requested, and
the board observation or participation rights the Operating Company may receive. We do not “control” nor are we an “affiliate” of any of the Operating Company’s portfolio companies, each as defined in the 1940 Act. In
general, under the 1940 Act, we would “control” a portfolio company if we owned more than 25.0% of its voting securities and would be an “affiliate” of a portfolio company if we owned five percent or more of its voting
securities.
|
|
|
|
|
|
|
|
|
|
|
|
|
|
|
|
|
|
|
|
|
|
|
| Name / Address of Portfolio Company |
|
Industry |
|
Type of
Investment |
|
Interest Rate(1) |
|
Maturity
Date |
|
|
Yield to
Maturity(2) |
|
|
Percent of
Class Held(4) |
|
|
Fair
Value |
|
| Advantage Sales & Marketing Inc.
18100 Von Karman Ave., Suite 1000 |
|
Business Services |
|
First lien |
|
6.25% (P + 300/Q) |
|
|
12/17/2015 |
|
|
|
8.9 |
% |
|
|
— |
|
|
$ |
3,885,000 |
|
| Irvine, CA 92612 |
|
Business Services |
|
First lien - Undrawn |
|
— |
|
|
12/17/2015 |
|
|
|
N/A |
|
|
|
— |
|
|
|
(472,500 |
) |
|
|
|
|
|
|
|
|
|
|
|
|
|
|
|
|
|
|
|
|
|
|
|
|
|
|
|
|
|
|
|
|
|
|
|
|
|
|
|
|
|
|
|
|
3,412,500 |
|
|
|
|
|
|
|
|
|
|
|
|
|
|
|
|
|
|
|
|
|
|
|
|
| Airvana Network Solutions Inc.
19 Alpha Road Chelmsford, MA 01824 |
|
Software |
|
First lien |
|
10.00% (L + 800/Q) |
|
|
3/25/2015 |
|
|
|
12.3 |
% |
|
|
— |
|
|
|
6,002,857 |
|
|
|
|
|
|
|
|
|
| Alion Science and Technology Corporation
1750 Tysons Boulevard, Suite 1300 |
|
Federal Services |
|
First lien |
|
10.00% + 200 PIK/S* |
|
|
11/1/2014 |
|
|
|
15.8 |
% |
|
|
— |
|
|
|
5,802,876 |
|
| McLean, VA 22102 |
|
Federal Services |
|
Warrants |
|
— |
|
|
— |
|
|
|
— |
|
|
|
1.9 |
% |
|
|
244,237 |
|
|
|
|
|
|
|
|
|
|
|
|
|
|
|
|
|
|
|
|
|
|
|
|
|
|
|
|
|
|
|
|
|
|
|
|
|
|
|
|
|
|
|
|
|
6,047,113 |
|
|
|
|
|
|
|
|
|
|
|
|
|
|
|
|
|
|
|
|
|
|
|
|
| ATI Acquisition Company (fka Ability Acquisition, Inc.)
6351 Boulevard 26, Suite 200 |
|
Education |
|
First lien |
|
12.25% (P + 500 + 400 PIK/Q) (6)* |
|
|
12/30/2014 |
|
|
|
131.0 |
% |
|
|
— |
|
|
|
443,250 |
|
| North Richland Hills, TX 76180 |
|
Education |
|
First lien |
|
17.25% (P + 1000 + 400 PIK/Q)* |
|
|
6/30/2012 |
|
|
|
18.4 |
% |
|
|
— |
|
|
|
101,848 |
|
|
|
Education |
|
First lien |
|
17.25% (P + 1000 + 400 PIK/Q)* |
|
|
6/30/2012 |
|
|
|
18.4 |
% |
|
|
— |
|
|
|
1,648,706 |
|
|
|
|
|
|
|
|
|
|
|
|
|
|
|
|
|
|
|
|
|
|
|
|
|
|
|
|
|
|
|
|
|
|
|
|
|
|
|
|
|
|
|
|
|
2,193,804 |
|
|
|
|
|
|
|
|
|
|
|
|
|
|
|
|
|
|
|
|
|
|
|
|
| Brickman Group Holdings, Inc.
18227 Flower Hill Way, Suite D
Gaithersburg, VA 20879 |
|
Business Services |
|
Subordinated |
|
9.13%/S |
|
|
11/1/2018 |
|
|
|
10.1 |
% |
|
|
— |
|
|
|
3,540,500 |
|
|
|
|
|
|
|
|
|
| Brock Holdings III, Inc.
10343 Sam Houston Park Drive, #200
Houston, TX 77064 |
|
Industrial Services |
|
Second lien |
|
10.00% (L + 825/Q) |
|
|
3/16/2018 |
|
|
|
10.9 |
% |
|
|
— |
|
|
|
14,812,500 |
|
|
|
|
|
|
|
|
|
| CHG Companies, Inc.
6440 South Millrock Drive, Suite 175
Salt Lake City, UT 84121 |
|
Healthcare Services |
|
Second lien |
|
11.25% (L + 950/Q) |
|
|
4/7/2017 |
|
|
|
11.7 |
% |
|
|
— |
|
|
|
10,050,000 |
|
|
|
|
|
|
|
|
|
| Decision Resources, LLC
8 New England Executive Park
Burlington, MA 01803 |
|
Business Services |
|
Second lien |
|
9.50% (L + 800/M) |
|
|
5/7/2018 |
|
|
|
10.6 |
% |
|
|
— |
|
|
|
14,282,500 |
|
|
|
|
|
|
|
|
|
| Education Management LLC**
210 Sixth Avenue, 33rd Floor
Pittsburgh, PA 15222 |
|
Education |
|
First lien - Undrawn |
|
— |
|
|
6/1/2012 |
|
|
|
N/A |
|
|
|
— |
|
|
|
(45,000 |
) |
98
|
|
|
|
|
|
|
|
|
|
|
|
|
|
|
|
|
|
|
|
|
|
|
| Name / Address of Portfolio Company |
|
Industry |
|
Type of
Investment |
|
Interest Rate(1) |
|
Maturity
Date |
|
|
Yield to
Maturity(2) |
|
|
Percent of
Class Held(4) |
|
|
Fair
Value |
|
| Global Knowledge Training LLC
9000 Regency Parkway, Suite 400 |
|
Education |
|
Second lien |
|
11.50% (L + 975/Q) |
|
|
10/21/2018 |
|
|
|
12.8 |
% |
|
|
— |
|
|
|
23,755,300 |
|
| Cary, NC 27518 |
|
Education |
|
Ordinary shares |
|
— |
|
|
— |
|
|
|
— |
|
|
|
4.2 |
% |
|
|
2,109 |
|
|
|
Education |
|
Preferred shares |
|
— |
|
|
— |
|
|
|
— |
|
|
|
4.2 |
% |
|
|
2,422,891 |
|
|
|
|
|
|
|
|
|
|
|
|
|
|
|
|
|
|
|
|
|
|
|
|
|
|
|
|
|
|
|
|
|
|
|
|
|
|
|
|
|
|
|
|
|
26,180,300 |
|
|
|
|
|
|
|
|
|
|
|
|
|
|
|
|
|
|
|
|
|
|
|
|
| IDQ Holdings Inc.
2901 West Kingsley Road Garland, TX 75041 |
|
Consumer Products |
|
First lien |
|
11.50%/S |
|
|
4/1/2017 |
|
|
|
11.2 |
% |
|
|
— |
|
|
|
6,437,500 |
|
|
|
|
|
|
|
|
|
| Immucor, Inc.
3130 Gateway Drive Northwest
Norcross, GA 30071 |
|
Healthcare Services |
|
Subordinated |
|
11.13%/S |
|
|
8/15/2019 |
|
|
|
9.3 |
% |
|
|
— |
|
|
|
5,581,250 |
|
|
|
|
|
|
|
|
|
| Infor Lux Bond Company**
8-10 rue Mathias Hardt L-1717 Luxembourg |
|
Software |
|
Subordinated |
|
8.47% PIK (L + 800/M)* |
|
|
9/2/2014 |
|
|
|
8.9 |
% |
|
|
— |
|
|
|
10,179,289 |
|
|
|
|
|
|
|
|
|
| Insight Pharmaceuticals LLC
1170 Wheeler Way, Suite 150
Langhorne, PA 19407 |
|
Healthcare Products |
|
Second lien |
|
13.25% (L + 1175/Q) |
|
|
8/25/2017 |
|
|
|
14.6 |
% |
|
|
— |
|
|
|
24,656,250 |
|
|
|
|
|
|
|
|
|
| KeyPoint Government Solutions, Inc.
1750 Foxtail Drive Loveland, CO 80538 |
|
Federal Services |
|
First lien |
|
10.00% (L + 800/Q) |
|
|
12/31/2015 |
|
|
|
10.2 |
% |
|
|
— |
|
|
|
17,863,875 |
|
|
|
|
|
|
|
|
|
| Kronos Incorporated
297 Billerica Road Chelmsford, MA 01824 |
|
Software |
|
First lien - Undrawn |
|
— |
|
|
6/11/2013 |
|
|
|
N/A |
|
|
|
— |
|
|
|
(272,903 |
) |
|
|
|
|
|
|
|
|
| Lawson Software, Inc.
(fka SoftBrands, Inc.)
380 St. Peter Street St. Paul, MN 55102 |
|
Software |
|
Subordinated |
|
11.50%/S |
|
|
7/15/2018 |
|
|
|
9.5 |
% |
|
|
— |
|
|
|
14,985,000 |
|
|
|
|
|
|
|
|
|
| Learning Care Group (US), Inc.
21333 Haggerty Road, Suite 300 |
|
Education |
|
First lien |
|
12.00%/S |
|
|
4/27/2016 |
|
|
|
13.9 |
% |
|
|
— |
|
|
|
16,695,606 |
|
| Novi, MI 48375 |
|
Education |
|
Subordinated |
|
15.00% PIK/S* |
|
|
6/30/2016 |
|
|
|
18.5 |
% |
|
|
— |
|
|
|
2,971,990 |
|
|
|
Education |
|
Warrants |
|
— |
|
|
— |
|
|
|
— |
|
|
|
0.7 |
% |
|
|
14,372 |
|
|
|
|
|
|
|
|
|
|
|
|
|
|
|
|
|
|
|
|
|
|
|
|
|
|
|
|
|
|
|
|
|
|
|
|
|
|
|
|
|
|
|
|
|
19,681,968 |
|
|
|
|
|
|
|
|
|
|
|
|
|
|
|
|
|
|
|
|
|
|
|
|
| LVI Services Inc.
80 Broad Street, 3rd Floor New York, NY 10004 |
|
Industrial Services |
|
First lien |
|
9.25% (L + 750/Q) |
|
|
3/31/2014 |
|
|
|
20.7 |
% |
|
|
— |
|
|
|
4,249,379 |
|
|
|
|
|
|
|
|
|
| Mach Gen, LLC
9300 U.S. Highway 9W Athens, NY 12105 |
|
Power Generation |
|
Second lien |
|
7.99% PIK (L + 750/Q)* |
|
|
2/22/2015 |
|
|
|
24.1 |
% |
|
|
— |
|
|
|
5,569,227 |
|
|
|
|
|
|
|
|
|
| Managed Health Care Associates, Inc.
25-B Vreeland Road, Suite 300 |
|
Healthcare Services |
|
First lien |
|
3.50% (L + 325/M) |
|
|
8/1/2014 |
|
|
|
6.9 |
% |
|
|
— |
|
|
|
14,500,943 |
|
| Florham Park, NJ 07932 |
|
Healthcare Services |
|
Second lien |
|
6.75% (L + 650/M) |
|
|
2/1/2015 |
|
|
|
10.4 |
% |
|
|
— |
|
|
|
13,950,000 |
|
|
|
|
|
|
|
|
|
|
|
|
|
|
|
|
|
|
|
|
|
|
|
|
|
|
|
|
|
|
|
|
|
|
|
|
|
|
|
|
|
|
|
|
|
28,450,943 |
|
|
|
|
|
|
|
|
|
|
|
|
|
|
|
|
|
|
|
|
|
|
|
|
99
|
|
|
|
|
|
|
|
|
|
|
|
|
|
|
|
|
|
|
|
|
|
|
| Name / Address of Portfolio Company |
|
Industry |
|
Type of
Investment |
|
Interest Rate(1) |
|
Maturity
Date |
|
|
Yield to
Maturity(2) |
|
|
Percent of
Class Held(4) |
|
|
Fair
Value |
|
| Merge Healthcare Inc.
6737 W. Washington Street, Suite 2250 Milwaukee, WI 53214 |
|
Healthcare Services |
|
First lien |
|
11.75%/S |
|
|
5/1/2015 |
|
|
|
8.9 |
% |
|
|
— |
|
|
|
9,765,000 |
|
|
|
|
|
|
|
|
|
| Meritas Schools Holdings, LLC
630 Dundee Road, Suite 400 Northbrook, IL 60062 |
|
Education |
|
Second lien |
|
11.50% (L + 1000/Q) |
|
|
1/29/2018 |
|
|
|
12.2 |
% |
|
|
— |
|
|
|
20,100,000 |
|
|
|
|
|
|
|
|
|
| Merrill Communications LLC
One Merrill Circle St. Paul, MN 55108 |
|
Business Services |
|
First lien |
|
7.50% (L + 550/M) |
|
|
12/24/2012 |
|
|
|
17.4 |
% |
|
|
— |
|
|
|
10,736,481 |
|
|
|
|
|
|
|
|
|
| NEWAsurion Corporation(7)
648 Grassmere Park, Suite 300
Nasville, TN 37211 |
|
|
|
|
|
|
|
|
|
|
|
|
|
|
|
|
|
|
|
|
|
|
| Asurion, LLC (fka Asurion Corporation) |
|
Business Services |
|
Second lien |
|
9.00% (L + 750/Q) |
|
|
5/24/2019 |
|
|
|
9.5 |
% |
|
|
— |
|
|
|
5,076,250 |
|
| Lonestar Intermediate Super Holdings, LLC |
|
Business Services |
|
Subordinated |
|
11.00% (L + 950/Q) |
|
|
9/2/2019 |
|
|
|
11.7 |
% |
|
|
— |
|
|
|
12,195,000 |
|
|
|
|
|
|
|
|
|
|
|
|
|
|
|
|
|
|
|
|
|
|
|
|
|
|
|
|
|
|
|
|
|
|
|
|
|
|
|
|
|
|
|
|
|
17,271,250 |
|
|
|
|
|
|
|
|
|
|
|
|
|
|
|
|
|
|
|
|
|
|
|
|
| Novell, Inc. (fka Attachmate Corporation, NetIQ Corporation)
1500 Dexter Ave N. Seattle, WA 98109 |
|
Software |
|
Second lien |
|
9.50% (L + 800/Q) |
|
|
10/27/2017 |
|
|
|
10.1 |
% |
|
|
— |
|
|
|
20,025,000 |
|
|
|
|
|
|
|
|
|
| Ozburn-Hessey Holding Company LLC
7101 Executive Center Drive, Suite 333
Brentwood, TN 37027 |
|
Logistics |
|
Second lien |
|
11.50% (L + 950/Q) |
|
|
10/10/2016 |
|
|
|
18.3 |
% |
|
|
— |
|
|
|
4,950,000 |
|
|
|
|
|
|
|
|
|
| Permian Tank & Manufacturing, Inc.
2701 West Interstate 20 Odessa, TX 79766 |
|
Energy |
|
First lien |
|
9.50% (Base Rate + 775/Q)(3) |
|
|
3/15/2017 |
|
|
|
10.6 |
% |
|
|
— |
|
|
|
12,675,000 |
|
|
|
|
|
|
|
|
|
| Physio-Control International, Inc.
11811 Willows Road NE Redmond, WA 98073 |
|
Healthcare Products |
|
First lien |
|
9.88%/S |
|
|
1/15/2019 |
|
|
|
9.1 |
% |
|
|
— |
|
|
|
7,385,000 |
|
|
|
|
|
|
|
|
|
| PODS, Inc.(5)
5585 Rio Vista Drive Clearwater, FL 33760 |
|
|
|
|
|
|
|
|
|
|
|
|
|
|
|
|
|
|
|
|
|
|
| Storapod Holding Company, Inc. |
|
Consumer Services |
|
Subordinated |
|
21.00% PIK/A* |
|
|
11/29/2017 |
|
|
|
23.5 |
% |
|
|
— |
|
|
|
3,599,461 |
|
| Storapod Holding Company, Inc. |
|
Consumer Services |
|
Subordinated - Undrawn |
|
— |
|
|
11/29/2017 |
|
|
|
N/A |
|
|
|
— |
|
|
|
— |
|
| Storapod Holding Company, Inc. |
|
Consumer Services |
|
Warrants |
|
— |
|
|
— |
|
|
|
— |
|
|
|
10.4 |
% |
|
|
129,181 |
|
|
|
|
|
|
|
|
|
|
|
|
|
|
|
|
|
|
|
|
|
|
|
|
|
|
|
|
|
|
|
|
|
|
|
|
|
|
|
|
|
|
|
|
|
3,728,642 |
|
|
|
|
|
|
|
|
|
|
|
|
|
|
|
|
|
|
|
|
|
|
|
|
| Premier Dental Services, Inc. (Western)
530 S. Main Street, 6th Floor
Orange, California 92868 |
|
Healthcare Services |
|
First lien |
|
5.97% (L + 550/Q) |
|
|
7/1/2013 |
|
|
|
11.7 |
% |
|
|
— |
|
|
|
9,364,122 |
|
|
|
|
|
|
|
|
|
| Renaissance Learning, Inc.
P.O.Box 8036 Wisconsin Rapids, WI 54495 |
|
Education |
|
Second lien |
|
12.00% (L + 1050/Q) |
|
|
10/19/2018 |
|
|
|
12.7 |
% |
|
|
— |
|
|
|
20,200,000 |
|
|
|
|
|
|
|
|
|
| RGIS Services, LLC
2000 East Taylor Road Auburn Hills, MI 48326 |
|
Business Services |
|
First lien -Undrawn |
|
— |
|
|
4/30/2013 |
|
|
|
N/A |
|
|
|
— |
|
|
|
(212,500 |
) |
100
|
|
|
|
|
|
|
|
|
|
|
|
|
|
|
|
|
|
|
|
|
|
|
| Name / Address of Portfolio Company |
|
Industry |
|
Type of
Investment |
|
Interest Rate(1) |
|
Maturity
Date |
|
|
Yield to
Maturity(2) |
|
|
Percent of
Class Held(4) |
|
|
Fair
Value |
|
| Rocket Software, Inc.
77 Fourth Avenue Waltham, MA 02451 |
|
Software |
|
Second lien |
|
10.25% (L + 875/M) |
|
|
2/8/2019 |
|
|
|
11.1 |
% |
|
|
— |
|
|
|
17,500,000 |
|
|
|
|
|
|
|
|
|
| SonicWALL, Inc.
2001 Logic Drive San Jose, CA 95124 |
|
Software |
|
Second lien |
|
12.00% (L + 1000/M) |
|
|
1/23/2017 |
|
|
|
11.9 |
% |
|
|
— |
|
|
|
10,250,000 |
|
|
|
|
|
|
|
|
|
| Stratus Technologies, Inc.
111 Powdermill Road |
|
Information Technology |
|
First lien |
|
12.00%/S |
|
|
3/29/2015 |
|
|
|
18.0 |
% |
|
|
— |
|
|
|
6,058,963 |
|
| Maynard, MA 01754 |
|
Information Technology |
|
Ordinary shares |
|
— |
|
|
— |
|
|
|
— |
|
|
|
3.3 |
% |
|
|
29,881 |
|
|
|
Information Technology |
|
Preferred shares |
|
— |
|
|
— |
|
|
|
— |
|
|
|
3.3 |
% |
|
|
6,800 |
|
|
|
|
|
|
|
|
|
|
|
|
|
|
|
|
|
|
|
|
|
|
|
|
|
|
|
|
|
|
|
|
|
|
|
|
|
|
|
|
|
|
|
|
|
6,095,644 |
|
|
|
|
|
|
|
|
|
|
|
|
|
|
|
|
|
|
|
|
|
|
|
|
| Sunquest Information Systems, Inc. (Misys Hospital Systems, Inc.)
250 South Williams Boulevard
Tucson, AZ 85711 |
|
Healthcare Services |
|
Second lien |
|
9.75% (L + 850/Q) |
|
|
6/16/2017 |
|
|
|
9.5 |
% |
|
|
— |
|
|
|
9,315,000 |
|
|
|
|
|
|
|
|
|
| Transplace Texas, L.P.
3010 Gaylord Parkway, Suite 200
Frisco, TX 75034 |
|
Logistics |
|
Second lien |
|
11.00% (L + 900/Q) |
|
|
4/12/2017 |
|
|
|
12.2 |
% |
|
|
— |
|
|
|
19,500,000 |
|
|
|
|
|
|
|
|
|
| Unitek Global Services, Inc.
Gwynedd Hall, 1777 Sentry Parkway West Suite 302
Blue Bell, PA 19422 |
|
Business Services |
|
First lien |
|
9.00% (L + 750/Q) |
|
|
4/15/2018 |
|
|
|
10.1 |
% |
|
|
— |
|
|
|
19,416,375 |
|
|
|
|
|
|
|
|
|
| U.S. Healthworks Holding Company, Inc.
25124 Springfield Court, Suite 200
Valencia, CA 91355 |
|
Healthcare Services |
|
Second lien |
|
10.50% (L + 900/Q) |
|
|
6/15/2017 |
|
|
|
11.8 |
% |
|
|
— |
|
|
|
19,500,000 |
|
|
|
|
|
|
|
|
|
| Vertafore, Inc.
11724 NE 195th Street Bothell, WA 98011 |
|
Software |
|
Second lien |
|
9.75% (L + 825/Q) |
|
|
10/29/2017 |
|
|
|
10.3 |
% |
|
|
— |
|
|
|
10,020,830 |
|
|
|
|
|
|
|
|
|
| Vision Solutions, Inc.
17911 Von Karman, Suite 500
Irvine, CA 92614 |
|
Software |
|
Second lien |
|
9.50% (L + 800/M) |
|
|
7/23/2017 |
|
|
|
10.5 |
% |
|
|
— |
|
|
|
11,820,000 |
|
|
|
|
|
|
|
|
|
| Volume Services America, Inc. (Centerplate)
2187 Atlantic Street Stamford, CT 06902 |
|
Consumer Services |
|
First lien |
|
10.50% (Base Rate + 850/Q)(3) |
|
|
9/16/2016 |
|
|
|
10.6 |
% |
|
|
— |
|
|
|
14,966,802 |
|
|
|
|
|
|
|
|
|
|
|
|
|
|
|
|
|
|
|
|
|
|
|
|
| Total Investments |
|
|
|
|
|
|
|
|
|
|
|
|
|
|
|
|
|
|
|
$ |
498,231,498 |
|
|
|
|
|
|
|
|
|
|
|
|
|
|
|
|
|
|
|
|
|
|
|
|
| (1) |
All interest is payable in cash unless otherwise indicated. A majority of the variable rate debt investments bear interest at a rate that may be determined by reference to LIBOR
(L) or the Prime Rate (P) and which resets quarterly (Q), monthly (M), semi-annually (S) or annually (A). For each debt investment we have provided the current interest rate in effect as of March 31, 2012. |
| (2) |
Assumes that the investments in our portfolio as of a certain date, the Portfolio Date, are purchased at fair value on that date and held until their respective maturities with
no prepayments or losses and are exited at par at maturity. Also assumes that unfunded revolvers remain undrawn. Interest income is assumed to be received quarterly for all debt securities. For floating rate debt securities, the interest rate is
calculated by adding the spread to the projected three-month LIBOR at each respective quarter, which is determined based on the forward three-month LIBOR curve per Bloomberg as of the Portfolio Date. This calculation excludes the impact of existing
leverage. |
| (3) |
The base rate and spread is a blended interest rate. The base rate is determined by reference to both LIBOR and Prime Rate. |
| (4) |
Percent of class held is presented only for equity positions. |
101
| (5) |
The Operating Company directly or indirectly, through its subsidiary NMF SLF, holds investments in two related entities of PODS, Inc. The Operating Company directly holds
warrants in Storapod Holding Company, Inc. (“Storapod”) and has a credit investment in Storapod through Storapod WCF II Limited (“Storapod WCF II”). Storapod WCF II is a special purpose entity used to enter into a
Shari’ah-compliant financing arrangement with Storapod. Additionally, NMF SLF has a credit investment in PODS Funding Corp. II (“PODS II”). PODS, Inc. is a wholly-owned subsidiary of PODS Holding, Inc., which in turn is a
majority-owned subsidiary of Storapod. PODS II is a special purpose entity used to enter into a Shari’ah-compliant financing arrangement with PODS, Inc. and its subsidiary, PODS Enterprises, Inc. |
| (6) |
Investment is on non-accrual status. |
| (7) |
The Operating Company holds investments in two related entities of NEWAsurion Corporation. The Operating Company has credit investments in Asurion, LLC and Lonestar Intermediate
Super Holdings, LLC. Asurion, LLC is a wholly-owned subsidiary of Lonestar Intermediate Holdings, LLC, which in turn is a wholly-owned subsidiary of Lonestar Intermediate Super Holdings, LLC. |
| * |
All or a portion of interest contains payments-in-kind (“PIK”). |
| ** |
Indicates assets that the Operating Company deems to be “non-qualifying assets” under Section 55(a) of the Investment Company Act of 1940, as amended. Qualifying assets
must represent at least 70.00% of the Operating Company’s total assets at the time of acquisition of any additional non-qualifying assets. |
As of March 31, 2012, the Operating Company had no single investment that represented greater than 5.0% of the Operating Company’s total assets.
NMF SLF PORTFOLIO COMPANIES
The following table sets forth certain information as of March 31, 2012, for each portfolio company in which NMF SLF had a debt investment. We do
not “control” nor are we an “affiliate” of any of NMF SLF’s portfolio companies, each as defined in the 1940 Act. In general, under the 1940 Act, we would “control” a portfolio company if we owned more than 25.0%
of its voting securities and would be an “affiliate” of a portfolio company if we owned five percent or more of its voting securities.
|
|
|
|
|
|
|
|
|
|
|
|
|
|
|
|
|
|
|
|
|
| Name / Address of
Portfolio Company |
|
Industry |
|
Type of
Investment |
|
Interest Rate(1) |
|
Maturity
Date |
|
Yield to
Maturity(2) |
|
|
Percent of
Class Held(4) |
|
|
Fair
Value |
|
| Aspen Dental Management, Inc
281 Sanders Creek Parkway East Syracuse, New York 13057 |
|
Healthcare Services |
|
First lien |
|
7.00% (L + 550/Q) |
|
10/6/2016 |
|
|
7.4 |
% |
|
|
— |
|
|
$ |
12,918,872 |
|
|
|
|
|
|
|
|
|
| Brickman Group Holdings, Inc.
18227 Flower Hill Way, Suite D
Gaithersburg, VA 20879 |
|
Business Services |
|
First lien |
|
7.25% (L + 550/M) |
|
10/14/2016 |
|
|
7.3 |
% |
|
|
— |
|
|
|
8,010,072 |
|
|
|
|
|
|
|
|
|
| Decision Resources, LLC
8 New England Executive Park
Burlington, MA 01803 |
|
Business Services |
|
First lien |
|
7.00% (Base Rate + 550/M)(3) |
|
12/28/2016 |
|
|
7.8 |
% |
|
|
— |
|
|
|
17,463,938 |
|
|
|
|
|
|
|
|
|
| Education Management LLC**
210 Sixth Avenue, 33rd Floor
Pittsburgh, PA 15222 |
|
Education |
|
First lien |
|
8.25% (L + 700/Q) |
|
3/30/2018 |
|
|
9.1 |
% |
|
|
— |
|
|
|
3,980,000 |
|
|
|
|
|
|
|
|
|
| Global Knowledge Training LLC
9000 Regency Parkway, Suite 400
Cary, NC 27518 |
|
Education |
|
First lien |
|
6.50% (Base Rate + 499/Q)(3) |
|
4/21/2017 |
|
|
7.2 |
% |
|
|
— |
|
|
|
4,794,632 |
|
|
|
|
|
|
|
|
|
| Immucor, Inc.
3130 Gateway Drive Northwest
Norcross, GA 30071 |
|
Healthcare Services |
|
First lien |
|
7.25% (L + 575/Q) |
|
8/19/2018 |
|
|
7.6 |
% |
|
|
— |
|
|
|
5,039,262 |
|
|
|
|
|
|
|
|
|
| Ipreo Holdings LLC
1359 Broadway, 2nd Floor New York, NY 10018 |
|
Information Services |
|
First lien |
|
8.00% (L + 650/M) |
|
8/5/2017 |
|
|
8.9 |
% |
|
|
— |
|
|
|
18,376,406 |
|
|
|
|
|
|
|
|
|
| Lawson Software, Inc. (fka
SoftBrands, Inc.)
380 St. Peter Street St. Paul, MN 55102 |
|
Software |
|
First lien |
|
6.75% (L + 525/Q) |
|
7/5/2017 |
|
|
7.2 |
% |
|
|
— |
|
|
|
9,962,406 |
|
102
|
|
|
|
|
|
|
|
|
|
|
|
|
|
|
|
|
|
|
|
|
|
|
| Name / Address of
Portfolio Company |
|
Industry |
|
Type of
Investment |
|
Interest Rate(1) |
|
Maturity
Date |
|
|
Yield to
Maturity(2) |
|
|
Percent of
Class Held(4) |
|
|
Fair
Value |
|
| Mailsouth, Inc.
5901 Highway 52 East Helena, AL 35080 |
|
Media |
|
First lien |
|
6.75% (Base Rate + 500/Q)(3) |
|
|
12/14/2016 |
|
|
|
7.3 |
% |
|
|
— |
|
|
|
11,731,500 |
|
|
|
|
|
|
|
|
|
| Meritas Schools Holdings, LLC
630 Dundee Road, Suite 400 Northbrook, IL 60062 |
|
Education |
|
First lien |
|
7.50% (L + 600/Q) |
|
|
7/29/2017 |
|
|
|
8.1 |
% |
|
|
— |
|
|
|
9,203,750 |
|
|
|
|
|
|
|
|
|
| Novell, Inc. (fka Attachmate Corporation, NetIQ Corporation)
1500 Dexter Ave N. Seattle, WA 98109 |
|
Software |
|
First lien |
|
6.50% (L + 500/Q) |
|
|
4/27/2017 |
|
|
|
6.9 |
% |
|
|
— |
|
|
|
3,768,323 |
|
|
|
|
|
|
|
|
|
| OpenLink International, Inc.
1502 RXR Plaza West Tower, 15th Floor
Uniondale, NY 11556 |
|
Software |
|
First lien |
|
7.75% (L + 625/Q) |
|
|
10/30/2017 |
|
|
|
8.2 |
% |
|
|
— |
|
|
|
15,009,258 |
|
|
|
|
|
|
|
|
|
| Pacific Architects and Engineers Incorporated
1525 Wilson Boulevard, Suite 900
Arlington, VA 22209 |
|
Federal Services |
|
First lien |
|
7.50% (L + 600/M) |
|
|
4/4/2017 |
|
|
|
8.0 |
% |
|
|
— |
|
|
|
14,029,500 |
|
|
|
|
|
|
|
|
|
| PODS, Inc. (5)
5585 Rio Vista Drive Clearwater, FL 33760 |
|
|
|
|
|
|
|
|
|
|
|
|
|
|
|
|
|
|
|
|
|
|
|
|
|
|
|
|
|
|
| PODS Funding Corp. II |
|
Consumer Services |
|
First lien |
|
8.50% (L + 700/Q) |
|
|
11/29/2016 |
|
|
|
9.5 |
% |
|
|
— |
|
|
|
11,217,004 |
|
|
|
|
|
|
|
|
|
| PODS Funding Corp. II |
|
Consumer Services |
|
First lien - Undrawn |
|
— |
|
|
11/29/2016 |
|
|
|
N/A |
|
|
|
— |
|
|
|
(68,769 |
) |
|
|
|
|
|
|
|
|
|
|
|
|
|
|
|
|
|
|
|
|
|
|
|
|
|
|
|
|
|
|
|
|
|
|
|
|
|
|
|
|
|
|
|
|
11,148,235 |
|
|
|
|
|
|
|
|
|
|
|
|
|
|
|
|
|
|
|
|
|
|
|
|
|
|
|
|
|
|
|
|
| Research Pharmaceutical
Services, Inc.
520 Virginia Drive Fort Washington, PA 19034 |
|
Healthcare Services |
|
First lien |
|
6.75% (Base Rate +
524/M)(3) |
|
|
2/18/2017 |
|
|
|
8.1 |
% |
|
|
— |
|
|
|
7,128,516 |
|
|
|
|
|
|
|
|
|
| Smile Brands Group Inc.
8105 Irvine Center Drive, Suite 1500
Irvine, CA 92618 |
|
Healthcare Services |
|
First lien |
|
7.00% (L + 525/Q) |
|
|
12/21/2017 |
|
|
|
7.3 |
% |
|
|
— |
|
|
|
12,375,663 |
|
|
|
|
|
|
|
|
|
| SonicWALL, Inc.
2001 Logic Drive San Jose, CA 95124 |
|
Software |
|
First lien |
|
8.27% (Base Rate +
618/M)(3) |
|
|
1/23/2016 |
|
|
|
8.3 |
% |
|
|
— |
|
|
|
3,971,776 |
|
|
|
|
|
|
|
|
|
| Sotera Defense Solutions, Inc. (Global Defense Technology & Systems, Inc.)
2121 Cooperative Way Herndon, VA 20171 |
|
Federal Services |
|
First lien |
|
7.00% (L + 550/Q) |
|
|
4/21/2017 |
|
|
|
7.5 |
% |
|
|
— |
|
|
|
16,830,319 |
|
|
|
|
|
|
|
|
|
| SRA International, Inc.
4300 Fair Lakes Court Fairfax, VA 22033 |
|
Federal Services |
|
First lien |
|
6.50% (L + 525/Q) |
|
|
7/20/2018 |
|
|
|
7.3 |
% |
|
|
— |
|
|
|
16,371,074 |
|
|
|
|
|
|
|
|
|
| Surgery Center Holdings, Inc.
333 West Wacker Drive, Suite 1010
Chicago, IL 60606 |
|
Healthcare Services |
|
First lien |
|
6.50% (L + 500/Q) |
|
|
2/6/2017 |
|
|
|
7.7 |
% |
|
|
— |
|
|
|
6,687,450 |
|
|
|
|
|
|
|
|
|
| TravelCLICK, Inc. (fka TravelCLICK Acquisition Co.)
300 North Martingale, Suite 500
Schaumburg, IL 60173 |
|
Information Services |
|
First lien |
|
6.50% (L + 500/Q) |
|
|
3/16/2016 |
|
|
|
6.7 |
% |
|
|
— |
|
|
|
11,358,378 |
|
103
|
|
|
|
|
|
|
|
|
|
|
|
|
|
|
|
|
|
|
|
|
| Name / Address of
Portfolio Company |
|
Industry |
|
Type of
Investment |
|
Interest Rate(1) |
|
Maturity
Date |
|
Yield to
Maturity(2) |
|
|
Percent of
Class Held(4) |
|
|
Fair
Value |
|
| Tekelec Global, Inc.
5200 Paramount Parkway Morrisville, NC 27560 |
|
Software |
|
First lien |
|
9.00% (L + 750/Q) |
|
1/29/2018 |
|
|
10.0 |
% |
|
|
— |
|
|
|
11,327,500 |
|
|
|
|
|
|
|
|
|
| Triple Point Technology, Inc.
301 Riverside Avenue Westport, CT 06880 |
|
Software |
|
First lien |
|
8.00% (L + 650/Q) |
|
10/27/2017 |
|
|
8.4 |
% |
|
|
— |
|
|
|
14,537,877 |
|
|
|
|
|
|
|
|
|
| Virtual Radiologic Corporation
11995 Singletree Lane, Suite 500
Eden Prairie, MN 55344 |
|
Healthcare Information Technology |
|
First lien |
|
7.75% (P + 450/Q) |
|
12/22/2016 |
|
|
9.7 |
% |
|
|
— |
|
|
|
13,961,332 |
|
|
|
|
|
|
|
|
|
|
|
|
|
|
|
|
|
|
|
|
|
|
| Total Investments |
|
|
|
|
|
|
|
|
|
|
|
|
|
|
|
|
|
$ |
259,986,039 |
|
|
|
|
|
|
|
|
|
|
|
|
|
|
|
|
|
|
|
|
|
|
| (1) |
All interest is payable in cash unless otherwise indicated. A majority of the variable rate debt investments bear interest at a rate that may be determined by reference to LIBOR
(L) or the Prime Rate (P) and which resets quarterly (Q), monthly (M), or semi-annually (S). For each debt investment we have provided the current interest rate in effect as of March 31, 2012. |
| (2) |
Assumes that the investments in our portfolio as of a certain date, the Portfolio Date, are purchased at fair value on that date and held until their respective maturities with
no prepayments or losses and are exited at par at maturity. Also assumes that unfunded revolvers remain undrawn. Interest income is assumed to be received quarterly for all debt securities. For floating rate debt securities, the interest rate is
calculated by adding the spread to the projected three-month LIBOR at each respective quarter, which is determined based on the forward three-month LIBOR curve per Bloomberg as of the Portfolio Date. This calculation excludes the impact of existing
leverage. |
| (3) |
The base rate and spread is a blended interest rate. The base rate is determined by reference to both LIBOR and Prime Rate. |
| (4) |
Percent of class held is presented only for equity positions. |
| (5) |
The Operating Company directly or indirectly, through its subsidiary NMF SLF, holds investments in two related entities of PODS, Inc. The Operating Company directly holds
warrants in Storapod Holding Company, Inc. (“Storapod”) and has a credit investment in Storapod through Storapod WCF II Limited (“Storapod WCF II”). Storapod WCF II is a special purpose entity used to enter into a
Shari’ah-compliant financing arrangement with Storapod. Additionally, NMF SLF has a credit investment in PODS Funding Corp. II (“PODS II”). PODS, Inc. is a wholly-owned subsidiary of PODS Holding, Inc., which in turn is a
majority-owned subsidiary of Storapod. PODS II is a special purpose entity used to enter into a Shari’ah-compliant financing arrangement with PODS, Inc. and its subsidiary, PODS Enterprises, Inc. |
| ** |
Indicates assets that the Operating Company deems to be “non-qualifying assets” under Section 55(a) of the Investment Company Act of 1940, as amended. Qualifying assets
must represent at least 70.00% of the Operating Company’s total assets at the time of acquisition of any additional non-qualifying assets. |
As of March 31, 2012, NMF SLF had no single investment that represented greater than 5.0% of the Operating Company’s total assets.
104
MANAGEMENT
The business and affairs of each of the New Mountain Finance Entities are managed under the direction of their respective boards of directors,
which are currently comprised of the same individuals. The New Mountain Finance Entities’ boards of directors appoint their officers, who serve at the discretion of the boards of directors. The boards of directors of the New Mountain Finance
Entities each have an audit committee, a nominating and corporate governance committee and a valuation committee and may establish additional committees from time to time as necessary. The board of directors of NMFC also has a compensation
committee.
The members of the board of directors of the Operating Company are elected by the members of the Operating Company voting on
a pass through basis. As a result, the partners in Guardian AIV and NMFC’s stockholders will elect the Operating Company’s board of directors. The responsibilities of the Operating Company’s board of directors include, among other
things, the oversight of its investment activities, the quarterly valuation of its assets and oversight of the Operating Company’s financing arrangements. Under the Amended and Restated Limited Liability Company Agreement of the Operating
Company, it is required to endeavor to nominate the same slate of director nominees for election by its members as NMFC. However, there can be no assurances that the board composition of the Operating Company will remain the same as NMFC’s.
Board of Directors and Executive Officers
The New Mountain Finance Entities’ boards of directors consist of five members, three of whom are classified under applicable NYSE listing standards as “independent” directors and under
Section 2(a)(19) of the 1940 Act as non-interested persons. Pursuant to each of the New Mountain Finance Entities’ governing documents, the New Mountain Finance Entities’ directors are divided into three classes. Each class of
directors will hold office for a three-year term. However, the initial members of the three classes have initial terms of one, two and three years, respectively. At each annual meeting of the New Mountain Finance Entities’ stockholders/unit
holders, the successors to the class of directors whose terms expire at such meeting will be elected to hold office for a term expiring at the annual meeting of stockholders/unit holders held in the third year following the year of their election.
Each director will hold office for the term to which he or she is elected and until his or her successor is duly elected and qualifies. New Mountain Finance Entities’ governing documents also give their boards of directors sole authority to
appoint directors to fill vacancies that are created either through an increase in the number of directors or due to the resignation, removal or death of any director. Over time, the New Mountain Finance Entities intend to increase the size of their
boards of directors to seven directors and appoint two new directors, including one new independent director.
Directors
Information regarding the New Mountain Finance Entities’ boards of directors is set forth below. The directors have been divided into two
groups—independent directors and interested directors. Interested directors are “interested persons” of the New Mountain Finance Entities as defined in Section 2(a)(19) of the 1940 Act. The address for each director is c/o New
Mountain Finance Corporation, 787 Seventh Avenue, 48th Floor, New York, New York 10019.
|
|
|
|
|
|
|
|
|
|
|
|
|
|
|
| Name |
|
Age |
|
|
Position |
|
Director
Since |
|
|
Expiration
of Term |
|
| Independent Directors |
|
|
|
|
|
|
|
|
|
|
|
|
|
|
|
|
|
|
|
| David Ogens |
|
|
58 |
|
|
Director |
|
|
2010 |
|
|
|
2015 |
|
| Alfred F. Hurley, Jr. |
|
|
57 |
|
|
Director |
|
|
2010 |
|
|
|
2013 |
|
| Kurt J. Wolfgruber |
|
|
61 |
|
|
Director |
|
|
2010 |
|
|
|
2014 |
|
105
|
|
|
|
|
|
|
|
|
|
|
|
|
|
|
| Name |
|
Age |
|
|
Position |
|
Director
Since |
|
|
Expiration
of Term |
|
| Interested Directors |
|
|
|
|
|
|
|
|
|
|
|
|
|
|
|
|
|
|
|
| Steven B. Klinsky |
|
|
56 |
|
|
Chairman of the Board of Directors |
|
|
2010 |
|
|
|
2014 |
|
| Robert A. Hamwee |
|
|
41 |
|
|
Chief Executive Officer and Director |
|
|
2010 |
|
|
|
2013 |
|
Executive Officers Who Are Not Directors
Information regarding the New Mountain Finance Entities’ executive officers who are not directors is set forth below.
|
|
|
|
|
|
|
| Name |
|
Age |
|
|
Position |
| Adam B. Weinstein |
|
|
33 |
|
|
Chief Financial Officer and Treasurer |
| Paula Bosco |
|
|
39 |
|
|
Chief Compliance Officer and Corporate Secretary |
The address for each executive officer is c/o New Mountain Finance Corporation, 787 Seventh Avenue,
48th Floor, New York, New York 10019.
Biographical Information
Directors
Each of the New Mountain
Finance Entities’ directors has demonstrated high character and integrity, superior credentials and recognition in his respective field and the relevant expertise and experience upon which to be able to offer advice and guidance to the New
Mountain Finance Entities’ management. Each of New Mountain Finance’s directors also has sufficient time available to devote to the affairs of the New Mountain Finance Entities, is able to work with the other members of the board of
directors and contribute to the New Mountain Finance Entities success and can represent the long-term interests of the New Mountain Finance Entities’ stockholders/unit holders as a whole. The New Mountain Finance Entities have selected their
current directors to provide a range of backgrounds and experience to its board of directors. Set forth below is biographical information for each director, including a discussion of the director’s particular experience, qualifications,
attributes or skills that led the New Mountain Finance Entities to conclude, as of the date of this document, that the individual should serve as a director, in light of the New Mountain Finance Entities business and structure.
Independent Directors
David Ogens
has been a director of NMFC and the Operating Company since November 2010 and a director of AIV Holdings since March 2011. Mr. Ogens has served as the President and a Director of Med Inc. since 2011, a company that provides complex
rehabilitation services to patients with serious muscular/neuro diseases. Previously, Mr. Ogens served as Senior Managing Director and Head of Investment Banking at Leerink Swann LLC, a specialized healthcare investment bank focused on
emerging growth healthcare companies, from 2005 to 2009. Prior to serving at Leerink Swann LLC, Mr. Ogens was Chairman and Co-Founder of SCS Financial Services, LLC, a private wealth management firm. Before co-founding SCS Financial
Services, LLC in 2002, Mr. Ogens was a Managing Director in the Investment Banking Division of Goldman, Sachs & Co, where he served as a senior investment banker and a head of the High Technology Investment Banking Group.
Mr. Ogens received his Bachelor of Arts (“B.A.” or “A.B.”) and Master of Business Administration (“M.B.A.”) from the University of Virginia.
Mr. Ogens brings his experience in wealth management and investment banking, including experience with debt issuances, as well as industry-specific expertise in the healthcare industry to the New Mountain
Finance Entities’ boards of directors. This background positions Mr. Ogens well to serve as a director of the New Mountain Finance Entities.
106
Kurt J. Wolfgruber has been a director of NMFC and the Operating Company since November
2010 and a director of AIV Holdings since March 2011, and is currently a private investor. Mr. Wolfgruber served as President of OppenheimerFunds, Inc., an investment management company, from March 2007 until his departure in May of 2009,
during which time he was responsible for OppenheimerFunds, Inc.’s Retail and Wealth Management business units. During such period, Mr. Wolfgruber also served as Chief Investment Officer, overseeing the direction of
OppenheimerFunds, Inc.’s investment organization and directing the underlying investment process. Mr. Wolfgruber joined OppenheimerFunds, Inc. in April 2000 as Senior Investment Officer and Director of Domestic Equities, in which
position he was responsible for the investment process of the assets managed by OppenheimerFunds, Inc.’s Domestic Equity Portfolio teams. In 2003, Mr. Wolfgruber was named Executive Vice President and Chief Investment Officer of
OppenheimerFunds, Inc. with oversight responsibilities for all investment functions including equity and fixed income research and portfolio management, trading and risk management. Prior to joining OppenheimerFunds, Inc.,
Mr. Wolfgruber spent 26 years at JPMorgan Investment Management in various research, portfolio management and management leadership roles. Mr. Wolfgruber received his B.A. in Economics from Ithaca College and his M.B.A. from the
University of Virginia. He is also a Chartered Financial Analyst.
Mr. Wolfgruber brings experience in portfolio management and his
abilities as a chartered financial analyst to the board of directors of the New Mountain Finance Entities. This background positions Mr. Wolfgruber well to serve as a director of NMFC.
Alfred F. Hurley, Jr. has been a director of NMFC and the Operating Company since November 2010 and a director of AIV Holdings since
March 2011, and currently is a Vice Chairman of Emigrant Bank and Emigrant Bancorp (collectively, the “Bank”) where he has served since 2007 and 2009, respectively. His responsibilities at the Bank include advising the Bank’s CEO on
acquisitions and divestitures, asset/liability management, and new products. In addition, he was the Chairman of the Bank’s Credit and Risk Management Committee and the Bank’s acting Chief Risk Officer until early 2012. Before joining the
Bank, Mr. Hurley was the Chief Executive Officer of M. Safra & Co., a private money management firm, from 2004 to 2007. Prior to joining M. Safra & Co., Mr. Hurley worked at Merrill Lynch (“ML”) from
1976 to 2004. His most recent management positions included serving as Senior Vice President of ML & Co. and Head of Global Private Equity Investing, Managing Director and Head of Japan Investment Banking and Capital Markets, Managing
Director and Co-Head of the Global Manufacturing and Services Group, and Managing Director and Head of the Global Automotive Aerospace and Transportation Group. As part of the management duties described above, he was a member of the Corporate and
Institutional Client Group (“CICG”) Executive Committee which had global responsibility for the firm’s equity, debt, investment banking and private equity businesses, a member of the Japan CICG Executive Committee, and a member of the
Global Investment Banking Management and Operating Group Committees. Mr. Hurley graduated from Princeton University with an A.B. in History, cum laude.
Mr. Hurley brings his experience in risk management as well as his experience in the banking and money management industries to the board of directors of the New Mountain Finance Entities. This background
positions Mr. Hurley well to serve as a director of the New Mountain Finance Entities.
Interested Directors
Steven B. Klinsky has served as Chairman of the board of directors of NMFC since July 2010, Chairman of the board of directors of
the Operating Company since September 2010 and Chairman of the board of directors of AIV Holdings since May 2011. Mr. Klinsky is the Founder and a Managing Director of New Mountain Capital and has served as New Mountain Capital’s Chief
Executive Officer since its inception in 1999. Prior to 1999, Mr. Klinsky served as a General Partner and an Associate Partner with Forstmann Little & Co. and co-founded Goldman, Sachs & Co.’s Leveraged Buyout
Group. He currently serves on the board of directors of Gary Klinsky Children Centers, Private Equity
107
Growth Capital Council, Victory Education Partners, SNL Financial LC, Avantor Performance Materials Holdings, Inc., IRI Group Holdings, Inc., RedPrairie Holding, Inc., Deltek, Inc.,
Inmar, Inc., and Overland Solutions, Inc., and during the five years prior to the date of this document has served on the board of directors of Oakleaf Global Holdings, Inc., Connextions, Inc., Apptis, Inc., MailSouth, Inc. and
National Medical Health Card Systems, Inc. Mr. Klinsky received his B.A. in Economics and Political Philosophy from the University of Michigan. He received his M.B.A. from Harvard Business School and his J.D. from Harvard Law School.
From his experience as an executive or director of public and private companies of financial advisory and private equity companies,
Mr. Klinsky brings broad financial advisory and investment management expertise to the boards of directors. Mr. Klinsky’s intimate knowledge of the business and operations of the New Mountain Finance Entities, as a Managing Director
and Founder and Chief Executive Officer of New Mountain Capital and his experience as a board member or chairman of other publicly-held companies, positions him well to serve as a chairman of the New Mountain Finance Entities’ boards of
directors.
Robert A. Hamwee has served as NMFC’s Chief Executive Officer since July 2010 and President since
March 2011, the Operating Company’s Chief Executive Officer since September 2010 and President since March 2011, and AIV Holdings’ Chief Executive Officer and President since May 2011. Mr. Hamwee serves on the boards of directors of
the New Mountain Finance Entities. Mr. Hamwee has served as a Managing Director of New Mountain Capital since 2008. Prior to joining New Mountain Capital, Mr. Hamwee served as President of GSC Group, a leading institutional investment
manager of alternative assets, where he had day-to-day responsibility for managing GSC’s control distressed debt funds from 1999 to 2008. Prior to 1999, Mr. Hamwee held various positions at Greenwich Street Capital Partners, the
predecessor to GSC Group, and with The Blackstone Group. Mr. Hamwee has chaired numerous Creditor Committees and Bank Steering Groups, and was formerly a director of a number of public and private companies, including Envirosource, Purina
Mills, and Viasystems. Mr. Hamwee received his Bachelor of Business Administration (“B.B.A.”) in Finance and Accounting from the University of Michigan.
Mr. Hamwee’s depth of experience in managerial operational positions in investment management and financial services and as a member of other corporate boards of directors, as well as his intimate
knowledge of the business and operations of the New Mountain Finance Entities, provides the board of directors valuable industry- and company-specific knowledge and expertise.
Executive Officers Who Are Not Directors
Adam B. Weinstein has served as Chief
Financial Officer and Treasurer of NMFC since July 2010, of the Operating Company since September 2010 and of AIV Holdings since May 2011. Mr. Weinstein serves as a Managing Director of New Mountain Capital and has been in various roles
since joining in 2005. Prior to joining New Mountain Capital in 2005, Mr. Weinstein was a Manager at Deloitte & Touche, LLP and worked in that firm’s merger and acquisition and private equity investor services areas.
Mr. Weinstein sits on a number of boards of directors for professional and non-profit organizations. Mr. Weinstein received his B.S. from Binghamton University, is a member of the AICPA and is a New York State Certified Public Accountant.
Paula Bosco has served as Chief Compliance Officer and Corporate Secretary of NMFC since July 2010, of the Operating
Company since September 2010 and of AIV Holdings since May 2011. Ms. Bosco serves as a Managing Director and Chief Compliance Officer of New Mountain Capital and has been in various roles since joining in 2009. Prior to joining New Mountain
Capital in 2009, Ms. Bosco served as the Chief Compliance Officer for the advisory division of Lehman Brothers Inc. from 2007 to 2009. From 2005 to 2007, Ms. Bosco served as Senior Vice President and Assistant
108
Director of International & Investment Advisory Services Compliance at Citigroup Global Markets, Inc. Prior to that, Ms. Bosco held a number of senior legal and regulatory
compliance positions with investment banks and financial regulators, as well as with a large New York City law firm. Ms. Bosco received her B.A. in Political Science from the State University of New York, her J.D. from the City University of
New York School of Law and her M.B.A. in Finance/Investment Management from Pace University. She is admitted to practice law in the U.S. District Court, Eastern and Southern Districts of New York, and the U.S. Court of Appeals, Second Circuit.
Board Leadership Structure
The New Mountain Finance Entities’ boards of directors monitor and perform an oversight role with respect to the New Mountain Finance Entities’ business and affairs, compliance with regulatory
requirements and the services, expenses and performance of service providers to the New Mountain Finance Entities. Among other things, the New Mountain Finance Entities’ boards of directors approve the appointment of the Administrator and
officers, review and monitor the services and activities performed by the Administrator and officers and approve the engagement, and review the performance of, the New Mountain Finance Entities’ independent public accounting firm.
Under the New Mountain Finance Entities’ bylaws, the New Mountain Finance Entities’ boards of directors may designate a chairman to
preside over the meetings of the boards of directors and meetings of the stockholders/unit holders and to perform such other duties as may be assigned to him by the boards of directors. The New Mountain Finance Entities do not have a fixed policy as
to whether the chairman of the boards should be an independent director and believe that they should maintain the flexibility to select the chairman and reorganize the leadership structure, from time to time, based on the criteria that is in the
best interests of the New Mountain Finance Entities and their stockholders/unit holders at such times.
Mr. Klinsky currently
serves as the chairman of the New Mountain Finance Entities’ boards of directors. Mr. Klinsky is an “interested person” of the New Mountain Finance Entities as defined in Section 2(a)(19) of the 1940 Act because he is a
Managing Director, Founder and Chief Executive Officer of New Mountain Capital, serves on the investment committee of the Investment Adviser and is the managing member of the sole member of the Investment Adviser. The New Mountain Finance
Entities believe that Mr. Klinsky’s history with New Mountain Capital, familiarity with our investment objectives and investment strategy, and extensive knowledge of the financial services industry and the investment valuation process
in particular qualify him to serve as the chairman of the New Mountain Finance Entities’ boards of directors. The New Mountain Finance Entities believe that, at present, they are best served through this leadership structure, as
Mr. Klinsky’s relationship with the Investment Adviser and New Mountain Capital, provides an effective bridge and encourages an open dialogue between the New Mountain Finance Entities’ management and their boards of directors,
ensuring that all groups act with a common purpose.
The New Mountain Finance Entities’ boards of directors do not currently have a
designated lead independent director. The New Mountain Finance Entities are aware of the potential conflicts that may arise when a non-independent director is chairman of the boards of directors, but believe these potential conflicts are offset by
their strong corporate governance policies. The New Mountain Finance Entities’ corporate governance policies include regular meetings of the independent directors in executive session without the presence of interested directors and management,
the establishment of audit and nominating and corporate governance committees comprised solely of independent directors and the appointment of a chief compliance officer, with whom the independent directors meet regularly without the presence of
interested directors and other members of management, for administering the New Mountain Finance Entities’ compliance policies and procedures.
109
The New Mountain Finance Entities recognize that different board leadership structures are
appropriate for companies in different situations. The New Mountain Finance Entities intend to re-examine their corporate governance policies on an ongoing basis to ensure that they continue to meet their needs.
Boards of Directors’ Role In Risk Oversight
The New Mountain Finance Entities’ boards of directors perform their risk oversight function primarily through (1) their four standing committees which report to the boards of directors, each of which are
comprised solely of independent directors and (2) active monitoring by the New Mountain Finance Entities’ chief compliance officer and their compliance policies and procedures. In addition, the New Mountain Finance Entities’ boards of
directors rely on the risk oversight function of the Operating Company’s board of directors.
The New Mountain Finance
Entities’ audit committees and nominating and corporate governance committees assist their boards of directors in fulfilling their risk oversight responsibilities. The audit committees’ risk oversight responsibilities include overseeing
the New Mountain Finance Entities’ accounting and financial reporting processes, their systems of internal controls regarding finance and accounting, and audits of the New Mountain Finance Entitites’ financial statements, including the
independence of the New Mountain Finance Entities’ independent auditors. The nominating and corporate governance committees’ risk oversight responsibilities include selecting, researching and nominating directors for election by the New
Mountain Finance Entities’ stockholders/unit holders, developing and recommending to the boards of directors a set of corporate governance principles and overseeing the evaluation of the boards of directors and the New Mountain Finance
Entities’ management. The valuation committees are responsible for making recommendations in accordance with the valuation policies and procedures adopted by the boards of directors of the New Mountain Finance Entities, reviewing valuations and
any reports of independent valuation firms, confirming that valuations are made in accordance with the valuation policies of the boards of directors of the New Mountain Finance Entities and reporting any deficiencies or violations of such valuation
policies to the boards of directors on at least a quarterly basis, and reviewing other matters that the boards of directors or the valuation committees deem appropriate.
The New Mountain Finance Entities’ boards of directors perform their risk oversight responsibilities with the assistance of the chief compliance officer. The boards of directors quarterly review a written
report from the chief compliance officer discussing the adequacy and effectiveness of the New Mountain Finance Entities’ compliance policies and procedures and their service providers. The chief compliance officer’s quarterly report
addresses at a minimum:
| |
Ÿ |
|
the operation of the New Mountain Finance Entities’ compliance policies and procedures and their service providers since the last report;
|
| |
Ÿ |
|
any material changes to these policies and procedures since the last report; |
| |
Ÿ |
|
any recommendations for material changes to these policies and procedures as a result of the chief compliance officer’s quarterly review; and
|
| |
Ÿ |
|
any compliance matter that has occurred since the date of the last report about which the boards of directors would reasonably need to know to oversee the New
Mountain Finance Entities’ compliance activities and risks. |
In addition, the chief compliance officer meets
separately in executive session with the independent directors at least once each year.
110
The New Mountain Finance Entities believe that their boards of directors’ role in risk oversight
is effective, and appropriate given the extensive regulation to which they are subject as BDCs. The New Mountain Finance Entities are required to comply with certain regulatory requirements that control the levels of risk in the New Mountain Finance
Entities’ business and operations. Since NMFC has no assets other than its ownership of common membership units of the Operating Company and has no material long-term liabilities, NMFC looks to the assets of the Operating Company for purposes
of satisfying these requirements. For example, the Operating Company’s ability to incur indebtedness is limited because its asset coverage must equal at least 200.0% immediately after it incurs indebtedness, the Operating Company generally has
to invest at least 70.0% of its total assets in “qualifying assets” and is not generally permitted to invest in any portfolio company in which one of its affiliates currently has an investment.
The New Mountain Finance Entities recognize that different board of director roles in risk oversight are appropriate for companies in different
situations. The New Mountain Finance Entities intend to re-examine the manners in which the boards of directors administer their oversight function on an ongoing basis to ensure that they continue to meet the New Mountain Finance Entities’
needs.
Committees of the Boards of Directors
The New Mountain Finance Entities’ boards of directors have each established an audit committee, a nominating and corporate governance committee, a compensation committee and a valuation committee. The members
of each committee have been appointed by the boards of directors of the New Mountain Finance Entities and serve until their successor is elected and qualifies, unless they are removed or resign. During 2011, the boards of directors of the New
Mountain Finance Entities held six board of directors meetings, three audit committee meetings, one nominating and corporate governance committee meeting, one compensation committee meeting and four valuation committee meetings. With the exception
of Mr. Klinsky, who attended 66.7% of all meetings and 100.0% of all in-person meetings, all directors attended at least 75.0% of the aggregate number of meetings of the boards of directors and of the respective committees of each of the New
Mountain Finance Entities on which they serve. We require each director to make a diligent effort to attend all board and committee meetings as well as each annual meeting of the New Mountain Finance Entities’ stockholders/unit holders.
Audit Committees
The
audit committees operate pursuant to charters approved by the New Mountain Finance Entities’ boards of directors, copies of which are available on the New Mountain Finance Entities’ website at http://www.newmountainfinance.com. The
charters set forth the responsibilities of the audit committees. The audit committees are responsible for recommending the selection of, engagement of and discharge of the New Mountain Finance Entities’ independent auditors, reviewing the
plans, scope and results of the audit engagement with the independent auditors, approving professional services provided by the independent auditors (including compensation therefore), reviewing the independence of the independent auditors and
reviewing the adequacy of the New Mountain Finance Entities internal controls over financial reporting. The members of the audit committees are Alfred F. Hurley, Jr., David Ogens and Kurt J. Wolfgruber, each of whom is not an
interested person of the New Mountain Finance Entities for purposes of the 1940 Act and is independent for purposes of the NYSE’s corporate governance listing standards. Kurt J. Wolfgruber serves as the chairman of the audit committees,
and the New Mountain Finance Entities’ boards of directors have determined that Alfred F. Hurley, Jr., David Ogens and Kurt J. Wolfgruber are “audit committee financial experts” as that term is defined under
Item 407 of Regulation S-K, as promulgated under the Exchange Act, and that each of them meets the current independence and experience requirements of Rule 10A-3 of the Exchange Act.
111
Nominating and Corporate Governance Committees
The nominating and corporate governance committees operate pursuant to charters approved by the New Mountain Finance Entities’ boards of
directors, copies of which are available on the New Mountain Finance Entities’ website at http://www.newmountainfinance.com. The charters set forth the responsibilities of the nominating and corporate governance committees. The
nominating and corporate governance committees are responsible for determining criteria for service on the board of directors, identifying, researching and nominating directors for election by the New Mountain Finance Entities’
stockholders/unit holders, selecting nominees to fill vacancies on the New Mountain Finance Entities’ boards of directors or committees of the boards of directors, developing and recommending to the boards of directors a set of corporate
governance principles and overseeing the self-evaluation of the boards of directors and their committees and evaluation of the New Mountain Finance Entities’ management. The nominating and corporate governance committees consider nominees
properly recommended by the New Mountain Finance Entities’ stockholders/unit holders. The members of the nominating and corporate governance committees are Alfred F. Hurley, Jr., David Ogens and Kurt J. Wolfgruber, each of whom
is not an interested person of the New Mountain Finance Entities for purposes of the 1940 Act and is independent for purposes of the NYSE’s corporate governance listing standards. Alfred F. Hurley, Jr. serves as the chairman of the
nominating and corporate governance committees.
The nominating and corporate governance committees seek candidates who possess the
background, skills and expertise to make a significant contribution to the boards of directors, the New Mountain Finance Entities and their stockholders/unit holders. In considering possible candidates for election as a director, the nominating and
corporate governance committees take into account, in addition to such other factors as they deem relevant, the desirability of selecting directors who:
| |
Ÿ |
|
are of high character and integrity; |
| |
Ÿ |
|
are accomplished in their respective fields, with superior credentials and recognition; |
| |
Ÿ |
|
have relevant expertise and experience upon which to be able to offer advice and guidance to management; |
| |
Ÿ |
|
have sufficient time available to devote to the affairs of the New Mountain Finance Entities; |
| |
Ÿ |
|
are able to work with the other members of the boards of directors and contribute to the success of the New Mountain Finance Entities;
|
| |
Ÿ |
|
can represent the long-term interests of the New Mountain Finance Entities’ stockholders/unit holders as a whole; and |
| |
Ÿ |
|
are selected such that the boards of directors represent a range of backgrounds and experience. |
The nominating and corporate governance committees have not adopted formal policies with regard to the consideration of diversity in identifying
director nominees. In determining whether to recommend a director nominee, the nominating and corporate governance committees consider and discuss diversity, among other factors, with a view toward the needs of the boards of directors as a whole.
The nominating and corporate governance committees generally conceptualize diversity expansively to include, without limitation, concepts such as race, gender, national origin, differences of viewpoint, professional experience, education, skill and
other qualities that contribute to the boards of directors, when identifying and recommending director nominees. The nominating and corporate governance committees believe that the inclusion of diversity as one of many factors considered in
selecting director nominees is consistent with the nominating and corporate governance committees’ goal of creating boards of directors that best serve the needs of the New Mountain Finance Entities and the interest of their stockholders/unit
holders.
112
Compensation Committee
The compensation committee of New Mountain Finance operates pursuant to a charter approved by its board of directors, a copy of which is available on the New Mountain Finance Entities’ website at
http://www.newmountainfinance.com. The Operating Company does not have a compensation committee. The charter sets forth the responsibilities of the compensation committee. The compensation committee is responsible for periodically reviewing
director compensation and recommending any appropriate changes to the boards of directors. In addition, although the New Mountain Finance Entities do not directly compensate their executive officers currently, to the extent that it does so in the
future, the compensation committee would also be responsible for reviewing and evaluating their compensation and making recommendations to the boards of directors regarding their compensation. Lastly, the compensation committee would produce a
report on the New Mountain Finance Entities’ executive compensation practices and policies for inclusion in our proxy statement if required by applicable proxy rules and regulations and, if applicable, make recommendations to the board of
directors on the New Mountain Finance Entities’ executive compensation practices and policies. The compensation committees have the authority to engage compensation consultants and to delegate their duties and responsibilities to a member or to
a subcommittee of the compensation committees. The compensation committee of NMFC is composed of Alfred F. Hurley, Jr., David Ogens and Kurt J. Wolfgruber, each of whom is not an interested person of the New Mountain Finance Entities
for purposes of the 1940 Act and is independent for purposes of the NYSE’s corporate governance listing standards. Alfred F. Hurley, Jr. serves as chairman of the compensation committee.
Valuation Committees
The valuation
committees operate pursuant to charters approved by the New Mountain Finance Entities’ boards of directors, copies of which are available on the New Mountain Finance Entities’ website at http://www.newmountainfinance.com. The
charters set forth the responsibilities of the valuation committees. The valuation committees are responsible for making recommendations in accordance with the valuation policies and procedures adopted by the boards of directors of the New Mountain
Finance Entities, reviewing valuations and any reports of independent valuation firms, confirming that valuations are made in accordance with the valuation policies of the boards of directors of the New Mountain Finance Entities and reporting any
deficiencies or violations of such valuation policies to the boards of directors on at least a quarterly basis, and reviewing other matters that the boards of directors or the valuation committees deem appropriate. The valuation committees are
composed of Alfred F. Hurley, Jr., David Ogens and Kurt J. Wolfgruber, each of whom is not an interested person of the New Mountain Finance Entities for purposes of the 1940 Act and is independent for purposes of the NYSE’s
corporate governance listing standards. David Ogens serves as chairman of the valuation committees.
113
Compensation of Directors
The following table sets forth the compensation of the New Mountain Finance Entities’ directors for the year ended December 31, 2011.
|
|
|
|
|
|
|
|
|
|
|
|
|
| Name |
|
Fees
Paid in
Cash(1) |
|
|
All
Other
Compensation(2) |
|
|
Total |
|
| Interested Directors |
|
|
|
|
|
|
|
|
|
|
|
|
| Steven B. Klinsky |
|
|
— |
|
|
|
— |
|
|
|
— |
|
| Robert A. Hamwee |
|
|
— |
|
|
|
— |
|
|
|
— |
|
| Adam B. Collins(3) |
|
|
— |
|
|
|
— |
|
|
|
— |
|
| Independent Directors |
|
|
|
|
|
|
|
|
|
|
|
|
| David Ogens |
|
$ |
83,555.55 |
|
|
|
— |
|
|
$ |
83,555.55 |
|
| Alfred F. Hurley, Jr. |
|
$ |
80,052.77 |
|
|
|
— |
|
|
$ |
80,052.77 |
|
| Kurt J. Wolfgruber |
|
$ |
85,995.82 |
|
|
|
— |
|
|
$ |
85,995.82 |
|
| Daniel Hèbert(3) |
|
$ |
61,977.77 |
|
|
|
|
|
|
$ |
61,977.77 |
|
| (1) |
For a discussion of the independent directors’ compensation, see below. |
| (2) |
We do not maintain a stock or option plan, non-equity incentive plan or pension plan for our directors |
| (3) |
Messrs. Collins and Hèbert resigned from the boards of directors as of March 7, 2012. Their decision to resign was not due to any dispute or disagreement with the New
Mountain Finance Entities. |
The independent directors of the New Mountain Finance Entities receive an annual retainer fee
of $75,000 and further receive a fee of $2,500 for each regularly scheduled board of directors meeting and a fee of $1,000 for each special board of directors meeting as well as reimbursement of reasonable and documented out-of-pocket expenses
incurred in connection with attending each board of directors meeting. In addition, the chairman of the audit committees receive an annual retainer of $7,500, while the chairman of the valuation committees, the chairman of the compensation
committees and the chairman of the nominating and corporate governance committees receive annual retainers of $5,000, $1,000 and $1,000, respectively. All fees payable to the New Mountain Finance Entities’ directors are paid by the Operating
Company. No compensation is paid to directors who are interested persons of the New Mountain Finance Entities as defined in the 1940 Act.
Compensation of Executive Officers
None of the New Mountain Finance Entities’ executive officers receive direct compensation from the New Mountain Finance Entities. The compensation of the principals and other investment professionals of the
Investment Adviser is paid by the Investment Adviser. Compensation paid to the New Mountain Finance Entities’ chief financial officer and chief compliance officer is set by the Administrator and is subject to reimbursement by the Operating
Company of the allocable portion of such compensation for services rendered to the New Mountain Finance Entities.
Indemnification
Agreements
NMFC and the Operating Company have entered into indemnification agreements with their respective directors. The
indemnification agreements are intended to provide the directors the maximum indemnification permitted under Delaware law and the 1940 Act. Each indemnification agreement provides that NMFC or the Operating Company, as applicable, shall indemnify
the director who is a party to the agreement, or an Indemnitee, including the advancement of legal expenses, if, by reason of his corporate status, the Indemnitee is, or is threatened to be, made a party to or a witness in any threatened, pending,
or completed proceeding, to the maximum extent permitted by Delaware law and the 1940 Act. Any amounts owing by NMFC to any Indemnitee pursuant to the indemnification agreements will be payable by the Operating Company.
114
PORTFOLIO MANAGEMENT
The management of the Operating Company’s investment portfolio is the responsibility of the Investment Adviser and the Investment Committee,
which currently consists of Steven B. Klinsky, Robert A. Hamwee, Adam Collins, Douglas Londal and Alok Singh. We consider Mr. Hamwee to be our portfolio manager. The Investment Committee is responsible for approving all of the Operating
Company’s investment purchases above $5.0 million. The Investment Committee also monitors investments in the Operating Company’s portfolio and approves all asset dispositions above $5.0 million. Purchases and dispositions below
$5.0 million may be approved by the Operating Company’s Chief Executive Officer. These approval thresholds are subject to change over time.
Investment Personnel
As of March 31, 2012, the Investment Adviser was supported by over
90 New Mountain Capital staff members, including 58 investment professionals. These individuals, in addition to the Investment Committee, are primarily responsible for the day-to-day management of our portfolio. The Investment Adviser may
retain additional investment professionals, based upon its needs.
Below are the biographies for selected senior investment
professionals of the Investment Adviser, whose biographies are not included elsewhere in this prospectus. For more information regarding the business experience of Messrs. Klinsky and Hamwee, see “Management—Biographical
Information—Directors—Interested Directors”.
Adam J. Collins serves on the Investment Adviser’s investment
committee and serves as Chief Financial Officer and a Managing Director of New Mountain Capital. Prior to joining New Mountain Capital in 2001, Mr. Collins worked at Goldman, Sachs & Co. from 1996 to 2000 in the controllers group
and in 2001 in the Real Estate Principal Investment area. Prior to 1996, Mr. Collins worked at KPMG from 1994 to 1996. Mr. Collins received his B.S. in Accounting from Babson College.
Douglas F. Londal serves on the Investment Adviser’s investment committee and serves as a Managing Director of New Mountain
Capital. Prior to joining New Mountain Capital in 2004, Mr. Londal held various positions within Goldman, Sachs & Co. from 1991 to 2004, including serving as a Managing Director in the Principal Investment Area and as a member of
the Mergers & Acquisitions Department. While in the Principal Investment Area, Mr. Londal held various positions including co-head of Merchant Banking in the Americas and co-head of the Mezzanine investing effort in the Americas.
Mr. Londal serves on the board of directors of Inmar, Inc., NuSil Technology LLC and Valet Waste Holdings, Inc. Mr. Londal received his B.A. in Economics from the University of Michigan. He received his M.B.A. from the University of
Chicago Graduate School of Business.
Alok Singh serves on the Investment Adviser’s investment committee and serves as a
Managing Director of New Mountain Capital. Prior to joining New Mountain Capital in 2002, Mr. Singh served as a Partner and Managing Director of Bankers Trust. He also established and led the Corporate Financial Advisory Group for the Americas
for Barclays Capital. Mr. Singh is non-executive Chairman of RedPrairie Holding, Inc. and Overland Solutions, Inc., lead director of Camber Corporation, Deltek, Inc., Ikaria Holdings, Inc., and Stroz Friedberg LLC and
serves on the Boards of Directors of Apptis, Inc., EverBank Financial Corp., Validus Holdings, Ltd., and Avantor Performance Materials, Inc. Mr. Singh received both his B.A. in Economics and History and his M.B.A. in Finance from
New York University.
John R. Kline serves as a Managing Director of New Mountain Capital. Prior to joining New Mountain
Capital in 2008, he worked at GSC Group from 2001 to 2008 as an investment analyst and trader for GSC Group’s control distressed and corporate credit funds. From 1999 to 2001, Mr. Kline was with Goldman, Sachs & Co.
where he worked in the Credit Risk Management and Advisory Group. Mr. Kline received an A.B. degree in History from Dartmouth College.
115
James W. Stone III has served as a Director of New Mountain Capital since 2011. Prior to
joining New Mountain Capital, he worked for The Blackstone Group as a Managing Director of GSO Capital Partners. At Blackstone, Mr. Stone was responsible for originating, evaluating, executing and monitoring various senior secured and mezzanine
debt investments across a variety of industries. Before joining Blackstone in 2002, Mr. Stone worked as a Vice President in Lehman Brothers’ Communications and Media Group and as a Vice President in UBS Warburg’s Leveraged Finance
Department. Prior to that, Mr. Stone worked at Nomura Securities International, Inc. with the team that later founded Blackstone’s corporate debt investment unit. Mr. Stone received a B.S. in Mathematics and Physics from The
University of the South and an M.B.A. with concentrations in finance and accounting from The University of Chicago’s Graduate School of Business.
The table below shows the dollar range of shares of NMFC’s common stock beneficially owned by our portfolio manager.
|
|
|
|
|
| Name of Portfolio Manager |
|
Dollar Range of
Equity Securities of
NMFC(1)(2) |
|
| Robert A. Hamwee |
|
over $ |
1,000,000 |
|
| (1) |
The dollar range of equity securities beneficially owned in NMFC is based on the closing price for NMFC’s common stock of $14.19 on June 29, 2012 on the NYSE. Beneficial
ownership has been determined in accordance with Rule 16a-1(a)(2) of the Exchange Act. |
| (2) |
The dollar range of equity securities beneficially owned are: none, $1–$10,000, $10,001–$50,000, $50,001–$100,000, $100,001–$500,000, $500,001–$1,000,000
or over $1,000,000. |
Mr. Hamwee is not primarily responsible for the day-to-day management of any other portfolio
other than the portfolio of the Operating Company. Mr. Hamwee is a Managing Director of New Mountain Capital, which as of March 31, 2012 had approximately $9.0 billion (including the Operating Company) of assets under management (which
includes amounts committed, not all of which have been drawn down and invested to date) used to calculate New Mountain Capital’s management fees related to such funds. See “Risk Factors—Risks Relating to Our Business—The
Investment Adviser has significant potential conflicts of interest with NMFC and the Operating Company and, consequently, your interests as stockholders which could adversely impact our investment returns”.
Compensation
None of the
Investment Adviser’s investment professionals are employed by any of the New Mountain Finance Entities or will receive any direct compensation from any of the New Mountain Finance Entities in connection with the management of the Operating
Company’s portfolio. Mr. Klinsky, through his financial interest in the Investment Adviser, is entitled to a portion of any profits earned by the Investment Adviser, which includes any fees payable to the Investment Adviser under the terms
of the Investment Management Agreement, less expenses incurred by the Investment Adviser in performing its services under the Investment Management Agreement.
116
INVESTMENT MANAGEMENT AGREEMENT
The New Mountain Finance Entities are closed-end, non-diversified management investment companies that have elected to be treated
as BDCs under the 1940 Act. NMFC is a holding company with no direct operations of its own, and its only business and sole asset is its ownership of units of the Operating Company. As a result, NMFC does not pay any external investment advisory or
management fees. However, the Operating Company is externally managed by the Investment Adviser and pays the Investment Adviser a fee for its services. The following summarizes the arrangements between the Operating Company and the Investment
Adviser pursuant to the Investment Management Agreement.
Overview of the Investment Adviser
Management Services
The Investment
Adviser is registered as an Investment Adviser under the Investment Advisers Act of 1940 (the “Advisers Act”). The Investment Adviser serves pursuant to the Investment Management Agreement in accordance with the 1940 Act. Subject to the
overall supervision of the Operating Company’s board of directors, the Investment Adviser manages the Operating Company’s day-to-day operations and provides it with investment advisory and management services. Under the terms of the
Investment Management Agreement, the Investment Adviser:
| |
Ÿ |
|
determines the composition of the Operating Company’s portfolio, the nature and timing of the changes to its portfolio and the manner of implementing such
changes; |
| |
Ÿ |
|
determines the securities and other assets that the Operating Company will purchase, retain or sell; |
| |
Ÿ |
|
identifies, evaluates and negotiates the structure of the Operating Company’s investments that the Operating Company makes; |
| |
Ÿ |
|
executes, monitors and services the investments the Operating Company makes; |
| |
Ÿ |
|
performs due diligence on prospective portfolio companies; |
| |
Ÿ |
|
votes, exercises consents and exercises all other rights appertaining to such securities and other assets on behalf of the Operating Company; and
|
| |
Ÿ |
|
provides the Operating Company with such other investment advisory, research and related services as the Operating Company may, from time to time, reasonably
require. |
The Investment Adviser’s services under the Investment Management Agreement are not exclusive, and the
Investment Adviser (so long as its services to the Operating Company are not impaired) and/or other entities affiliated with New Mountain Capital are permitted to furnish similar services to other entities.
Management Fees
Pursuant to the
Investment Management Agreement, the Operating Company has agreed to pay the Investment Adviser a fee for investment advisory and management services consisting of two components—a base management fee and an incentive fee. The cost of both the
base management fee payable to the Investment Adviser and any incentive fees paid in cash to the Investment Adviser are borne by the Operating Company’s members, including NMFC and, as a result, are indirectly borne by NMFC’s common
stockholders.
117
Base Management Fees
The base management fee is calculated at an annual rate of 1.75% of the Operating Company’s gross assets less (i) the borrowings under the SLF Credit Facility and (ii) cash and cash equivalents. The
base management fee is payable quarterly in arrears, and is calculated based on the average value of the Operating Company’s gross assets, borrowings under the SLF Credit Facility, and cash and cash equivalents at the end of each of the two
most recently completed calendar quarters, and appropriately adjusted on a pro rata basis for any equity capital raises or repurchases during the current calendar quarter.
Incentive Fees
The incentive fee consists of two parts. The first part is calculated and
payable quarterly in arrears and equals 20.0% of the Operating Company’s “Pre-Incentive Fee Adjusted Net Investment Income” for the immediately preceding quarter, subject to a “preferred return”, or “hurdle”, and a
“catch-up” feature. “Pre-Incentive Fee Net Investment Income” means interest income, dividend income and any other income (including any other fees (other than fees for providing managerial assistance), such as commitment,
origination, structuring, diligence and consulting fees or other fees that the Operating Company receives from portfolio companies) accrued during the calendar quarter, minus the Operating Company’s operating expenses for the quarter (including
the base management fee, expenses payable under the Administration Agreement, as amended and restated, with the Administrator, and any interest expense and distributions paid on any issued and outstanding preferred membership units (of which there
are none as of March 31, 2012), but excluding the incentive fee). Pre-Incentive Fee Net Investment Income includes, in the case of investments with a deferred interest feature (such as original issue discount, debt instruments with PIK interest and
zero coupon securities), accrued income that the Operating Company has not yet received in cash. Pre-Incentive Fee Net Investment Income does not include any realized capital gains, realized capital losses or unrealized capital appreciation or
depreciation.
Under GAAP, NMFC’s IPO did not step-up the cost basis of the Operating Company’s existing investments to fair
market value at the IPO date. Since the total value of the Operating Company’s investments at the time of the IPO was greater than the investments’ cost basis, a larger amount of amortization of purchase or original issue discount, as well
as different amounts in realized gain and unrealized appreciation, may be recognized under GAAP in each period than if the step-up had occurred. This will remain until such predecessor investments are sold or mature in the future. The Operating
Company tracks the transferred (or fair market) value of each of its investments as of the time of the IPO and, for purposes of the incentive fee calculation, adjusts Pre-Incentive Fee Net Investment Income to reflect the amortization of purchase or
original issue discount on the Operating Company’s investments as if each investment was purchased at the date of the IPO, or stepped up to fair market value. This is defined as “Pre-Incentive Fee Adjusted Net Investment Income”. The
Operating Company also uses the transferred (or fair market) value of each of its investments as of the time of the IPO to adjust capital gains (“Adjusted Realized Capital Gains”) or losses (“Adjusted Realized Capital Losses”)
and unrealized capital appreciation (“Adjusted Unrealized Capital Appreciation”) and unrealized capital depreciation (“Adjusted Unrealized Capital Depreciation”).
Pre-Incentive Fee Adjusted Net Investment Income, expressed as a rate of return on the value of the Operating Company’s net assets at the end
of the immediately preceding calendar quarter, will be compared to a “hurdle rate” of 2.0% per quarter (8.0% annualized), subject to a “catch-up” provision measured as of the end of each calendar quarter. The hurdle rate is
appropriately pro-rated for any partial periods. The calculation of the Operating Company’s incentive fee with respect to the Pre-Incentive Fee Adjusted Net Investment Income for each quarter is as follows:
| |
Ÿ |
|
No incentive fee is payable to the Investment Adviser in any calendar quarter in which the Operating Company’s Pre-Incentive Fee Adjusted Net Investment
Income does not exceed the hurdle rate of 2.0% (the “preferred return” or “hurdle”). |
118
| |
Ÿ |
|
100.0% of the Operating Company’s Pre-Incentive Fee Adjusted Net Investment Income with respect to that portion of such Pre-Incentive Fee Adjusted Net
Investment Income, if any, that exceeds the hurdle rate but is less than or equal to 2.5% in any calendar quarter (10.0% annualized) is payable to the Investment Adviser. This portion of the Operating Company’s Pre-Incentive Fee Adjusted Net
Investment Income (which exceeds the hurdle rate but is less than or equal to 2.5%) is referred to as the “catch-up”. The catch-up provision is intended to provide the Investment Adviser with an incentive fee of 20.0% on all of the
Operating Company’s Pre-Incentive Fee Adjusted Net Investment Income as if a hurdle rate did not apply when the Operating Company’s Pre-Incentive Fee Adjusted Net Investment Income exceeds 2.5% in any calendar quarter.
|
| |
Ÿ |
|
20.0% of the amount of the Operating Company’s Pre-Incentive Fee Adjusted Net Investment Income, if any, that exceeds 2.5% in any calendar quarter (10.0%
annualized) is payable to the Investment Adviser once the hurdle is reached and the catch-up is achieved. |
The
following is a graphical representation of the calculation of the income-related portion of the incentive fee:
Quarterly Incentive
Fee Based on “Pre-Incentive Fee Adjusted Net Investment Income”
Pre-Incentive Fee Adjusted Net Investment Income
(expressed as a percentage of the value of net assets)
Percentage of Pre-Incentive Fee Adjusted Net Investment
Income allocated to income-related portion of incentive fee
These calculations will be appropriately prorated for any period of less than three months and adjusted for any equity capital raises or repurchases during the current calendar quarter.
The second part will be determined and payable in arrears as of the end of each calendar year (or upon termination of the Investment Management
Agreement) and will equal 20.0% of the Operating Company’s Adjusted Realized Capital Gains, if any, on a cumulative basis from inception through the end of each calendar year, computed net of all Adjusted Realized Capital Losses and Adjusted
Unrealized Capital Depreciation on a cumulative basis, less the aggregate amount of any previously paid capital gain incentive fee.
In
accordance with GAAP, the Operating Company accrues a hypothetical capital gains incentive fee based upon the cumulative net Adjusted Realized Capital Gains and Adjusted Realized Capital Losses and the cumulative net Adjusted Unrealized Capital
Appreciation and Adjusted Unrealized Capital Depreciation on investments held at the end of each period. Actual amounts paid to the Investment Adviser are consistent with the Investment Management Agreement and are based only on actual Adjusted
Realized Capital Gains computed net of all Adjusted Realized Capital Losses and Adjusted Unrealized Capital Depreciation on a cumulative basis from inception through the end of each calendar year as if the entire portfolio was sold at fair value.
119
Example 1: Income Related Portion of Incentive Fee for Each Calendar Quarter*:
Alternative 1
Assumptions
Investment income (including interest, dividends, fees, etc.) = 1.25%
Hurdle rate(1) = 2.00%
Management fee(2) = 0.44%
Other expenses (legal, accounting, safekeeping agent, transfer agent, etc.)(3) = 0.20%
Pre-Incentive Fee Adjusted Net Investment Income
(investment income - (management fee + other expenses)) = 0.61%
Pre-Incentive Fee Adjusted Net Investment Income does not exceed the hurdle rate, therefore there is no income-related incentive fee.
Alternative 2
Assumptions
Investment income (including interest, dividends, fees, etc.) = 2.90%
Hurdle rate(1) = 2.00%
Management fee(2) = 0.44%
Other expenses (legal, accounting, safekeeping agent, transfer agent, etc.)(3) = 0.20%
Pre-Incentive Fee Adjusted Net Investment Income
(investment income - (management fee + other expenses)) = 2.26%
Incentive fee = 100.00% × Pre-Incentive Fee Adjusted Net Investment Income (subject to “catch-up”)(4)
= 100.00% × (2.26% - 2.00%)
= 0.26%
Pre-Incentive Fee Adjusted Net Investment Income exceeds the hurdle rate, but does not
fully satisfy the “catch-up” provision, therefore the income related portion of the incentive fee is 0.26%.
Alternative 3
Assumptions
Investment
income (including interest, dividends, fees, etc.) = 3.50%
Hurdle rate(1) = 2.00%
Management fee(2) = 0.44%
Other expenses (legal, accounting, safekeeping agent, transfer agent, etc.)(3) = 0.20%
Pre-Incentive Fee Adjusted Net Investment Income
(investment income - (management fee + other expenses)) = 2.86%
Incentive fee = 100.00% × Pre-Incentive Fee Adjusted Net Investment Income (subject to “catch-up”)(4)
Incentive fee = 100.00% × “catch-up” + (20.00% × (Pre-Incentive Fee Adjusted Net Investment
Income -2.50%))
Catch-up = 2.50% - 2.00%
= 0.50%
120
IncentIive fee = (100.00% × 0.50%) + (20.00% ×
(2.86% - 2.50%))
= 0.50% + (20.00% × 0.36%)
= 0.50% + 0.07%
= 0.57%
Pre-Incentive Fee
Adjusted Net Investment Income exceeds the hurdle rate, and fully satisfies the “catch-up” provision, therefore the income related portion of the incentive fee is 0.57%.
| * |
The hypothetical amount of pre-incentive fee net investment income shown is based on a percentage of total net assets and assumes, for the Operating Company’s investments
held prior to the IPO, interest income has been adjusted to reflect the amortization of purchase or original issue discount as if each investment was purchased at the date of the IPO, or stepped up to fair market value. |
| (1) |
Represents 8.00% annualized hurdle rate. |
| (2) |
Assumes 1.75% annualized base management fee. |
| (3) |
Excludes organizational and offering expenses. |
| (4) |
The “catch-up” provision is intended to provide the Investment Adviser with an incentive fee of 20.00% on all Pre-Incentive Fee Adjusted Net Investment Income as if a
hurdle rate did not apply when the Operating Company’s net investment income exceeds 2.50% in any calendar quarter. |
Example 2:
Capital Gains Portion of Incentive Fee*:
Alternative 1
Assumptions
Year 1: $20.0 million investment made in Company A (“Investment
A”), and $30.0 million investment made in Company B (“Investment B”)
Year 2: Investment A sold for
$50.0 million and fair market value (“FMV”) of Investment B determined to be $32.0 million
Year 3: FMV of Investment
B determined to be $25.0 million
Year 4: Investment B sold for $31.0 million
The capital gains portion of the incentive fee would be:
Year 1: None
Year 2: Capital gains incentive fee of $6.0 million—($30.0 million
realized capital gains on sale of Investment A multiplied by 20.0%)
Year 3: None—$5.0 million (20.0% multiplied by
($30.0 million cumulative capital gains less $5.0 million cumulative capital depreciation)) less $6.0 million (previous capital gains fee paid in Year 2)
Year 4: Capital gains incentive fee of $0.2 million—$6.2 million ($31.0 million cumulative realized capital gains multiplied by 20.0%) less $6.0 million (capital gains incentive fee taken
in Year 2)
Alternative 2
Assumptions
Year 1: $20.0 million investment made in Company A (“Investment A”), $30.0 million investment made in Company B
(“Investment B”) and $25.0 million investment made in Company C (“Investment C”)
Year 2: Investment A sold
for $50.0 million, FMV of Investment B determined to be $25.0 million and FMV of Investment C determined to be $25.0 million
121
Year 3: FMV of Investment B determined to be $27.0 million and Investment C sold for
$30.0 million
Year 4: FMV of Investment B determined to be $35.0 million
Year 5: Investment B sold for $20.0 million
The capital gains incentive fee, if any, would be:
Year 1: None
Year 2: $5.0 million capital gains incentive fee—20.0% multiplied by $25.0 million ($30.0 million realized capital gains on
Investment A less $5.0 million unrealized capital depreciation on Investment B)
Year 3: $1.4 million capital gains
incentive fee—$6.4 million (20.0% multiplied by $32.0 million ($35.0 million cumulative realized capital gains less $3.0 million unrealized capital depreciation)) less $5.0 million capital gains incentive fee received
in Year 2
Year 4: $0.6 million capital gains incentive fee—$7.0 million (20.0% multiplied by $35.0 million
cumulative realized capital gains) less cumulative $6.4 million capital gains incentive fee received in Year 2 and Year 3
Year 5:
None—$5.0 million (20.0% multiplied by $25.0 million (cumulative realized capital gains of $35.0 million less realized capital losses of $10.0 million)) less $7.0 million cumulative capital gains incentive fee paid in
Year 2, Year 3 and Year 4(1)
| * |
The hypothetical amounts of returns shown are based on a percentage of the Operating Company’s total net assets and assume no leverage. There is no guarantee that positive
returns will be realized and actual returns may vary from those shown in this example. The capital gains incentive fees are calculated on an “adjusted” basis for the Operating Company’s investments held prior to the IPO and assumes
those investments have been adjusted to reflect the amortization of purchase or original issue discount as if each investment was purchased at the date of the IPO, or stepped up to fair market value. |
| (1) |
As noted above, it is possible that the cumulative aggregate capital gains fee received by the Investment Adviser ($7.0 million) is effectively greater than
$5.0 million (20.0% of cumulative aggregate realized capital gains less net realized capital losses or net unrealized depreciation ($25.0 million)). |
Payment of Expenses
The Operating Company’s primary operating expenses are the payment
of a base management fee and any incentive fees under the Investment Management Agreement and the allocable portion of overhead and other expenses incurred by the Administrator in performing its obligations to the New Mountain Finance Entities under
the Administration Agreement. The Operating Company bears all other expenses of the New Mountain Finance Entities’ operations and transactions, including (without limitation) fees and expenses relating to:
| |
Ÿ |
|
organizational and offering expenses; |
| |
Ÿ |
|
the investigation and monitoring of the Operating Company’s investments; |
| |
Ÿ |
|
the cost of calculating net asset value; |
| |
Ÿ |
|
interest payable on debt, if any, to finance its investments; |
| |
Ÿ |
|
the cost of effecting sales and repurchases of shares of NMFC’s common stock and other securities; |
| |
Ÿ |
|
management and incentive fees payable pursuant to the Investment Management Agreement; |
122
| |
Ÿ |
|
fees payable to third parties relating to, or associated with, making investments and valuing investments (including third-party valuation firms);
|
| |
Ÿ |
|
transfer agent and custodial fees; |
| |
Ÿ |
|
fees and expenses associated with marketing efforts (including attendance at investment conferences and similar events); |
| |
Ÿ |
|
federal and state registration fees; |
| |
Ÿ |
|
any exchange listing fees; |
| |
Ÿ |
|
federal, state, local and foreign taxes; |
| |
Ÿ |
|
independent directors’ fees and expenses; |
| |
Ÿ |
|
costs of proxy statements, stockholders’ reports and notices; |
| |
Ÿ |
|
costs of preparing government filings, including periodic and current reports with the SEC; |
| |
Ÿ |
|
fees and expenses associated with independent audits and outside legal costs; |
| |
Ÿ |
|
costs associated with reporting and compliance obligations under the 1940 Act and applicable federal and state securities laws; |
| |
Ÿ |
|
fidelity bond, liability insurance and other insurance premiums; and |
| |
Ÿ |
|
printing, mailing and all other direct expenses incurred by either the Investment Adviser or the New Mountain Finance Entities in connection with administering
our business, including payments under the Administration Agreement that is based upon the Company’s allocable portion of overhead and other expenses incurred by the Administrator in performing its obligations to the New Mountain Finance
Entities under the Administration Agreement, including the allocable portion of the compensation of the New Mountain Finance Entities’ chief financial officer and chief compliance officer and their respective staffs.
|
Duration and Termination
The Investment Management Agreement was approved by the Operating Company’s board of directors, including a majority of the directors who are not interested persons, on March 10, 2011 and by a majority of
the partners of Guardian AIV and New Mountain Guardian Partners, L.P. through a written consent first solicited on November 8, 2010. Unless earlier terminated as described below, the Investment Management Agreement will remain in effect
for a period of two years from its effective date and will remain in effect from year-to-year thereafter if approved annually by the Operating Company’s board of directors or by the affirmative vote of the holders of a majority of the Operating
Company’s outstanding voting securities, voting on a pass through basis, and the majority of the Operating Company’s directors who are not interested persons. The Investment Management Agreement will automatically terminate in the event of
its assignment. The Investment Management Agreement may be terminated by either party without penalty upon 60 days’ written notice to the other. Any termination by the Operating Company must be authorized either by its board of directors
or by vote of its members, voting on a pass through basis.
At an in-person meeting held on February 23, 2012, the Operating
Company’s board of directors unanimously approved an amended and restated investment advisory and management agreement between the Operating Company and the Investment Adviser (the “New Advisory Agreement”). In accordance with the
1940 Act, the New Advisory Agreement was submitted for approval by the stockholders/unit holders of each of the New Mountain Finance Entities at the 2012 joint annual
123
meeting of the New Mountain Finance Entities, which was held on May 8, 2012. The New Advisory Agreement became effective and replaced the current Investment Management Agreement, immediately
upon receipt of the necessary stockholder/unit holder approval. The current Investment Management Agreement did not include certain clarifying language that was included in the New Mountain Finance Entities’ IPO registration statement
disclosure, however, the clarifying language included in the New Advisory Agreement is consistent with the disclosure in the New Mountain Finance Entities’ IPO registration statement.
Indemnification
The
Investment Management Agreement provides that, absent willful misfeasance, bad faith or gross negligence in the performance of their respective duties or by reason of the reckless disregard of their respective duties and obligations, the Investment
Adviser and its officers, managers, agents, employees, controlling persons, members (or their owners) and any other person or entity affiliated with it, are entitled to indemnification from the Operating Company for any damages, liabilities, costs
and expenses (including reasonable attorneys’ fees and amounts reasonably paid in settlement) arising from the rendering of the Investment Adviser’s services under the Investment Management Agreement or otherwise as the Investment Adviser.
Organization of the Investment Adviser
The Investment Adviser is a Delaware limited liability company. The principal address of the Investment Adviser is 787 Seventh Avenue, 48th Floor, New York, New York 10019. The Investment Adviser is
ultimately controlled by Steven B. Klinsky through Mr. Klinsky’s interest in New Mountain Capital.
Board Approval of the
Investment Management Agreement
A discussion regarding the basis for the Operating Company’s board of directors’ approval
of the Investment Management Agreement will be included in the Operating Company’s first annual report on Form 10-K filed subsequent to any such board approval, or incorporated by reference therein.
124
ADMINISTRATION AGREEMENT
The New Mountain Finance Entities have entered into the Administration Agreement with the Administrator, under which the Administrator provides
administrative services for the New Mountain Finance Entities, including arranging office facilities for the New Mountain Finance Entities and providing office equipment and clerical, bookkeeping and recordkeeping services at such facilities. Under
the Administration Agreement, the Administrator also performs, or oversees the performance of, the New Mountain Finance Entities’ required administrative services, which includes being responsible for the financial records which the New
Mountain Finance Entities are required to maintain and preparing reports to New Mountain Finance’s stockholders and reports filed with the SEC, which includes, but is not limited to, providing the services of the New Mountain Finance
Entities’ chief financial officer. In addition, the Administrator assists the New Mountain Finance Entities in determining and publishing their net asset values, overseeing the preparation and filing of tax returns and the printing and
dissemination of reports to New Mountain Finance’s stockholders, and generally overseeing the payment of the New Mountain Finance Entities’ expenses and the performance of administrative and professional services rendered to the New
Mountain Finance Entities by others. For providing these services, facilities and personnel, the Operating Company reimburses the Administrator the allocable portion of overhead and other expenses incurred by it in performing its obligations to the
New Mountain Finance Entities under the Administration Agreement, including rent and each of the New Mountain Finance Entities’ allocable portion of the costs of compensation and related expenses of the New Mountain Finance Entities’ chief
financial officer and chief compliance officer, and their respective staffs. The Administrator may also provide on the Operating Company’s behalf managerial assistance to our portfolio companies. The Administration Agreement may be terminated
by the New Mountain Finance Entities or the Administrator without penalty upon 60 days’ written notice to the other party. Pursuant to the Administration Agreement, and further restricted by the Operating Company, expenses payable to the
Administrator by the Operating Company as well as other direct and indirect expenses (excluding interest and other credit facility expenses and management and incentive fees) have been capped at $3.5 million for the time period from April 1,
2012 to March 31, 2013.
The Administration Agreement provides that, absent willful misfeasance, bad faith or gross negligence in
the performance of their respective duties or by reason of the reckless disregard of their respective duties and obligations, the Administrator and its officers, managers, agents, employees, controlling persons, members and any other person or
entity affiliated with it are entitled to indemnification from the New Mountain Finance Entities for any damages, liabilities, costs and expenses (including reasonable attorneys’ fees and amounts reasonably paid in settlement) arising from the
rendering of services under the Administration Agreement or otherwise as administrator for the New Mountain Finance Entities. Any amounts owing by New Mountain Finance pursuant to this indemnification obligation will be payable by the Operating
Company.
LICENSE AGREEMENT
The New Mountain Finance Entities, the Investment Adviser and the Administrator have entered into a royalty-free Trademark License Agreement, as
amended, with New Mountain Capital, pursuant to which New Mountain Capital has agreed to grant the New Mountain Finance Entities, the Investment Adviser and the Administrator a non-exclusive, royalty-free license to use the name “New
Mountain” and “New Mountain Finance”. Under this Trademark License Agreement, as amended, subject to certain conditions, the New Mountain Finance Entities, the Investment Adviser and the Administrator have a right to use the “New
Mountain” and the “New Mountain Finance” names for so long as the Investment Adviser or one of its affiliates remains the investment adviser of the Operating Company. Other than with respect to this limited license, the New Mountain
Finance Entities, the Investment Adviser and the Administrator have no legal right to the “New Mountain” and the “New Mountain Finance” names.
125
CERTAIN RELATIONSHIPS AND RELATED
TRANSACTIONS
Together, NMFC and AIV Holdings own all the outstanding units of the Operating Company. As of March 31, 2012,
NMFC and AIV Holdings own approximately 34.6% and 65.4%, respectively, of the units of the Operating Company.
The Operating Company has
entered into an Investment Advisory and Management Agreement with the Investment Adviser. Pursuant to the Investment Advisory and Management Agreement, payments will be equal to (a) a base management fee of 1.75% of the value of the Operating
Company’s gross assets and (b) an incentive fee based on the Operating Company’s performance. Steven B. Klinsky, through his financial interest in the Investment Adviser, is entitled to a portion of any profits earned by the
Investment Adviser, which includes any fees payable to the Investment Adviser under the terms of the Investment Advisory and Management Agreement, less expenses incurred by the Investment Adviser in performing its services under the Investment
Advisory and Management Agreement. In addition, the New Mountain Finance Entities’ executive officers and directors, as well as the current or future members of the Investment Adviser, serve or may serve as officers, directors or principals of
entities that operate in the same or a related line of business as the New Mountain Finance Entities do or of investment funds managed by the New Mountain Finance Entities’ affiliates. Accordingly, they may have obligations to investors in
those entities, the fulfillment of which might not be in the best interests of the Operating Company, NMFC or NMFC’s stockholders.
Although the Operating Company is currently New Mountain Capital’s only vehicle focused primarily on investing in first and second lien debt,
unsecured notes and mezzanine securities, in the future, the principals of the Investment Adviser and/or New Mountain Capital employees that provide services pursuant to the Investment Advisory and Management Agreement may manage other funds which
may from time to time have overlapping investment objectives with the Operating Company’s and, accordingly, may invest in, whether principally or secondarily, asset classes similar to those targeted by the Operating Company. If this occurs, the
Investment Adviser may face conflicts of interest in allocating investment opportunities to the Operating Company and such other funds. Although the investment professionals will endeavor to allocate investment opportunities in a fair and equitable
manner, it is possible that the Operating Company may not be given the opportunity to participate in certain investments made by investment funds managed by the Investment Adviser or persons affiliated with the Investment Adviser or that certain of
these investment funds may be favored over the Operating Company. When these investment professionals identify an investment, they will be forced to choose which investment fund should make the investment. Alternatively, depending on the
availability of such investment and other appropriate factors, the Investment Adviser or its affiliates may determine that the Operating Company should invest side-by-side with one or more other funds. Any such investments will be made only to the
extent permitted by applicable law and interpretive positions of the SEC and its staff, and consistent with the Investment Adviser’s allocation procedures.
The New Mountain Finance Entities have entered into the Administration Agreement with the Administrator. The Administrator arranges office space for the New Mountain Finance Entities and provides office equipment
and administrative services necessary to conduct their respective day-to-day operations pursuant to the Administration Agreement. the Operating Company reimburses the Administrator for the allocable portion of overhead and other expenses incurred by
it in performing its obligations to the Mountain Finance Entities under the Administration Agreement, including rent, the fees and expenses associated with performing administrative, finance, and compliance functions, and the compensation of the New
Mountain Finance Entities’ chief financial officer and chief compliance officer and their respective staffs. Pursuant to the Administration Agreement, as amended and restated, and further restricted by the Operating Company, expenses payable to
the Administrator by the Operating Company as well as other direct and indirect expenses (excluding interest and other credit facility expenses and management and incentive fees) have been capped at $3.5 million for the time period from
April 1, 2012 to March 31, 2013.
126
The New Mountain Finance Entities, the Investment Adviser and the Administrator, have also entered
into a Trademark License Agreement, as amended, with New Mountain Capital, pursuant to which New Mountain Capital has agreed to grant each of the New Mountain Finance Entities, the Investment Adviser and the Administrator, a non-exclusive,
royalty-free license to use the New Mountain and the New Mountain Finance names. Under the Trademark License Agreement, as amended, subject to certain conditions, the New Mountain Finance Entities, the Investment Adviser and the Administrator, will
have a right to use the New Mountain and the New Mountain Finance names, for so long as the Investment Adviser or one of its affiliates remains the investment adviser of the Operating Company. Other than with respect to this limited license, the New
Mountain Finance Entities, the Investment Adviser and the Administrator, will have no legal right to the “New Mountain” and the “New Mountain” Finance names.
NMFC and AIV Holdings have entered into joinder agreements with respect to the Amended and Restated Limited Liability Company Agreement, as
amended, of the Operating Company pursuant to which NMFC and AIV Holdings were admitted as members of the the Operating Company. Concurrently with the closing of NMFC’s initial public offering, NMFC sold 2,172,000 shares of its common stock to
certain executives and employees of, and other individuals affiliated with, New Mountain Capital in a separate private placement at the initial public offering price per share.
AIV Holdings entered into a Registration Rights Agreement with NMFC, Steven B. Klinsky (the Chairman of our boards of directors), an entity related
to Steven B. Klinsky and the Investment Adviser. Subject to several exceptions, AIV Holdings and the Investment Adviser have the right to require NMFC to register for public resale under the Securities Act of 1933, as amended, all registerable
securities that are held by any of them and that they request to be registered. Registerable securities subject to the Registration Rights Agreement are shares of NMFC’s common stock issued or issuable in exchange for units and any other shares
of NMFC’s common stock held by AIV Holdings, the Investment Adviser and any of their transferees. The rights under the Registration Rights Agreement can be conditionally exercised by AIV Holdings or the Investment Adviser, meaning that prior to
the effectiveness of the registration statement related to the shares, AIV Holdings or the Investment Adviser can withdraw their request to have the shares registered. AIV Holdings and the Investment Adviser may each assign their rights to any
person that acquires registerable securities subject to the Registration Rights Agreement and who agrees to be bound by the terms of the Registration Rights Agreement. Steven B. Klinsky (and a related entity) will have the right to
“piggyback”, or include his own registrable securities in such a registration.
Holders of registerable securities have
“piggyback” registration rights, including AIV Holdings, which means that these holders may include their respective shares in any future registrations of NMFC’s equity securities, whether or not that registration relates to a primary
offering by NMFC or a secondary offering by or on behalf of any of NMFC’s stockholders. AIV Holdings, the Investment Adviser and Steven B. Klinsky (and a related entity) have priority over NMFC in any registration that is an underwritten
offering.
AIV Holdings, the Investment Adviser and Steven B. Klinsky (and a related entity) will be responsible for the expenses of any
demand registration (including underwriters’ discounts or commissions) and their pro-rata share of any “piggyback” registration. NMFC has agreed to indemnify AIV Holdings, the Investment Adviser and Steven B. Klinsky (and a related
entity) with respect to liabilities resulting from untrue statements or omissions in any registration statement filed pursuant to the Registration Rights Agreement, other than untrue statements or omissions resulting from information furnished to
NMFC by such parties. AIV Holdings, the Investment Adviser and Steven B. Klinsky (and a related entity) have also agreed to indemnify NFMC with respect to liabilities resulting from untrue statements or omissions furnished by them to NMFC relating
to them in any registration statement.
127
In the ordinary course of business, the Operating Company may enter into transactions with portfolio
companies that may be considered related party transactions. In order to ensure that the Operating Company does not engage in any prohibited transactions with any persons affiliated with the Operating Company, the Operating Company has implemented
certain policies and procedures whereby its executive officers screen each of its transactions for any possible affiliations between the proposed portfolio investment, the Operating Company, companies controlled by the Operating Company and its
employees and directors. The Operating Company will not enter into any agreements unless and until it is satisfied that doing so will not raise concerns under the 1940 Act or, if such concerns exist, the Operating Company has taken appropriate
actions to seek board review and approval or exemptive relief for such transaction. The Operating Company’s board of directors reviews these procedures on a quarterly basis.
The New Mountain Finance Entities have each adopted a Code of Ethics which applies to, among others, their senior officers, including their
respective chief executive officer and chief financial officer, as well as all of their officers, directors and employees. The New Mountain Finance Entities’ Codes of Ethics require that all employees and directors avoid any conflict, or the
appearance of a conflict, between an individual’s personal interests and the New Mountain Finance Entities’ interests. Pursuant to such Codes of Ethics, each employee and director must disclose any conflicts of interest, or actions or
relationships that might give rise to a conflict, to the New Mountain Finance Entities’ chief compliance officer.
128
CONTROL PERSONS AND PRINCIPAL STOCKHOLDERS
The following table sets forth information with respect to the beneficial ownership of NMFC’s common stock and the units of
the Operating Company by:
| |
Ÿ |
|
each person known to the New Mountain Finance Entities to beneficially own 5.0% or more of the outstanding shares of NMFC’s common stock or the membership
units of the Operating Company; |
| |
Ÿ |
|
each of NMFC’s directors and each executive officer individually; and |
| |
Ÿ |
|
all of NMFC’s directors and executive officers as a group. |
Beneficial ownership has been determined in accordance with Rule 13d-3 under the Securities Exchange Act of 1934, as amended (the “Exchange Act”) and includes voting or investment power (including
the power to dispose) with respect to the securities. Assumes no other purchases or sales of securities since the most recently available SEC filings. This assumption has been made under the rules and regulations of the SEC and does not reflect any
knowledge that NMFC has with respect to the present intent of the beneficial owners of the securities listed in the table below.
Percentage of beneficial ownership below takes into account 10,697,691 shares of common stock of NMFC outstanding and 30,919,629 units of the
Operating Company outstanding, in each case as of June 29, 2012. Unless otherwise indicated, the address for each listed holder is c/o New Mountain Finance Corporation, 787 Seventh Avenue, 48th Floor, New York, New York 10019.
|
|
|
|
|
|
|
|
|
|
|
|
|
|
|
|
|
|
|
|
|
| |
|
|
|
|
NMFC Shares(1) |
|
|
Operating Company
Units(1) |
|
| Name |
|
Type of
Ownership in
NMFC(2) |
|
|
Number |
|
|
Percentage |
|
|
Number |
|
|
Percentage |
|
| Beneficial Owners of More than 5.0%: |
|
|
|
|
|
|
|
|
|
|
|
|
|
|
|
|
|
|
|
|
| New Mountain Guardian AIV, L.P.(3) |
|
|
Beneficial |
|
|
|
20,221,938 |
|
|
|
65.4 |
% |
|
|
20,221,938 |
|
|
|
65.4 |
% |
| New Mountain Investments III, L.L.C.(3) |
|
|
Beneficial |
|
|
|
20,221,938 |
|
|
|
65.4 |
% |
|
|
20,221,938 |
|
|
|
65.4 |
% |
| New Mountain Finance AIV Holdings Corporation(3) |
|
|
Beneficial |
|
|
|
20,221,938 |
|
|
|
65.4 |
% |
|
|
20,221,938 |
|
|
|
65.4 |
% |
| New Mountain Finance Corporation |
|
|
N/A |
|
|
|
— |
|
|
|
* |
|
|
|
10,697,691 |
|
|
|
34.6 |
% |
| Adams Street Partners, LLC(4) |
|
|
Direct |
|
|
|
2,424,608 |
|
|
|
22.7 |
% |
|
|
2,424,608 |
|
|
|
7.8 |
% |
| RH Capital Associates LLC(5) |
|
|
Direct |
|
|
|
712,578 |
|
|
|
6.7 |
% |
|
|
712,578 |
|
|
|
2.3 |
% |
| Executive Officers: |
|
|
|
|
|
|
|
|
|
|
|
|
|
|
|
|
|
|
|
|
| Adam J. Weinstein |
|
|
Direct |
|
|
|
16,401 |
|
|
|
* |
|
|
|
16,401 |
|
|
|
* |
|
| Paula A. Bosco |
|
|
Direct |
|
|
|
10,070 |
|
|
|
* |
|
|
|
10,070 |
|
|
|
* |
|
| Interested Directors: |
|
|
|
|
|
|
|
|
|
|
|
|
|
|
|
|
|
|
|
|
| Steven B. Klinsky(3)(6) |
|
|
Direct and
Beneficial |
|
|
|
22,364,936 |
|
|
|
72.3 |
% |
|
|
22,364,936 |
|
|
|
72.3 |
% |
| Robert A. Hamwee |
|
|
Direct |
|
|
|
86,610 |
|
|
|
* |
|
|
|
86,610 |
|
|
|
* |
|
| Independent Directors: |
|
|
|
|
|
|
|
|
|
|
|
|
|
|
|
|
|
|
|
|
| David Ogens |
|
|
Direct |
|
|
|
11,000 |
|
|
|
* |
|
|
|
11,000 |
|
|
|
* |
|
| Albert F. Hurley, Jr. |
|
|
Direct |
|
|
|
7,448 |
|
|
|
* |
|
|
|
7,448 |
|
|
|
* |
|
| Kurt J. Wolfgruber |
|
|
Direct |
|
|
|
15,698 |
|
|
|
* |
|
|
|
15,698 |
|
|
|
* |
|
| All executive officers and directors as a group (7 persons)(3) |
|
|
Direct and
Beneficial |
|
|
|
22,512,163 |
|
|
|
72.8 |
% |
|
|
22,512,163 |
|
|
|
72.8 |
% |
| * |
Represents less than 1.0%. |
| (1) |
All units of the Operating Company are held indirectly by the below-listed parties, other than units held by AIV Holdings and NMFC. Some or all of the units of the Operating
Company, other than units held by NMFC, can be exchanged at any time and from time to time on a one-for-one basis into shares of NMFC. |
129
| (2) |
Direct holders of NMFC’s common stock have voting power on a pass-through basis over the same number of units of the Operating Company and, therefore, may be deemed to
beneficially own such units of the Operating Company. |
| (3) |
Guardian AIV is the sole stockholder of AIV Holdings. AIV Holdings has the right to exchange its units of the Operating Company for shares of NMFC’s common stock on a
one-for-one basis. If AIV Holdings chooses to exchange all of its units of the Operating Company, AIV Holdings would receive 20,221,938 shares of NMFC’s common stock. The general partner of Guardian AIV is New Mountain Investments III,
L.L.C., of which Steven B. Klinsky is the managing member. New Mountain Investments III, L.L.C., as the general partner of Guardian AIV, has voting power on a pass-through basis as to its portion of units of the Operating Company. In addition,
because Guardian AIV owns all of the common stock of AIV Holdings, Guardian AIV may be deemed to beneficially own the units of the Operating Company held by AIV Holdings. Mr. Klinsky, as the managing member of New Mountain Investments III,
L.L.C., has voting power and decision making power over the disposition of the holdings of Guardian AIV on a pass-through basis. Mr. Klinsky may be deemed to beneficially own the direct or indirect holdings of Guardian AIV. Mr. Klinsky and
New Mountain Investments III, L.L.C. expressly disclaim beneficial ownership of the above shares of NMFC common stock and the above units of the Operating Company. |
| (4) |
Such securities are held by certain investment vehicles controlled and/or managed by Adams Street Partners, LLC or its affiliates. The address for Adams Street is One North
Wacker Drive, Suite 2200, Chicago, Illinois 60606. |
| (5) |
The address for RH Capital Associates LLC is P.O. Box 449, Suffern, New York 10901. |
| (6) |
Mr. Klinsky directly owns 1,993,304 shares of NMFC’s common stock. The Steven B. Klinsky Trust directly owns 76,609 shares of NMFC’s common stock. New Mountain
Guardian GP, L.L.C. directly owns 73,085 shares of NMFC’s common stock and Mr. Klinsky is the sole owner of New Mountain Guardian GP, L.L.C. |
The following table sets forth the dollar range of NMFC equity securities, including units of the Operating Company over which holders of NMFC’s common stock have voting power that is beneficially owned by
each of NMFC’s directors.
|
|
|
| |
|
Dollar Range of Equity
Securities Beneficially Owned(1)(2)(3) |
| Interested Directors: |
|
|
| Steven B. Klinsky |
|
Over $100,000 |
| Robert A. Hamwee |
|
Over $100,000 |
|
|
| Independent Directors: |
|
|
| David Ogens(4) |
|
Over $100,000 |
| Albert F. Hurley, Jr. |
|
Over $100,000 |
| Kurt J. Wolfgruber |
|
Over $100,000 |
| (1) |
Beneficial ownership has been determined in accordance with Exchange Act Rule 16a-1(a)(2). |
| (2) |
The dollar range of equity securities beneficially owned in NMFC is based on the closing price for NMFC’s common stock of $14.19 per share on June 29, 2012 on the NYSE.
|
| (3) |
The dollar range of equity securities beneficially owned are: None, $1 - $10,000, $10,001 - $50,000, $50,001 - $100,000 or over $100,000.
|
| (4) |
Mr. Ogens is the beneficial owner of a limited partnership interest in New Mountain Partners, L.P. and New Mountain Partners II, L.P. that is held by Ogens
Family, Inc. |
130
SELLING STOCKHOLDERS
This prospectus also relates to 22,393,938 shares of NMFC’s common stock being offered for resale on behalf of the stockholders identified
below. The stockholders acquired the shares from us in connection with our formation transactions prior to the IPO and the Concurrent Private Placement. We are registering the shares to permit the stockholders and their pledgees, donees, transferees
and other successors-in-interest that receive their shares from a stockholder as a gift, partnership distribution or other non-sale related transfer after the date of this prospectus to resell the shares when and as they deem appropriate. We do not
know how long the stockholders will hold the shares before selling them, if at all, or how many shares they will sell, if any, and we currently have no agreements, arrangements or understandings with any of the stockholders regarding the sale of any
of the resale shares.
The following table sets forth:
| |
Ÿ |
|
the name of the stockholders; |
| |
Ÿ |
|
the number and percent of shares of NMFC’s common stock that the stockholders beneficially owned prior to the offering for resale of the shares under this
prospectus; |
| |
Ÿ |
|
the number of shares of NMFC’s common stock that may be offered for resale for the account of the stockholders under this prospectus; and
|
| |
Ÿ |
|
the number and percent of shares of NMFC’s common stock to be beneficially owned by the stockholders after the offering of the resale shares (assuming all
of the offered resale shares are sold by the stockholders). |
The number of shares in the column “Number of Shares
Being Offered” represents all of the shares that each stockholder may offer under this prospectus. The shares offered by this prospectus may be offered from time to time by the stockholders listed below.
This table is prepared solely based on information supplied to us by the listed stockholders and any public documents filed with the SEC, and
assumes the sale of all of the resale shares. The applicable percentages of beneficial ownership are based on an aggregate of 30,919,629 shares of NMFC’s common stock issued and outstanding on June 29, 2012, which assumes that all the
outstanding units of the Operating Company have been exchanged for shares of NMFC’s common stock, adjusted as may be required by rules promulgated by the SEC.
Beneficial ownership has been determined in accordance with Rule 13d-3 under the Exchange Act and includes voting or investment power (including the power to dispose) with respect to the securities. Assumes no
other purchases or sales of securities since the most recently available SEC filings. This assumption has been made under the rules and regulations of the SEC and does not reflect any knowledge that NMFC has with respect to the present intent of the
beneficial owners of the securities listed in the table below.
|
|
|
|
|
|
|
|
|
|
|
|
|
|
|
|
|
|
|
|
|
|
|
|
|
|
| Stockholders |
|
Shares Beneficially
Owned Prior to Offering |
|
Number of
Shares
Being
Offered |
|
Shares Beneficially
Owned After Offering |
| |
|
Number |
|
Percent |
|
|
Number |
|
Percent |
| New Mountain Finance AIV Holdings Corporation(1) |
|
|
|
20,221,938 |
|
|
|
|
65.4 |
% |
|
|
|
20,221,938 |
|
|
|
|
— |
|
|
|
|
— |
|
| Steven B. Klinsky(2) |
|
|
|
1,993,304 |
|
|
|
|
6.5 |
% |
|
|
|
1,794,412 |
|
|
|
|
198,892 |
|
|
|
|
* |
|
| Steven B. Klinsky Trust(3) |
|
|
|
76,609 |
|
|
|
|
* |
|
|
|
|
68,965 |
|
|
|
|
7,644 |
|
|
|
|
* |
|
| Robert Hamwee(2) |
|
|
|
86,610 |
|
|
|
|
* |
|
|
|
|
68,965 |
|
|
|
|
17,645 |
|
|
|
|
* |
|
| Adam Weinstein(2) |
|
|
|
16,401 |
|
|
|
|
* |
|
|
|
|
8,621 |
|
|
|
|
7,780 |
|
|
|
|
* |
|
| Paula Bosco(2) |
|
|
|
10,070 |
|
|
|
|
* |
|
|
|
|
1,724 |
|
|
|
|
8,346 |
|
|
|
|
* |
|
| Other(4) |
|
|
|
273,259 |
|
|
|
|
* |
|
|
|
|
229,313 |
|
|
|
|
43,946 |
|
|
|
|
* |
|
| Total |
|
|
|
22,678,191 |
|
|
|
|
73.3 |
% |
|
|
|
22,393,938 |
|
|
|
|
284,253 |
|
|
|
|
* |
|
131
| (1) |
Guardian AIV is the sole stockholder of AIV Holdings. AIV Holdings has the right to exchange its units of the Operating Company for shares of NMFC’s common stock on a
one-for-one basis. If AIV Holdings chooses to exchange all of its units of the Operating Company, AIV Holdings would receive 20,221,938 shares of NMFC’s common stock. The general partner of Guardian AIV is New Mountain Investments III, L.L.C.,
of which Steven B. Klinsky is the managing member. New Mountain Investments III, L.L.C., as the general partner of Guardian AIV, has voting power on a pass-through basis as to its portion of units of the Operating Company. In addition, because
Guardian AIV owns all of the common stock of AIV Holdings, Guardian AIV may be deemed to beneficially own the units of the Operating Company held by AIV Holdings. Mr. Klinsky, as the managing member of New Mountain Investments III, L.L.C., has
voting power and decision making power over the disposition of the holdings of Guardian AIV on a pass-through basis. Mr. Klinsky may be deemed to beneficially own the direct or indirect holdings of Guardian AIV. Mr. Klinsky and New
Mountain Investments III, L.L.C. expressly disclaim beneficial ownership of the above shares of NMFC common stock and the above units of the Operating Company. |
| (2) |
Reflects an officer and/or director of NMFC and the Operating Company. |
| (3) |
Steven B. Klinsky is the trustee of the Steven B. Klinsky Trust and has voting and investment power with respect to the shares of NMFC's common stock held by the Steven B.
Klinsky Trust. |
| (4) |
Represents selling stockholders who, collectively, own less than 1.0% of total shares of NMFC's common stock outstanding on a fully converted basis. These selling stockholders
are employees and/or affiliates of New Mountain Capital Group, L.L.C., which is an affiliate of NMFC and the Operating Company. |
132
DETERMINATION OF NET ASSET VALUE
Quarterly Net Asset Value Determinations
Operating Company
The Operating Company conducts the valuation of assets, pursuant to
which its net asset value, and, consequently, NMFC’s net asset value is determined, at all times consistent with GAAP and the 1940 Act. NMFC values its ownership interest on a quarterly basis, or more frequently if required under the 1940 Act.
The Operating Company applies fair value accounting in accordance with GAAP. The Operating Company values its assets on a quarterly
basis, or more frequently if required under the 1940 Act. In all cases, the Operating Company’s board of directors is ultimately and solely responsible for determining the fair value of the portfolio investments on a quarterly basis in good
faith, including investments that are not publicly traded, those whose market prices are not readily available and any other situation where its portfolio investments require a fair value determination. Security transactions are accounted for on a
trade date basis. The Operating Company’s quarterly valuation procedures are set forth in more detail below:
(1)
Investments for which market quotations are readily available on an exchange are valued at such market quotations based on the closing price indicated from independent pricing services.
(2) Investments for which indicative prices are obtained from various pricing services and/or brokers or dealers are valued through
a multi-step valuation process, as described below, to determine whether the quote(s) obtained is representative of fair value in accordance with GAAP.
a. Bond quotes are obtained through independent pricing services. Analytics are performed by the investment professionals of the Investment Adviser to ensure that the quote obtained is representative of fair value
in accordance with GAAP and if so, the quote is used. If the Investment Adviser is unable to sufficiently validate the quote(s) internally and if the investment’s par value exceeds the materiality threshold, the investment is valued similarly
to those assets with no readily available quotes (see (3) below); and
b. For investments other than bonds, the
Operating Company looks at the number of quotes readily available and performs the following:
i. Investments for which
more than two quotes are received from a pricing service are valued using the mean of the mean of the bid and ask of the quotes obtained;
ii. Investments for which one or two quotes are received from a pricing service are validated internally. The investment professionals of the Investment Adviser analyze the market quotes obtained using an array of
valuation methods (further described below) to validate the fair value. If the Investment Adviser is unable to sufficiently validate the quote(s) internally and if the investment’s par value exceeds the materiality threshold, the investment is
valued similarly to those assets with no readily available quotes (see (3) below).
(3) Investments for which
quotations are not readily available through exchanges, pricing services, brokers, or dealers are valued through a multi-step valuation process:
a. Each portfolio company or investment is initially valued by the investment professionals of the Investment Adviser responsible for the credit monitoring;
b. Preliminary valuation conclusions will then be documented and discussed with the Operating Company’s senior management;
c. If an investment falls into (3) above for four consecutive quarters and if the investment’s par value
exceeds the materiality threshold, then at least once each fiscal year, the valuation for
133
each portfolio investment for which the Operating Company does not have a readily available market quotation will be reviewed by an independent valuation firm engaged by our board of directors;
and
d. Also, when deemed appropriate by the Operating Company’s management, an independent valuation firm may be
engaged to review and value investment(s) of a portfolio company, without any preliminary valuation being performed by the Investment Adviser. The investment professionals of the Investment Adviser will review and validate the value provided.
Valuation methods may include comparisons of financial ratios of the portfolio companies that issued such private securities to peer
companies that are public, the nature of and the realizable value of any collateral, the portfolio company’s earnings, discounted cash flows, the ability to make payments, the markets in which the portfolio company conducts business, and other
relevant factors, including available market data such as relevant and applicable market trading and transaction comparables; applicable market yields and multiples; security covenants; call protection provisions; information rights; comparable
merger and acquisition transactions; and the principal market and enterprise values. When an external event such as a purchase transaction, public offering or subsequent sale occurs, the Operating Company will consider the pricing indicated by the
external event to corroborate the private valuation.
The values assigned to investments are based upon available information and do not
necessarily represent amounts which might ultimately be realized, since such amounts depend on future circumstances and cannot be reasonably determined until the individual positions are liquidated. Due to the inherent uncertainty of determining the
fair value of investments that do not have a readily available market value, the fair value of the Operating Company’s investments may fluctuate from period to period.
NMFC
Since NMFC is a holding company and its only business and sole asset will be its
ownership of units of the Operating Company, the value of its interest in the Operating Company depends on the Operating Company’s valuation of our investments. NMFC conducts the valuation of its ownership in the Operating Company, pursuant to
which its net asset value is determined, at all times consistent with GAAP and the 1940 Act. The net asset value per share of NMFC’s common stock is determined on a quarterly basis and is equal to NMFC’s pro rata share, based on the number
of units of the Operating Company held by NMFC at the time of the net asset value determination, of the Operating Company’s net asset value divided by the total number of shares of NMFC’s common stock outstanding. NMFC’s board of
directors have no control over the determinations of fair value by the Operating Company’s board of directors, although the Operating Company’s current board of directors is the same as NMFC’s. As a result, the value of your
investment in shares of NMFC’s common stock may be understated or overstated based on the Operating Company’s fair value determinations. In the event that NMFC’s board of directors believes that a different fair value for the
Operating Company’s investments is appropriate, NMFC’s board of directors will endeavor to discuss the differences in the valuations with the Operating Company’s board of directors for the purposes of resolving the differences in
valuation. The valuation procedures of NMFC will be substantially similar to those utilized by the Operating Company described above.
134
Determinations in Connection with Offerings
In connection with future offering of shares of NMFC’s common stock, NMFC’s board of directors or a committee thereof will be required to
make the determination that it is not selling shares of NMFC’s common stock at a price below the then current net asset value of NMFC’s common stock at the time at which the sale is made. NMFC’s board of directors will consider the
following factors, among others, in making such determination:
| |
Ÿ |
|
the net asset value per share of NMFC’s common stock disclosed in the most recent periodic report that we filed with the SEC; |
| |
Ÿ |
|
NMFC’s management’s assessment of whether any material change in the net asset value per share of its common stock has occurred (including through the
realization of gains on the sale of the Operating Company’s portfolio securities) during the period beginning on the date of the most recently disclosed net asset value per share of NMFC’s common stock and ending two days prior to the date
of the sale of NMFC’s common stock; and |
| |
Ÿ |
|
the magnitude of the difference between (i) the net asset value per share of NMFC’s common stock disclosed in the most recent periodic report that we
filed with the SEC and NMFC management’s assessment of any material change in the net asset value per share of NMFC’s common stock since the date of the most recently disclosed net asset value per share of NMFC’s common stock and
(ii) the offering price of the shares of NMFC’s common stock in the proposed offering. |
Importantly, this
determination will not require that NMFC calculate the net asset value per share of its common stock in connection with each offering of shares of its common stock, but instead it will involve the determination by its board of directors or a
committee thereof that it is not selling shares of NMFC’s common stock at a price per share below the then current net asset value per share of NMFC’s common stock at the time at which the sale is made.
Moreover, to the extent that there is even a remote possibility that NMFC may (i) issue shares of its common stock at a price per share below
the then current net asset value per share of its common stock at the time at which the sale is made or (ii) trigger the undertaking (which we provide in certain registration statements we file with the SEC) to suspend the offering of shares of
its common stock pursuant to this prospectus if the net asset value per share of NMFC’s common stock fluctuates by certain amounts in certain circumstances until the prospectus is amended, NMFC’s board of directors will elect, in the case
of clause (i) above, either to postpone the offering until such time that there is no longer the possibility of the occurrence of such event or to undertake to determine the net asset value per share of its common stock within two days prior to
any such sale to ensure that such sale will not be below its then current net asset value per share, and, in the case of clause (ii) above, to comply with such undertaking or to undertake to determine the net asset value per share of its common
stock to ensure that such undertaking has not been triggered.
These processes and procedures are part of our compliance policies and
procedures. Records will be made contemporaneously with all determinations described in this section and these records will be maintained with other records that NMFC and the Operating Company are required to maintain under the 1940 Act.
135
DIVIDEND REINVESTMENT PLAN
NMFC has adopted a dividend reinvestment plan that provides for reinvestment of its distributions on behalf of its stockholders, unless a
stockholder elects to receive cash as provided below. As a result, if NMFC’s board of directors authorizes, and NMFC declares, a cash distribution, then NMFC’s stockholders who have not “opted out” of the dividend reinvestment
plan will have their cash distributions automatically reinvested in additional shares of NMFC’s common stock, rather than receiving the cash distributions.
No action will be required on the part of a registered stockholder to have their cash distributions reinvested in shares of NMFC’s common stock. A registered stockholder may elect to receive an entire
distribution in cash by notifying American Stock Transfer and Trust Company, LLC the plan administrator and NMFC’s transfer agent and registrar, in writing, by phone or through the internet so that such notice is received by the plan
administrator no later than three days prior to the payment date for distributions to stockholders. The plan administrator will set up an account for shares acquired through the plan for each stockholder who has not elected to receive distributions
in cash and hold such shares in non-certificated form. Upon request by a stockholder participating in the plan, received in writing, by phone or through the internet at any time, the plan administrator will, instead of crediting shares to the
participant’s account, issue a certificate registered in the participant’s name for the number of whole shares of NMFC’s common stock and a check for any fractional share less a transaction fee of the lesser of (i) $15.00 and
(ii) the price of the fractional share.
Cash distributions reinvested in additional shares of NMFC’s common stock will be
automatically reinvested by NMFC in the Operating Company. NMFC will use only newly issued shares to implement the plan if the price at which newly issued shares are to be credited is equal to or greater than 110.0% of the last determined net asset
value of the shares. Under such circumstances, the number of shares to be issued to a stockholder is determined by dividing the total dollar amount of the distribution payable to such stockholder by the market price per share of NMFC’s common
stock at the close of regular trading on the NYSE on the distribution payment date. Market price per share on that date will be the closing price for such shares on the NYSE or, if no sale is reported for such day, the average of their
electronically reported bid and asked prices. If NMFC uses newly issued shares to implement the plan, NMFC will receive, on a one-for-one basis, additional units of the Operating Company in exchange for cash distributions that are reinvested in
shares of NMFC’s common stock under the dividend reinvestment plan. NMFC reserves the right to purchase its shares in the open market in connection with its implementation of the plan if the price at which its newly issued shares are to be
credited does not exceed 110.0% of the last determined net asset value of the shares. Shares purchased in open market transactions by the plan administrator will be allocated to a stockholder based on the average purchase price, excluding any
brokerage charges or other charges, of all shares of common stock purchased in the open market. The number of shares of NMFC’s common stock to be outstanding after giving effect to payment of the distribution cannot be established until the
value per share at which additional shares will be issued has been determined and elections of NMFC’s stockholders have been tabulated.
There will be no brokerage charges or other charges for dividend reinvestment to stockholders who participate in the plan. The Operating Company will pay on NMFC’s behalf the plan administrator’s fees
under the plan. If a participant elects by written, telephone, or internet notice to the plan administrator to have the plan administrator sell part or all of the shares held by the plan administrator in the participant’s account and remit the
proceeds to the participant, the plan administrator is authorized to deduct a $15.00 transaction fee plus a $0.10 per share brokerage commissions from the proceeds.
Stockholders who receive distributions in the form of stock generally are subject to the same federal income tax consequences as are stockholders who elect to receive their distributions in cash. A
136
stockholder’s basis for determining gain or loss upon the sale of stock received in a distribution from NMFC will be equal to the total dollar amount of the distribution payable to the
stockholder. Any stock received in a distribution will have a holding period for tax purposes commencing on the day following the day on which the shares are credited to the U.S. stockholder’s account.
Participants may terminate their accounts under the plan by notifying the plan administrator via its website at www.amstock.com, by filling
out the transaction request form located at the bottom of their statement and sending it to the plan administrator at American Stock Transfer and Trust Company, LLC, P.O. Box 922, Wall Street Station, New York, New York 10269, Attention: Plan
Administration Department, or by calling the plan administrator at (888) 333-0212.
All correspondence concerning the plan should
be directed to the plan administrator by mail at American Stock Transfer and Trust Company, LLC, P.O. Box 922, Wall Street Station, New York, New York 10269, or by telephone at (888) 333-0212.
137
DESCRIPTION OF NMFC’S CAPITAL STOCK
The following description is based on relevant portions of the Delaware General Corporation Law, NMFC’s amended and
restated certificate of incorporation and amended and restated bylaws. This summary is not necessarily complete, and we refer you to the Delaware General Corporation Law, NMFC’s amended and restated certificate of incorporation and amended and
restated bylaws for a more detailed description of the provisions summarized below.
Capital Stock
NMFC’s authorized capital stock shall consist of 100,000,000 shares of common stock, par value $0.01 per share, of which 10,697,691 shares are
currently outstanding, and 2,000,000 shares of preferred stock, par value $0.01, of which no shares are currently outstanding. NMFC’s common stock is listed on the NYSE under the ticker symbol “NMFC”. No stock has been authorized for
issuance under any equity compensation plans. Under Delaware law, NMFC’s stockholders generally will not be personally liable for our debts or obligations.
The following are NMFC’s outstanding classes of securities as of July 6, 2012:
|
|
|
|
|
|
|
|
|
|
|
|
|
|
|
|
| (1)
Title of Class |
|
(2)
Amount
Authorized |
|
(3)
Amount Held by
NMFC or for Its
Account |
|
(4)
Amount Outstanding
Exclusive of Amount
Under Column 3 |
| Common Stock |
|
|
|
100,000,000 |
|
|
|
|
— |
|
|
|
|
10,697,691 |
|
| Preferred Stock |
|
|
|
2,000,000 |
|
|
|
|
— |
|
|
|
|
— |
|
Common Stock
Under the terms of NMFC’s amended and restated certificate of incorporation, all shares of NMFC’s common stock will have equal rights as to earnings, assets, dividends and voting and, when they are
issued, will be duly authorized, validly issued, fully paid and nonassessable. Distributions may be paid to the holders of NMFC’s common stock if, as and when authorized by NMFC’s board of directors and declared by NMFC out of funds
legally available therefore. Shares of NMFC’s common stock will have no preemptive, exchange, conversion or redemption rights and will be freely transferable, except where their transfer is restricted by federal and state securities laws or by
contract. In the event of NMFC’s liquidation, dissolution or winding up, each share of its common stock would be entitled to share ratably in all of its assets that are legally available for distribution after it pays all debts and other
liabilities and subject to any preferential rights of holders of its preferred stock, if any preferred stock is outstanding at such time. Each share of NMFC’s common stock will be entitled to one vote on all matters submitted to a vote of
stockholders, including the election of directors. Except as provided with respect to any other class or series of stock, the holders of NMFC’s common stock will possess exclusive voting power. There will be no cumulative voting in the election
of directors, which means that holders of a majority of the outstanding shares of common stock will be able to elect all of NMFC’s directors (other than directors to be elected solely by the holders of preferred stock), and holders of less than
a majority of such shares will be unable to elect any director.
NMFC’s amended and restated certificate of incorporation will
require NMFC at all times to reserve and keep available out of its authorized but unissued shares of common stock the number of shares that are issuable upon exchange of all outstanding the Operating Company units held by AIV Holdings and, if
applicable with respect to any units received as payment of the incentive fee, the Investment Adviser.
138
Preferred Stock
NMFC’s amended and restated certificate of incorporation authorizes its board of directors to issue preferred stock. Prior to the issuance of shares of each class or series, the board of directors is required
by Delaware law and by NMFC’s amended and restated certificate of incorporation to set the terms, preferences, conversion or other rights, voting powers, restrictions, limitations as to dividends or other distributions, qualifications and terms
or conditions of redemption for each class or series. Thus, the board of directors could authorize the issuance of shares of preferred stock with terms and conditions which could have the effect of delaying, deferring or preventing a transaction or
a change in control that might involve a premium price for holders of NMFC’s common stock or otherwise be in their best interest. You should note, however, that any issuance of preferred stock must comply with the requirements of the 1940 Act.
The 1940 Act requires, among other things, that (1) immediately after issuance and before any dividend or other distribution is made with respect to NMFC’s common stock and before any purchase of common stock is made, such preferred stock
together with all other senior securities must not exceed an amount equal to 50.0% of the Operating Company’s total assets after deducting the amount of such dividend, distribution or purchase price, as the case may be, and (2) the holders
of shares of preferred stock, if any are issued, must be entitled as a class to elect two directors at all times and to elect a majority of the directors if dividends on such preferred stock are in arrears by two full years or more. Certain matters
under the 1940 Act require the separate vote of the holders of any issued and outstanding preferred stock. For example, holders of preferred stock would vote separately from the holders of common stock on a proposal to cease operations as a BDC. We
believe that the availability for issuance by NMFC of preferred stock will provide us with increased flexibility in structuring future financings and acquisitions. However, NMFC does not currently have any plans to issue preferred stock.
Limitation on Liability of Directors and Officers; Indemnification and Advance of Expenses
The Delaware General Corporation Law authorizes corporations to limit or eliminate the personal liability of directors to corporations and their
stockholders for monetary damages for breaches of directors’ fiduciary duties. NMFC’s amended and restated certificate of incorporation will include a provision that eliminates the personal liability of its directors for monetary damages
for actions taken as a director, except for liability:
| |
Ÿ |
|
for breach of duty of loyalty; |
| |
Ÿ |
|
for acts or omissions not in good faith or involving intentional misconduct or knowing violation of law; |
| |
Ÿ |
|
under Section 174 of the DGCL (unlawful dividends); or |
| |
Ÿ |
|
for transactions from which the director derived improper personal benefit. |
Under NMFC’s amended and restated bylaws, NMFC will fully indemnify any person who was or is involved in any actual or threatened action, suit
or proceeding by reason of the fact that such person is or was one of NMFC’s directors or officers. So long as NMFC is regulated under the 1940 Act, the above indemnification and limitation of liability is limited by the 1940 Act or by any
valid rule, regulation or order of the SEC thereunder. The 1940 Act provides, among other things, that a company may not indemnify any director or officer against liability to it or its security holders to which he or she might otherwise be subject
by reason of his or her willful misfeasance, bad faith, gross negligence or reckless disregard of the duties involved in the conduct of his or her office unless a determination is made by final decision of a court, by vote of a majority of a quorum
of directors who are disinterested, non-party directors or by independent legal counsel that the liability for which indemnification is sought did not arise out of the foregoing conduct.
Delaware law also provides that indemnification permitted under the law shall not be deemed exclusive of any other rights to which the directors
and officers may be entitled under the corporation’s bylaws, any agreement, a vote of stockholders or otherwise.
139
NMFC has obtained liability insurance for its officers and directors.
Delaware Law and Certain Certificate of Incorporation and Bylaw Provisions; Anti-Takeover Measures
Certain provisions of NMFC’s amended and restated certificate of incorporation and amended and restated bylaws, as summarized below, and
applicable provisions of the Delaware General Corporation Law and certain other agreements to which NMFC is a party may make it more difficult for or prevent an unsolicited third party from acquiring control of NMFC or changing its board of
directors and management. These provisions may have the effect of deterring hostile takeovers or delaying changes in NMFC’s control or in its management. These provisions are intended to enhance the likelihood of continued stability in the
composition of NMFC’s board of directors and in the policies furnished by them and to discourage certain types of transactions that may involve an actual or threatened change in NMFC’s control. The provisions also are intended to
discourage certain tactics that may be used in proxy fights. These provisions, however, could have the effect of discouraging others from making tender offers for NMFC’s shares and, as a consequence, they also may inhibit fluctuations in the
market price of NMFC’s shares that could result from actual or rumored takeover attempts.
Classified Board; Vacancies;
Removal. The classification of NMFC’s board of directors and the limitations on removal of directors and filling of vacancies could have the effect of making it more difficult for a third party to acquire NMFC, or
of discouraging a third party from acquiring NMFC. NMFC’s board of directors will be divided into three classes, with the term of one class expiring at each annual meeting of stockholders. At each annual meeting, one class of directors is
elected to a three-year term. This provision could delay for up to two years the replacement of a majority of the board of directors.
NMFC’s amended and restated certificate of incorporation provides that, subject to the applicable requirements of the 1940 Act and the rights
of any holders of preferred stock, any vacancy on the board of directors, however the vacancy occurs, including a vacancy due to an enlargement of the board, may only be filled by vote a majority of the directors then in office.
A director may be removed at any time at a meeting called for that purpose, but only for cause and only by the affirmative vote of the holders of
at least 75.0% of the shares then entitled to vote for the election of the respective director.
Advance Notice Requirements for
Stockholder Proposals and Director Nominations. NMFC’s amended and restated bylaws provide that with respect to an annual meeting of stockholders, nominations of persons for election to the board of directors and
the proposal of business to be considered by stockholders may be made only (1) by or at the direction of the board of directors or (2) by a stockholder who is entitled to vote at the meeting and who has complied with the advance notice
procedures of the amended and restated bylaws. Nominations of persons for election to the board of directors at a special meeting may be made only (1) by or at the direction of the board of directors or (2) provided that the board of
directors has determined that directors will be elected at the meeting, by a stockholder who is entitled to vote at the meeting and who has complied with the advance notice provisions of the amended and restated bylaws. The purpose of requiring
stockholders to give NMFC advance notice of nominations and other business is to afford NMFC’s board of directors a meaningful opportunity to consider the qualifications of the proposed nominees and the advisability of any other proposed
business and, to the extent deemed necessary or desirable by NMFC’s board of directors, to inform its stockholders and make recommendations about such qualifications or business, as well as to approve a more orderly procedure for conducting
meetings of stockholders. Although NMFC’s amended and restated bylaws do not give its board of directors any power to disapprove stockholder nominations for the election of directors or proposals recommending certain action, they
140
may have the effect of precluding a contest for the election of directors or the consideration of stockholder proposals if proper procedures are not followed and of discouraging or deterring a
third party from conducting a solicitation of proxies to elect its own slate of directors or to approve its own proposal without regard to whether consideration of such nominees or proposals might be harmful or beneficial to NMFC and its
stockholders.
Amendments to Certificate of Incorporation and Bylaws. Delaware’s corporation
law provides generally that the affirmative vote of a majority of the shares entitled to vote on any matter is required to amend a corporation’s certificate of incorporation or bylaws, unless a corporation’s certificate of incorporation or
bylaws requires a greater percentage. NMFC’s amended and restated certificate of incorporation will provide that the following provisions, among others, may be amended by its stockholders only by a vote of at least two-thirds of the shares of
NMFC’s capital stock entitled to vote:
| |
Ÿ |
|
the classification of its board of directors; |
| |
Ÿ |
|
the removal of directors; |
| |
Ÿ |
|
the limitation on stockholder action by written consent; |
| |
Ÿ |
|
the limitation of directors’ personal liability to NMFC or its stockholders for breach of fiduciary duty as a director; |
| |
Ÿ |
|
the ability to call a Special Meeting of Stockholders being vested in NMFC’s board of directors, the chairperson of its board, NMFC’s chief executive
officer and in the holders of at least fifty (50) percent of the voting power of all shares of capital stock of NMFC generally entitled to vote on the election of directors then outstanding subject to certain procedures; and
|
| |
Ÿ |
|
the amendment provision requiring that the above provisions be amended only with a two-thirds supermajority vote. |
The amended and restated bylaws generally can be amended by approval of (i) a majority of the total number of authorized directors or
(ii) the affirmative vote of the holders of at least two-thirds of the shares of NMFC’s capital stock entitled to vote.
Calling of Special Meetings by Stockholders. NMFC’s certificate of incorporation and bylaws also provide
that special meetings of the stockholders may only be called by NMFC’s board of directors, the chairperson of its board, NMFC’s chief executive officer or upon the request of the holders of at least 50.0% of the voting power of all shares
of capital stock of NMFC, generally entitled to vote on the election of directors then outstanding, subject to certain limitations.
Section 203 of the Delaware General Corporation Law. We will not be subject to Section 203 of the
DGCL, an anti-takeover law. In general, Section 203 prohibits a publicly-held Delaware corporation from engaging in a “business combination” with an “interested stockholder” for a period of three years following the date the
person became an interested stockholder, unless (with certain exceptions) the “business combination” or the transaction in which the person became an interested stockholder is approved in a prescribed manner. Generally, a “business
combination” includes a merger, asset or stock sale, or other transaction resulting in a financial benefit to the interested stockholder. Generally, an “interested stockholder” is a person who, together with affiliates and associates,
owns (or within three years prior to the determination of interested stockholder status, did own) 15.0% or more of a corporation’s voting stock. In our certificate of incorporation, we have elected not to be bound by Section 203.
The Credit Facilities also include change of control provisions that accelerate the indebtedness under the Credit Facilities in the
event of certain change of control events. If certain transactions were engaged in without the consent of the lender, repayment obligations under the Credit Facilities could be accelerated.
141
DESCRIPTION OF STRUCTURE-RELATED AGREEMENTS
In connection with the formation transactions consummated immediately prior to the IPO, NMFC and the Operating Company entered into
various agreements governing the relationship among NMFC, Guardian AIV, New Mountain Guardian Partners, L.P., AIV Holdings and the Operating Company.
These agreements are summarized below, which summaries are qualified in their entirety by reference to the full text of the agreements which were previously filed as exhibits to the registration statement relating
to the IPO.
For a description of the agreements governing the relationship between the Operating Company and the Investment Adviser and
the New Mountain Finance Entities’ relationship with the Administrator, see “Investment Management Agreement” and “Administration Agreement”.
The Operating Company Agreement
Guardian AIV and New Mountain Guardian Partners, L.P.
previously entered into the Amended and Restated Limited Liability Company Agreement of the Operating Company (the “LLC Agreement”). Limited liability company interests in the Operating Company may, to the extent permissible under the 1940
Act, be represented by one or more classes of units.
In connection with the contribution by Guardian AIV of its units to AIV Holdings
prior to the IPO, AIV Holdings entered into a joinder agreement with respect to the LLC Agreement, pursuant to which AIV Holdings was admitted as a member of the Operating Company. In addition, in connection with the contribution by New Mountain
Guardian Partners, L.P. of its units to NMFC, NMFC entered into a joinder agreement with respect to the LLC Agreement, pursuant to which NMFC was admitted as a member of the Operating Company.
NMFC and the Operating Company Businesses. NMFC has no direct operations, and its only business and sole asset
is its ownership of units of the Operating Company. Under the LLC Agreement, NMFC is not permitted to conduct any business or ventures other than in connection with:
| |
Ÿ |
|
the acquisition, ownership or disposition of its units of the Operating Company; and |
| |
Ÿ |
|
its operation as a public reporting company. |
Under the LLC Agreement, the Operating Company may conduct any business that may be lawfully conducted by a limited liability company under the Delaware Limited Liability Company Act, except that the LLC
Agreement requires that the Operating Company conduct its operations in such a manner that will (1) permit NMFC to satisfy the requirements for qualification as a BDC, (2) permit NMFC to satisfy the requirements for qualification as a RIC
for federal income tax purposes and (3) ensure that the Operating Company will not be classified as a “publicly traded partnership” for purposes of Section 7704 of the Code except to the extent determined by the board of
directors of the Operating Company.
Board of Directors. The Operating Company is managed by a
board of directors. Subject to the Investment Company Act, director nominees will be elected if the votes cast by the Operating Company’s members for such nominee’s election exceed the votes cast against such nominee’s election,
unless such nominee has also been nominated for election to the board of directors of NMFC, in which case such nominee will be elected by a plurality of the Operating Company’s members. The Operating Company’s current board of directors is
comprised of the same individuals as the board of
142
directors of NMFC. Under the LLC Agreement, the Operating Company is required to endeavor to nominate the same slate of director nominees for election by its members as NMFC. However, there
can be no assurance that the Operating Company’s board composition and NMFC’s board composition will remain the same. The Operating Company’s board of directors is divided into three classes, with the term of one class expiring at
each annual meeting of the members of the Operating Company. At each annual meeting, one class of directors is elected to a three-year term. This provision could delay for up to two years the replacement of a majority of the board of directors.
Management. Subject to the overall supervision of the Operating Company’s board of directors,
the Investment Adviser manages the Operating Company’s day-to-day operations and provides the Operating Company with investment management services pursuant to the Investment Management Agreement. The Operating Company pays a management fee and
incentive fee to the Investment Adviser for its services.
Tax Matters. NMFC is the Operating
Company’s tax matters member and, as such, has the authority to handle any tax audits of the Operating Company. Under the LLC Agreement, NMFC is generally be prohibited from taking any action in its capacity as tax matters member, which it
knows (or would reasonably be expected to know) would (or would reasonably be expected to) have a significant adverse effect on AIV Holdings, Guardian AIV or Guardian AIV’s partners. AIV Holdings also has a consent right over NMFC’s
actions as the Operating Company’s tax matters member if such action would have a significant adverse effect on AIV Holdings, Guardian AIV or Guardian AIV’s partners.
The Operating Company intends to make an election under Section 754 of the Code and to cause such election to remain in effect for every year
of the Operating Company during which the Operating Company is treated as a partnership for federal income tax purposes. The board of directors of the Operating Company has the authority to cause the Operating Company to make all other tax
elections, and all decisions and positions taken with respect to the Operating Company’s taxable income or tax loss (or items thereof) under the Code or other applicable tax law will be made in such manner as may be reasonably determined by the
Operating Company’s board of directors. Under the LLC Agreement, the Operating Company’s board of directors is generally prohibited from making tax elections or making any decision or taking any position with respect to allocations of
taxable income that the Operating Company’s board of directors knows (or would reasonably be expected to know) would (or would reasonably be expected to) adversely affect NMFC’s status as a RIC or have a significant adverse effect on AIV
Holdings, Guardian AIV or Guardian AIV’s partners and a greater negative impact proportionally on the amount of taxable inclusions incurred by AIV Holdings with respect to income allocated to it by the Operating Company than if such election,
decision or position had not been made or taken.
Exchange Right. The LLC Agreement provides for an
exchange right for any member other than NMFC, whereby, upon appropriate notice, any such member will have the right to exchange all or any portion of its units for shares of NMFC’s common stock on a one-for-one basis. This right can be
conditionally exercised by any such member, or its transferees, meaning that prior to the receipt of shares of NMFC’s common stock upon exchange, a member can withdraw its request to have its units exchanged for shares of NMFC’s common
stock.
The LLC Agreement also provides that, in connection with the occurrence of an event that would result in the dissolution of the
Operating Company where prior to or concurrent with the occurrence of such event, NMFC has adopted a plan relating to the liquidation or dissolution of NMFC, NMFC will have the right to acquire all (but not less than all) of the outstanding units of
any other member in exchange for shares of NMFC’s common stock on a one-for-one basis.
Distributions and Allocations of
Profits and Losses. The LLC Agreement provides that distributions of cash from the Operating Company will be determined by the Operating Company’s
143
board of directors and will be made pro rata among the members holding units in accordance with their respective percentage interests in the Operating Company. The Operating Company intends to
make distributions to the Operating Company’s members that will be sufficient to enable NMFC to pay quarterly distributions to its stockholders and to obtain and maintain its status as a RIC.
Similarly, the LLC Agreement provides that, for tax purposes, subject to compliance with the provisions of Section 704(b) and 704(c) of
the Code and the corresponding Treasury regulations, the Operating Company will allocate items of income, gain, loss, deduction and credit to its members, including NMFC, pro rata in accordance with their respective percentage interests in the
Operating Company. NMFC’s allocable share of the Operating Company’s losses cannot be passed through to its stockholders but will be taken into account in determining NMFC’s taxable income that is required to be distributed to its
stockholders by reason of NMFC’s status as a RIC.
If the Operating Company liquidates, debts and other obligations must be
satisfied before the members may receive any distributions. Any distributions to members then will be made to members in accordance with their respective positive capital account balances.
Capital Contributions. NMFC contributed to the Operating Company the gross proceeds of the IPO and the
Concurrent Private Placement as a capital contribution in exchange for 10,697,691 units. NMFC currently owns approximately 34.6% of the units of the Operating Company and AIV Holdings owns approximately 65.4% of the units of the Operating Company.
Under the LLC Agreement, NMFC is also required to contribute the gross proceeds of any subsequent offering of its common stock by
NMFC as additional capital to the Operating Company in exchange for, on a one-to-one basis, additional units of the Operating Company. See “—One-to-One Ratio” below. If NMFC contributes additional capital to the Operating Company, it
will receive additional units of the Operating Company and its percentage interest in the Operating Company will be increased on a proportionate basis based upon the amount of such additional capital contributions. Conversely, the percentage
interests of other members will be decreased on a proportionate basis in the event of additional capital contributions by NMFC. In addition, if NMFC contributes additional capital to the Operating Company, the Operating Company can revalue its
property to its fair market value (as determined by its board of directors) and the capital accounts of the members will be adjusted to reflect the manner in which the unrealized gain or loss inherent in such property (that has not been reflected in
the capital accounts previously) would be allocated among the members under the terms of the LLC Agreement if there were a taxable disposition of such property for its fair market value (as determined by its board of directors) on the date of
revaluation. Under the LLC Agreement, NMFC is also required to contribute to the Operating Company any reinvested distributions received by it pursuant to its dividend reinvestment plan. In addition, if NMFC uses newly issued shares to
implement the plan, it will receive, on a one-for-one basis, additional units of the Operating Company in exchange for such reinvested distributions.
One-to-One Ratio. The LLC Agreement contains various provisions requiring that NMFC and the Operating Company take certain actions in order to maintain, at all times, a
one-to-one ratio between the number of units held by NMFC and the number of shares of NMFC’s common stock outstanding. This one-to-one ratio must also be maintained in the event that NMFC issues additional shares of its common stock.
Accordingly, every time NMFC issues shares of its common stock, other than in connection with the exercise of the exchange right described above by AIV Holdings, the Investment Adviser, if applicable with respect to any units received as payment of
the incentive fee, or any other entity or individual that may become a member (other than NMFC), the Operating Company will be required to issue additional units to NMFC. In addition, in order for NMFC to pay a dividend or other distribution to
holders of its common stock, it must be accompanied by a prior distribution by the Operating Company to all of its members.
144
If NMFC redeems, repurchases, acquires, exchanges, cancels or terminates any shares of its common
stock, this action must be accompanied by an immediately prior identical (including with respect to the appropriate consideration paid for such action) redemption, repurchase, acquisition, exchange, cancellation or termination of the units of the
Operating Company held by NMFC. If NMFC splits its common stock, this action must be accompanied by an immediately prior identical split of units of the Operating Company. In addition, in general, upon any consolidation or merger or combination to
which NMFC is a party or any sale or disposition of all or substantially all of its assets to a third party, NMFC is required to take all necessary action so that the units held by AIV Holdings, the Investment Adviser, if applicable with respect to
any units received as payment of the incentive fee, and any other entity or individual that may become a member (other than NMFC) will be exchangeable on a per-unit basis at any time or from time to time following such event into the kind and amount
of shares of stock and/or other securities or property (including cash) receivable upon such event by holders of NMFC’s common stock.
The LLC Agreement also provides that, in connection with any reclassification or recapitalization or any other distribution or dilutive or concentrative event by NMFC, if AIV Holdings, the Investment Adviser,
if applicable with respect to any units received as payment of the incentive fee or any other entity or individual that may become a member (other than NMFC) exercises the exchange right following such event, such member will generally be treated as
if they were entitled to receive the number of shares of NMFC’s common stock or other property (including cash) that it would have been entitled to receive had it exercised its exchange right immediately prior to the record date of such event.
In addition, the LLC Agreement provides that NMFC and the Operating Company must take all necessary action in order to maintain the one-to-one ratio if in the future NMFC determines to issue options or other types of equity compensation to
individuals that provide services to the Operating Company.
Voting. Subject to the Investment
Company Act, directors will be elected as set forth above under “—Board of Directors.” All other matters submitted to the vote of the members will be decided by a majority vote unless a different vote is required as a matter of law
(including the Investment Company Act), in which case such provision will govern and control the voting. The LLC Agreement will also provide that, to the extent required by the Investment Company Act, each of NMFC and AIV Holdings and any other
member that may be an investment company relying on the Investment Company Act will seek instructions from its stockholders with regard to matters subject to a member vote, and each such member will vote on all such matters in accordance with such
instructions. Accordingly, to the extent required by the Investment Company Act, NMFC and AIV Holdings will not have any separate voting power other than to pass through the votes of the respective stockholders of NMFC and AIV Holdings in accordance
with their respective indirect percentage ownership in the Operating Company.
Expenses. All of the
Operating Company’s expenses and all of NMFC’s expenses, including any amounts owed pursuant to the Administration Agreement, will be borne by the Operating Company.
Dissolution. The LLC Agreement provides that the Operating Company may be dissolved with the approval of the board of directors. In addition to a voluntary dissolution, the
Operating Company will be dissolved upon the entry of a decree of judicial dissolution in accordance with Delaware law or upon the termination of the legal existence of the last remaining member of the Operating Company. Upon a dissolution event,
the proceeds of liquidation will be distributed in the following order:
| |
Ÿ |
|
first, to pay the expenses of winding up, liquidating and dissolving the Operating Company and all of its creditors, including members who are creditors; and
|
| |
Ÿ |
|
second, to the members pro rata in accordance with their respective positive capital account balances. |
145
Upon a dissolution event, if (i) NMFC is not the sole member at such time and (ii) prior to
or concurrent with such event, NMFC has adopted a plan relating to the liquidation or dissolution of NMFC, then NMFC has the right to acquire from any other Operating Company member all (but not less than all) of the units held by such other member
in exchange for shares of NMFC common stock on a one-for-one basis.
Information. The LLC
Agreement provides that the Operating Company’s members will be entitled to certain information regarding the Operating Company. This information includes quarterly and annual information regarding the Operating Company, information required
for certain tax matters and any other information required under Delaware law or as reasonably requested by a member.
Confidentiality. Each member has agreed to maintain the confidentiality of any information received by the
member or its affiliates and representatives in connection with the transactions contemplated by the LLC Agreement which is determined to be confidential for a period of three years following the earlier of the date of the Operating
Company’s dissolution or the date such member ceases to be a member, with customary exceptions, including to the extent disclosure is required by law or judicial process.
Restrictions on Transfer. The LLC Agreement provides that, subject to certain limited exceptions (including transfers to affiliates), a member may not transfer any of its
units of the Operating Company to any person without the consent of the Operating Company’s board of directors, which consent may be given or withheld in their sole and absolute discretion. No member shall have the right to substitute a
transferee as a member in its place. A transferee of units of the Operating Company may be admitted as a substituted member only with the consent of the Operating Company’s board of directors, which consent may be given or withheld in their
sole and absolute discretion.
Amendment. Unless otherwise required by law, the LLC Agreement
may be amended only by the written consent of the members owning a majority of the Operating Company’s units then outstanding; provided, however, that no amendment may be made without the consent of a member if the amendment would adversely
affect the rights of the member other than on a pro rata basis with other members of units.
Limitation of Liability;
Indemnification. The LLC Agreement provides that none of the Operating Company’s members or directors or their respective subsidiaries or affiliates may be liable to the Operating Company or any member for
any act or omission by such individual or entity in connection with the conduct of affairs of the Operating Company or otherwise incurred in connection with the Operating Company or the LLC Agreement or the matters contemplated therein, in each
case unless such act or omission was the result of gross negligence or willful misconduct or constitutes a breach of, or a failure to comply with the LLC Agreement. The LLC Agreement further provides for indemnification of the Operating
Company’s directors and officers from and against liabilities arising out of or relating to any alleged action taken by any director or officer of the Operating Company, subject to the Investment Company Act.
Term. The Operating Company shall continue until terminated as provided in the LLC Agreement or by
operation of law.
Fiduciary Duties. Circumstances may arise in the future when the interests of
the Operating Company’s members conflict with the interests of NMFC’s stockholders. Following the completion of this offering, the Operating Company’s board of directors and the board of directors of NMFC will be comprised of the same
members. However, the Operating Company’s board of directors will owe fiduciary duties to the Operating Company’s members that could conflict with the fiduciary duties NMFC’s board of directors owes to NMFC’s stockholders.
146
Registration Rights Agreement
In connection with the IPO, NMFC entered into a registration rights agreement (the “Registration Rights Agreement”) with AIV Holdings, Steven B. Klinsky, an entity related to Steven B. Klinsky and the
Investment Adviser. Subject to several exceptions, AIV Holdings and the Investment Adviser have the right to require NMFC to register for public resale under the Securities Act all registerable securities that are held by any of them and that they
request to be registered at any time. Registerable securities subject to the Registration Rights Agreement are shares of NMFC’s common stock issued or issuable in exchange for units and any other shares of NMFC’s common stock held by AIV
Holdings, the Investment Adviser and any of their transferees. The rights under the Registration Rights Agreement can be conditionally exercised by AIV Holdings or the Investment Adviser, meaning that prior to the registration of the shares AIV
Holdings or the Investment Adviser can withdraw their request to have the shares registered. AIV Holdings and the Investment Adviser may each assign their rights to any person that acquires registerable securities subject to the Registration Rights
Agreement and who agrees to be bound by the terms of the Registration Rights Agreement. Steven B. Klinsky and a related entity will have the right to “piggyback”, or include their own registrable securities in such a registration. AIV
Holdings, Steven B. Klinsky, and an entity related to Steven B. Klinsky have exercised their rights under the Registration Rights Agreement and their respective shares of NMFC’s common stock are being offered for resale in this
prospectus. See “Selling Stockholders” in this prospectus.
AIV Holdings and the Investment Adviser may require NMFC to use
its reasonable best efforts to register under the Securities Act all or any portion of these registerable securities upon a “demand request”. The demand registration rights are subject to certain limitations. NMFC is not obligated to:
| |
Ÿ |
|
cause a registration statement with respect to a demand request to be declared effective within forty-five (45) days after the effective date of a previous
demand registration, other than a shelf registration pursuant to Rule 415 under the Securities Act; |
| |
Ÿ |
|
cause a registration statement with respect to a demand request to be declared effective unless the demand request is for a number of shares with a market value
that is equal to at least $10.0 million; or |
| |
Ÿ |
|
cause to be declared effective more than five registration statements with respect to demand registration rights. |
The Registration Rights Agreement includes limited blackout and suspension periods. In addition, AIV Holdings and the Investment Adviser may also
require NMFC to file a shelf registration statement on Form N-2 for the resale of their registerable securities if NMFC is eligible to use Form N-2 at that time.
Holders of registerable securities also have “piggyback” registration rights, which means that these holders may include their respective
shares in any future registrations of NMFC’s equity securities, whether or not that registration relates to a primary offering by NMFC or a secondary offering by or on behalf of any of NMFC’s stockholders. AIV Holdings, the Investment
Adviser and Steven B. Klinsky (and a related entity) have priority over NMFC in any registration that is an underwritten offering.
Conflicts arising under the Registration Rights Agreement will be resolved as set forth therein. Under the Registration Rights Agreement, AIV
Holdings and, if applicable, the Investment Adviser, and Steven B. Klinsky (and a related entity) have priority over NMFC or any other NMFC stockholder when selling any shares of NMFC common stock pursuant to their exercise of registration rights
under that agreement.
AIV Holdings, the Investment Adviser and Steven B. Klinsky (and a related entity) will be responsible for the
expenses of any demand registration (including underwriters’ discounts or
147
commissions) and their pro rata share of any piggyback registration. NMFC has agreed to indemnify AIV Holdings, the Investment Adviser and Steven B. Klinsky (and a related entity) with respect to
liabilities resulting from untrue statements or omissions in any registration statement filed pursuant to the Registration Rights Agreement, other than untrue statements or omissions resulting from information furnished to us by such parties. AIV
Holdings, the Investment Adviser and Steven B. Klinsky (and a related entity) have also agreed to indemnify NMFC with respect to liabilities resulting from untrue statements or omissions furnished by them to NMFC relating to them in any registration
statement.
148
SHARES ELIGIBLE FOR FUTURE SALE
Sales of substantial amounts of NMFC’s unregistered common stock in the public market, including by AIV Holdings, if it
exercises its right to exchange all or any portion of its units of the Operating Company for shares of NMFC’s common stock on a one-for-one basis, or New Mountain Guardian Partners, L.P., or its transferees, or the perception that such
sales could occur, could adversely affect the prevailing market price of NMFC’s common stock and NMFC’s future ability to raise capital through the sale of its equity securities.
Restricted securities may be sold in the public market only if registered or if they qualify for an exemption from registration under Rule 144
under the Securities Act. Any shares of NMFC’s common stock to be received by New Mountain Guardian Partners, L.P. or its transferees or issued in exchange for units of the Operating Company held by AIV Holdings or the Investment Adviser,
if applicable with respect to any units received as payment of the incentive fee, would be eligible for public sale if registered under the Securities Act or sold in accordance with Rule 144 of the Securities Act. NMFC has granted AIV Holdings,
Steven B. Klinsky, an entity related to Mr. Klinsky, the Investment Adviser and their permitted transferees the registration rights described below.
Rule 144
In general, a person who has beneficially owned restricted shares of
NMFC’s common stock for at least six months would be entitled to sell their securities provided that (i) such person is not deemed to have been one of NMFC’s affiliates at the time of, or at any time during the 90 days preceding,
a sale and (ii) NMFC is subject to the Exchange Act periodic reporting requirements for at least 90 days before the sale. Persons who have beneficially owned restricted shares or NMFC’s common stock for at least six months but who are
NMFC’s affiliates at the time of, or any time during the 90 days preceding, a sale, would be subject to additional restrictions, by which such person would be entitled to sell within any three-month period only a number of securities that
does not exceed the greater of either of the following:
| |
Ÿ |
|
1.0% of the number of shares of NMFC’s common stock then outstanding; or |
| |
Ÿ |
|
the average weekly trading volume of NMFC’s common stock on the NYSE for the four calendar weeks prior to the sale, |
provided, in each case, that NMFC is subject to the Exchange Act periodic reporting requirements for at least 90 days before the sale. Such sales must also
comply with the manner of sale, current public information and notice provisions of Rule 144.
Registration Rights
AIV Holdings has the right to exchange all or any portion of its units of the Operating Company for shares of NMFC’s common
stock, on a one-for-one basis. Pursuant to the Registration Rights Agreement entered into in connection with NMFC’s IPO, AIV Holdings and the Investment Adviser have the right, subject to various conditions and limitations, to demand the filing
of, and include any registerable securities held by AIV Holdings in, registration statements relating to NMFC’s common stock. Furthermore, Steven B. Klinsky and a related entity have the right to “piggyback”, or include their own
registrable securities in a demand registration. These registration rights could impair the prevailing market price and impair NMFC’s ability to raise capital by depressing the price at which it could sell its common stock. AIV Holdings,
Steven B. Klinsky, and an entity related to Steven B. Klinsky have exercised their rights under the Registration Rights Agreement and their respective shares of NMFC’s common stock are being offered for resale in this prospectus. See
“Selling Stockholders” in this prospectus.
149
MATERIAL FEDERAL INCOME TAX CONSIDERATIONS
The following discussion is a general summary of the material federal income tax considerations applicable to NMFC and an
investment in shares of NMFC’s common stock. The discussion is based upon the Internal Revenue Code of 1986, as amended, which we refer to as the “Code”, the regulations of the U.S. Department of Treasury promulgated thereunder, which
we refer to as the “Treasury regulations”, the legislative history of the Code, current administrative interpretations and practices of the Internal Revenue Service, which we refer to as the “IRS”, (including administrative
interpretations and practices of the IRS expressed in private letter rulings which are binding on the IRS only with respect to the particular taxpayers that requested and received those rulings) and judicial decisions, each as of the date of this
prospectus and all of which are subject to change or differing interpretations, possibly retroactively, which could affect the continuing validity of this discussion. The U.S federal income tax laws addressed in this summary are highly technical and
complex, and certain aspects of their application to the Operating Company and NMFC are not completely clear. In addition, certain U.S. federal income tax consequences described in this summary depend upon certain factual matters, including (without
limitation) the value and tax basis ascribed to the Operating Company’s assets and the manner in which the Operating Company and NMFC operate, and certain complicated tax accounting calculations. NMFC and the Operating Company have not sought,
and will not seek, any ruling from the IRS regarding any matter discussed in this summary, and this summary is not binding on the IRS. Accordingly, there can be no assurance that the IRS will not assert, and a court will not sustain, a position
contrary to any of the tax consequences discussed below. This summary does not purport to be a complete description of all the tax aspects affecting NMFC, the Operating Company and/or NMFC stockholders. For example, this summary does not describe
all federal income tax consequences that may be relevant to certain types of stockholders subject to special treatment under federal income tax laws, including stockholders subject to the alternative minimum tax, tax-exempt organizations, insurance
companies, partnerships or other pass-through entities and their owners, persons that hold shares of NMFC’s common stock through a foreign financial institution, persons that hold shares of NMFC’s common stock through a non-financial
foreign entity, Non-U.S. stockholders (as defined below) engaged in a trade or business in the United States or Non-U.S. stockholders entitled to claim the benefits of an applicable income tax treaty, persons who have ceased to be U.S. citizens or
to be taxed as resident aliens, persons holding NMFC’s common stock in connection with a hedging, straddle, conversion or other integrated transaction, dealers in securities, a trader in securities that elects to use a market-to-market method
of accounting for its securities holdings, pension plans and trusts, and financial institutions. This summary assumes that stockholders hold NMFC’s common stock as capital assets for federal income tax purposes (generally, assets held for
investment) and that all of the parties to the LLC Agreement comply with all of their respective representations, covenants and agreements contained in the LLC Agreement in accordance with their terms. This summary generally does not
discuss any aspects of U.S. estate or gift tax or foreign, state or local tax. It does not discuss the special treatment under federal income tax laws that could result if the Operating Company invested in tax-exempt securities or certain other
investment assets.
A “U.S. stockholder” generally is a beneficial owner of shares of NMFC’s common stock that is, for
federal income tax purposes:
| |
Ÿ |
|
A citizen or individual resident of the United States; |
| |
Ÿ |
|
A corporation, or other entity treated as a corporation for federal income tax purposes, created or organized in or under the laws of the United States or any
state thereof, including, for this purpose, the District of Columbia; |
| |
Ÿ |
|
A trust if (i) a court within the United States is able to exercise primary supervision over the administration of the trust and one or more United States
persons have the authority to control all substantive decisions of the trust, or (ii) the trust has in effect a valid election to be treated as a domestic trust for federal income tax purposes; or |
150
| |
Ÿ |
|
An estate, the income of which is subject to federal income taxation regardless of its source. |
A “Non-U.S. stockholder” generally is a beneficial owner of shares of NMFC’s common stock that is not a U.S. stockholder or a
partnership (or an entity or arrangement treated as a partnership) for federal income tax purposes.
If a partnership, or other entity
or arrangement treated as a partnership for federal income tax purposes, holds shares of NMFC’s common stock, the federal income tax treatment of the partnership and each partner generally will depend on the status of the partner, the
activities of the partnership and certain determinations made at the partner level. A stockholder that is a partnership holding shares of NMFC’s common stock, and each partner in such a partnership, should consult his, her or its own tax
adviser with respect to the tax consequences of the purchase, ownership and disposition of shares of NMFC’s common stock.
Tax
matters are very complicated and the tax consequences to each stockholder of an investment in shares of NMFC’s common stock will depend on the facts of his, her or its particular situation. You should consult your own tax adviser regarding the
specific consequences of such an investment, including tax reporting requirements, the applicability of federal, state, local and foreign tax laws, eligibility for the benefits of any applicable income tax treaty and the effect of any possible
changes in the tax laws.
NMFC’s Election to be Taxed as a RIC
NMFC intends to elect to be treated, and intends to comply with the requirements to qualify annually, as a RIC under Subchapter M of the Code,
commencing with its taxable year ending on December 31, 2011. As a RIC, NMFC generally will not pay corporate-level federal income taxes on any income that NMFC timely distributes to its stockholders as dividends. Rather, dividends distributed by
NMFC generally will be taxable to NMFC’s stockholders, and any net operating losses, foreign tax credits and other tax attributes of NMFC generally will not pass through to NMFC’s stockholders, subject to special rules for certain items
such as net capital gains and qualified dividend income recognized by NMFC. See “—Taxation of U.S. Stockholders” and “—Taxation of Non-U.S. Stockholders” below.
To qualify as a RIC, NMFC must, among other things, meet certain source-of-income and asset diversification requirements (as described below). In
addition, to qualify as a RIC, NMFC must distribute to its stockholders, for each taxable year, at least 90.0% of its “investment company taxable income”, which is generally its net ordinary income plus the excess of realized net
short-term capital gains over realized net long-term capital losses (the “Annual Distribution Requirement”).
Taxation of
NMFC as a RIC
If NMFC:
| |
Ÿ |
|
qualifies as a RIC; and |
| |
Ÿ |
|
satisfies the Annual Distribution Requirement, |
then NMFC will not be subject to federal income tax on the portion of its income that it timely distributes (or is deemed to timely distribute) to its stockholders.
If NMFC fails to qualify as a RIC, it will be subject to federal income tax at the regular corporate rates on its income and capital gains.
NMFC will be subject to a 4.0% nondeductible federal excise tax on certain undistributed income unless NMFC distributes in a timely manner an amount at least equal to the sum of (1) 98.0% of its net
151
ordinary income for each calendar year, (2) 98.2% of its capital gain net income for the one-year period ending October 31 in that calendar year and (3) any income recognized, but
not distributed and on which NMFC did not pay corporate-level income tax, in preceding years (the “Excise Tax Avoidance Requirement”). While NMFC intends to make distributions to its stockholders in each taxable year that will be
sufficient to avoid any federal excise tax on its earnings, there can be no assurance that NMFC will be successful in entirely avoiding this tax.
In order to qualify as a RIC for federal income tax purposes, NMFC must, among other things:
| |
Ÿ |
|
continue to qualify as a BDC under the 1940 Act at all times during each taxable year; |
| |
Ÿ |
|
derive in each taxable year at least 90.0% of its gross income from dividends, interest, payments with respect to loans of certain securities, gains from the
sale of stock or other securities, net income from certain “qualified publicly traded partnerships”, or other income derived with respect to NMFC’s business of investing in such stock or securities (the “90.0% Income Test”);
and |
| |
Ÿ |
|
diversify its holdings so that at the end of each quarter of the taxable year: |
| |
• |
|
at least 50.0% of the value of NMFC’s assets consists of cash, cash equivalents, U.S. government securities, securities of other RICs, and other securities
if such other securities of any one issuer do not represent more than 5.0% of the value of NMFC’s assets or more than 10.0% of the outstanding voting securities of the issuer; and |
| |
• |
|
no more than 25.0% of the value of NMFC’s assets is invested in the securities, other than U.S. government securities or securities of other RICs, of one
issuer, of two or more issuers that are controlled, as determined under applicable Code rules, by NMFC and that are engaged in the same or similar or related trades or businesses or of certain “qualified publicly traded partnerships” (the
“Diversification Tests”). |
As discussed above in “Formation Transactions and Related
Agreements—Holding Company Structure”, NMFC’s sole asset is its direct ownership of common membership units in the Operating Company, and NMFC’s only source of cash flow from operations is distributions from the Operating
Company. As discussed below, the Operating Company expects to be treated for federal income tax purposes as a partnership in each taxable year (or portion thereof) during which the Operating Company has at least two members.
For federal income tax purposes, NMFC will take into account in each taxable year (or portion thereof) during which the Operating Company is
treated as a partnership for such purposes, NMFC’s allocable share of the Operating Company’s items of income, gain, loss, deduction and credit, subject to the discussion in “—Investment in the Operating Company” below. If
NMFC becomes the Operating Company’s sole member, the Operating Company will be treated as a disregarded entity for federal income tax purposes, and NMFC will take into account all of the Operating Company’s assets and items of income,
gain, loss, deduction and credit for such purposes.
NMF SLF expects to be treated as a disregarded entity for federal income tax
purposes. As a result, NMF SLF will itself not be subject to federal income tax and, for federal income tax purposes, the Operating Company will take into account all of NMF SLF’s assets and items of income, gain, loss, deduction and credit. In
the remainder of this discussion, except as otherwise indicated, references to the Operating Company include NMF SLF.
The Code mandates
a partnership look-through rule in applying the 90.0% Income Test to a RIC that holds an interest in a partnership. Therefore, NMFC’s allocable share of the Operating Company’s income will be treated as qualifying income for purposes of
the 90.0% Income Test to the extent that such income would be qualifying income if realized directly by NMFC in the same manner as such income was realized by the Operating Company.
152
You should be aware that the Code and applicable Treasury regulations do not contain an explicit
partnership look-through rule for purposes of the Diversification Tests. However, analogous provisions in the tax law, general principles of partnership taxation and the purpose and intention of the tax laws governing RICs support partnership
look-through treatment for this purpose. In addition, in Revenue Procedure 2001-57 (the “Revenue Procedure”), the IRS provided a safe harbor for a typical “master-feeder” structure pursuant to which a RIC that invests in an
investment partnership (similar to the Operating Company) will be treated for purposes of the Diversification Tests as if the RIC directly invested in the assets held by such partnership, determined in accordance with the RIC’s percentage
ownership of the capital interests in such partnership, if the RIC meets certain requirements. Most importantly, the Revenue Procedure requires that, except as required by Section 1.704-3 of the Treasury regulations, the RIC’s allocable
share of each item of the partnership’s income, gain, loss, deduction, and credit is proportionate to the RIC’s percentage ownership of the capital interests in the partnership (the “Proportionate Allocation Requirement”).
Although NMFC will not satisfy all of the requirements of the Revenue Procedure, NMFC will satisfy the Proportionate Allocation Requirement, which appears to be the main substantive requirement of the Revenue Procedure. The Revenue Procedure
reflects the administrative interpretations of the IRS in rulings that have been issued to other taxpayers and the IRS’s administrative practice in other revenue procedures. However, such administrative interpretations and practice do not
constitute official precedent that is binding on a court or the IRS. Accordingly, although there is no authority directly applicable to NMFC and thus the matter is not free from doubt, it is expected that NMFC will be treated as if it directly
invested in its pro rata share of the assets held by the Operating Company for purposes of the Diversification Tests. Nevertheless, there can be no assurance that the IRS will not successfully assert that NMFC does not meet the Diversification Tests
because it is unable to look through to the Operating Company’s assets for purposes of the Diversification Tests. In that case, NMFC would fail to qualify as a RIC and thus become subject to corporate-level federal income tax (and any
applicable state and local taxes).
Subject to the foregoing, it is intended (1) that the Operating Company will be operated in a
manner that enables NMFC to satisfy the 90.0% Income Test and the Diversification Tests on a look-through basis, and (2) that the distributions made by the Operating Company to its members will be sufficient to enable NMFC to satisfy the Annual
Distribution Requirement and Excise Tax Avoidance Requirement, thereby enabling NMFC to qualify and maintain its status as a RIC and avoid the 4.0% federal excise tax on its earnings. However, no assurance can be given in this regard.
For federal income tax purposes, NMFC will include in its taxable income its allocable share of certain amounts that the Operating Company has not
yet received in cash. For example, if the Operating Company holds debt obligations that are treated under applicable tax rules as having original issue discount (such as debt instruments with PIK interest or, in certain cases, increasing interest
rates or issued with warrants), NMFC must include in its taxable income in each year its allocable share of the portion of the original issue discount that accrues over the life of the obligation, regardless of whether cash representing such income
is received by the Operating Company in the same taxable year. NMFC may also have to include in its taxable income its allocable share of other amounts that the Operating Company has not yet received in cash, such as accruals on a contingent payment
debt instrument or deferred loan origination fees that are paid after origination of the loan or are paid in non-cash compensation such as warrants or stock. Because NMFC’s allocable share of such original issue discount or other amounts
accrued will be included in NMFC’s investment company taxable income for the year of accrual and before the Operating Company receives any corresponding cash payments, NMFC may be required to make a distribution to its stockholders in order to
satisfy the Annual Distribution Requirement, even though NMFC will not have received any corresponding distribution from the Operating Company.
Accordingly, to enable the Operating Company to make distributions to its members that will be sufficient to enable NMFC to satisfy the Annual Distribution Requirement, the Operating Company may
153
need to sell some of the Operating Company’s assets at times and/or at prices that the Operating Company would not consider advantageous, NMFC or the Operating Company may need to raise
additional equity or debt capital or the Operating Company may need to forego new investment opportunities or otherwise take actions that are disadvantageous to the Operating Company’s business (or be unable to take actions that are
advantageous to the Operating Company’s business). If the Operating Company or NMFC is unable to obtain cash from other sources to enable NMFC to satisfy the Annual Distribution Requirement, NMFC may fail to qualify for the federal income tax
benefits allowable to RICs and, thus, become subject to a corporate-level federal income tax (and any applicable state and local taxes).
Because the Operating Company intends to use debt financing, the Operating Company may be prevented by financial covenants contained in the
Holdings Credit Facility, the SLF Credit Facility and other debt financing agreements from making distributions to the Operating Company’s members in certain circumstances. In addition, under the 1940 Act, the Operating Company is generally not
permitted to make distributions to the Operating Company’s members while the Operating Company’s debt obligations and other senior securities are outstanding unless certain “asset coverage” tests are met. See
“Regulation—Senior Securities”. Limits on the Operating Company’s distributions to its members may prevent NMFC from satisfying the Annual Distribution Requirement and, therefore, may jeopardize NMFC’s qualification for
taxation as a RIC, or subject NMFC to the 4.0% federal excise tax.
Although the Operating Company does not presently expect to do so,
the Operating Company may borrow funds and sell assets in order to make distributions to its members that are sufficient for NMFC to satisfy the Annual Distribution Requirement. However, the Operating Company’s ability to dispose of assets may
be limited by (1) the illiquid nature of the Operating Company’s portfolio and/or (2) other requirements relating to NMFC’s status as a RIC, including the Diversification Tests. If the Operating Company disposes of assets in
order for NMFC to meet the Annual Distribution Requirement or the Excise Tax Avoidance Requirement, the Operating Company may make such dispositions at times that, from an investment standpoint, are not advantageous.
A RIC is limited in its ability to deduct expenses in excess of its “investment company taxable income” (which is, generally, ordinary
income plus the excess of realized net short-term capital gains over realized net long-term capital losses). If NMFC’s expenses in a given year exceed NMFC’s investment company taxable income, NMFC would experience a net operating loss for
that year. However, a RIC is not permitted to carry forward net operating losses to subsequent years and such net operating losses do not pass through to its stockholders. In addition, expenses can be used only to offset investment company taxable
income, not net capital gain. A RIC may not use any net capital losses (that is, realized capital losses in excess of realized capital gains) to offset the RIC’s investment company taxable income, but may carry forward such losses, and use them
to offset capital gains, indefinitely. Due to these limits on the deductibility of expenses and net capital losses, NMFC may for tax purposes have aggregate taxable income for several years that NMFC is required to distribute and that is taxable to
its stockholders even if such income is greater than the aggregate net income NMFC actually earned during those years. Because NMFC will be a holding company, NMFC will only be able to make such required distributions on its common stock from
distributions received from the Operating Company. Such distributions to NMFC may be made from the Operating Company’s cash assets or by liquidation of the Operating Company’s investments, if necessary. The Operating Company may recognize
gains or losses from such liquidations. In the event the Operating Company recognizes net capital gains from such transactions, NMFC will be required to take into account its allocable share of such net capital gains (subject to the discussion in
“—Investment in the Operating Company” below) and, consequently, you may receive a larger capital gain distribution than you would have received in the absence of such transactions.
154
Failure of NMFC to Qualify as a RIC
If NMFC fails to satisfy the 90.0% Income Test or the Diversification Tests for any taxable year or quarter of such taxable year, it may
nevertheless continue to qualify as a RIC for such year if certain relief provisions of the Code apply (which may, among other things, require it to pay certain corporate-level federal taxes or to dispose of certain assets). If NMFC fails to qualify
for treatment as a RIC and such relief provisions do not apply to NMFC, NMFC will be subject to federal income tax on all of its taxable income at regular corporate rates (and also will be subject to any applicable state and local taxes), regardless
of whether NMFC makes any distributions to its stockholders. Distributions would not be required. However, if distributions were made, any such distributions would be taxable to its stockholders as ordinary dividend income and, subject to certain
limitations under the Code, any such distributions made in taxable years beginning before January 1, 2013 would be eligible for the current 15.0% maximum rate applicable to non-corporate taxpayers to the extent of NMFC’s current or
accumulated earnings and profits. Subject to certain limitations under the Code, corporate distributees would be eligible for the dividends-received deduction. Distributions in excess of NMFC’s current and accumulated earnings and profits would
be treated first as a return of capital to the extent of the stockholder’s tax basis, and any remaining distributions would be treated as a capital gain.
Subject to a limited exception applicable to RICs that qualified as such under Subchapter M of the Code for at least one year prior to disqualification and that requalify as a RIC no later than the second year
following the non-qualifying year, NMFC could be subject to tax on any unrealized net built-in gains in the assets held by NMFC during the period in which NMFC failed to qualify as a RIC that are recognized during the ten-year period after its
requalification as a RIC, unless NMFC made a special election to pay corporate-level federal income tax on such built-in gain at the time of NMFC’s requalification as a RIC. NMFC may decide to be taxed as a regular corporation even if NMFC
would otherwise qualify as a RIC if NMFC determines that treatment as a corporation for a particular year would be in its best interests.
Investment in the Operating Company
As of March 31, 2011 (the cutoff date, subject to reasonable adjustments as determined by the Operating Company’s board of directors), the total fair market value of the Operating Company’s existing
assets was estimated to exceed their total adjusted tax basis for federal income tax purposes by approximately $31.4 million (such excess is referred to herein as the “net built-in gains”), comprised of approximately $31.8 million of
built-in gains and approximately $0.4 million of built-in losses. Included in the $31.4 million of net built-in gains was approximately $1.9 million of built-in gains that was estimated to be attributable to Guardian Partners’ existing assets.
As discussed in more detail below, the structure resulting from the formation transactions is designed to generally prevent NMFC from recognizing taxable income in respect of the built-in gains in our existing assets (generally determined as of the
cutoff date) with the result that any distributions made to NMFC’s stockholders that are attributable to such built-in gains generally will not be treated as taxable dividends.
Taxation of the Operating Company
In general, a partnership (other than a publicly
traded partnership taxable as a corporation) is not subject to federal income tax on its income. Rather, the partners of the partnership must report on their federal income tax returns their allocable share of the items of income, gain, loss,
deduction and credit of the partnership, and are potentially subject to federal income tax thereon, without regard to whether the partners receive any distributions from the partnership. Generally, an entity with two or more members formed as a
partnership or limited liability company under state law will be treated as a partnership for federal income tax purposes unless the entity specifically elects to be taxable as a
155
corporation. It is expected that the Operating Company will be treated for federal income tax purposes as a partnership for so long as the Operating Company has at least two members because the
Operating Company was formed as a limited liability company under state law and will not elect to be taxable as a corporation.
However,
an entity that would otherwise be classified as a partnership for federal income tax purposes may nonetheless be taxable as a corporation if it is a “publicly traded partnership”. A partnership would be treated as a publicly traded
partnership if its interests are traded on an established securities market or are readily tradable on a secondary market or a substantial equivalent thereof, within the meaning of applicable Treasury regulations. The LLC Agreement contains
certain limitations on transfers and redemptions of the common membership units of the Operating Company that are intended to cause the Operating Company to qualify for an exemption from being a publicly traded partnership under one or more of the
safe harbors contained in the applicable Treasury regulations. Accordingly, it is expected that the Operating Company will not be treated as a publicly traded partnership taxable as a corporation. Nevertheless, if for any reason the Operating
Company were taxable as a corporation, NMFC would be treated as owning, as its sole asset, interests in a corporation. Consequently, NMFC would be unable to satisfy the Diversification Tests which, in turn, would prevent NMFC from qualifying as a
RIC. See “—Failure of NMFC to Qualify as a RIC” for a discussion of the effect of NMFC’s failure to meet the Diversification Tests for a taxable year. In addition, the Operating Company’s income would be subject to
corporate-level federal income tax.
This entire discussion (including the discussion above under “Taxation of NMFC as a RIC”)
assumes that the Operating Company will be treated as a partnership that is not a publicly traded partnership taxable as a corporation in each taxable year (or portion thereof) during which the Operating Company has at least two members.
Allocations of Income, Gain, Loss, Deduction and Credit
The LLC Agreement provides that, except as required by Section 704(c) of the Code and Section 1.704-3 of the Treasury regulations (discussed below), items of income, gain, loss, deduction and credit
will be allocated to the members of the Operating Company, including NMFC, in proportion to the number of outstanding common membership units of the Operating Company held by each such member. It is expected that the allocations of these items
provided for in the LLC Agreement will comply with the requirements regarding partnership allocations contained in Section 704(b) of the Code and the Treasury regulations. If the IRS were to determine that the allocations did not so
comply, these items would be reallocated in accordance with the partners’ interest in the partnership.
Tax Allocations With Respect to
Certain Assets
Under Section 704(c) of the Code and Section 1.704-3 of the Treasury regulations, income, gain, loss
and deduction attributable to an appreciated or depreciated asset that is contributed to a partnership in exchange for an interest in the partnership, or is attributable to an asset of the partnership that has been revalued on the books of the
partnership, must be allocated in a manner so that the contributing partner, or the partners that held an interest in the partnership at the time of such revaluation, are allocated the tax gain or loss attributable to the unrealized gain or
unrealized loss in the asset at the time of such contribution or revaluation. The amount of the unrealized gain or unrealized loss generally is equal to the difference (i.e., the book-tax difference) between the fair market value and the
adjusted tax basis of the relevant asset at the time of contribution or revaluation, as adjusted from time to time. These allocations are designed so that the taxable gain or loss on an asset contributed or revalued is allocated to the partners that
earned such gain or loss for economic purposes. These allocations are solely for federal income tax purposes and do not affect the book capital accounts or other economic or legal arrangements among the partners.
156
For federal income tax purposes, Guardian AIV and New Mountain Guardian Partners, L.P. contributed
assets with built-in gains and built-in losses to the Operating Company in exchange for common membership units of the Operating Company in connection with the formation transactions completed prior to the IPO. In certain circumstances, book-tax
differences may arise as a result of a revaluation of the Operating Company’s assets, including in connection with contributions by NMFC to the Operating Company of distributions reinvested by NMFC’s stockholders under NMFC’s dividend
reinvestment plan. The LLC Agreement requires that allocations attributable to these assets be made in a manner consistent with Section 704(c) of the Code and Section 1.704-3 of the Treasury regulations.
It is expected that the built-in gains (determined as of the cutoff date subject to reasonable adjustments as determined by the Operating
Company’s board of directors) attributable to the assets contributed by Guardian AIV to the Operating Company, when recognized by the Operating Company for federal income tax purposes, either (i) will be allocated to AIV Holdings (and not
NMFC) or (ii) will be allocated to NMFC to the extent attributable to common membership units of the Operating Company that NMFC acquired from AIV Holdings in exchange for shares of NMFC common stock, but that any such allocations of built-in
gains to NMFC generally will be offset as a result of upward adjustments in NMFC’s share of the Operating Company’s tax basis in the assets contributed by Guardian AIV to the Operating Company arising as a result of NMFC’s acquisition
of such common membership units (as discussed below). Similarly, it is expected that the built-in gains (determined as of the cutoff date subject to reasonable adjustments as determined by the Operating Company’s board of directors)
attributable to the assets contributed by New Mountain Guardian Partners, L.P. to the Operating Company, when recognized by the Operating Company for federal income tax purposes, will be allocated to NMFC, but that, except as discussed below,
any such allocations of built-in gains to NMFC will be offset as a result of upward adjustments in NMFC’s share of the Operating Company’s tax basis in the assets contributed by New Mountain Guardian Partners, L.P. to the Operating
Company. Accordingly, except as discussed below, it is expected that the allocations of built-in gains to AIV Holdings and the upward adjustments in NMFC’s share of the Operating Company’s tax basis in its assets (in the case of assets
contributed by Guardian AIV to the Operating Company, as a general matter, provided the value per share of the shares of NMFC common stock received by AIV Holdings in each exchange is not less than the cutoff NAV per unit of the Operating Company
subject to any such adjustments referred to above) will generally prevent NMFC from recognizing taxable income in respect of the built-in gains in our existing assets (determined as of the cutoff date subject to any such adjustments referred to
above), when such built-in gains are recognized by the Operating Company for federal income tax purposes, with the result that any distributions made to NMFC’s stockholders that are attributable to such recognized built-in gains generally will
not be treated as taxable dividends. It is expected that, under Section 704(c)(1)(C) of the Code, any built-in losses in our existing assets (determined as of the cut-off date) will not be allocable to either NMFC or AIV Holdings because
neither of them will be treated as the “contributing partner” with respect to our existing assets.
Section 1.704-3 of
the Treasury regulations provides a partnership with a choice of several methods of accounting for book-tax differences. The Operating Company has not yet decided what method will be used to account for book-tax differences attributable to assets
contributed to the Operating Company by Guardian AIV and New Mountain Guardian Partners, L.P. It should be noted that the method selected by the Operating Company may result in a smaller amount of taxable loss or a greater amount of taxable
gain being allocated to NMFC by the Operating Company as compared to other available methods. Any asset purchased by the Operating Company for cash after admission of NMFC to the Operating Company will initially have a tax basis equal to the
asset’s fair market value and, accordingly, Section 704(c) of the Code will not initially apply.
157
Distributions and Constructive Distributions
Distributions by the Operating Company to NMFC generally will not be taxable to NMFC. However, NMFC will have taxable income in the event that the
amount of distributions that NMFC receives from the Operating Company, or the amount of any decrease in NMFC’s share of the Operating Company’s indebtedness (any such decrease being considered a constructive cash distribution to NMFC),
exceeds NMFC’s adjusted tax basis in its common membership units in the Operating Company. Such taxable income would normally be characterized as capital gain.
In the event that NMFC becomes the sole member of the Operating Company, the Operating Company will cease to be treated as a partnership for federal income tax purposes and will be deemed to liquidate (thereafter
being treated as a disregarded entity for federal income tax purposes). It is not expected that NMFC would recognize loss as a result of this deemed liquidation. However, it is possible that, under certain circumstances, NMFC would recognize gain as
a result of this deemed liquidation and would be required to make a distribution to its stockholders in respect of such gain to satisfy the Annual Distribution Requirement even though NMFC would not have received any corresponding cash payment. See
the discussion above under “—Taxation of NMFC as a RIC”. The rules applicable to determining tax basis in assets received in a liquidating distribution from a partnership could operate to cause NMFC’s tax basis in such assets to
differ from its proportionate share of the tax basis in such assets while held by the Operating Company. This could affect the amount of gain or loss recognized by NMFC as a result of the retirement, redemption, sale or other disposition of such
assets.
Section 754 Election
The Operating Company intends to make an election under Section 754 of the Code. A Section 754 election is irrevocable without the consent of the IRS. This election generally permits a person that
acquires an interest in a partnership by sale or exchange (such as NMFC when it acquires common membership units of the Operating Company from New Mountain Guardian Partners, L.P. and AIV Holdings, as discussed below) to adjust its share of the
tax basis in the partnership’s assets (“inside basis”) pursuant to Section 743(b) of the Code to fair market value (as reflected by the consideration paid for the partnership interest), as if such person had acquired a direct
interest in the partnership’s assets. The Section 743(b) adjustment is attributed solely to the person that so acquires an interest in a partnership and is not added to the tax basis of the partnership’s assets associated with all of
the partners in the partnership. The calculations involved in applying the Section 754 election are complex. It is expected that the Operating Company will make such calculations on the basis of its determination as to the value of its assets
and other matters.
As a result of the transfer of common membership units of the Operating Company to NMFC by New Mountain Guardian
Partners, L.P. in connection with the formation transactions completed prior to the IPO, New Mountain Guardian Partners, L.P. made an election that resulted in the corporate partner of New Mountain Guardian Partners, L.P. recognizing
its distributive share of the built-in gain inherent in such common membership units, which at the time of the formation transactions, was approximately 95.0% of the built-in gain inherent in such common membership units at that date. This election,
along with the Section 754 election, is expected to result in an increase (determined at the cutoff date subject to reasonable adjustments as determined by the Operating Company’s board of directors) in NMFC’s share of the Operating
Company’s tax basis in the assets that were contributed by New Mountain Guardian Partners, L.P. to the Operating Company with built-in gains (as discussed above) by an amount equal to the built-in gain in such common membership units so
recognized by the corporate partner of New Mountain Guardian Partners, L.P. This increase in tax basis is expected to offset allocations made to NMFC under Section 704(c) of the Code resulting from the Operating Company’s recognition
of built-in gains in the assets that were contributed by New Mountain Guardian Partners, L.P. to the Operating Company (as discussed above).
158
It is also expected that the remaining distributive share of New Mountain Guardian
Partners, L.P.’s built-in gain inherent in common membership units transferred by New Mountain Guardian Partners, L.P. to NMFC, which at the time of the formation transactions, was approximately 5.0% of the built-in gain inherent in
such common membership units at that date, will not result in any increase in NMFC’s share of the Operating Company’s tax basis in the assets that were contributed by New Mountain Guardian Partners, L.P. to the Operating Company.
Accordingly, it is expected that allocations made to NMFC under Section 704(c) of the Code resulting from the Operating Company’s recognition of built-in gains in these assets will not be offset to this extent, with the result that any
distributions made to NMFC’s stockholders that are attributable to such recognized built-in gains generally will be treated as taxable dividends to this extent even though such distributions could represent a return of such stockholder’s
investment.
In addition, it is expected that, as a result of an exchange by AIV Holdings of common membership units of the Operating
Company for shares of NMFC’s common stock, NMFC’s share of the Operating Company’s tax basis in assets that were contributed to the Operating Company by Guardian AIV and have built-in gains as of the time of the exchange will be
increased to reflect the value of the shares of NMFC’s common stock received by AIV Holdings. This increase in tax basis is expected to generally offset allocations made after such exchange to NMFC under Section 704(c) of the Code
resulting from the recognition of such built-in gains (as discussed above).
Tax Matters
NMFC will be the Operating Company’s tax matters member and, as such, will have the authority to handle any tax audits of the Operating
Company. Under the LLC Agreement, NMFC will generally be prohibited from taking any action in its capacity as tax matters member, which it knows (or would reasonably be expected to know) would (or would reasonably be expected to) have a significant
adverse effect on AIV Holdings, Guardian AIV or Guardian AIV’s partners. AIV Holdings will also have a consent right over NMFC’s actions as the Operating Company’s tax matters member if such action would have a significant adverse
effect on AIV Holdings, Guardian AIV or Guardian AIV’s partners.
The Operating Company intends to make an election under
Section 754 of the Code and to cause such election to remain in effect for every year of the Operating Company during which the Operating Company is treated as a partnership for federal income tax purposes. The Operating Company’s board of
directors will have the authority to cause the Operating Company to make all other tax elections, and all decisions and positions taken with respect to the Operating Company’s taxable income or tax loss (or items thereof) under the Code or
other applicable tax law will be made in such manner as may be reasonably determined by the Operating Company’s board of directors. Under the LLC Agreement, the Operating Company’s board of directors will generally be prohibited from
making tax elections or making any decision or taking any position with respect to allocations of taxable income that the Operating Company’s board of directors knows (or would reasonably be expected to know) would (or would reasonably be
expected to) adversely affect NMFC’s status as a RIC or have a significant adverse effect on AIV Holdings, Guardian AIV or Guardian AIV’s partners and a greater negative impact proportionally on the amount of taxable inclusions incurred by
AIV Holdings with respect to income allocated to it by the Operating Company than if such election, decision or position had not been made or taken.
References in the remainder of this discussion to the tax consequences of NMFC investments and activities refer solely to the investments and activities of the Operating Company.
159
The Operating Company’s Investments—General
Certain of the Operating Company’s investment practices may be subject to special and complex federal income tax provisions that may, among
other things, (1) treat dividends that would otherwise constitute qualified dividend income as non-qualified dividend income, (2) disallow, suspend or otherwise limit the allowance of certain losses or deductions, (3) convert
lower-taxed long-term capital gain into higher-taxed short-term capital gain or ordinary income, (4) convert an ordinary loss or a deduction into a capital loss (the deductibility of which is more limited), (5) cause NMFC to recognize
income or gain without receipt of a corresponding distribution of cash from the Operating Company, (6) adversely affect the time as to when a purchase or sale of stock or securities is deemed to occur, (7) adversely alter the
characterization of certain complex financial transactions and (8) produce income that will not be qualifying income for purposes of the 90.0% Income Test. The Operating Company intends to monitor its transactions and may make certain tax
elections to mitigate the potential adverse effect of these provisions, but there can be no assurance that any adverse effects of these provisions will be mitigated.
Passive Foreign Investment Companies
If the Operating Company purchases shares in a
“passive foreign investment company” (a “PFIC”), NMFC may be subject to federal income tax on its allocable share of a portion of any “excess distribution” received on, or any gain from the disposition of, such shares
even if NMFC’s allocable share of such income is distributed by it as a taxable dividend to its stockholders. Additional charges in the nature of interest generally will be imposed on NMFC in respect of deferred taxes arising from any such
excess distribution or gain. If the Operating Company invests in a PFIC and elects to treat the PFIC as a “qualified electing fund” under the Code (a “QEF”), in lieu of the foregoing requirements, NMFC will be required to include
in income each year its allocable share of the Operating Company’s proportionate share of the ordinary earnings and net capital gain of the QEF, even if such income is not distributed by the QEF. Alternatively, the Operating Company may be able
to elect to mark-to-market at the end of each taxable year its shares in a PFIC; in this case, NMFC will recognize as ordinary income its allocable share of any increase in the value of such shares, and as ordinary loss its allocable share of any
decrease in such value to the extent that any such decrease does not exceed prior increases included in its income. Under either election, NMFC may be required to recognize in a year income in excess of distributions from PFICs made by the Operating
Company to NMFC and the Operating Company’s proceeds from dispositions of PFIC stock during that year, and such income will nevertheless be subject to the Annual Distribution Requirement and will be taken into account for purposes of the 4.0%
excise tax. See “—Taxation of NMFC as a RIC” above.
Foreign Currency Transactions
Under Section 988 of the Code, gains or losses attributable to fluctuations in exchange rates between the time the Operating Company accrues
income, expenses or other liabilities denominated in a foreign currency and the time the Operating Company actually collects such income or pays such expenses or liabilities are generally treated as ordinary income or loss. Similarly, gains or
losses on foreign currency forward contracts and the disposition of debt obligations denominated in a foreign currency, to the extent attributable to fluctuations in exchange rates between the acquisition and disposition dates, are also treated as
ordinary income or loss.
The remainder of this discussion assumes that NMFC qualifies as a RIC for each taxable year.
160
Taxation of U.S. Stockholders
The following discussion only applies to U.S. stockholders. Prospective stockholders that are not U.S. stockholders should refer to
“—Taxation of Non-U.S. Stockholders” below.
Distributions
Distributions by NMFC generally are taxable to U.S. stockholders as ordinary income or capital gains. Distributions of NMFC’s “investment
company taxable income” (which is, generally, NMFC’s net ordinary income plus realized net short-term capital gains in excess of realized net long-term capital losses) will be taxable as ordinary income to U.S. stockholders to the extent
of NMFC’s current or accumulated earnings and profits, whether paid in cash or reinvested in additional common stock. To the extent that such distributions paid by NMFC in taxable years beginning before January 1, 2013 to non-corporate
stockholders (including individuals) are attributable to dividends from U.S. corporations and certain qualified foreign corporations, such distributions (“Qualifying Dividends”) may be eligible for a current maximum tax rate of 15.0%. In
this regard, it is anticipated that distributions paid by NMFC will generally not be attributable to dividends received by NMFC and, therefore, generally will not qualify for the 15.0% maximum rate applicable to Qualifying Dividends. Distributions
of NMFC’s net capital gains (which are generally NMFC’s realized net long-term capital gains in excess of realized net short-term capital losses) made in taxable years beginning before January 1, 2013 and properly reported by NMFC as
“capital gain dividends” in written statements furnished to its stockholders will be taxable to a U.S. stockholder as long-term capital gains that are currently taxable at a current maximum rate of 15.0% in the case of individuals, trusts
or estates, regardless of the U.S. stockholder’s holding period for his, her or its common stock and regardless of whether paid in cash or reinvested in additional common stock. Distributions in excess of NMFC’s earnings and profits first
will reduce a U.S. stockholder’s adjusted tax basis in such stockholder’s common stock and, after the adjusted tax basis is reduced to zero, will constitute capital gains to such U.S. stockholder.
NMFC may retain some or all of its realized net long-term capital gains in excess of realized net short-term capital losses, but designate the
retained net capital gain as a “deemed distribution”. In that case, among other consequences, (i) NMFC will pay tax on the retained amount, (ii) each U.S. stockholder will be required to include his, her or its share of the
deemed distribution in income as if it had been actually distributed to the U.S. stockholder, and (iii) the U.S. stockholder will be entitled to claim a credit equal to his, her or its allocable share of the tax paid thereon by NMFC. Because
NMFC expects to pay tax on any retained net capital gains at the regular corporate tax rate, and because that rate is in excess of the maximum rate currently payable by individuals on long-term capital gains, the amount of tax that individual U.S.
stockholders will be treated as having paid will exceed the tax they owe on the capital gain distribution and such excess generally may be refunded or claimed as a credit against the U.S. stockholder’s other federal income tax obligations. The
amount of the deemed distribution net of such tax will be added to the U.S. stockholder’s cost basis for his, her or its common stock. In order to utilize the deemed distribution approach, NMFC must provide written notice to its stockholders
prior to the expiration of 60 days after the close of the relevant taxable year. NMFC cannot treat any of its investment company taxable income as a “deemed distribution”.
For purposes of determining (1) whether the Annual Distribution Requirement is satisfied for any year and (2) the amount of capital gain
dividends paid for that year, NMFC may, under certain circumstances, elect to treat a dividend that is paid during the following taxable year as if it had been paid during the taxable year in question. If NMFC makes such an election, the U.S.
stockholder will still be treated as receiving the dividend in the taxable year in which the distribution is made. However, any dividend declared by NMFC in October, November or December of any calendar year, payable to stockholders of record on a
specified date in such a month and actually paid during January of the following year, will be treated as if it had been received by its U.S. stockholders on December 31 of the year in which the dividend was declared.
161
If an investor purchases shares of NMFC’s common stock shortly before the record date of a
distribution, the price of the shares will include the value of the distribution and the investor will be subject to tax on the distribution even though economically it may represent a return of his, her or its investment.
NMFC will send to each of its U.S. stockholders, as promptly as possible after the end of each calendar year, a notice reporting the amounts
includible in such U.S. stockholder’s taxable income for such year as ordinary income and as long-term capital gain. In addition, the federal tax status of each year’s distributions from NMFC generally will be reported to the IRS
(including the amount of dividends, if any, that are Qualifying Dividends eligible for the current 15.0% maximum rate). Dividends paid by NMFC generally will not be eligible for the dividends-received deduction or the preferential tax rate
applicable to Qualifying Dividends because NMFC’s income generally will not consist of dividends. Distributions may also be subject to additional state, local and foreign taxes depending on a U.S. stockholder’s particular situation.
Alternative Minimum Tax
As a RIC, NMFC will be subject to alternative minimum tax, also referred to as “AMT”, but any items that are treated differently for AMT
purposes must be apportioned between NMFC and its U.S. stockholders, and this may affect the U.S. stockholders’ AMT liabilities. Although Treasury regulations explaining the precise method of apportionment have not yet been issued, such items
will generally be apportioned in the same proportion that dividends paid to each U.S. stockholder bear to NMFC’s taxable income (determined without regard to the dividends paid deduction), unless a different method for a particular item is
warranted under the circumstances.
Dividend Reinvestment Plan
Under the dividend reinvestment plan, if a U.S. stockholder owns shares of NMFC’s common stock registered in the U.S. stockholder’s own name, the U.S. stockholder will have all cash distributions
automatically reinvested in additional shares of NMFC’s common stock unless the U.S. stockholder opts out of the dividend reinvestment plan by delivering a written, phone or internet notice to the plan administrator at least three days
prior to the payment date of the next dividend or distribution. See “Dividend Reinvestment Plan”. Any distributions reinvested under the plan will nevertheless remain taxable to the U.S. stockholder. The U.S. stockholder will have an
adjusted tax basis in the additional shares of NMFC’s common stock purchased through the plan equal to the amount of the reinvested distribution. The additional shares will have a new holding period commencing on the day following the day on
which the shares are credited to the U.S. stockholder’s account.
Dispositions
A U.S. stockholder generally will recognize taxable gain or loss if the U.S. stockholder sells or otherwise disposes of his, her or its shares of
NMFC’s common stock. The amount of gain or loss will be measured by the difference between such stockholder’s adjusted tax basis in the common stock sold and the amount of the proceeds received in exchange. Any gain or loss arising from
such sale or disposition generally will be treated as long-term capital gain or loss if the U.S. stockholder has held his, her or its shares for more than one year; otherwise, any such gain or loss will be classified as short-term capital gain or
loss. However, any capital loss arising from the sale or disposition of shares of NMFC’s common stock held for six months or less will be treated as long-term capital loss to the extent of the amount of capital gain dividends received, or
undistributed capital gain deemed received, with respect to such shares. In addition, all or a portion of any loss recognized upon a disposition of shares of NMFC’s common stock may be disallowed if other shares of NMFC’s common stock are
162
purchased (whether through reinvestment of distributions or otherwise) within 30 days before or after the disposition. In general, non-corporate U.S. stockholders currently are subject to a
current maximum federal income tax rate of 15.0% on their net capital gain (i.e., the excess of realized net long-term capital gains over realized net short-term capital losses) recognized in taxable years beginning before January 1, 2013,
including any long-term capital gain derived from an investment in shares of NMFC’s common stock. Such rate is lower than the maximum rate on ordinary income currently payable by individuals. The maximum rate on net capital gain for
non-corporate U.S. stockholders is scheduled to increase to 20.0% for taxable years beginning after December 31, 2012. In addition, for taxable years beginning after December 31, 2012, individuals with income in excess of $200,000
($250,000 in the case of married individuals filing jointly) and certain estates and trusts are subject to an additional 3.8% tax on their “net investment income”, which generally includes net income from interest, dividends, annuities,
royalties and rents, and net capital gains (other than certain amounts earned from trades or businesses). Corporate U.S. stockholders currently are subject to federal income tax on net capital gain at the maximum 35.0% rate also applied to ordinary
income. Non-corporate U.S. stockholders with net capital losses for a year (i.e., capital losses in excess of capital gains) generally may deduct up to $3,000 of such losses against their ordinary income each year; any net capital losses of a
non-corporate U.S. stockholder in excess of $3,000 generally may be carried forward and used in subsequent years as provided in the Code. Corporate U.S. stockholders generally may not deduct any net capital losses for a year, but may carry back such
losses for three years or carry forward such losses for five years.
Tax Shelter Reporting Regulations
Under applicable Treasury regulations, if a U.S. stockholder recognizes a loss with respect to NMFC’s common stock of $2.0 million or more
for a non-corporate U.S. stockholder or $10.0 million or more for a corporate U.S. stockholder in any single taxable year (or a greater loss over a combination of years), the U.S. stockholder must file with the IRS a disclosure statement on
Form 8886. Direct U.S. stockholders of portfolio securities are in many cases excepted from this reporting requirement, but under current guidance, U.S. stockholders of a RIC are not excepted. Future guidance may extend the current exception
from this reporting requirement to U.S. stockholders of most or all RICs. The fact that a loss is reportable under these regulations does not affect the legal determination of whether the taxpayer’s treatment of the loss is proper. U.S.
stockholders should consult their own tax advisers to determine the applicability of these regulations in light of their individual circumstances.
Backup Withholding
NMFC may be
required to withhold federal income tax (“backup withholding”) from any distribution to a U.S. stockholder (other than a corporation, a financial institution, or a stockholder that otherwise qualifies for an exemption) (1) that fails
to provide NMFC or the distribution paying agent with a correct taxpayer identification number or a certificate that such stockholder is exempt from backup withholding or (2) with respect to whom the IRS notifies NMFC that such stockholder has
failed to properly report certain interest and dividend income to the IRS and to respond to notices to that effect. An individual’s taxpayer identification number is his or her social security number. Any amount withheld under backup
withholding is allowed as a credit against the U.S. stockholder’s federal income tax liability, provided that proper information is timely provided to the IRS.
Taxation of Non-U.S. Stockholders
The following discussion applies only to Non-U.S.
stockholders. Whether an investment in shares of NMFC’s common stock is appropriate for a Non-U.S. stockholder will depend upon that person’s particular circumstances. An investment in shares of NMFC’s common stock by a Non-U.S.
stockholder may have adverse tax consequences to such Non-U.S. stockholder. Non-U.S. stockholders should consult their tax advisers before investing in NMFC’s common stock.
163
Distributions; Dispositions
Subject to the discussion in “—Recently Enacted Legislation” below, distributions of NMFC’s “investment company taxable income” to Non-U.S. stockholders (including interest income and
realized net short-term capital gains in excess of realized long-term capital losses, which generally would be free of withholding if paid to Non-U.S. stockholders directly) will be subject to withholding of federal income tax at a 30.0% rate (or
lower rate provided by an applicable income tax treaty) to the extent of NMFC’s current or accumulated earnings and profits, unless an applicable exception applies. If the distributions are effectively connected with a U.S. trade or business of
the Non-U.S. stockholder (and, if required by an applicable income tax treaty, are attributable to a U.S. permanent establishment of the Non-U.S. stockholder), NMFC will not be required to withhold federal income tax if the Non-U.S. stockholder
complies with applicable certification and disclosure requirements, although the distributions will be subject to federal income tax at the rates applicable to U.S. persons. (Special certification requirements apply to a Non-U.S. stockholder that is
a foreign partnership or a foreign trust, and such entities are urged to consult their own tax advisers.)
In addition, dividends with
respect to any taxable year of NMFC beginning on or before December 31, 2011 were not subject to withholding of federal income tax to the extent the dividends were reported by NMFC as “interest-related dividends” or “short-term
capital gain dividends” in written statements furnished to its stockholders. Under this exemption, interest-related dividends and short-term capital gain dividends generally represent distributions of interest or short-term capital gains that
would not have been subject to withholding of federal income tax at the source if they had been received directly by a foreign person, and that satisfy certain other requirements. No assurance can be given as to whether this exemption will be
extended for taxable years after 2011. In addition, no assurance can be given as to whether any of NMFC’s distributions would be eligible for this exemption from withholding tax or, if eligible, will be reported as such by NMFC. Subject to
the discussion in “—Recently Enacted Legislation” below, actual or deemed distributions of NMFC’s net capital gains to a Non-U.S. stockholder, and gains realized by a Non-U.S. stockholder upon the sale of NMFC’s common
stock, will not be subject to federal income or withholding tax unless the distributions or gains, as the case may be, are effectively connected with a U.S. trade or business of the Non-U.S. stockholder (and, if required by an applicable income tax
treaty, are attributable to a U.S. permanent establishment of the Non-U.S. stockholder).
If NMFC distributes its net capital gains in
the form of deemed rather than actual distributions, a Non-U.S. stockholder will be entitled to a federal income tax credit or tax refund equal to the stockholder’s allocable share of the tax NMFC pays on the capital gains deemed to have been
distributed. In order to obtain the refund, the Non-U.S. stockholder must obtain a U.S. taxpayer identification number and file a federal income tax return, even if the Non-U.S. stockholder would not otherwise be required to obtain a U.S.
taxpayer identification number or file a federal income tax return. For a corporate Non-U.S. stockholder, both distributions (actual or deemed) and gains realized upon the sale of NMFC’s common stock that are effectively connected with a
U.S. trade or business may, under certain circumstances, be subject to an additional “branch profits tax” at a 30.0% rate (or at a lower rate if provided for by an applicable income tax treaty). Accordingly, investment in shares of
NMFC’s common stock may not be appropriate for a Non-U.S. stockholder.
Dividend Reinvestment Plan
Under NMFC’s dividend reinvestment plan, if a Non-U.S. stockholder owns shares of NMFC’s common stock registered in the Non-U.S.
stockholder’s own name, the Non-U.S. stockholder will have all cash distributions automatically reinvested in additional shares of NMFC’s common stock unless it opts out of the dividend reinvestment plan by delivering a written, phone or
internet notice to the plan administrator at least three days prior to the payment date of the next dividend or distribution. See “Dividend Reinvestment Plan”. If the distribution is a distribution of NMFC’s investment company
164
taxable income, is not designated by NMFC as a short-term capital gain dividend or interest-related dividend, if applicable, and is not effectively connected with a U.S. trade or business of the
Non-U.S. stockholder (or, if required by an applicable income tax treaty, is not attributable to a U.S. permanent establishment of the Non-U.S. stockholder), the amount distributed (to the extent of NMFC’s current or accumulated earnings and
profits) will be subject to withholding of federal income tax at a 30.0% rate (or lower rate provided by an applicable income tax treaty) and only the net after-tax amount will be reinvested in NMFC’s common stock. If the distribution is
effectively connected with a U.S. trade or business of the Non-U.S. stockholder (and, if required by an applicable income tax treaty, is attributable to a U.S. permanent establishment of the Non-U.S. stockholder), the full amount of the distribution
generally will be reinvested in NMFC’s common stock and will nevertheless be subject to federal income tax at the ordinary income rates applicable to U.S. persons. The Non-U.S. stockholder will have an adjusted tax basis in the additional
shares of NMFC’s common stock purchased through the plan equal to the amount of the reinvested distribution. The additional shares will have a new holding period commencing on the day following the day on which the shares are credited to the
Non-U.S. stockholder’s account.
Backup Withholding
A Non-U.S. stockholder who is a non-resident alien individual, and who is otherwise subject to withholding of federal income tax, will be subject to information reporting and may be subject to backup withholding of
federal income tax on taxable distributions unless the Non-U.S. stockholder provides NMFC or the distribution paying agent with an IRS Form W-8BEN (or an acceptable substitute form) or otherwise meets documentary evidence requirements for
establishing that it is a Non-U.S. stockholder or otherwise establishes an exemption from backup withholding.
Non-U.S. stockholders
should consult their own tax advisers with respect to the federal income and withholding tax consequences, and state, local and foreign tax consequences, of an investment in shares of NMFC’s common stock.
Recently Enacted Legislation
Recently enacted legislation generally imposes a 30.0% withholding tax on payments of certain types of income to foreign financial institutions
that fail to enter into an agreement with the United States Treasury to report certain required information with respect to accounts held by United States persons (or held by foreign entities that have U.S. persons as substantial owners). The types
of income subject to the tax include U.S. source dividends paid after December 31, 2013, and the gross proceeds from the sale of any property that could produce U.S. source dividends received after December 31, 2014. The information
required to be reported includes the identity and taxpayer identification number of each account holder that is a U.S. person and transaction activity within the holder’s account. In addition, subject to certain exceptions, this legislation
also imposes a 30.0% withholding on payments to foreign entities that are not financial institutions unless the foreign entity certifies that it does not have a 10.0% or greater U.S. owner or provides the withholding agent with identifying
information on each 10.0% or greater U.S. owner. When these provisions become effective, depending on the status of a Non-U.S. Holder and the status of the intermediaries through which they hold their units, Non-U.S. Holders could be subject to this
30.0% withholding tax with respect to distributions on their shares of NMFC’s common stock and proceeds from the sale of their shares of NMFC’s common stock. Under certain circumstances, a Non-U.S. Holder might be eligible for refunds or
credits of such taxes.
165
Certain State, Local and Foreign Tax Matters
We and NMFC’s stockholders may be subject to state, local or foreign taxation in various jurisdictions in which we or they transact business,
own property or reside. The state, local or foreign tax treatment of us and NMFC’s stockholders may not conform to the federal income tax treatment discussed above. In particular, the Operating Company’s investment in foreign securities
may be subject to foreign withholding taxes and the Operating Company may be subject to the New York City Unincorporated Business Tax which is imposed at a 4.0% rate. The imposition of any such foreign, New York City or other taxes would reduce cash
available for distribution to NMFC’s stockholders, and NMFC’s stockholders would not be entitled to claim a credit or deduction with respect to such taxes. Prospective investors should consult with their own tax advisers regarding the
application and effect of state, local and foreign income and other tax laws on an investment in shares of NMFC’s common stock.
166
REGULATION
NMFC and the Operating Company have elected to be treated as BDCs under the 1940 Act. The 1940 Act contains prohibitions and restrictions relating
to investments by a BDC in another investment company and transactions between BDCs and their affiliates, principal underwriters and affiliates of those affiliates or underwriters. The 1940 Act requires that a majority of the directors be persons
other than “interested persons”, as that term is defined in the 1940 Act. In addition, the 1940 Act provides that NMFC and the Operating Company may not change the nature of our business so as to cease to be, or to withdraw their
respective elections as, BDCs unless approved by a majority of our outstanding voting securities. The 1940 Act defines “a majority of the outstanding voting securities” as the lesser of (i) 67.0% or more of the voting securities
present at a meeting if the holders of more than 50.0% of our outstanding voting securities are present or represented by proxy or (ii) more than 50.0% of our voting securities.
NMFC is relying on the provisions of Section 12(d)(1)(E) of the 1940 Act, which requires, among other things, that its investment in the
Operating Company be its only asset and that its stockholders are entitled to vote on a “pass-through” basis with the Operating Company’s other voting security holders.
NMFC may, to the extent permitted under the 1940 Act, issue additional equity capital, which would in turn increase the equity capital available to
the Operating Company. NMFC will generally not be able to issue and sell its common stock at a price below net asset value per share. See “Risk Factors—Risks Relating to Our Business—Regulations governing the operations of business
development companies will affect NMFC’s ability to raise additional equity capital as well as the Operating Company’s ability to issue senior securities or borrow for investment purposes, any or all of which could have a negative effect
on our investment objectives and strategies”. NMFC may, however, sell its common stock, or warrants, options or rights to acquire its common stock, at a price below the then-current net asset value of its common stock if its board of directors
determines that such sale is in the best interests of NMFC and the best interests of its stockholders, and its stockholders approve such sale. In addition, NMFC may generally issue new shares of its common stock at a price below net asset value in
rights offerings to existing stockholders, in payment of dividends and in certain other limited circumstances.
As a BDC, the Operating
Company will not generally be permitted to invest in any portfolio company in which the Investment Adviser or any of its affiliates currently have an investment or to make any co-investments with the Investment Adviser or its affiliates without an
exemptive order from the SEC. In addition, as BDCs, NMFC and the Operating Company are not permitted to issue stock or units in consideration for services.
Qualifying Assets
Under the 1940 Act, a BDC may not acquire any asset other than assets of
the type listed in Section 55(a) of the 1940 Act, which are referred to as qualifying assets, unless, at the time the acquisition is made, qualifying assets represent at least 70.0% of the BDC’s total assets. Since NMFC has no assets other
than its ownership of units of the Operating Company and has no material long-term liabilities, NMFC looks to the Operating Company’s assets for purposes of satisfying these requirements. The principal categories of qualifying assets relevant
to our business are any of the following:
1) Securities purchased in transactions not involving any public offering from
the issuer of such securities, which issuer (subject to certain limited exceptions) is an eligible portfolio company, or from any person who is, or has been during the preceding 13 months, an affiliated person of an
167
eligible portfolio company, or from any other person, subject to such rules as may be prescribed by the SEC. An eligible portfolio company is defined in the 1940 Act as any issuer which:
(a) is organized under the laws of, and has its principal place of business in, the U.S.;
(b) is not an investment company (other than a small business investment company wholly-owned by the BDC) or a company that would be
an investment company but for certain exclusions under the 1940 Act; and
(c) satisfies any of the following:
(i) does not have any class of securities that is traded on a national securities exchange;
(ii) has a class of securities listed on a national securities exchange, but has an aggregate market value of outstanding voting and
non-voting common equity of less than $250.0 million;
(iii) is controlled by a BDC or a group of companies
including a BDC and the BDC has an affiliated person who is a director of the eligible portfolio company; or
(iv) is a
small and solvent company having total assets of not more than $4.0 million and capital and surplus of not less than $2.0 million.
2) Securities of any eligible portfolio company that the Operating Company controls.
3) Securities purchased in a private transaction from a U.S. issuer that is not an investment company or from an affiliated person
of the issuer, or in transactions incident thereto, if the issuer is in bankruptcy and subject to reorganization or if the issuer, immediately prior to the purchase of its securities was unable to meet its obligations as they came prior to the
purchase of its securities was unable to meet its obligations as they came due without material assistance other than conventional lending or financing arrangements.
4) Securities of an eligible portfolio company purchased from any person in a private transaction if there is no ready market for
such securities and the Operating Company already owns 60.0% of the outstanding equity of the eligible portfolio company.
5) Securities received in exchange for or distributed on or with respect to securities described in (1) through (4) above,
or pursuant to the exercise of warrants or rights relating to such securities.
6) Cash, cash equivalents, U.S.
government securities or high-quality debt securities maturing in one year or less from the time of investment.
In addition, a BDC must
have been organized and have its principal place of business in the U.S. and must be operated for the purpose of making investments in the types of securities described in (1), (2) or (3) above.
As of March 31, 2012, 1.8% of the Operating Company’s total assets were not qualifying assets.
Managerial Assistance to Portfolio Companies
In order to count portfolio securities as qualifying assets for the purpose of the 70.0% test, the Operating Company must either control the issuer of the securities or must offer to make available to the issuer of
the securities (other than small and solvent companies described above) significant managerial assistance, except that, where the Operating Company purchases such securities in conjunction with one or more other persons acting together, one of the
other persons in the group may make available such managerial assistance. Making available managerial assistance means, among other things, any arrangement whereby the BDC offers to provide, and, if accepted, does so provide,
168
significant guidance and counsel concerning the management, operations or business objectives and policies of a portfolio company. The Administrator or its affiliate provides such managerial
assistance on the Operating Company’s behalf to portfolio companies that request this assistance.
Temporary Investments
Pending investments in other types of qualifying assets, the Operating Company’s investments may consist of cash, cash
equivalents, U.S. government securities or high-quality debt securities maturing in one year or less from the time of investment (collectively, as “temporary investments”), so that 70.0% of the Operating Company’s assets are
qualifying assets. Typically, the Operating Company will invest in U.S. Treasury bills or in repurchase agreements, provided that such agreements are fully collateralized by cash or securities issued by the U.S. government or its agencies. A
repurchase agreement involves the purchase by an investor, such as the Operating Company, of a specified security and the simultaneous agreement by the seller to repurchase it at an agreed-upon future date and at a price that is greater than the
purchase price by an amount that reflects an agreed-upon interest rate. There is no percentage restriction on the proportion of the Operating Company’s assets that may be invested in such repurchase agreements. However, if more than 25.0% of
the Operating Company’s total assets constitute repurchase agreements from a single counterparty, NMFC would not meet the Diversification Tests in order to qualify as a RIC for federal income tax purposes. Thus, the Operating Company does not
intend to enter into repurchase agreements with a single counterparty in excess of this limit. The Investment Adviser will monitor the creditworthiness of the counterparties with which the Operating Company enters into repurchase agreement
transactions.
Senior Securities
The Operating Company is permitted, under specified conditions, to issue multiple classes of debt and one class of membership units senior to its common membership units if the Operating Company’s asset
coverage, as defined in the 1940 Act, is at least equal to 200.0% immediately after each such issuance. In addition, while any senior securities remain outstanding (other than any indebtedness issued in consideration of a privately arranged loan,
such as any indebtedness outstanding under the Holdings Credit Facility or the SLF Credit Facility), the New Mountain Finance Entities must make provisions to prohibit any distribution to their stockholders or unit holders, as applicable, or the
repurchase of their equity securities unless the Operating Company meets the applicable asset coverage ratios at the time of the distribution or repurchase. The Operating Company may also borrow amounts up to 5.0% of the value of its total assets
for temporary or emergency purposes without regard to its asset coverage. The Operating Company will include the assets and liabilities of NMF SLF for purposes of calculating the asset coverage ratio. For a discussion of the risks associated with
leverage, see “Risk Factors—Risks Relating to Our Business—Regulations governing the operations of business development companies will affect NMFC’s ability to raise additional equity capital as well as the Operating
Company’s ability to issue senior securities or borrow for investment purposes, any or all of which could have a negative effect on our investment objectives and strategies” and “—The Operating Company may borrow money, which
could magnify the potential for gain or loss on amounts invested in us and increase the risk of investing in us”.
Code of Ethics
The New Mountain Finance Entities have adopted codes of ethics pursuant to Rule 17j-1 under the 1940 Act that establishes
procedures for personal investments and restricts certain personal securities transactions. Personnel subject to the codes may invest in securities for their personal investment
169
accounts, including securities that may be purchased or held by the Operating Company so long as such investments are made in accordance with the codes’ requirements. You may read and copy
the codes of ethics at the SEC’s Public Reference Room located at 100 F Street, N.E., Washington, District of Columbia 20549. You may obtain information on the operation of the Public Reference Room by calling the SEC at 1-800-SEC-0330,
and copies of the codes of ethics may be obtained, after paying a duplication fee, by electronic request at the following e-mail address: publicinfo@sec.gov. In addition, the codes of ethics are available on the SEC’s Internet site at
http://www.sec.gov.
Compliance Policies and Procedures
The New Mountain Finance Entities and the Investment Adviser have adopted and implemented written policies and procedures reasonably designed to
prevent violation of the federal securities laws and the New Mountain Finance Entities are required to review these compliance policies and procedures annually for their adequacy and the effectiveness of their implementation. The New Mountain
Finance Entities’ chief compliance officer is responsible for administering these policies and procedures.
Proxy Voting Policies
and Procedures
The Operating Company has delegated its proxy voting responsibility to the Investment Adviser. The proxy voting
policies and procedures of the Investment Adviser are set forth below. The guidelines will be reviewed periodically by the Investment Adviser and the Operating Company’s non-interested directors, and, accordingly, are subject to change.
Introduction
As an
investment adviser registered under the Advisers Act, the Investment Adviser has a fiduciary duty to act solely in the best interests of its clients. As part of this duty, it recognizes that it must vote the Operating Company’s securities in a
timely manner free of conflicts of interest and in the best interests of the New Mountain Finance Entities.
The policies and procedures
for voting proxies for the investment advisory clients of the Investment Adviser are intended to comply with Section 206 of, and Rule 206(4)-6 under, the Advisers Act.
Proxy policies
The Investment Adviser will vote proxies relating to the Operating
Company’s securities in the best interest of the New Mountain Finance Entities. It will review on a case-by-case basis each proposal submitted for a stockholder vote to determine its impact on the portfolio securities held by the Operating
Company. Although the Investment Adviser will generally vote against proposals that may have a negative impact on its clients’ portfolio securities, it may vote for such a proposal if there exists compelling long-term reasons to do so.
The proxy voting decisions of the Investment Adviser are made by the senior officers who are responsible for monitoring each of its
clients’ investments. To ensure that its vote is not the product of a conflict of interest, it will require that: (a) anyone involved in the decision making process disclose to its chief compliance officer any potential conflict that he or
she is aware of and any contact that he or she has had with any interested party regarding a proxy vote; and (b) employees involved in the decision making process or vote administration are prohibited from revealing how the Investment Adviser
intends to vote on a proposal in order to reduce any attempted influence from interested parties.
170
Proxy voting records
You may obtain, without charge, information regarding how the Operating Company voted proxies with respect to the Operating Company’s portfolio securities by making a written request for proxy voting
information to: Chief Compliance Officer, 787 Seventh Avenue, 48th Floor, New York, New York 10019.
Other
We will be periodically examined by the SEC for compliance with the 1940 Act.
We are required to provide and maintain a bond issued by a reputable fidelity insurance company to protect us against larceny and embezzlement.
Furthermore, as BDCs, we will be prohibited from protecting any director or officer against any liability to us or our stockholders/unit holders arising from willful misfeasance, bad faith, gross negligence or reckless disregard of the duties
involved in the conduct of such person’s office.
Exchange Act and Sarbanes-Oxley Act Compliance
The Sarbanes-Oxley Act of 2002 imposes a variety of regulatory requirements on publicly-held companies and their insiders. Many of these
requirements affect the New Mountain Finance Entities. For example:
| |
Ÿ |
|
pursuant to Rule 13a-14 of the Exchange Act, the chief executive officer and chief financial officer of the New Mountain Finance Entities will be required
to certify the accuracy of the financial statements contained in the New Mountain Finance Entities’ periodic reports; |
| |
Ÿ |
|
pursuant to Item 307 of Regulation S-K, the New Mountain Finance Entities’ periodic reports will be required to disclose their respective
conclusions about the effectiveness of their disclosure controls and procedures; |
| |
Ÿ |
|
pursuant to Rule 13a-15 of the Exchange Act, beginning for the fiscal year ending December 31, 2012, the New Mountain Finance Entities’ management
will be required to prepare a report regarding their assessment of their respective internal control over financial reporting and will be required to obtain an audit of the effectiveness of internal control over financial reporting performed by
their independent registered public accounting firm as of December 31, 2012; and |
| |
Ÿ |
|
pursuant to Item 308 of Regulation S-K and Rule 13a-15 of the Exchange Act, the New Mountain Finance Entities’ periodic reports will be
required to disclose whether there were significant changes in their respective internal controls over financial reporting or in other factors that could significantly affect these controls subsequent to the date of their evaluation, including any
corrective actions with regard to significant deficiencies and material weaknesses. |
The Sarbanes-Oxley Act of 2002
requires the New Mountain Finance Entities to review their current policies and procedures to determine whether they comply with the Sarbanes-Oxley Act of 2002 and the regulations promulgated thereunder. The New Mountain Finance Entities intend to
monitor their compliance with all regulations that are adopted under the Sarbanes-Oxley Act of 2002 and will take actions necessary to ensure that they are in compliance therewith.
171
Fundamental Investment Policies
Neither the Operating Company’s investment objective nor its investment policies are identified as fundamental. Accordingly, the Operating
Company’s investment objective and policies may be changed by the Operating Company without the approval of its unit holders.
NYSE Corporate Governance Regulations
The NYSE has adopted corporate governance regulations that listed companies must comply with. NMFC intends to be in compliance with such corporate governance listing standards applicable to BDCs. NMFC intends to
monitor its compliance with all future listing standards and to take all necessary actions to ensure that it is in compliance therewith.
172
PLAN OF DISTRIBUTION
We may offer, from time to time, in one or more offerings, up to $150,000,000 of NMFC’s common stock, in one or more underwritten public
offerings, at-the-market offerings, negotiated transactions, block trades, best efforts or a combination of these methods. In addition, this prospectus relates to 22,393,938 shares of NMFC’s common stock that may be sold by the selling
stockholders identified under “Selling Stockholders”. We may sell the shares through underwriters or dealers, directly to one or more purchasers through agents or through a combination of any such methods of sale. Any underwriter or agent
involved in the offer and sale of the shares will be named in the applicable prospectus supplement. A prospectus supplement or supplements will also describe the terms of the offering of the shares, including: the purchase price of the shares and
the proceeds we will receive from the sale; any options under which underwriters may purchase additional shares from us; any agency fees or underwriting discounts and other items constituting agents’ or underwriters’ compensation; the
public offering price; any discounts or concessions allowed or re-allowed or paid to dealers; and any securities exchange or market on which the shares may be listed. Only underwriters named in the prospectus supplement will be underwriters of the
shares offered by the prospectus supplement.
The distribution of the shares may be effected from time to time in one or more
transactions at a fixed price or prices, which may be changed, at prevailing market prices at the time of sale, at prices related to such prevailing market prices, or at negotiated prices, provided, however, that the offering price per share of
NMFC’s common stock, less any underwriting commissions or discounts, must equal or exceed the net asset value per share of NMFC’s common stock at the time of the offering except (i) with the prior approval of the majority of
NMFC’s common stockholders or (ii) under such other circumstances as the SEC may permit. The price at which shares may be distributed may represent a discount from prevailing market prices.
In connection with the sale of the shares, underwriters or agents may receive compensation from us or from purchasers of the shares, for whom they
may act as agents, in the form of discounts, concessions or commissions. Underwriters may sell the shares to or through dealers and such dealers may receive compensation in the form of discounts, concessions or commissions from the underwriters
and/or commissions from the purchasers for whom they may act as agents. Underwriters, dealers and agents that participate in the distribution of the shares may be deemed to be underwriters under the Securities Act, and any discounts and commissions
they receive from us and any profit realized by them on the resale of the shares may be deemed to be underwriting discounts and commissions under the Securities Act. Any such underwriter or agent will be identified and any such compensation received
from us will be described in the applicable prospectus supplement. The maximum aggregate commission or discount to be received by any member of FINRA or independent broker-dealer will not be greater than 10.0% of the gross proceeds of the sale of
shares offered pursuant to this prospectus and any applicable prospectus supplement. We may also reimburse the underwriter or agent for certain fees and legal expenses incurred by it.
Any underwriter may engage in over-allotment, stabilizing transactions, short-covering transactions and penalty bids in accordance with
Regulation M under the Exchange Act. Over-allotment involves sales in excess of the offering size, which create a short position. Stabilizing transactions permit bids to purchase the underlying security so long as the stabilizing bids do not
exceed a specified maximum price. Syndicate-covering or other short-covering transactions involve purchases of the shares, either through exercise of the option to purchase additional shares from us or in the open market after the distribution is
completed, to cover short positions. Penalty bids permit the underwriters to reclaim a selling concession from a dealer when the shares originally sold by the dealer are purchased in a stabilizing or covering transaction to cover short positions.
Those activities may cause the price of the shares to be higher than it would otherwise be. If commenced, the underwriters may discontinue any of the activities at any time.
173
Any underwriters that are qualified market makers on the NYSE may engage in passive market making
transactions in NMFC’s common stock on the NYSE in accordance with Regulation M under the Exchange Act, during the business day prior to the pricing of the offering, before the commencement of offers or sales of NMFC’s common stock.
Passive market makers must comply with applicable volume and price limitations and must be identified as passive market makers. In general, a passive market maker must display its bid at a price not in excess of the highest independent bid for such
security; if all independent bids are lowered below the passive market maker’s bid, however, the passive market maker’s bid must then be lowered when certain purchase limits are exceeded. Passive market making may stabilize the market
price of the shares at a level above that which might otherwise prevail in the open market and, if commenced, may be discontinued at any time.
We may sell shares directly or through agents we designate from time to time. We will name any agent involved in the offering and sale of shares and we will describe any commissions we will pay the agent in the
prospectus supplement. Unless the prospectus supplement states otherwise, our agent will act on a best-efforts basis for the period of its appointment.
Under agreements that we may enter, underwriters, dealers and agents who participate in the distribution of shares of our shares may be entitled to indemnification by us against certain liabilities, including
liabilities under the Securities Act, or contribution with respect to payments that the agents or underwriters may make with respect to these liabilities. Underwriters, dealers and agents may engage in transactions with, or perform services for, us
in the ordinary course of business.
If so indicated in the applicable prospectus supplement, we will authorize underwriters or other
persons acting as our agents to solicit offers by certain institutions to purchase our shares from us pursuant to contracts providing for payment and delivery on a future date. Institutions with which such contracts may be made include commercial
and savings banks, insurance companies, pension funds, investment companies, educational and charitable institutions and others, but in all cases such institutions must be approved by us. The obligations of any purchaser under any such contract will
be subject to the condition that the purchase of our shares shall not at the time of delivery be prohibited under the laws of the jurisdiction to which such purchaser is subject. The underwriters and such other agents will not have any
responsibility in respect of the validity or performance of such contracts. Such contracts will be subject only to those conditions set forth in the prospectus supplement, and the prospectus supplement will set forth the commission payable for
solicitation of such contracts.
We may enter into derivative transactions with third parties, or sell shares not covered by this
prospectus to third parties in privately negotiated transactions. If the applicable prospectus supplement indicates, in connection with those derivatives, the third parties may sell shares covered by this prospectus and the applicable prospectus
supplement, including in short sale transactions. If so, the third party may use shares pledged by us or borrowed from us or others to settle those sales or to close out any related open borrowings of stock, and may use shares received from us in
settlement of those derivatives to close out any related open borrowings of stock. The third parties in such sale transactions will be underwriters and, if not identified in this prospectus, will be identified in the applicable prospectus
supplement.
In order to comply with the securities laws of certain states, if applicable, our shares offered hereby will be sold in
such jurisdictions only through registered or licensed brokers or dealers.
174
SAFEKEEPING AGENT, TRANSFER AND DISTRIBUTION
PAYING AGENT AND REGISTRAR
The Operating Company maintains custody of its assets in accordance with the
requirements of Rule 17f-2 under the 1940 Act. Also in accordance with this rule, the Operating Company’s portfolio securities are held under a safekeeping agreement, by Wells Fargo Bank, National Association, which is a bank whose
functions and physical facilities are supervised by federal or state authority. The address of the safekeeping agent is: 9062 Old Annapolis Road, Columbia, Maryland 21045. American Stock Transfer & Trust Company, LLC acts as
NMFC’s transfer agent, distribution paying agent and registrar. The principal address of the transfer agent is 6201
15th Avenue, Brooklyn, New York 11219, telephone number:
(800) 937-5449.
BROKERAGE ALLOCATION AND OTHER PRACTICES
Since the Operating Company generally acquires and disposes of its investments in privately negotiated transactions, we expect that it will
infrequently use brokers in the normal course of its business. Subject to policies established by the Operating Company’s board of directors, the Investment Adviser is primarily responsible for the execution of the publicly-traded securities
portion of the Operating Company’s portfolio transactions and the allocation of brokerage commissions. The Investment Adviser does not execute transactions through any particular broker or dealer, but seeks to obtain the best net results,
taking into account such factors as price (including the applicable brokerage commission or dealer spread), size of order, difficulty of execution, and operational facilities of the firm and the firm’s risk and skill in positioning blocks of
securities. While the Investment Adviser generally seeks reasonably competitive trade execution costs, the Operating Company will not necessarily pay the lowest spread or commission available. Subject to applicable legal requirements, the Investment
Adviser may select a broker based partly upon brokerage or research services provided to the Investment Adviser and the Operating Company and any other clients. In return for such services, the Operating Company may pay a higher commission than
other brokers would charge if the Investment Adviser determines in good faith that such commission is reasonable in relation to the services provided.
LEGAL MATTERS
Certain legal matters
regarding the shares of common stock offered hereby will be passed upon for us by Sutherland Asbill & Brennan LLP, Washington District of Columbia. Certain legal matters in connection with the offering will be passed upon for the
underwriters, if any, by the counsel named in the applicable prospectus supplement.
INDEPENDENT REGISTERED PUBLIC ACCOUNTING FIRM
With respect to the unaudited interim financial information of New Mountain
Finance Holdings, L.L.C. as of March 31, 2012 and for the periods ended March 31, 2012 and 2011, and of New Mountain Finance Corporation and New Mountain Finance AIV Holdings Corporation as of March 31, 2012 and for the three months then ended,
which is included in this prospectus, Deloitte & Touche LLP, an independent registered public accounting firm, has applied limited procedures in accordance with the standards of the Public Company Accounting Oversight Board (United States) for a
review of such information. However, as stated in their reports included in this prospectus, they did not audit and they do not express an opinion on that interim financial information. Accordingly, the degree of reliance
175
on their reports on such information should be restricted in light of the limited nature of the review procedures applied. Deloitte & Touche LLP are not subject to the liability provisions of
Section 11 of the Securities Act of 1933 for their reports on the unaudited interim financial information because those reports are not “reports” or a “part” of the Registration Statement prepared or certified by an accountant
within the meaning of Sections 7 and 11 of the Act.
The financial statements of New Mountain Finance Holdings, L.L.C. as of December
31, 2011 and 2010 and for each of the three years ended December 31, 2011, and the financial statements of New Mountain Finance Corporation and New Mountain Finance AIV Holdings Corporation as of December 31, 2011 and for the period from May 19,
2011 (Commencement of Operations) to December 31, 2011, including the Senior Securities table included in this prospectus have been audited by Deloitte & Touche LLP, an independent registered public accounting firm, as stated in their reports
appearing herein and elsewhere in the Registration Statement. Such financial statements and information included in the Senior Securities table as of December 31, 2011, 2010 and 2009 have been so included in reliance upon the reports of such firm,
given their authority as experts in accounting and auditing.
The principal business address of Deloitte & Touche LLP is 2
World Financial Center, New York, New York 10281.
AVAILABLE INFORMATION
We have filed with the SEC a registration statement on Form N-2, together with all amendments and related exhibits, under the
Securities Act, with respect to the shares of common stock offered by this prospectus. The registration statement contains additional information about NMFC and the shares of common stock being offered by this prospectus.
We are required to file with or submit to the SEC annual, quarterly and current reports, proxy statements and other information meeting the
informational requirements of the Exchange Act. You may inspect and copy these reports, proxy statements and other information, as well as the registration statement and related exhibits and schedules, at the Public Reference Room of the SEC at
100 F Street, N.E., Washington, District of Columbia 20549. You may obtain information on the operation of the Public Reference Room by calling the SEC at 1-800-SEC-0330. The SEC maintains an internet site that contains reports, proxy and
information statements and other information filed electronically by us with the SEC, which are available on the SEC’s website at http://www.sec.gov. Copies of these reports, proxy and information statements and other information may be
obtained, after paying a duplicating fee, by electronic request at the following e-mail address: publicinfo@sec.gov, or by writing the SEC’s Public Reference Section, 100 F Street, N.E., Washington, District of Columbia 20549. This
information will also be available free of charge by contacting us at 787 Seventh Avenue, 48th Floor, New York, New York 10019, by telephone at (212) 720-0300, or on our website at http://www.newmountainfinance.com. Information
contained on our website or on the SEC’s web site about us is not incorporated into this prospectus and you should not consider information contained on our website or on the SEC’s website to be part of this prospectus.
PRIVACY NOTICE
Your privacy is very important to us. This Privacy Notice sets forth our policies with respect to non-public personal information about our
shareholders and prospective and former shareholders. These policies apply to shareholders of NMFC and may be changed at any time, provided a notice of such change is given to you. This notice supersedes any other privacy notice you may have
received from us.
176
We will safeguard, according to strict standards of security and confidentiality, all information we
receive about you. The only information we collect from you is your name, address, number of shares you hold and your social security number. This information is used only so that we can send you annual reports and other information about us, and
send you proxy statements or other information required by law.
We do not share this information with any non-affiliated third party
except as described below.
| |
Ÿ |
|
Authorized Employees of our Investment Adviser. It is our policy that only authorized employees of our investment adviser who need
to know your personal information will have access to it. |
| |
Ÿ |
|
Service Providers. We may disclose your personal information to companies that provide services on our behalf, such as
recordkeeping, processing your trades, and mailing you information. These companies are required to protect your information and use it solely for the purpose for which they received it. |
| |
Ÿ |
|
Courts and Government Officials. If required by law, we may disclose your personal information in accordance with a court order or
at the request of government regulators. Only that information required by law, subpoena, or court order will be disclosed. |
We seek to carefully safeguard your private information and, to that end, restrict access to non-public personal information about you to those employees and other persons who need to know the information to enable
us to provide services to you. We maintain physical, electronic and procedural safeguards to protect your non-public personal information.
If you have any questions regarding this policy or the treatment of your non-public personal information, please contact our Chief Compliance Officer at (212) 655-0024.
177
INDEX TO FINANCIAL STATEMENTS
|
|
|
|
|
| |
|
PAGE |
|
| INTERIM FINANCIAL STATEMENTS FOR THE QUARTER ENDED MARCH 31, 2012 |
|
|
|
|
| New Mountain Finance Holdings, L.L.C. |
|
|
|
|
| Consolidated Statements of Assets, Liabilities and Members’ Capital as of March
31, 2012 (unaudited) and December 31, 2011 |
|
|
F-3 |
|
| Consolidated Statements of Operations for the three months ended March 31, 2012 (unaudited) and March
31, 2011 (unaudited) |
|
|
F-4 |
|
| Consolidated Statements of Changes in Members’ Capital for the three months ended March
31, 2012 (unaudited) and March 31, 2011 (unaudited) |
|
|
F-5 |
|
| Consolidated Statements of Cash Flows for the three months ended March 31, 2012 (unaudited) and March
31, 2011 (unaudited) |
|
|
F-6 |
|
| Consolidated Schedule of Investments as of March 31, 2012 (unaudited) |
|
|
F-7 |
|
| Consolidated Schedule of Investments as of December 31, 2011 |
|
|
F-14 |
|
| New Mountain Finance Corporation |
|
|
|
|
| Statement of Assets and Liabilities as of March 31, 2012 (unaudited) and December 31,
2011 |
|
|
F-21 |
|
| Statements of Operations for the three months ended March 31, 2012 (unaudited) |
|
|
F-22 |
|
| Statement of Changes in Net Assets for the three months ended March 31, 2012 (unaudited) |
|
|
F-23 |
|
| Statement of Cash Flows for the three months ended March 31, 2012 (unaudited) |
|
|
F-24 |
|
| New Mountain Finance AIV Holdings Corporation |
|
|
|
|
| Statement of Assets and Liabilities as of March 31, 2012 (unaudited) and December 31,
2011 |
|
|
F-25 |
|
| Statements of Operations for the three months ended March 31, 2012 (unaudited) |
|
|
F-26 |
|
| Statement of Changes in Net Assets for the three months ended March 31, 2012 (unaudited) |
|
|
F-27 |
|
| Statement of Cash Flows for the three months ended March 31, 2012 (unaudited) |
|
|
F-28 |
|
| Combined Notes to the Financial Statements for New Mountain Finance Holdings, L.L.C., New Mountain Finance
Corporation and New Mountain Finance AIV Holdings Corporation |
|
|
F-29 |
|
| Reports of Independent Registered Public Accounting Firm |
|
|
F-59 |
|
| AUDITED FINANCIAL STATEMENTS |
|
|
|
|
| Reports of Independent Registered Public Accounting Firm |
|
|
F-62 |
|
| New Mountain Finance Holdings, L.L.C. |
|
|
|
|
| Consolidated Statements of Assets, Liabilities and Members’ Capital as of December
31, 2011 and December 31, 2010 |
|
|
F-65 |
|
| Consolidated Statements of Operations for the years ended December 31, 2011, December
31, 2010 and December 31, 2009 |
|
|
F-66 |
|
| Consolidated Statements of Changes in Members’ Capital for the years ended December 31, 2011,
December 31, 2010 and December 31, 2009 |
|
|
F-67 |
|
| Consolidated Statements of Cash Flows for the years ended December 31, 2011, December
31, 2010 and December 31, 2009 |
|
|
F-68 |
|
| Consolidated Schedule of Investments as of December 31, 2011 |
|
|
F-69 |
|
| Consolidated Schedule of Investments as of December 31, 2010 |
|
|
F-75 |
|
| New Mountain Finance Corporation |
|
|
|
|
| Statement of Assets and Liabilities as of December 31, 2011 |
|
|
F-80 |
|
| Statements of Operations for May 19, 2011 (commencement of operations) to December 31,
2011 |
|
|
F-81 |
|
| Statement of Changes in Net Assets for May 19, 2011 (commencement of operations) to December 31,
2011 |
|
|
F-82 |
|
| Statement of Cash Flows for May 19, 2011 (commencement of operations) to December 31,
2011 |
|
|
F-83 |
|
F-1
F-2
New Mountain Finance Holdings, L.L.C.
Consolidated Statements of Assets, Liabilities and Members’ Capital
|
|
|
|
|
|
|
|
|
| |
|
March 31,
2012 |
|
|
December 31,
2011 |
|
| |
|
(unaudited) |
|
|
|
|
| Assets |
|
|
|
|
|
|
|
|
| Investments at fair value (cost of $741,822,346 and $699,864,784, respectively) |
|
$ |
758,217,537 |
|
|
$ |
703,513,560 |
|
| Cash and cash equivalents |
|
|
13,556,115 |
|
|
|
15,318,811 |
|
| Interest receivable |
|
|
7,865,219 |
|
|
|
7,307,092 |
|
| Receivable from unsettled securities sold |
|
|
4,924,209 |
|
|
|
— |
|
| Deferred credit facility costs (net of accumulated amortization of $1,098,836 and $855,955, respectively) |
|
|
3,477,827 |
|
|
|
3,713,739 |
|
| Receivable from affiliate |
|
|
246,009 |
|
|
|
369,017 |
|
| Other assets |
|
|
329,682 |
|
|
|
356,486 |
|
|
|
|
|
|
|
|
|
|
| Total assets |
|
$ |
788,616,598 |
|
|
$ |
730,578,705 |
|
|
|
|
|
|
|
|
|
|
| Liabilities |
|
|
|
|
|
|
|
|
| SLF Credit Facility |
|
|
175,000,000 |
|
|
|
165,928,000 |
|
| Holdings Credit Facility |
|
|
151,922,888 |
|
|
|
129,037,813 |
|
| Payable for unsettled securities purchased |
|
|
12,180,000 |
|
|
|
7,604,931 |
|
| Dividends payable |
|
|
6,471,020 |
|
|
|
— |
|
| Incentive fee payable |
|
|
3,361,463 |
|
|
|
2,317,328 |
|
| Management fee payable |
|
|
2,514,296 |
|
|
|
2,200,354 |
|
| Interest payable |
|
|
2,099,549 |
|
|
|
1,747,095 |
|
| Other liabilities |
|
|
793,144 |
|
|
|
1,241,366 |
|
|
|
|
|
|
|
|
|
|
| Total liabilities |
|
|
354,342,360 |
|
|
|
310,076,887 |
|
| Members’ Capital |
|
|
434,274,238 |
|
|
|
420,501,818 |
|
|
|
|
|
|
|
|
|
|
| Total liabilities and members’ capital |
|
$ |
788,616,598 |
|
|
$ |
730,578,705 |
|
|
|
|
|
|
|
|
|
|
| Outstanding common membership units |
|
|
30,919,629 |
|
|
|
30,919,629 |
|
| Capital per unit |
|
$ |
14.05 |
|
|
$ |
13.60 |
|
The accompanying notes are an integral part of these consolidated financial statements.
F-3
New Mountain Finance Holdings, L.L.C.
Consolidated Statements of Operations
(unaudited)
|
|
|
|
|
|
|
|
|
| |
|
Three months ended |
|
| |
|
March 31,
2012 |
|
|
March 31,
2011 |
|
| Investment income |
|
|
|
|
|
|
|
|
| Interest income |
|
$ |
18,601,183 |
|
|
$ |
11,168,047 |
|
| Other income |
|
|
420,818 |
|
|
|
43,673 |
|
|
|
|
|
|
|
|
|
|
| Total investment income |
|
|
19,022,001 |
|
|
|
11,211,720 |
|
|
|
|
|
|
|
|
|
|
| Expenses |
|
|
|
|
|
|
|
|
| Incentive fee |
|
|
3,361,463 |
|
|
|
— |
|
| Management fee |
|
|
2,514,296 |
|
|
|
34,000 |
|
| Interest and other credit facility expenses |
|
|
2,483,289 |
|
|
|
1,546,753 |
|
| Administrative expenses (net of reimbursable expenses of $303,795 and $0, respectively) |
|
|
251,869 |
|
|
|
140,808 |
|
| Professional fees (net of reimbursable expenses of $246,009 and $0, respectively) |
|
|
201,838 |
|
|
|
53,156 |
|
| Other general and administrative expenses |
|
|
296,293 |
|
|
|
7,856 |
|
|
|
|
|
|
|
|
|
|
| Total expenses |
|
|
9,109,048 |
|
|
|
1,782,573 |
|
|
|
|
|
|
|
|
|
|
| Net investment income |
|
|
9,912,953 |
|
|
|
9,429,147 |
|
| Realized gains on investments |
|
|
1,007,333 |
|
|
|
5,892,330 |
|
| Net change in unrealized appreciation (depreciation) of investments |
|
|
12,746,415 |
|
|
|
1,097,337 |
|
|
|
|
|
|
|
|
|
|
| Net increase in capital resulting from operations |
|
$ |
23,666,701 |
|
|
$ |
16,418,814 |
|
|
|
|
|
|
|
|
|
|
The accompanying notes are an integral part of these consolidated financial statements.
F-4
New Mountain Finance Holdings, L.L.C.
Consolidated Statements of Changes in Members’ Capital
(unaudited)
|
|
|
|
|
|
|
|
|
| |
|
Three months ended |
|
| |
|
March 31,
2012 |
|
|
March 31,
2011 |
|
| Increase in members’ capital resulting from operations: |
|
|
|
|
|
|
|
|
| Net investment income |
|
$ |
9,912,953 |
|
|
$ |
9,429,147 |
|
| Realized gains on investments |
|
|
1,007,333 |
|
|
|
5,892,330 |
|
| Net change in unrealized appreciation (depreciation) of investments |
|
|
12,746,415 |
|
|
|
1,097,337 |
|
|
|
|
|
|
|
|
|
|
| Net increase in members’ capital resulting from operations |
|
|
23,666,701 |
|
|
|
16,418,814 |
|
| Distributions |
|
|
— |
|
|
|
(10,249,155 |
) |
| Contributions |
|
|
— |
|
|
|
42,100,712 |
|
| Dividends declared |
|
|
(9,894,281 |
) |
|
|
— |
|
|
|
|
|
|
|
|
|
|
| Net increase in members’ capital |
|
|
13,772,420 |
|
|
|
48,270,371 |
|
| Members’ capital at beginning of period |
|
|
420,501,818 |
|
|
|
241,927,261 |
|
|
|
|
|
|
|
|
|
|
| Members’ capital at end of period |
|
$ |
434,274,238 |
|
|
$ |
290,197,632 |
|
|
|
|
|
|
|
|
|
|
The accompanying notes are an integral part of these consolidated financial statements.
F-5
New Mountain Finance Holdings, L.L.C.
Consolidated Statements of Cash Flows
(unaudited)
|
|
|
|
|
|
|
|
|
| |
|
Three months ended |
|
| |
|
March 31,
2012 |
|
|
March 31,
2011 |
|
| Cash flows from operating activities |
|
|
|
|
|
|
|
|
| Net increase in capital resulting from operations |
|
$ |
23,666,701 |
|
|
$ |
16,418,814 |
|
| Adjustments to reconcile net (increase) decrease in capital resulting from operations to net cash (used in) provided by operating
activities: |
|
|
|
|
|
|
|
|
| Realized gains on investments |
|
|
(1,007,333 |
) |
|
|
(5,892,330 |
) |
| Net change in unrealized (appreciation) depreciation of investments |
|
|
(12,746,415 |
) |
|
|
(1,097,337 |
) |
| Amortization of purchase discount |
|
|
(1,539,318 |
) |
|
|
(1,679,684 |
) |
| Amortization of deferred credit facility costs |
|
|
242,881 |
|
|
|
137,623 |
|
| Non-cash interest income |
|
|
(203,667 |
) |
|
|
(226,711 |
) |
| (Increase) decrease in operating assets: |
|
|
|
|
|
|
|
|
| Purchase of investments |
|
|
(106,679,875 |
) |
|
|
(88,582,500 |
) |
| Proceeds from sales and paydowns of investments |
|
|
71,672,631 |
|
|
|
77,255,809 |
|
| Cash received for purchase of undrawn portion of revolving credit facility |
|
|
— |
|
|
|
1,260,000 |
|
| Cash paid for drawn revolvers |
|
|
(7,665,000 |
) |
|
|
— |
|
| Cash repayments on drawn revolvers |
|
|
3,465,000 |
|
|
|
— |
|
| Interest receivable |
|
|
(558,127 |
) |
|
|
(1,793,682 |
) |
| Receivable from unsettled securities sold |
|
|
(4,924,209 |
) |
|
|
— |
|
| Receivable from affiliate |
|
|
123,008 |
|
|
|
— |
|
| Other assets |
|
|
26,804 |
|
|
|
2,808 |
|
| Increase (decrease) in operating liabilities: |
|
|
|
|
|
|
|
|
| Payable for unsettled securities purchased |
|
|
4,575,069 |
|
|
|
(66,902,500 |
) |
| Incentive fee payable |
|
|
1,044,135 |
|
|
|
— |
|
| Management fee payable |
|
|
313,942 |
|
|
|
— |
|
| Interest payable |
|
|
352,454 |
|
|
|
334,000 |
|
| Payable to affiliates |
|
|
— |
|
|
|
77,294 |
|
| Other liabilities |
|
|
(263,092 |
) |
|
|
159,997 |
|
| Net cash flows (used in) provided by operating activities |
|
|
(30,104,411 |
) |
|
|
(70,528,399 |
) |
| Cash flows from financing activities |
|
|
|
|
|
|
|
|
| Contributions |
|
|
— |
|
|
|
42,100,712 |
|
| Distributions |
|
|
— |
|
|
|
(10,249,155 |
) |
| Dividends paid |
|
|
(3,423,261 |
) |
|
|
— |
|
| Proceeds from Holdings Credit Facility |
|
|
93,884,000 |
|
|
|
24,359,947 |
|
| Repayment of Holdings Credit Facility |
|
|
(70,998,925 |
) |
|
|
(19,164,635 |
) |
| Proceeds from SLF Credit Facility |
|
|
22,131,051 |
|
|
|
49,965,300 |
|
| Repayment of SLF Credit Facility |
|
|
(13,059,051 |
) |
|
|
(29,431 |
) |
| Deferred credit facility costs paid |
|
|
(192,099 |
) |
|
|
— |
|
| Net cash flows provided by (used in) financing activities |
|
|
28,341,715 |
|
|
|
86,982,738 |
|
| Net increase (decrease) in cash and cash equivalents |
|
|
(1,762,696 |
) |
|
|
16,454,339 |
|
| Cash and cash equivalents at the beginning of the period |
|
|
15,318,811 |
|
|
|
10,744,082 |
|
| Cash and cash equivalents at the end of the period |
|
$ |
13,556,115 |
|
|
$ |
27,198,421 |
|
| Supplemental disclosure of cash flow information |
|
|
|
|
|
|
|
|
| Interest paid |
|
$ |
1,777,637 |
|
|
$ |
841,305 |
|
| Non-cash financing activities: |
|
|
|
|
|
|
|
|
| Dividends declared and payable |
|
$ |
6,471,020 |
|
|
$ |
— |
|
| Accrual for offering costs |
|
|
— |
|
|
|
1,544,500 |
|
| Accrual for deferred credit facility costs |
|
|
6,969 |
|
|
|
856,521 |
|
The accompanying notes are an integral part of these consolidated financial statements.
F-6
New Mountain Finance Holdings, L.L.C.
Consolidated Schedule of Investments
March 31, 2012
(unaudited)
|
|
|
|
|
|
|
|
|
|
|
|
|
|
|
|
|
|
|
|
|
|
|
|
|
| Portfolio Company, Location
and Industry |
|
Type of
Investment |
|
Interest Rate |
|
Maturity
Date |
|
|
Principal
Amount,
Par Value
or Shares |
|
|
Cost |
|
|
Fair
Value |
|
|
Percent of
Members’
Capital |
|
| Funded Debt Investments—Luxembourg |
|
|
|
|
|
|
|
|
|
|
|
|
|
|
|
|
|
|
|
|
|
|
|
|
| Infor Lux Bond Company** |
|
|
|
|
|
|
|
|
|
|
|
|
|
|
|
|
|
|
|
|
|
|
|
|
| Software |
|
Subordinated(2) |
|
8.47% PIK (Base Rate + 8.00%)* |
|
|
9/2/2014 |
|
|
$ |
10,173,217 |
|
|
$ |
6,491,458 |
|
|
$ |
10,179,289 |
|
|
|
2.34 |
% |
|
|
|
|
|
|
|
|
|
|
|
|
|
|
|
|
|
|
|
|
|
|
|
|
|
| Total Funded Debt Investments—Luxembourg |
|
|
|
|
|
|
|
|
|
$ |
10,173,217 |
|
|
$ |
6,491,458 |
|
|
$ |
10,179,289 |
|
|
|
2.34 |
% |
|
|
|
|
|
|
|
|
|
|
|
|
|
|
|
|
|
|
|
|
|
|
|
|
|
| Funded Debt Investments—United States |
|
|
|
|
|
|
|
|
|
|
|
|
|
|
|
|
|
|
|
|
|
|
|
|
| Decision Resources, LLC |
|
|
|
|
|
|
|
|
|
|
|
|
|
|
|
|
|
|
|
|
|
|
|
|
| Business Services |
|
First lien(3) |
|
7.00% (Base Rate + 5.50%) |
|
|
12/28/2016 |
|
|
$ |
17,775,000 |
|
|
$ |
17,553,601 |
|
|
$ |
17,463,938 |
|
|
|
|
|
|
|
Second lien(2) |
|
9.50% (Base Rate + 8.00%) |
|
|
5/7/2018 |
|
|
|
14,500,000 |
|
|
|
14,368,391 |
|
|
|
14,282,500 |
|
|
|
|
|
|
|
|
|
|
|
|
|
|
|
|
|
|
|
|
|
|
|
|
|
|
|
|
|
|
|
|
|
|
|
|
|
|
|
|
|
32,275,000 |
|
|
|
31,921,992 |
|
|
|
31,746,438 |
|
|
|
7.31 |
% |
|
|
|
|
|
|
|
|
|
|
|
|
|
|
|
|
|
|
|
|
|
|
|
|
|
| Meritas Schools Holdings, LLC |
|
|
|
|
|
|
|
|
|
|
|
|
|
|
|
|
|
|
|
|
|
|
|
|
| Education |
|
First lien(3) |
|
7.50% (Base Rate + 6.00%) |
|
|
7/29/2017 |
|
|
|
9,250,000 |
|
|
|
9,165,362 |
|
|
|
9,203,750 |
|
|
|
|
|
|
|
Second lien(2) |
|
11.50% (Base Rate + 10.00%) |
|
|
1/29/2018 |
|
|
|
20,000,000 |
|
|
|
19,720,717 |
|
|
|
20,100,000 |
|
|
|
|
|
|
|
|
|
|
|
|
|
|
|
|
|
|
|
|
|
|
|
|
|
|
|
|
|
|
|
|
|
|
|
|
|
|
|
|
|
29,250,000 |
|
|
|
28,886,079 |
|
|
|
29,303,750 |
|
|
|
6.75 |
% |
|
|
|
|
|
|
|
|
|
|
|
|
|
|
|
|
|
|
|
|
|
|
|
|
|
| Global Knowledge Training LLC |
|
|
|
|
|
|
|
|
|
|
|
|
|
|
|
|
|
|
|
|
|
|
|
|
| Education |
|
First lien(3) |
|
6.50% (Base Rate + 4.99%) |
|
|
4/21/2017 |
|
|
|
4,867,647 |
|
|
|
4,799,418 |
|
|
|
4,794,632 |
|
|
|
|
|
|
|
Second lien(2) |
|
11.50% (Base Rate + 9.75%) |
|
|
10/21/2018 |
|
|
|
24,250,000 |
|
|
|
23,775,903 |
|
|
|
23,755,300 |
|
|
|
|
|
|
|
|
|
|
|
|
|
|
|
|
|
|
|
|
|
|
|
|
|
|
|
|
|
|
|
|
|
|
|
|
|
|
|
|
|
29,117,647 |
|
|
|
28,575,321 |
|
|
|
28,549,932 |
|
|
|
6.57 |
% |
|
|
|
|
|
|
|
|
|
|
|
|
|
|
|
|
|
|
|
|
|
|
|
|
|
| Managed Health Care Associates, Inc. |
|
|
|
|
|
|
|
|
|
|
|
|
|
|
|
|
|
|
|
|
|
|
|
|
| Healthcare Services |
|
First lien(2) |
|
3.50% (Base Rate + 3.25%) |
|
|
8/1/2014 |
|
|
|
15,467,673 |
|
|
|
13,167,877 |
|
|
|
14,500,943 |
|
|
|
|
|
|
|
Second lien(2) |
|
6.75% (Base Rate + 6.50%) |
|
|
2/1/2015 |
|
|
|
15,000,000 |
|
|
|
12,148,811 |
|
|
|
13,950,000 |
|
|
|
|
|
|
|
|
|
|
|
|
|
|
|
|
|
|
|
|
|
|
|
|
|
|
|
|
|
|
|
|
|
|
|
|
|
|
|
|
|
30,467,673 |
|
|
|
25,316,688 |
|
|
|
28,450,943 |
|
|
|
6.55 |
% |
|
|
|
|
|
|
|
|
|
|
|
|
|
|
|
|
|
|
|
|
|
|
|
|
|
| Lawson Software, Inc. (fka SoftBrands, Inc.) |
|
|
|
|
|
|
|
|
|
|
|
|
|
|
|
|
|
|
|
|
|
|
|
|
| Software |
|
First lien(3) |
|
6.75% (Base Rate + 5.25%) |
|
|
7/5/2017 |
|
|
|
9,962,406 |
|
|
|
9,602,718 |
|
|
|
9,962,406 |
|
|
|
|
|
|
|
Subordinated(2),(8) |
|
11.50% |
|
|
7/15/2018 |
|
|
|
13,500,000 |
|
|
|
12,357,561 |
|
|
|
14,985,000 |
|
|
|
|
|
|
|
|
|
|
|
|
|
|
|
|
|
|
|
|
|
|
|
|
|
|
|
|
|
|
|
|
|
|
|
|
|
|
|
|
|
23,462,406 |
|
|
|
21,960,279 |
|
|
|
24,947,406 |
|
|
|
5.74 |
% |
|
|
|
|
|
|
|
|
|
|
|
|
|
|
|
|
|
|
|
|
|
|
|
|
|
| Insight Pharmaceuticals LLC |
|
|
|
|
|
|
|
|
|
|
|
|
|
|
|
|
|
|
|
|
|
|
|
|
| Healthcare Products |
|
Second lien(2) |
|
13.25% (Base Rate + 11.75%) |
|
|
8/25/2017 |
|
|
|
25,000,000 |
|
|
|
24,065,834 |
|
|
|
24,656,250 |
|
|
|
5.68 |
% |
| Novell, Inc. (fka Attachmate Corporation, NetIQ Corporation) |
|
|
|
|
|
|
|
|
|
|
|
|
|
|
|
|
|
|
|
|
|
|
|
|
| Software |
|
First lien(3) |
|
6.50% (Base Rate + 5.00%) |
|
|
4/27/2017 |
|
|
|
3,776,582 |
|
|
|
3,735,005 |
|
|
|
3,768,323 |
|
|
|
|
|
|
|
Second lien(2) |
|
9.50% (Base Rate + 8.00%) |
|
|
10/27/2017 |
|
|
|
20,000,000 |
|
|
|
19,683,010 |
|
|
|
20,025,000 |
|
|
|
|
|
|
|
|
|
|
|
|
|
|
|
|
|
|
|
|
|
|
|
|
|
|
|
|
|
|
|
|
|
|
|
|
|
|
|
|
|
23,776,582 |
|
|
|
23,418,015 |
|
|
|
23,793,323 |
|
|
|
5.48 |
% |
|
|
|
|
|
|
|
|
|
|
|
|
|
|
|
|
|
|
|
|
|
|
|
|
|
| Renaissance Learning, Inc. |
|
|
|
|
|
|
|
|
|
|
|
|
|
|
|
|
|
|
|
|
|
|
|
|
| Education |
|
Second lien(2) |
|
12.00% (Base Rate + 10.50%) |
|
|
10/19/2018 |
|
|
|
20,000,000 |
|
|
|
19,039,995 |
|
|
|
20,200,000 |
|
|
|
4.65 |
% |
The accompanying
notes are an integral part of these consolidated financial statements.
F-7
New Mountain Finance Holdings, L.L.C.
Consolidated Schedule of Investments (continued)
March 31, 2012
(unaudited)
|
|
|
|
|
|
|
|
|
|
|
|
|
|
|
|
|
|
|
|
|
|
|
|
|
| Portfolio Company, Location
and Industry |
|
Type of
Investment |
|
Interest Rate |
|
Maturity
Date |
|
|
Principal
Amount,
Par Value
or Shares |
|
|
Cost |
|
|
Fair
Value |
|
|
Percent of
Members’
Capital |
|
| Learning Care Group (US), Inc. |
|
|
|
|
|
|
|
|
|
|
|
|
|
|
|
|
|
|
|
|
|
|
|
|
| Education |
|
First lien(2) |
|
12.00% |
|
|
4/27/2016 |
|
|
$ |
17,368,421 |
|
|
$ |
17,130,060 |
|
|
$ |
16,695,606 |
|
|
|
|
|
|
|
Subordinated(2) |
|
15.00% PIK* |
|
|
6/30/2016 |
|
|
|
3,273,004 |
|
|
|
3,099,660 |
|
|
|
2,971,990 |
|
|
|
|
|
|
|
|
|
|
|
|
|
|
|
|
|
|
|
|
|
|
|
|
|
|
|
|
|
|
|
|
|
|
|
|
|
|
|
|
|
20,641,425 |
|
|
|
20,229,720 |
|
|
|
19,667,596 |
|
|
|
4.53 |
% |
|
|
|
|
|
|
|
|
|
|
|
|
|
|
|
|
|
|
|
|
|
|
|
|
|
| Transplace Texas, L.P. |
|
|
|
|
|
|
|
|
|
|
|
|
|
|
|
|
|
|
|
|
|
|
|
|
| Logistics |
|
Second lien(2) |
|
11.00% (Base Rate + 9.00%) |
|
|
4/12/2017 |
|
|
|
20,000,000 |
|
|
|
19,531,663 |
|
|
|
19,500,000 |
|
|
|
4.49 |
% |
| U.S. Healthworks Holding Company, Inc. |
|
|
|
|
|
|
|
|
|
|
|
|
|
|
|
|
|
|
|
|
|
|
|
|
| Healthcare Services |
|
Second lien(2) |
|
10.50% (Base Rate + 9.00%) |
|
|
6/15/2017 |
|
|
|
20,000,000 |
|
|
|
19,729,108 |
|
|
|
19,500,000 |
|
|
|
4.49 |
% |
| Unitek Global Services, Inc. |
|
|
|
|
|
|
|
|
|
|
|
|
|
|
|
|
|
|
|
|
|
|
|
|
| Business Services |
|
First lien(2) |
|
9.00% (Base Rate + 7.50%) |
|
|
4/15/2018 |
|
|
|
19,800,000 |
|
|
|
19,285,290 |
|
|
|
19,416,375 |
|
|
|
4.47 |
% |
| Ipreo Holdings LLC |
|
|
|
|
|
|
|
|
|
|
|
|
|
|
|
|
|
|
|
|
|
|
|
|
| Information Services |
|
First lien(3) |
|
8.00% (Base Rate + 6.50%) |
|
|
8/5/2017 |
|
|
|
18,656,250 |
|
|
|
18,276,280 |
|
|
|
18,376,406 |
|
|
|
4.23 |
% |
| KeyPoint Government Solutions, Inc. |
|
|
|
|
|
|
|
|
|
|
|
|
|
|
|
|
|
|
|
|
|
|
|
|
| Federal Services |
|
First lien(2) |
|
10.00%
(Base Rate + 8.00%) |
|
|
12/31/2015 |
|
|
|
17,775,000 |
|
|
|
17,493,200 |
|
|
|
17,863,875 |
|
|
|
4.11 |
% |
| Rocket Software, Inc. |
|
|
|
|
|
|
|
|
|
|
|
|
|
|
|
|
|
|
|
|
|
|
|
|
| Software |
|
Second lien(2) |
|
10.25% (Base Rate + 8.75%) |
|
|
2/8/2019 |
|
|
|
17,500,000 |
|
|
|
17,278,438 |
|
|
|
17,500,000 |
|
|
|
4.03 |
% |
| NEWAsurion Corporation (6) Business Services |
|
|
|
|
|
|
|
|
|
|
|
|
|
|
|
|
|
|
|
|
|
|
|
|
| Asurion, LLC (fka Asurion Corporation) |
|
Second lien(2) |
|
9.00% (Base Rate + 7.50%) |
|
|
5/24/2019 |
|
|
|
5,000,000 |
|
|
|
4,977,602 |
|
|
|
5,076,250 |
|
|
|
|
|
| Lonestar Intermediate Super Holdings, LLC |
|
Subordinated(2) |
|
11.00% (Base Rate + 9.50%) |
|
|
9/2/2019 |
|
|
|
12,000,000 |
|
|
|
11,642,123 |
|
|
|
12,195,000 |
|
|
|
|
|
|
|
|
|
|
|
|
|
|
|
|
|
|
|
|
|
|
|
|
|
|
|
|
|
|
|
|
|
|
|
|
|
|
|
|
|
17,000,000 |
|
|
|
16,619,725 |
|
|
|
17,271,250 |
|
|
|
3.98 |
% |
|
|
|
|
|
|
|
|
|
|
|
|
|
|
|
|
|
|
|
|
|
|
|
|
|
| Sotera Defense Solutions, Inc. (Global Defense Technology & Systems, Inc.) |
|
|
|
|
|
|
|
|
|
|
|
|
|
|
|
|
|
|
|
|
|
|
|
|
| Federal Services |
|
First lien(3) |
|
7.00% (Base Rate + 5.50%) |
|
|
4/21/2017 |
|
|
|
16,872,500 |
|
|
|
16,729,410 |
|
|
|
16,830,319 |
|
|
|
3.88 |
% |
| SRA International, Inc. |
|
|
|
|
|
|
|
|
|
|
|
|
|
|
|
|
|
|
|
|
|
|
|
|
| Federal Services |
|
First lien(3) |
|
6.50% (Base Rate + 5.25%) |
|
|
7/20/2018 |
|
|
|
16,401,827 |
|
|
|
15,664,733 |
|
|
|
16,371,074 |
|
|
|
3.77 |
% |
| OpenLink International, Inc. |
|
|
|
|
|
|
|
|
|
|
|
|
|
|
|
|
|
|
|
|
|
|
|
|
| Software |
|
First lien(3) |
|
7.75% (Base Rate + 6.25%) |
|
|
10/30/2017 |
|
|
|
14,962,500 |
|
|
|
14,679,698 |
|
|
|
15,009,258 |
|
|
|
3.46 |
% |
| Volume Services America, Inc. (Centerplate) |
|
|
|
|
|
|
|
|
|
|
|
|
|
|
|
|
|
|
|
|
|
|
|
|
| Consumer Services |
|
First lien(2) |
|
10.50% (Base Rate + 8.50%) |
|
|
9/16/2016 |
|
|
|
14,812,500 |
|
|
|
14,490,613 |
|
|
|
14,966,802 |
|
|
|
3.45 |
% |
| PODS, Inc. (7) |
|
|
|
|
|
|
|
|
|
|
|
|
|
|
|
|
|
|
|
|
|
|
|
|
| Consumer Services |
|
|
|
|
|
|
|
|
|
|
|
|
|
|
|
|
|
|
|
|
|
|
|
|
| PODS Funding Corp. II |
|
First lien(1),(3) |
|
8.50% (Base Rate + 7.00%) |
|
|
11/29/2016 |
|
|
|
11,445,923 |
|
|
|
11,119,973 |
|
|
|
11,217,004 |
|
|
|
|
|
| Storapod Holding Company, Inc. |
|
Subordinated(1),(2) |
|
21.00% PIK* |
|
|
11/29/2017 |
|
|
|
3,728,642 |
|
|
|
3,603,252 |
|
|
|
3,599,461 |
|
|
|
|
|
|
|
|
|
|
|
|
|
|
|
|
|
|
|
|
|
|
|
|
|
|
|
|
|
|
|
|
|
|
|
|
|
|
|
|
|
15,174,565 |
|
|
|
14,723,225 |
|
|
|
14,816,465 |
|
|
|
3.41 |
% |
|
|
|
|
|
|
|
|
|
|
|
|
|
|
|
|
|
|
|
|
|
|
|
|
|
| Brock Holdings III, Inc. |
|
|
|
|
|
|
|
|
|
|
|
|
|
|
|
|
|
|
|
|
|
|
|
|
| Industrial Services |
|
Second lien(2) |
|
10.00% (Base Rate + 8.25%) |
|
|
3/16/2018 |
|
|
|
15,000,000 |
|
|
|
14,743,502 |
|
|
|
14,812,500 |
|
|
|
3.41 |
% |
The accompanying
notes are an integral part of these consolidated financial statements.
F-8
New Mountain Finance Holdings, L.L.C.
Consolidated Schedule of Investments (continued)
March 31, 2012
(unaudited)
|
|
|
|
|
|
|
|
|
|
|
|
|
|
|
|
|
|
|
|
|
|
|
|
|
| Portfolio Company, Location
and Industry |
|
Type of
Investment |
|
Interest Rate |
|
Maturity
Date |
|
|
Principal
Amount,
Par Value
or Shares |
|
|
Cost |
|
|
Fair
Value |
|
|
Percent of
Members’
Capital |
|
| Triple Point Technology, Inc. |
|
|
|
|
|
|
|
|
|
|
|
|
|
|
|
|
|
|
|
|
|
|
|
|
| Software |
|
First lien(3) |
|
8.00% (Base Rate + 6.50%) |
|
|
10/27/2017 |
|
|
$ |
14,463,750 |
|
|
$ |
13,915,868 |
|
|
$ |
14,537,877 |
|
|
|
3.35 |
% |
| SonicWALL, Inc. |
|
|
|
|
|
|
|
|
|
|
|
|
|
|
|
|
|
|
|
|
|
|
|
|
| Software |
|
First lien(3) |
|
8.27% (Base Rate + 6.18%) |
|
|
1/23/2016 |
|
|
|
3,952,017 |
|
|
|
3,956,241 |
|
|
|
3,971,776 |
|
|
|
|
|
|
|
Second lien(2) |
|
12.00% (Base Rate + 10.00%) |
|
|
1/23/2017 |
|
|
|
10,000,000 |
|
|
|
9,755,318 |
|
|
|
10,250,000 |
|
|
|
|
|
|
|
|
|
|
|
|
|
|
|
|
|
|
|
|
|
|
|
|
|
|
|
|
|
|
|
|
|
|
|
|
|
|
|
|
|
13,952,017 |
|
|
|
13,711,559 |
|
|
|
14,221,776 |
|
|
|
3.27 |
% |
|
|
|
|
|
|
|
|
|
|
|
|
|
|
|
|
|
|
|
|
|
|
|
|
|
| Pacific Architects and Engineers Incorporated |
|
|
|
|
|
|
|
|
|
|
|
|
|
|
|
|
|
|
|
|
|
|
|
|
| Federal Services |
|
First lien(3) |
|
7.50% (Base Rate + 6.00%) |
|
|
4/4/2017 |
|
|
|
14,100,000 |
|
|
|
13,860,160 |
|
|
|
14,029,500 |
|
|
|
3.23 |
% |
| Virtual Radiologic Corporation |
|
|
|
|
|
|
|
|
|
|
|
|
|
|
|
|
|
|
|
|
|
|
|
|
| Healthcare Information Technology |
|
First lien(3) |
|
7.75% (Base Rate + 4.50%) |
|
|
12/22/2016 |
|
|
|
14,852,481 |
|
|
|
14,674,868 |
|
|
|
13,961,332 |
|
|
|
3.21 |
% |
| Aspen Dental Management, Inc |
|
|
|
|
|
|
|
|
|
|
|
|
|
|
|
|
|
|
|
|
|
|
|
|
| Healthcare Services |
|
First lien(3) |
|
7.00%
(Base Rate + 5.50%) |
|
|
10/6/2016 |
|
|
|
12,967,500 |
|
|
|
12,710,271 |
|
|
|
12,918,872 |
|
|
|
2.97 |
% |
| Permian Tank & Manufacturing, Inc. |
|
|
|
|
|
|
|
|
|
|
|
|
|
|
|
|
|
|
|
|
|
|
|
|
| Energy |
|
First lien(2) |
|
9.50% (Base Rate + 7.75%) |
|
|
3/15/2017 |
|
|
|
13,000,000 |
|
|
|
12,677,155 |
|
|
|
12,675,000 |
|
|
|
2.92 |
% |
| Smile Brands Group Inc. |
|
|
|
|
|
|
|
|
|
|
|
|
|
|
|
|
|
|
|
|
|
|
|
|
| Healthcare Services |
|
First lien(3) |
|
7.00%
(Base Rate + 5.25%) |
|
|
12/21/2017 |
|
|
|
12,306,439 |
|
|
|
12,148,416 |
|
|
|
12,375,663 |
|
|
|
2.85 |
% |
| Vision Solutions, Inc. |
|
|
|
|
|
|
|
|
|
|
|
|
|
|
|
|
|
|
|
|
|
|
|
|
| Software |
|
Second lien(2) |
|
9.50% (Base Rate + 8.00%) |
|
|
7/23/2017 |
|
|
|
12,000,000 |
|
|
|
11,898,722 |
|
|
|
11,820,000 |
|
|
|
2.72 |
% |
| Mailsouth, Inc. |
|
|
|
|
|
|
|
|
|
|
|
|
|
|
|
|
|
|
|
|
|
|
|
|
| Media |
|
First lien(3) |
|
6.75% (Base Rate + 5.00%) |
|
|
12/14/2016 |
|
|
|
11,880,000 |
|
|
|
11,733,073 |
|
|
|
11,731,500 |
|
|
|
2.70 |
% |
| Brickman Group Holdings, Inc. |
|
|
|
|
|
|
|
|
|
|
|
|
|
|
|
|
|
|
|
|
|
|
|
|
| Business Services |
|
First lien(3) |
|
7.25% (Base Rate + 5.50%) |
|
|
10/14/2016 |
|
|
|
7,937,311 |
|
|
|
7,983,349 |
|
|
|
8,010,072 |
|
|
|
|
|
|
|
Subordinated(2),(8) |
|
9.13% |
|
|
11/1/2018 |
|
|
|
3,650,000 |
|
|
|
3,314,508 |
|
|
|
3,540,500 |
|
|
|
|
|
|
|
|
|
|
|
|
|
|
|
|
|
|
|
|
|
|
|
|
|
|
|
|
|
|
|
|
|
|
|
|
|
|
|
|
|
11,587,311 |
|
|
|
11,297,857 |
|
|
|
11,550,572 |
|
|
|
2.66 |
% |
|
|
|
|
|
|
|
|
|
|
|
|
|
|
|
|
|
|
|
|
|
|
|
|
|
| TravelCLICK, Inc. (fka TravelCLICK Acquisition Co.) |
|
|
|
|
|
|
|
|
|
|
|
|
|
|
|
|
|
|
|
|
|
|
|
|
| Information Services |
|
First lien(3) |
|
6.50%
(Base Rate + 5.00%) |
|
|
3/16/2016 |
|
|
|
11,372,594 |
|
|
|
11,191,660 |
|
|
|
11,358,378 |
|
|
|
2.62 |
% |
| Tekelec Global, Inc. |
|
|
|
|
|
|
|
|
|
|
|
|
|
|
|
|
|
|
|
|
|
|
|
|
| Software |
|
First lien(3) |
|
9.00%
(Base Rate + 7.50%) |
|
|
1/29/2018 |
|
|
|
11,500,000 |
|
|
|
11,331,396 |
|
|
|
11,327,500 |
|
|
|
2.61 |
% |
| Merrill Communications LLC |
|
|
|
|
|
|
|
|
|
|
|
|
|
|
|
|
|
|
|
|
|
|
|
|
| Business Services |
|
First lien(2) |
|
7.50%
(Base Rate + 5.50%) |
|
|
12/24/2012 |
|
|
|
11,421,788 |
|
|
|
10,554,020 |
|
|
|
10,736,481 |
|
|
|
2.47 |
% |
| Immucor, Inc. |
|
|
|
|
|
|
|
|
|
|
|
|
|
|
|
|
|
|
|
|
|
|
|
|
| Healthcare Services |
|
First lien(3) |
|
7.25%
(Base Rate + 5.75%) |
|
|
8/19/2018 |
|
|
|
4,975,000 |
|
|
|
4,789,318 |
|
|
|
5,039,262 |
|
|
|
|
|
|
|
Subordinated(2) |
|
11.13% |
|
|
8/15/2019 |
|
|
|
5,000,000 |
|
|
|
4,938,898 |
|
|
|
5,581,250 |
|
|
|
|
|
|
|
|
|
|
|
|
|
|
|
|
|
|
|
|
|
|
|
|
|
|
|
|
|
|
|
|
|
|
|
|
|
|
|
|
|
9,975,000 |
|
|
|
9,728,216 |
|
|
|
10,620,512 |
|
|
|
2.45 |
% |
|
|
|
|
|
|
|
|
|
|
|
|
|
|
|
|
|
|
|
|
|
|
|
|
|
| CHG Companies, Inc. |
|
|
|
|
|
|
|
|
|
|
|
|
|
|
|
|
|
|
|
|
|
|
|
|
| Healthcare Services |
|
Second lien(2) |
|
11.25%
(Base Rate + 9.50%) |
|
|
4/7/2017 |
|
|
|
10,000,000 |
|
|
|
9,832,604 |
|
|
|
10,050,000 |
|
|
|
2.31 |
% |
| Vertafore, Inc. |
|
|
|
|
|
|
|
|
|
|
|
|
|
|
|
|
|
|
|
|
|
|
|
|
| Software |
|
Second lien(2) |
|
9.75% (Base Rate + 8.25%) |
|
|
10/29/2017 |
|
|
|
10,000,000 |
|
|
|
9,914,923 |
|
|
|
10,020,830 |
|
|
|
2.31 |
% |
The accompanying
notes are an integral part of these consolidated financial statements.
F-9
New Mountain Finance Holdings, L.L.C.
Consolidated Schedule of Investments (continued)
March 31, 2012
(unaudited)
|
|
|
|
|
|
|
|
|
|
|
|
|
|
|
|
|
|
|
|
|
|
|
|
|
| Portfolio Company, Location
and Industry |
|
Type of
Investment |
|
Interest Rate |
|
Maturity
Date |
|
|
Principal
Amount,
Par Value
or Shares |
|
|
Cost |
|
|
Fair
Value |
|
|
Percent of
Members’
Capital |
|
| Merge Healthcare Inc. |
|
|
|
|
|
|
|
|
|
|
|
|
|
|
|
|
|
|
|
|
|
|
|
|
| Healthcare Services |
|
First lien(2) |
|
11.75% |
|
|
5/1/2015 |
|
|
$ |
9,000,000 |
|
|
$ |
8,888,302 |
|
|
$ |
9,765,000 |
|
|
|
2.25 |
% |
| Premier Dental Services, Inc. (Western) |
|
|
|
|
|
|
|
|
|
|
|
|
|
|
|
|
|
|
|
|
|
|
|
|
| Healthcare Services |
|
First lien(2) |
|
5.97% (Base Rate + 5.50%) |
|
|
7/1/2013 |
|
|
|
9,961,832 |
|
|
|
9,296,330 |
|
|
|
9,364,122 |
|
|
|
2.16 |
% |
| Sunquest Information Systems, Inc. (Misys Hospital Systems, Inc.) |
|
|
|
|
|
|
|
|
|
|
|
|
|
|
|
|
|
|
|
|
|
|
|
|
| Healthcare Services |
|
Second lien(2) |
|
9.75% (Base Rate + 8.50%) |
|
|
6/16/2017 |
|
|
|
9,000,000 |
|
|
|
8,845,075 |
|
|
|
9,315,000 |
|
|
|
2.14 |
% |
| Physio-Control International, Inc. |
|
|
|
|
|
|
|
|
|
|
|
|
|
|
|
|
|
|
|
|
|
|
|
|
| Healthcare Products |
|
First lien(2),(8) |
|
9.88% |
|
|
1/15/2019 |
|
|
|
7,000,000 |
|
|
|
7,000,000 |
|
|
|
7,385,000 |
|
|
|
1.70 |
% |
| Research Pharmaceutical Services, Inc. |
|
|
|
|
|
|
|
|
|
|
|
|
|
|
|
|
|
|
|
|
|
|
|
|
| Healthcare Services |
|
First lien(3) |
|
6.75% (Base Rate + 5.24%) |
|
|
2/18/2017 |
|
|
|
7,406,250 |
|
|
|
7,312,058 |
|
|
|
7,128,516 |
|
|
|
1.64 |
% |
| Surgery Center Holdings, Inc. |
|
|
|
|
|
|
|
|
|
|
|
|
|
|
|
|
|
|
|
|
|
|
|
|
| Healthcare Services |
|
First lien(3) |
|
6.50% (Base Rate + 5.00%) |
|
|
2/6/2017 |
|
|
|
6,930,000 |
|
|
|
6,900,773 |
|
|
|
6,687,450 |
|
|
|
1.54 |
% |
| IDQ Holdings Inc. |
|
|
|
|
|
|
|
|
|
|
|
|
|
|
|
|
|
|
|
|
|
|
|
|
| Consumer Products |
|
First lien(2),(8) |
|
11.50% |
|
|
4/1/2017 |
|
|
|
6,250,000 |
|
|
|
6,125,251 |
|
|
|
6,437,500 |
|
|
|
1.48 |
% |
| Stratus Technologies, Inc. |
|
|
|
|
|
|
|
|
|
|
|
|
|
|
|
|
|
|
|
|
|
|
|
|
| Information Technology |
|
First lien(2) |
|
12.00% |
|
|
3/29/2015 |
|
|
|
6,827,000 |
|
|
|
6,505,897 |
|
|
|
6,058,963 |
|
|
|
1.40 |
% |
| Airvana Network Solutions Inc. |
|
|
|
|
|
|
|
|
|
|
|
|
|
|
|
|
|
|
|
|
|
|
|
|
| Software |
|
First lien(2) |
|
10.00% (Base Rate + 8.00%) |
|
|
3/25/2015 |
|
|
|
6,285,714 |
|
|
|
6,191,397 |
|
|
|
6,002,857 |
|
|
|
1.38 |
% |
| Alion Science and Technology Corporation |
|
|
|
|
|
|
|
|
|
|
|
|
|
|
|
|
|
|
|
|
|
|
|
|
| Federal Services |
|
First lien(2) |
|
10.00% + 2.00% PIK* |
|
|
11/1/2014 |
|
|
|
6,195,238 |
|
|
|
5,931,105 |
|
|
|
5,802,876 |
|
|
|
1.34 |
% |
| Mach Gen, LLC |
|
|
|
|
|
|
|
|
|
|
|
|
|
|
|
|
|
|
|
|
|
|
|
|
| Power Generation |
|
Second lien(2) |
|
7.99% PIK (Base Rate + 7.50%)* |
|
|
2/22/2015 |
|
|
|
8,227,575 |
|
|
|
7,061,091 |
|
|
|
5,569,227 |
|
|
|
1.28 |
% |
| Ozburn-Hessey Holding Company LLC |
|
|
|
|
|
|
|
|
|
|
|
|
|
|
|
|
|
|
|
|
|
|
|
|
| Logistics |
|
Second lien(2) |
|
11.50% (Base Rate + 9.50%) |
|
|
10/10/2016 |
|
|
|
6,000,000 |
|
|
|
5,897,749 |
|
|
|
4,950,000 |
|
|
|
1.14 |
% |
| LVI Services Inc. |
|
|
|
|
|
|
|
|
|
|
|
|
|
|
|
|
|
|
|
|
|
|
|
|
| Industrial Services |
|
First lien(2) |
|
9.25% (Base Rate + 7.50%) |
|
|
3/31/2014 |
|
|
|
5,073,885 |
|
|
|
4,494,005 |
|
|
|
4,249,379 |
|
|
|
0.98 |
% |
| Education Management LLC** |
|
|
|
|
|
|
|
|
|
|
|
|
|
|
|
|
|
|
|
|
|
|
|
|
| Education |
|
First lien(3) |
|
8.25% (Base Rate + 7.00%) |
|
|
3/30/2018 |
|
|
|
4,000,000 |
|
|
|
3,880,000 |
|
|
|
3,980,000 |
|
|
|
0.92 |
% |
| Advantage Sales & Marketing Inc. |
|
|
|
|
|
|
|
|
|
|
|
|
|
|
|
|
|
|
|
|
|
|
|
|
| Business Services |
|
First lien (2),(4) |
|
6.25% (Base Rate + 3.00%) |
|
|
12/17/2015 |
|
|
|
4,200,000 |
|
|
|
3,696,000 |
|
|
|
3,885,000 |
|
|
|
0.89 |
% |
| ATI Acquisition Company (fka Ability Acquisition, Inc.) |
|
|
|
|
|
|
|
|
|
|
|
|
|
|
|
|
|
|
|
|
|
|
|
|
| Education |
|
First lien(2) |
|
12.25% (Base Rate +
5.00% + 4.00% PIK)(5)* |
|
|
12/30/2014 |
|
|
$ |
4,432,500 |
|
|
$ |
4,306,437 |
|
|
$ |
443,250 |
|
|
|
|
|
|
|
First lien(2) |
|
17.25% (Base Rate + 10.00% + 4.00% PIK)* |
|
|
6/30/2012 |
|
|
|
101,848 |
|
|
|
92,678 |
|
|
|
101,848 |
|
|
|
|
|
|
|
First lien(2) |
|
17.25% (Base Rate + 10.00% + 4.00% PIK)* |
|
|
6/30/2012 |
|
|
|
1,648,706 |
|
|
|
1,500,269 |
|
|
|
1,648,706 |
|
|
|
|
|
|
|
|
|
|
|
|
|
|
|
|
|
|
|
|
|
|
|
|
|
|
|
|
|
|
|
|
|
|
|
|
|
|
|
|
|
6,183,054 |
|
|
|
5,899,384 |
|
|
|
2,193,804 |
|
|
|
0.51 |
% |
|
|
|
|
|
|
|
|
|
|
|
|
|
|
|
|
|
|
|
|
|
|
|
|
|
| Total Funded Debt Investments—United States |
|
|
|
|
|
|
|
|
|
$ |
761,865,303 |
|
|
$ |
737,763,993 |
|
|
$ |
746,260,449 |
|
|
|
171.84 |
% |
|
|
|
|
|
|
|
|
|
|
|
|
|
|
|
|
|
|
|
|
|
|
|
|
|
The accompanying
notes are an integral part of these consolidated financial statements.
F-10
New Mountain Finance Holdings, L.L.C.
Consolidated Schedule of Investments (continued)
March 31, 2012
(unaudited)
|
|
|
|
|
|
|
|
|
|
|
|
|
|
|
|
|
|
|
|
|
|
|
|
|
| Portfolio Company, Location
and Industry |
|
Type of
Investment |
|
Interest Rate |
|
Maturity
Date |
|
|
Principal
Amount,
Par Value
or Shares |
|
|
Cost |
|
|
Fair
Value |
|
|
Percent of
Members’
Capital |
|
| Equity—United States |
|
|
|
|
|
|
|
|
|
|
|
|
|
|
|
|
|
|
|
|
|
|
|
|
| Global Knowledge Training LLC |
|
|
|
|
|
|
|
|
|
|
|
|
|
|
|
|
|
|
|
|
|
|
|
|
| Education |
|
Ordinary shares(2) |
|
— |
|
|
— |
|
|
|
2 |
|
|
$ |
2,109 |
|
|
$ |
2,109 |
|
|
|
|
|
|
|
Preferred shares(2) |
|
— |
|
|
— |
|
|
|
2,423 |
|
|
|
2,422,891 |
|
|
|
2,422,891 |
|
|
|
|
|
|
|
|
|
|
|
|
|
|
|
|
|
|
|
|
|
|
|
|
|
|
|
|
|
|
|
|
|
|
|
|
|
|
|
|
|
|
|
|
|
2,425,000 |
|
|
|
2,425,000 |
|
|
|
0.56 |
% |
|
|
|
|
|
|
|
|
|
|
|
|
|
|
|
|
|
|
|
|
|
|
|
|
|
| Stratus Technologies, Inc. |
|
|
|
|
|
|
|
|
|
|
|
|
|
|
|
|
|
|
|
|
|
|
|
|
| Information Technology |
|
Ordinary shares(2) |
|
— |
|
|
— |
|
|
|
144,270 |
|
|
|
65,123 |
|
|
|
29,881 |
|
|
|
|
|
|
|
Preferred shares(2) |
|
— |
|
|
— |
|
|
|
32,830 |
|
|
|
14,819 |
|
|
|
6,800 |
|
|
|
|
|
|
|
|
|
|
|
|
|
|
|
|
|
|
|
|
|
|
|
|
|
|
|
|
|
|
|
|
|
|
|
|
|
|
|
|
|
|
|
|
|
79,942 |
|
|
|
36,681 |
|
|
|
0.01 |
% |
|
|
|
|
|
|
|
|
|
|
|
|
|
|
|
|
|
|
|
|
|
|
|
|
|
| Total Shares |
|
|
|
|
|
|
|
|
|
|
|
|
|
$ |
2,504,942 |
|
|
$ |
2,461,681 |
|
|
|
0.57 |
% |
|
|
|
|
|
|
|
|
|
|
|
|
|
|
|
|
|
|
|
|
|
|
|
|
|
|
|
|
|
|
|
|
|
|
|
|
|
|
|
|
|
|
|
|
|
|
|
|
|
|
| Warrants—United States |
|
|
|
|
|
|
|
|
|
|
|
|
|
|
|
|
|
|
|
|
|
|
|
|
| Alion Science and Technology Corporation |
|
|
|
|
|
|
|
|
|
|
|
|
|
|
|
|
|
|
|
|
|
|
|
|
| Federal Services |
|
Warrants(2) |
|
— |
|
|
— |
|
|
|
6,000 |
|
|
$ |
292,851 |
|
|
$ |
244,237 |
|
|
|
0.06 |
% |
| PODS, Inc. (7) |
|
|
|
|
|
|
|
|
|
|
|
|
|
|
|
|
|
|
|
|
|
|
|
|
| Storapod Holding Company, Inc. |
|
|
|
|
|
|
|
|
|
|
|
|
|
|
|
|
|
|
|
|
|
|
|
|
| Consumer Services |
|
Warrants(2) |
|
— |
|
|
— |
|
|
|
298,398 |
|
|
|
129,181 |
|
|
|
129,181 |
|
|
|
0.03 |
% |
| Learning Care Group (US), Inc. |
|
|
|
|
|
|
|
|
|
|
|
|
|
|
|
|
|
|
|
|
|
|
|
|
| Education |
|
Warrants(2) |
|
— |
|
|
— |
|
|
|
844 |
|
|
|
193,850 |
|
|
|
14,372 |
|
|
|
0.00 |
% |
| Total Warrants |
|
|
|
|
|
|
|
|
|
|
|
|
|
$ |
615,882 |
|
|
$ |
387,790 |
|
|
|
0.09 |
% |
|
|
|
|
|
|
|
|
|
|
|
|
|
|
|
|
|
|
|
|
|
|
|
|
|
|
|
|
|
|
|
|
|
|
|
|
|
|
|
|
|
|
|
|
|
|
|
|
|
|
| Total Funded Investments |
|
|
|
|
|
|
|
|
|
|
|
|
|
$ |
747,376,275 |
|
|
$ |
759,289,209 |
|
|
|
174.84 |
% |
|
|
|
|
|
|
|
|
|
|
|
|
|
|
|
|
|
|
|
|
|
|
|
|
|
|
|
|
|
|
|
|
|
|
|
|
|
|
|
|
|
|
|
|
|
|
|
|
|
|
| Unfunded Debt Investments—United States |
|
|
|
|
|
|
|
|
|
|
|
|
|
|
|
|
|
|
|
|
|
|
|
|
| Education Management LLC** |
|
|
|
|
|
|
|
|
|
|
|
|
|
|
|
|
|
|
|
|
|
|
|
|
| Education |
|
First lien(2),(4)—Undrawn |
|
— |
|
|
6/1/2012 |
|
|
$ |
3,000,000 |
|
|
$ |
(1,215,000) |
|
|
$ |
(45,000) |
|
|
|
(0.01) |
% |
| PODS, Inc.(7) |
|
|
|
|
|
|
|
|
|
|
|
|
|
|
|
|
|
|
|
|
|
|
|
|
| Consumer Services |
|
|
|
|
|
|
|
|
|
|
|
|
|
|
|
|
|
|
|
|
|
|
|
|
| PODS Funding Corp. II |
|
First lien(1),(3)—Undrawn |
|
— |
|
|
11/29/2016 |
|
|
$ |
3,438,462 |
|
|
$ |
(103,154) |
|
|
$ |
(68,769) |
|
|
|
|
|
| Storapod Holding Company, Inc. |
|
Subordinated(1),(2)—Undrawn |
|
— |
|
|
11/29/2017 |
|
|
|
771,358 |
|
|
|
— |
|
|
|
— |
|
|
|
|
|
|
|
|
|
|
|
|
|
|
|
|
|
|
|
|
|
|
|
|
|
|
|
|
|
|
|
|
|
|
|
|
|
|
|
|
|
4,209,820 |
|
|
|
(103,154) |
|
|
|
(68,769) |
|
|
|
(0.02) |
% |
|
|
|
|
|
|
|
|
|
|
|
|
|
|
|
|
|
|
|
|
|
|
|
|
|
| RGIS Services, LLC |
|
|
|
|
|
|
|
|
|
|
|
|
|
|
|
|
|
|
|
|
|
|
|
|
| Business Services |
|
First lien(2),(4)—Undrawn |
|
— |
|
|
4/30/2013 |
|
|
|
5,000,000 |
|
|
|
(2,850,000) |
|
|
|
(212,500) |
|
|
|
(0.05) |
% |
| Kronos Incorporated |
|
|
|
|
|
|
|
|
|
|
|
|
|
|
|
|
|
|
|
|
|
|
|
|
| Software |
|
First lien(2),(4)—Undrawn |
|
— |
|
|
6/11/2013 |
|
|
|
4,198,500 |
|
|
|
(629,775) |
|
|
|
(272,903) |
|
|
|
(0.06) |
% |
| Advantage Sales &
Marketing Inc. |
|
|
|
|
|
|
|
|
|
|
|
|
|
|
|
|
|
|
|
|
|
|
|
|
| Business Services |
|
First lien (2),(4)—Undrawn |
|
— |
|
|
12/17/2015 |
|
|
|
6,300,000 |
|
|
|
(756,000) |
|
|
|
(472,500) |
|
|
|
(0.11) |
% |
| Total Unfunded Debt Investments |
|
|
|
|
|
|
|
|
|
$ |
22,708,320 |
|
|
$ |
(5,553,929) |
|
|
$ |
(1,071,672) |
|
|
|
(0.25) |
% |
|
|
|
|
|
|
|
|
|
|
|
|
|
|
|
|
|
|
|
|
|
|
|
|
|
| Total Investments |
|
|
|
|
|
|
|
|
|
|
|
|
|
$ |
741,822,346 |
|
|
$ |
758,217,537 |
|
|
|
174.59 |
% |
|
|
|
|
|
|
|
|
|
|
|
|
|
|
|
|
|
|
|
|
|
|
|
|
|
The accompanying
notes are an integral part of these consolidated financial statements.
F-11
New Mountain Finance Holdings, L.L.C.
Consolidated Schedule of Investments (continued)
March 31, 2012
(unaudited)
| (1) |
Par Value amounts represent the drawn or undrawn (as indicated in type of investment) portion of the bridge facility, delayed draw or other future funding commitments.
|
| (2) |
The Holdings Credit Facility is collateralized by the indicated investments. |
| (3) |
The SLF Credit Facility is collateralized by the indicated investments. |
| (4) |
Par Value amounts represent the drawn or undrawn (as indicated in type of investment) portion of revolving credit facilities. Cost amounts represent the cash received at
settlement date net the impact of paydowns and cash paid for drawn revolvers. |
| (5) |
Investment is on non-accrual status. |
| (6) |
New Mountain Finance Holdings, L.L.C. (“NMF Holdings”) holds investments in two related entities of NEWAsurion Corporation. NMF Holdings has credit investments in
Asurion, LLC and Lonestar Intermediate Super Holdings, LLC. Asurion, LLC is a wholly-owned subsidiary of Lonestar Intermediate Holdings, LLC, which in turn is a wholly-owned subsidiary of Lonestar Intermediate Super Holdings, LLC.
|
| (7) |
NMF Holdings holds investments in two related entities of PODS, Inc. NMF Holdings directly holds warrants in Storapod Holding Company, Inc. (“Storapod”) and
has a credit investment in Storapod through Storapod WCF II Limited (“Storapod WCF II”). Storapod WCF II is a special purpose entity used to enter into a Shari’ah- compliant financing arrangement with Storapod. Additionally, NMF
Holdings has a credit investment in PODS Funding Corp. II (“PODS II”). PODS, Inc. is a wholly-owned subsidiary of PODS Holding, Inc., which in turn is a majority- owned subsidiary of Storapod. PODS II is a special purpose entity
used to enter into a Shari’ah-compliant financing arrangement with PODS, Inc. and its subsidiary, PODS Enterprises, Inc. |
| (8) |
Securities are exempt from registration under Rule 144A of the Securities Act of 1933. These securities are considered liquid and may be resold in transactions exempt from
registration to qualified institutional buyers. At March 31, 2012, the aggregate market value of these securities amounted to $32,348,000 or 7.45% of members’ capital. |
| * |
All or a portion of interest contains payments-in-kind (“PIK”). |
| ** |
Indicates assets that NMF Holdings deems to be “non-qualifying assets” under Section 55(a) of the Investment Company Act of 1940, as amended. Qualifying assets
must represent at least 70.00% of NMF Holdings’ total assets at the time of acquisition of any additional non-qualifying assets. |
The accompanying notes are an integral part of these consolidated financial statements.
F-12
New Mountain Finance Holdings, L.L.C.
Consolidated Schedule of Investments (continued)
March 31, 2012
(unaudited)
|
|
|
|
|
| |
|
March 31, 2012 |
|
| Investment Type |
|
Percent of
Total
Investments at
Fair
Value |
|
| First lien |
|
|
56.31 |
% |
| Second lien |
|
|
36.31 |
% |
| Subordinated |
|
|
7.00 |
% |
| Equity and other |
|
|
0.38 |
% |
|
|
|
|
|
| Total investments |
|
|
100.00 |
% |
|
|
|
|
|
|
|
|
|
|
| |
|
March 31, 2012 |
|
| Industry Type |
|
Percent of
Total
Investments at
Fair
Value |
|
| Software |
|
|
20.98 |
% |
| Healthcare Services |
|
|
17.96 |
% |
| Education |
|
|
14.02 |
% |
| Business Services |
|
|
12.39 |
% |
| Federal Services |
|
|
9.38 |
% |
| Healthcare Products |
|
|
4.23 |
% |
| Consumer Services |
|
|
3.94 |
% |
| Information Services |
|
|
3.92 |
% |
| Logistics |
|
|
3.22 |
% |
| Industrial Services |
|
|
2.51 |
% |
| Healthcare Information Technology |
|
|
1.84 |
% |
| Energy |
|
|
1.67 |
% |
| Media |
|
|
1.55 |
% |
| Consumer Products |
|
|
0.85 |
% |
| Information Technology |
|
|
0.80 |
% |
| Power Generation |
|
|
0.74 |
% |
|
|
|
|
|
| Total investments |
|
|
100.00 |
% |
|
|
|
|
|
The accompanying
notes are an integral part of these consolidated financial statements.
F-13
New Mountain Finance Holdings, L.L.C.
Consolidated Schedule of Investments
December 31, 2011
|
|
|
|
|
|
|
|
|
|
|
|
|
|
|
|
|
|
|
|
|
|
|
|
|
| Portfolio Company,
Location and Industry |
|
Type of
Investment |
|
Interest Rate |
|
Maturity
Date |
|
|
Principal
Amount,
Par Value
or Shares |
|
|
Cost |
|
|
Fair
Value |
|
|
Percent of
Members’
Capital |
|
| Funded Debt Investments—United States |
|
|
|
|
|
|
|
|
|
|
|
|
|
|
|
|
|
|
|
|
|
|
|
|
| Novell, Inc.
(fka Attachmate Corporation, NetIQ Corporation) |
|
|
|
|
|
|
|
|
|
|
|
|
|
|
|
|
|
|
|
|
|
|
|
|
| Software |
|
First lien(3) |
|
6.50% (Base Rate + 5.00%) |
|
|
4/27/2017 |
|
|
$ |
13,825,000 |
|
|
$ |
13,703,238 |
|
|
$ |
13,583,062 |
|
|
|
|
|
|
|
Second lien(2) |
|
9.50% (Base Rate + 8.00%) |
|
|
10/27/2017 |
|
|
|
20,000,000 |
|
|
|
19,669,018 |
|
|
|
19,200,000 |
|
|
|
|
|
|
|
|
|
|
|
|
|
|
|
|
|
|
|
|
|
|
|
|
|
|
|
|
|
|
|
|
|
|
|
|
|
|
|
|
|
33,825,000 |
|
|
|
33,372,256 |
|
|
|
32,783,062 |
|
|
|
7.80 |
% |
|
|
|
|
|
|
|
|
|
|
|
|
|
|
|
|
|
|
|
|
|
|
|
|
|
| Decision Resources, LLC |
|
|
|
|
|
|
|
|
|
|
|
|
|
|
|
|
|
|
|
|
|
|
|
|
| Business Services |
|
First lien(3) |
|
7.00% (Base Rate + 5.50%) |
|
|
12/28/2016 |
|
|
|
17,820,000 |
|
|
|
17,588,508 |
|
|
|
17,196,300 |
|
|
|
|
|
|
|
Second lien(2) |
|
9.50% (Base Rate + 8.00%) |
|
|
5/7/2018 |
|
|
|
14,500,000 |
|
|
|
14,368,204 |
|
|
|
14,282,500 |
|
|
|
|
|
|
|
|
|
|
|
|
|
|
|
|
|
|
|
|
|
|
|
|
|
|
|
|
|
|
|
|
|
|
|
|
|
|
|
|
|
32,320,000 |
|
|
|
31,956,712 |
|
|
|
31,478,800 |
|
|
|
7.48 |
% |
|
|
|
|
|
|
|
|
|
|
|
|
|
|
|
|
|
|
|
|
|
|
|
|
|
| Lawson Software, Inc. (fka SoftBrands, Inc.) |
|
|
|
|
|
|
|
|
|
|
|
|
|
|
|
|
|
|
|
|
|
|
|
|
| Software |
|
First lien(3) |
|
6.75% (Base Rate + 5.25%) |
|
|
7/5/2017 |
|
|
|
18,703,125 |
|
|
|
18,001,977 |
|
|
|
18,305,684 |
|
|
|
|
|
|
|
Subordinated(2),(7) |
|
11.50% |
|
|
7/15/2018 |
|
|
|
13,500,000 |
|
|
|
12,329,105 |
|
|
|
13,162,500 |
|
|
|
|
|
|
|
|
|
|
|
|
|
|
|
|
|
|
|
|
|
|
|
|
|
|
|
|
|
|
|
|
|
|
|
|
|
|
|
|
|
32,203,125 |
|
|
|
30,331,082 |
|
|
|
31,468,184 |
|
|
|
7.47 |
% |
|
|
|
|
|
|
|
|
|
|
|
|
|
|
|
|
|
|
|
|
|
|
|
|
|
| Meritas Schools Holdings, LLC |
|
|
|
|
|
|
|
|
|
|
|
|
|
|
|
|
|
|
|
|
|
|
|
|
| Education |
|
First lien(3) |
|
7.50% (Base Rate + 6.00%) |
|
|
7/29/2017 |
|
|
|
9,500,000 |
|
|
|
9,409,890 |
|
|
|
9,357,500 |
|
|
|
|
|
|
|
Second lien(2) |
|
11.50% (Base Rate + 10.00%) |
|
|
1/29/2018 |
|
|
|
20,000,000 |
|
|
|
19,712,425 |
|
|
|
19,650,000 |
|
|
|
|
|
|
|
|
|
|
|
|
|
|
|
|
|
|
|
|
|
|
|
|
|
|
|
|
|
|
|
|
|
|
|
|
|
|
|
|
|
29,500,000 |
|
|
|
29,122,315 |
|
|
|
29,007,500 |
|
|
|
6.89 |
% |
|
|
|
|
|
|
|
|
|
|
|
|
|
|
|
|
|
|
|
|
|
|
|
|
|
| Global Knowledge Training LLC |
|
|
|
|
|
|
|
|
|
|
|
|
|
|
|
|
|
|
|
|
|
|
|
|
| Education |
|
First lien(3) |
|
6.50% (Base Rate + 5.00%) |
|
|
4/21/2017 |
|
|
|
4,867,647 |
|
|
|
4,796,665 |
|
|
|
4,794,632 |
|
|
|
|
|
|
|
Second lien(2) |
|
11.50% (Base Rate + 9.75%) |
|
|
10/21/2018 |
|
|
|
24,250,000 |
|
|
|
23,764,101 |
|
|
|
23,755,300 |
|
|
|
|
|
|
|
|
|
|
|
|
|
|
|
|
|
|
|
|
|
|
|
|
|
|
|
|
|
|
|
|
|
|
|
|
|
|
|
|
|
29,117,647 |
|
|
|
28,560,766 |
|
|
|
28,549,932 |
|
|
|
6.79 |
% |
|
|
|
|
|
|
|
|
|
|
|
|
|
|
|
|
|
|
|
|
|
|
|
|
|
| Managed Health Care Associates, Inc. |
|
|
|
|
|
|
|
|
|
|
|
|
|
|
|
|
|
|
|
|
|
|
|
|
| Healthcare Services |
|
First lien(2) |
|
3.55% (Base Rate + 3.25%) |
|
|
8/1/2014 |
|
|
|
15,467,673 |
|
|
|
12,941,252 |
|
|
|
14,462,274 |
|
|
|
|
|
|
|
Second lien(2) |
|
6.80% (Base Rate + 6.50%) |
|
|
2/1/2015 |
|
|
|
15,000,000 |
|
|
|
11,950,542 |
|
|
|
13,950,000 |
|
|
|
|
|
|
|
|
|
|
|
|
|
|
|
|
|
|
|
|
|
|
|
|
|
|
|
|
|
|
|
|
|
|
|
|
|
|
|
|
|
30,467,673 |
|
|
|
24,891,794 |
|
|
|
28,412,274 |
|
|
|
6.76 |
% |
|
|
|
|
|
|
|
|
|
|
|
|
|
|
|
|
|
|
|
|
|
|
|
|
|
| Insight Pharmaceuticals LLC |
|
|
|
|
|
|
|
|
|
|
|
|
|
|
|
|
|
|
|
|
|
|
|
|
| Healthcare Products |
|
Second lien(2) |
|
13.25% (Base Rate + 11.75%) |
|
|
8/25/2017 |
|
|
|
25,000,000 |
|
|
|
24,037,614 |
|
|
|
24,875,000 |
|
|
|
5.92 |
% |
| Renaissance Learning, Inc. |
|
|
|
|
|
|
|
|
|
|
|
|
|
|
|
|
|
|
|
|
|
|
|
|
| Education |
|
Second lien(2) |
|
12.00% (Base Rate + 10.50%) |
|
|
10/19/2018 |
|
|
|
20,000,000 |
|
|
|
19,016,871 |
|
|
|
20,100,000 |
|
|
|
4.78 |
% |
| Learning Care Group (US), Inc. |
|
|
|
|
|
|
|
|
|
|
|
|
|
|
|
|
|
|
|
|
|
|
|
|
| Education |
|
First lien(2) |
|
12.00% |
|
|
4/27/2016 |
|
|
|
17,368,421 |
|
|
|
17,115,609 |
|
|
|
16,695,606 |
|
|
|
|
|
|
|
Subordinated(2) |
|
15.00% PIK* |
|
|
6/30/2016 |
|
|
|
3,273,004 |
|
|
|
3,089,870 |
|
|
|
2,971,990 |
|
|
|
|
|
|
|
|
|
|
|
|
|
|
|
|
|
|
|
|
|
|
|
|
|
|
|
|
|
|
|
|
|
|
|
|
|
|
|
|
|
20,641,425 |
|
|
|
20,205,479 |
|
|
|
19,667,596 |
|
|
|
4.68 |
% |
|
|
|
|
|
|
|
|
|
|
|
|
|
|
|
|
|
|
|
|
|
|
|
|
|
The accompanying
notes are an integral part of these consolidated financial statements.
F-14
New Mountain Finance Holdings, L.L.C.
Consolidated Schedule of Investments (continued)
December 31, 2011
|
|
|
|
|
|
|
|
|
|
|
|
|
|
|
|
|
|
|
|
|
|
|
|
|
| Portfolio Company,
Location and Industry |
|
Type of
Investment |
|
Interest Rate |
|
Maturity
Date |
|
|
Principal
Amount,
Par Value
or Shares |
|
|
Cost |
|
|
Fair
Value |
|
|
Percent of
Members’
Capital |
|
| Transplace Texas, L.P. |
|
|
|
|
|
|
|
|
|
|
|
|
|
|
|
|
|
|
|
|
|
|
|
|
| Logistics |
|
Second lien(2) |
|
11.00% (Base Rate + 9.00%) |
|
|
4/12/2017 |
|
|
$ |
20,000,000 |
|
|
$ |
19,514,617 |
|
|
$ |
19,500,000 |
|
|
|
4.64 |
% |
| U.S. Healthworks Holding Company, Inc. |
|
|
|
|
|
|
|
|
|
|
|
|
|
|
|
|
|
|
|
|
|
|
|
|
| Healthcare Services |
|
Second lien(2) |
|
10.50% (Base Rate + 9.00%) |
|
|
6/15/2017 |
|
|
|
20,000,000 |
|
|
|
19,719,547 |
|
|
|
19,500,000 |
|
|
|
4.64 |
% |
| Unitek Global Services, Inc. |
|
|
|
|
|
|
|
|
|
|
|
|
|
|
|
|
|
|
|
|
|
|
|
|
| Business Services |
|
First lien(2) |
|
9.00% (Base Rate + 7.50%) |
|
|
4/15/2018 |
|
|
|
19,850,000 |
|
|
|
19,312,984 |
|
|
|
19,440,594 |
|
|
|
4.62 |
% |
| Ipreo Holdings LLC |
|
|
|
|
|
|
|
|
|
|
|
|
|
|
|
|
|
|
|
|
|
|
|
|
| Information Services |
|
First lien(3) |
|
8.00% (Base Rate + 6.50%) |
|
|
8/5/2017 |
|
|
|
18,703,125 |
|
|
|
18,308,298 |
|
|
|
18,282,305 |
|
|
|
4.35 |
% |
| KeyPoint Government Solutions, Inc. |
|
|
|
|
|
|
|
|
|
|
|
|
|
|
|
|
|
|
|
|
|
|
|
|
| Federal Services |
|
First lien(2) |
|
10.00% (Base Rate + 8.00%) |
|
|
12/31/2015 |
|
|
|
17,820,000 |
|
|
|
17,521,860 |
|
|
|
17,909,100 |
|
|
|
4.26 |
% |
| Sotera Defense Solutions, Inc. (Global Defense Technology & Systems, Inc.) |
|
|
|
|
|
|
|
|
|
|
|
|
|
|
|
|
|
|
|
|
|
|
|
|
| Federal Services |
|
First lien(3) |
|
7.00% (Base Rate + 5.50%) |
|
|
4/21/2017 |
|
|
|
16,915,000 |
|
|
|
16,764,489 |
|
|
|
16,872,713 |
|
|
|
4.01 |
% |
| SRA International, Inc. |
|
|
|
|
|
|
|
|
|
|
|
|
|
|
|
|
|
|
|
|
|
|
|
|
| Federal Services |
|
First lien(3) |
|
6.50% (Base Rate + 5.25%) |
|
|
7/20/2018 |
|
|
|
17,433,389 |
|
|
|
16,624,324 |
|
|
|
16,416,447 |
|
|
|
3.90 |
% |
| OpenLink International, Inc. |
|
|
|
|
|
|
|
|
|
|
|
|
|
|
|
|
|
|
|
|
|
|
|
|
| Software |
|
First lien(2) |
|
7.75% (Base Rate + 6.25%) |
|
|
10/30/2017 |
|
|
|
15,000,000 |
|
|
|
14,706,514 |
|
|
|
15,056,250 |
|
|
|
3.58 |
% |
| Volume Services America, Inc. (Centerplate) |
|
|
|
|
|
|
|
|
|
|
|
|
|
|
|
|
|
|
|
|
|
|
|
|
| Consumer Services |
|
First lien(2) |
|
10.50% (Base Rate + 8.50%) |
|
|
9/16/2016 |
|
|
|
14,850,000 |
|
|
|
14,512,417 |
|
|
|
14,924,250 |
|
|
|
3.55 |
% |
| SonicWALL, Inc. |
|
|
|
|
|
|
|
|
|
|
|
|
|
|
|
|
|
|
|
|
|
|
|
|
| Software |
|
First lien(3) |
|
8.27% (Base Rate + 6.19%) |
|
|
1/23/2016 |
|
|
|
4,822,985 |
|
|
|
4,831,869 |
|
|
|
4,847,099 |
|
|
|
|
|
|
|
Second lien(2) |
|
12.00% (Base Rate + 10.00%) |
|
|
1/23/2017 |
|
|
|
10,000,000 |
|
|
|
9,746,209 |
|
|
|
9,950,000 |
|
|
|
|
|
|
|
|
|
|
|
|
|
|
|
|
|
|
|
|
|
|
|
|
|
|
|
|
|
|
|
|
|
|
|
|
|
|
|
|
|
14,822,985 |
|
|
|
14,578,078 |
|
|
|
14,797,099 |
|
|
|
3.52 |
% |
|
|
|
|
|
|
|
|
|
|
|
|
|
|
|
|
|
|
|
|
|
|
|
|
|
| PODS, Inc.(6) |
|
|
|
|
|
|
|
|
|
|
|
|
|
|
|
|
|
|
|
|
|
|
|
|
| Consumer Services |
|
|
|
|
|
|
|
|
|
|
|
|
|
|
|
|
|
|
|
|
|
|
|
|
| PODS Funding Corp. II |
|
First lien(2) |
|
8.50% (Base Rate + 7.00%) |
|
|
11/29/2016 |
|
|
|
11,561,538 |
|
|
|
11,218,525 |
|
|
|
11,214,692 |
|
|
|
|
|
| Storapod Holding Company, Inc. |
|
Subordinated(2) |
|
21.00% PIK* |
|
|
11/29/2017 |
|
|
|
3,728,642 |
|
|
|
3,600,214 |
|
|
|
3,599,461 |
|
|
|
|
|
|
|
|
|
|
|
|
|
|
|
|
|
|
|
|
|
|
|
|
|
|
|
|
|
|
|
|
|
|
|
|
|
|
|
|
|
15,290,180 |
|
|
|
14,818,739 |
|
|
|
14,814,153 |
|
|
|
3.52 |
% |
|
|
|
|
|
|
|
|
|
|
|
|
|
|
|
|
|
|
|
|
|
|
|
|
|
| Triple Point Technology, Inc. |
|
|
|
|
|
|
|
|
|
|
|
|
|
|
|
|
|
|
|
|
|
|
|
|
| Software |
|
First lien(3) |
|
8.00% (Base Rate + 6.50%) |
|
|
10/27/2017 |
|
|
|
14,500,000 |
|
|
|
13,932,051 |
|
|
|
14,536,250 |
|
|
|
3.46 |
% |
| Virtual Radiologic Corporation |
|
|
|
|
|
|
|
|
|
|
|
|
|
|
|
|
|
|
|
|
|
|
|
|
| Healthcare Information Technology |
|
First lien(3) |
|
7.75% (Base Rate + 4.50%) |
|
|
12/22/2016 |
|
|
|
14,889,987 |
|
|
|
14,704,271 |
|
|
|
14,108,263 |
|
|
|
3.36 |
% |
| Brock Holdings III, Inc. |
|
|
|
|
|
|
|
|
|
|
|
|
|
|
|
|
|
|
|
|
|
|
|
|
| Industrial Services |
|
Second lien(2) |
|
10.00% (Base Rate + 8.25%) |
|
|
3/16/2018 |
|
|
|
15,000,000 |
|
|
|
14,746,132 |
|
|
|
13,818,750 |
|
|
|
3.29 |
% |
| LANDesk Group, Inc. |
|
|
|
|
|
|
|
|
|
|
|
|
|
|
|
|
|
|
|
|
|
|
|
|
| Software |
|
First lien(3) |
|
7.00% (Base Rate + 5.25%) |
|
|
3/28/2016 |
|
|
|
14,062,500 |
|
|
|
13,828,336 |
|
|
|
13,798,828 |
|
|
|
3.28 |
% |
The accompanying
notes are an integral part of these consolidated financial statements.
F-15
New Mountain Finance Holdings, L.L.C.
Consolidated Schedule of Investments (continued)
December 31, 2011
|
|
|
|
|
|
|
|
|
|
|
|
|
|
|
|
|
|
|
|
|
|
|
|
|
| Portfolio Company,
Location and Industry |
|
Type of
Investment |
|
Interest Rate |
|
Maturity
Date |
|
|
Principal
Amount,
Par Value
or Shares |
|
|
Cost |
|
|
Fair
Value |
|
|
Percent of
Members’
Capital |
|
| Pacific Architects and Engineers Incorporated |
|
|
|
|
|
|
|
|
|
|
|
|
|
|
|
|
|
|
|
|
|
|
|
|
| Federal Services |
|
First lien(3) |
|
7.50% (Base Rate + 6.00%) |
|
|
4/4/2017 |
|
|
|
14,100,000 |
|
|
|
13,848,322 |
|
|
|
13,677,000 |
|
|
|
3.25 |
% |
| Smile Brands Group Inc. |
|
|
|
|
|
|
|
|
|
|
|
|
|
|
|
|
|
|
|
|
|
|
|
|
| Healthcare Services |
|
First lien(3) |
|
7.00% (Base Rate + 5.25%) |
|
|
12/21/2017 |
|
|
$ |
12,337,594 |
|
|
$ |
12,173,547 |
|
|
$ |
12,329,883 |
|
|
|
2.93 |
% |
| Mailsouth, Inc. |
|
|
|
|
|
|
|
|
|
|
|
|
|
|
|
|
|
|
|
|
|
|
|
|
| Media |
|
First lien(3) |
|
6.75% (Base Rate + 4.99%) |
|
|
12/14/2016 |
|
|
|
11,910,000 |
|
|
|
11,756,172 |
|
|
|
11,731,350 |
|
|
|
2.79 |
% |
| Vision Solutions, Inc. |
|
|
|
|
|
|
|
|
|
|
|
|
|
|
|
|
|
|
|
|
|
|
|
|
| Software |
|
Second lien(2) |
|
9.50% (Base Rate + 8.00%) |
|
|
7/23/2017 |
|
|
|
12,000,000 |
|
|
|
11,893,985 |
|
|
|
11,640,000 |
|
|
|
2.77 |
% |
| TravelCLICK, Inc.
(fka TravelCLICK Acquisition Co.) |
|
|
|
|
|
|
|
|
|
|
|
|
|
|
|
|
|
|
|
|
|
|
|
|
| Information Services |
|
First lien(3) |
|
6.50% (Base Rate + 5.00%) |
|
|
3/16/2016 |
|
|
|
11,401,313 |
|
|
|
11,208,577 |
|
|
|
11,344,306 |
|
|
|
2.70 |
% |
| Merrill Communications LLC |
|
|
|
|
|
|
|
|
|
|
|
|
|
|
|
|
|
|
|
|
|
|
|
|
| Business Services |
|
First lien(2) |
|
7.50% (Base Rate + 5.50%) |
|
|
12/24/2012 |
|
|
|
11,421,788 |
|
|
|
10,284,637 |
|
|
|
11,002,985 |
|
|
|
2.62 |
% |
| Brickman Group Holdings, Inc. |
|
|
|
|
|
|
|
|
|
|
|
|
|
|
|
|
|
|
|
|
|
|
|
|
| Business Services |
|
First lien(3) |
|
7.25% (Base Rate + 5.50%) |
|
|
10/14/2016 |
|
|
|
7,957,406 |
|
|
|
8,005,917 |
|
|
|
7,982,272 |
|
|
|
|
|
|
|
Subordinated(2),(7) |
|
9.13% |
|
|
11/1/2018 |
|
|
|
3,000,000 |
|
|
|
2,716,216 |
|
|
|
2,715,000 |
|
|
|
|
|
|
|
|
|
|
|
|
|
|
|
|
|
|
|
|
|
|
|
|
|
|
|
|
|
|
|
|
|
|
|
|
|
|
|
|
|
10,957,406 |
|
|
|
10,722,133 |
|
|
|
10,697,272 |
|
|
|
2.54 |
% |
|
|
|
|
|
|
|
|
|
|
|
|
|
|
|
|
|
|
|
|
|
|
|
|
|
| Immucor, Inc. |
|
|
|
|
|
|
|
|
|
|
|
|
|
|
|
|
|
|
|
|
|
|
|
|
| Healthcare Services |
|
First lien(3) |
|
7.25% (Base Rate + 5.75%) |
|
|
8/19/2018 |
|
|
|
4,987,500 |
|
|
|
4,795,791 |
|
|
|
5,022,826 |
|
|
|
|
|
|
|
Subordinated(2) |
|
11.13% |
|
|
8/15/2019 |
|
|
|
5,000,000 |
|
|
|
4,937,575 |
|
|
|
5,200,000 |
|
|
|
|
|
|
|
|
|
|
|
|
|
|
|
|
|
|
|
|
|
|
|
|
|
|
|
|
|
|
|
|
|
|
|
|
|
|
|
|
|
9,987,500 |
|
|
|
9,733,366 |
|
|
|
10,222,826 |
|
|
|
2.43 |
% |
|
|
|
|
|
|
|
|
|
|
|
|
|
|
|
|
|
|
|
|
|
|
|
|
|
| CHG Companies, Inc. |
|
|
|
|
|
|
|
|
|
|
|
|
|
|
|
|
|
|
|
|
|
|
|
|
| Healthcare Services |
|
Second lien(2) |
|
11.25% (Base Rate + 9.50%) |
|
|
4/7/2017 |
|
|
|
10,000,000 |
|
|
|
9,826,548 |
|
|
|
10,025,000 |
|
|
|
2.38 |
% |
| Vertafore, Inc. |
|
|
|
|
|
|
|
|
|
|
|
|
|
|
|
|
|
|
|
|
|
|
|
|
| Software |
|
Second lien(2) |
|
9.75% (Base Rate + 8.25%) |
|
|
10/29/2017 |
|
|
|
10,000,000 |
|
|
|
9,912,104 |
|
|
|
9,725,000 |
|
|
|
2.31 |
% |
| Merge Healthcare Inc.** |
|
|
|
|
|
|
|
|
|
|
|
|
|
|
|
|
|
|
|
|
|
|
|
|
| Healthcare Services |
|
First lien(2) |
|
11.75% |
|
|
5/1/2015 |
|
|
|
9,000,000 |
|
|
|
8,879,303 |
|
|
|
9,585,000 |
|
|
|
2.28 |
% |
| Porex Corporation |
|
|
|
|
|
|
|
|
|
|
|
|
|
|
|
|
|
|
|
|
|
|
|
|
| Specialty Chemicals and Materials |
|
First lien(3) |
|
6.75% (Base Rate + 5.25%) |
|
|
3/31/2015 |
|
|
|
9,573,968 |
|
|
|
9,449,821 |
|
|
|
9,430,359 |
|
|
|
2.24 |
% |
| Sunquest Information Systems, Inc. (Misys Hospital Systems, Inc.) |
|
|
|
|
|
|
|
|
|
|
|
|
|
|
|
|
|
|
|
|
|
|
|
|
| Healthcare Services |
|
Second lien(2) |
|
9.75% (Base Rate + 8.50%) |
|
|
6/16/2017 |
|
|
|
9,000,000 |
|
|
|
8,840,688 |
|
|
|
8,910,000 |
|
|
|
2.12 |
% |
| Mach Gen, LLC |
|
|
|
|
|
|
|
|
|
|
|
|
|
|
|
|
|
|
|
|
|
|
|
|
| Power Generation |
|
Second lien(2) |
|
8.03% PIK (Base Rate + 7.50%)* |
|
|
2/22/2015 |
|
|
|
12,063,894 |
|
|
|
9,966,951 |
|
|
|
8,609,943 |
|
|
|
2.05 |
% |
| Research Pharmaceutical Services, Inc. |
|
|
|
|
|
|
|
|
|
|
|
|
|
|
|
|
|
|
|
|
|
|
|
|
| Healthcare Services |
|
First lien(3) |
|
6.75% (Base Rate + 5.24%) |
|
|
2/18/2017 |
|
|
|
7,453,125 |
|
|
|
7,354,306 |
|
|
|
7,192,266 |
|
|
|
1.71 |
% |
The accompanying
notes are an integral part of these consolidated financial statements.
F-16
New Mountain Finance Holdings, L.L.C.
Consolidated Schedule of Investments (continued)
December 31, 2011
|
|
|
|
|
|
|
|
|
|
|
|
|
|
|
|
|
|
|
|
|
|
|
|
|
| Portfolio Company,
Location and Industry |
|
Type of
Investment |
|
Interest Rate |
|
Maturity
Date |
|
|
Principal
Amount,
Par Value
or Shares |
|
|
Cost |
|
|
Fair
Value |
|
|
Percent of
Members’
Capital |
|
| Airvana Network Solutions Inc. |
|
|
|
|
|
|
|
|
|
|
|
|
|
|
|
|
|
|
|
|
|
|
|
|
| Software |
|
First lien(2) |
|
10.00% (Base Rate + 8.00%) |
|
|
3/25/2015 |
|
|
|
7,009,524 |
|
|
|
6,895,616 |
|
|
|
7,044,571 |
|
|
|
1.68 |
% |
| Surgery Center Holdings, Inc. |
|
|
|
|
|
|
|
|
|
|
|
|
|
|
|
|
|
|
|
|
|
|
|
|
| Healthcare Services |
|
First lien(3) |
|
6.50% (Base Rate + 5.00%) |
|
|
2/6/2017 |
|
|
|
6,947,500 |
|
|
|
6,916,695 |
|
|
|
6,478,544 |
|
|
|
1.54 |
% |
| Stratus Technologies, Inc. |
|
|
|
|
|
|
|
|
|
|
|
|
|
|
|
|
|
|
|
|
|
|
|
|
| Information Technology |
|
First lien(2) |
|
12.00% |
|
|
3/29/2015 |
|
|
|
6,827,000 |
|
|
|
6,490,139 |
|
|
|
6,212,570 |
|
|
|
1.48 |
% |
| Alion Science and Technology Corporation |
|
|
|
|
|
|
|
|
|
|
|
|
|
|
|
|
|
|
|
|
|
|
|
|
| Federal Services |
|
First lien(2) |
|
10.00% + 2.00% PIK* |
|
|
11/1/2014 |
|
|
$ |
6,195,238 |
|
|
$ |
5,613,308 |
|
|
$ |
5,555,066 |
|
|
|
1.32 |
% |
| Datatel, Inc. |
|
|
|
|
|
|
|
|
|
|
|
|
|
|
|
|
|
|
|
|
|
|
|
|
| Software |
|
Second lien(2) |
|
8.75% (Base Rate + 7.25%) |
|
|
2/19/2018 |
|
|
|
5,000,000 |
|
|
|
4,977,238 |
|
|
|
5,150,000 |
|
|
|
1.22 |
% |
| Ozburn-Hessey Holding Company LLC |
|
|
|
|
|
|
|
|
|
|
|
|
|
|
|
|
|
|
|
|
|
|
|
|
| Logistics |
|
Second lien(2) |
|
11.50% (Base Rate + 9.50%) |
|
|
10/8/2016 |
|
|
|
6,000,000 |
|
|
|
5,892,802 |
|
|
|
5,110,002 |
|
|
|
1.22 |
% |
| Asurion, LLC (fka Asurion Corporation) |
|
|
|
|
|
|
|
|
|
|
|
|
|
|
|
|
|
|
|
|
|
|
|
|
| Business Services |
|
Second lien(2) |
|
9.00% (Base Rate + 7.50%) |
|
|
5/24/2019 |
|
|
|
5,000,000 |
|
|
|
4,976,820 |
|
|
|
4,950,000 |
|
|
|
1.18 |
% |
| Pharmaceutical Product Development, Inc. (Jaguar Holdings, LLC) |
|
|
|
|
|
|
|
|
|
|
|
|
|
|
|
|
|
|
|
|
|
|
|
|
| Healthcare Services |
|
First lien(3) |
|
6.25% (Base Rate + 5.00%) |
|
|
12/5/2018 |
|
|
|
4,894,921 |
|
|
|
4,864,327 |
|
|
|
4,888,802 |
|
|
|
1.16 |
% |
| Fibertech Networks, LLC (fka Firefox Merger Sub, LLC) |
|
|
|
|
|
|
|
|
|
|
|
|
|
|
|
|
|
|
|
|
|
|
|
|
| Telecommunication |
|
First lien(3) |
|
6.75% (Base Rate + 5.00%) |
|
|
11/30/2016 |
|
|
|
4,897,632 |
|
|
|
4,835,069 |
|
|
|
4,873,144 |
|
|
|
1.16 |
% |
| LVI Services Inc. |
|
|
|
|
|
|
|
|
|
|
|
|
|
|
|
|
|
|
|
|
|
|
|
|
| Industrial Services |
|
First lien(2) |
|
9.25% (Base Rate + 7.50%) |
|
|
3/31/2014 |
|
|
|
5,120,334 |
|
|
|
4,474,056 |
|
|
|
3,725,043 |
|
|
|
0.89 |
% |
| ATI Acquisition Company (fka Ability Acquisition, Inc.) |
|
|
|
|
|
|
|
|
|
|
|
|
|
|
|
|
|
|
|
|
|
|
|
|
| Education |
|
First lien(2) |
|
12.25% (Base Rate +
5.00% + 4.00% PIK)(5)* |
|
|
12/30/2014 |
|
|
|
4,477,810 |
|
|
|
4,351,747 |
|
|
|
783,617 |
|
|
|
|
|
|
|
First lien(2) |
|
17.25% (Base Rate + 10.00% + 4.00% PIK)* |
|
|
6/30/2012 |
|
|
|
91,696 |
|
|
|
91,696 |
|
|
|
91,696 |
|
|
|
|
|
|
|
First lien(2) |
|
17.25% (Base Rate + 10.00% + 4.00% PIK)* |
|
|
6/30/2012 |
|
|
|
1,484,370 |
|
|
|
1,484,370 |
|
|
|
1,484,370 |
|
|
|
|
|
|
|
|
|
|
|
|
|
|
|
|
|
|
|
|
|
|
|
|
|
|
|
|
|
|
|
|
|
|
|
|
|
|
|
|
|
6,053,876 |
|
|
|
5,927,813 |
|
|
|
2,359,683 |
|
|
|
0.56 |
% |
|
|
|
|
|
|
|
|
|
|
|
|
|
|
|
|
|
|
|
|
|
|
|
|
|
| Total Funded Debt Investments |
|
|
|
|
|
|
|
|
|
$ |
727,364,649 |
|
|
$ |
702,801,889 |
|
|
$ |
702,587,965 |
|
|
|
167.08 |
% |
|
|
|
|
|
|
|
|
|
|
|
|
|
|
|
|
|
|
|
|
|
|
|
|
|
The accompanying
notes are an integral part of these consolidated financial statements.
F-17
New Mountain Finance Holdings, L.L.C.
Consolidated Schedule of Investments (continued)
December 31, 2011
|
|
|
|
|
|
|
|
|
|
|
|
|
|
|
|
|
|
|
|
|
|
|
|
|
| Portfolio Company,
Location and Industry |
|
Type of
Investment |
|
Interest Rate |
|
Maturity
Date |
|
|
Principal
Amount,
Par Value
or Shares |
|
|
Cost |
|
|
Fair
Value |
|
|
Percent of
Members’
Capital |
|
| Equity—United States |
|
|
|
|
|
|
|
|
|
|
|
|
|
|
|
|
|
|
|
|
|
|
|
|
| Stratus Technologies, Inc. |
|
|
|
|
|
|
|
|
|
|
|
|
|
|
|
|
|
|
|
|
|
|
|
|
| Information Technology |
|
Ordinary shares(2) |
|
— |
|
|
— |
|
|
|
144,270 |
|
|
$ |
65,123 |
|
|
$ |
29,881 |
|
|
|
|
|
|
|
Preferred shares(2) |
|
— |
|
|
— |
|
|
|
32,830 |
|
|
|
14,819 |
|
|
|
6,800 |
|
|
|
|
|
|
|
|
|
|
|
|
|
|
|
|
|
|
|
|
|
|
|
|
|
|
|
|
|
|
|
|
|
|
|
|
|
|
|
|
|
|
|
|
|
79,942 |
|
|
|
36,681 |
|
|
|
0.01 |
% |
|
|
|
|
|
|
|
|
|
|
|
|
|
|
|
|
|
|
|
|
|
|
|
|
|
| Global Knowledge Training LLC |
|
|
|
|
|
|
|
|
|
|
|
|
|
|
|
|
|
|
|
|
|
|
|
|
| Education |
|
Ordinary shares(2) |
|
— |
|
|
— |
|
|
|
2 |
|
|
|
2,109 |
|
|
|
2,109 |
|
|
|
|
|
|
|
Preferred shares(2) |
|
— |
|
|
— |
|
|
|
2,423 |
|
|
|
2,422,891 |
|
|
|
2,422,891 |
|
|
|
|
|
|
|
|
|
|
|
|
|
|
|
|
|
|
|
|
|
|
|
|
|
|
|
|
|
|
|
|
|
|
|
|
|
|
|
|
|
|
|
|
|
2,425,000 |
|
|
|
2,425,000 |
|
|
|
0.58 |
% |
|
|
|
|
|
|
|
|
|
|
|
|
|
|
|
|
|
|
|
|
|
|
|
|
|
| Total Shares |
|
|
|
|
|
|
|
|
|
|
|
|
|
$ |
2,504,942 |
|
|
$ |
2,461,681 |
|
|
|
0.59 |
% |
|
|
|
|
|
|
|
|
|
|
|
|
|
|
|
|
|
|
|
|
|
|
|
|
|
| Warrants—United States |
|
|
|
|
|
|
|
|
|
|
|
|
|
|
|
|
|
|
|
|
|
|
|
|
| Alion Science and Technology Corporation |
|
|
|
|
|
|
|
|
|
|
|
|
|
|
|
|
|
|
|
|
|
|
|
|
| Federal Services |
|
Warrants(2) |
|
— |
|
|
— |
|
|
|
6,000 |
|
|
$ |
292,851 |
|
|
$ |
244,237 |
|
|
|
0.06 |
% |
| PODS, Inc.(6) |
|
|
|
|
|
|
|
|
|
|
|
|
|
|
|
|
|
|
|
|
|
|
|
|
| Storapod Holding Company, Inc. |
|
|
|
|
|
|
|
|
|
|
|
|
|
|
|
|
|
|
|
|
|
|
|
|
| Consumer Services |
|
Warrants(2) |
|
— |
|
|
— |
|
|
|
298,398 |
|
|
|
129,181 |
|
|
|
129,181 |
|
|
|
0.03 |
% |
| Learning Care Group (US), Inc. |
|
|
|
|
|
|
|
|
|
|
|
|
|
|
|
|
|
|
|
|
|
|
|
|
| Education |
|
Warrants(2) |
|
— |
|
|
— |
|
|
|
844 |
|
|
|
193,850 |
|
|
|
14,372 |
|
|
|
0.00 |
% |
|
|
|
|
|
|
|
|
|
|
|
|
|
|
|
|
|
|
|
|
|
|
|
|
|
| Total Warrants |
|
|
|
|
|
|
|
|
|
|
|
|
|
$ |
615,882 |
|
|
$ |
387,790 |
|
|
|
0.09 |
% |
|
|
|
|
|
|
|
|
|
|
|
|
|
|
|
|
|
|
|
|
|
|
|
|
|
| Total Funded Investments |
|
|
|
|
|
|
|
|
|
|
|
|
|
$ |
705,922,713 |
|
|
$ |
705,437,436 |
|
|
|
167.76 |
% |
|
|
|
|
|
|
|
|
|
|
|
|
|
|
|
|
|
|
|
|
|
|
|
|
|
| Unfunded Debt Investments—United States |
|
|
|
|
|
|
|
|
|
|
|
|
|
|
|
|
|
|
|
|
|
|
|
|
| Datatel, Inc. |
|
|
|
|
|
|
|
|
|
|
|
|
|
|
|
|
|
|
|
|
|
|
|
|
| Software |
|
Subordinated—Bridge(1),(2) |
|
— |
|
|
12/13/2012 |
|
|
$ |
20,000,000 |
|
|
$ |
— |
|
|
$ |
— |
|
|
|
0.00 |
% |
| Physio-Control International, Inc. |
|
|
|
|
|
|
|
|
|
|
|
|
|
|
|
|
|
|
|
|
|
|
|
|
| Healthcare Products |
|
First lien—Bridge(1),(2) |
|
— |
|
|
— |
|
|
|
15,000,000 |
|
|
|
— |
|
|
|
— |
|
|
|
0.00 |
% |
| ATI Acquisition Company (fka Ability Acquisition, Inc.) |
|
|
|
|
|
|
|
|
|
|
|
|
|
|
|
|
|
|
|
|
|
|
|
|
| Education |
|
First lien(1),(2)—Undrawn |
|
— |
|
|
1/1/2012 |
|
|
|
39,947 |
|
|
|
— |
|
|
|
— |
|
|
|
|
|
|
|
First lien(1),(2)—Undrawn |
|
— |
|
|
1/1/2012 |
|
|
|
865 |
|
|
|
— |
|
|
|
— |
|
|
|
|
|
|
|
|
|
|
|
|
|
|
|
|
|
|
|
|
|
|
|
|
|
|
|
|
|
|
|
|
|
|
|
|
|
|
|
|
|
40,812 |
|
|
|
— |
|
|
|
— |
|
|
|
0.00 |
% |
|
|
|
|
|
|
|
|
|
|
|
|
|
|
|
|
|
|
|
|
|
|
|
|
|
| PODS, Inc.(6) |
|
|
|
|
|
|
|
|
|
|
|
|
|
|
|
|
|
|
|
|
|
|
|
|
| Consumer Services |
|
|
|
|
|
|
|
|
|
|
|
|
|
|
|
|
|
|
|
|
|
|
|
|
| PODS Funding Corp. II |
|
First lien(1),(2)—Undrawn |
|
— |
|
|
11/29/2016 |
|
|
|
3,438,462 |
|
|
|
(103,154 |
) |
|
|
(103,154 |
) |
|
|
|
|
| Storapod Holding Company, Inc. |
|
Subordinated(1),(2)—Undrawn |
|
— |
|
|
11/29/2017 |
|
|
|
771,358 |
|
|
|
— |
|
|
|
— |
|
|
|
|
|
|
|
|
|
|
|
|
|
|
|
|
|
|
|
|
|
|
|
|
|
|
|
|
|
|
|
|
|
|
|
|
|
|
|
|
|
4,209,820 |
|
|
|
(103,154 |
) |
|
|
(103,154 |
) |
|
|
(0.03 |
)% |
|
|
|
|
|
|
|
|
|
|
|
|
|
|
|
|
|
|
|
|
|
|
|
|
|
The accompanying
notes are an integral part of these consolidated financial statements.
F-18
New Mountain Finance Holdings, L.L.C.
Consolidated Schedule of Investments (continued)
December 31, 2011
|
|
|
|
|
|
|
|
|
|
|
|
|
|
|
|
|
|
|
|
|
|
|
|
|
| Portfolio Company,
Location and Industry |
|
Type of
Investment |
|
Interest Rate |
|
Maturity
Date |
|
|
Principal
Amount,
Par Value
or Shares |
|
|
Cost |
|
|
Fair
Value |
|
|
Percent of
Members’
Capital |
|
| RGIS Services, LLC |
|
|
|
|
|
|
|
|
|
|
|
|
|
|
|
|
|
|
|
|
|
|
|
|
| Business Services |
|
First lien(2),(4)—Undrawn |
|
— |
|
|
4/30/2013 |
|
|
|
5,000,000 |
|
|
|
(2,850,000 |
) |
|
|
(293,850 |
) |
|
|
(0.07 |
)% |
| Education Management LLC** |
|
|
|
|
|
|
|
|
|
|
|
|
|
|
|
|
|
|
|
|
|
|
|
|
| Education |
|
First lien(2),(4)—Undrawn |
|
— |
|
|
6/1/2012 |
|
|
|
3,000,000 |
|
|
|
(1,215,000 |
) |
|
|
(330,000 |
) |
|
|
(0.08 |
)% |
| Kronos Incorporated |
|
|
|
|
|
|
|
|
|
|
|
|
|
|
|
|
|
|
|
|
|
|
|
|
| Software |
|
First lien(2),(4)—Undrawn |
|
— |
|
|
6/11/2013 |
|
|
$ |
4,198,500 |
|
|
$ |
(629,775 |
) |
|
$ |
(356,872 |
) |
|
|
(0.08 |
)% |
| Advantage Sales & Marketing Inc. |
|
|
|
|
|
|
|
|
|
|
|
|
|
|
|
|
|
|
|
|
|
|
|
|
| Business Services |
|
First lien(2),(4)—Undrawn |
|
— |
|
|
12/17/2015 |
|
|
|
10,500,000 |
|
|
|
(1,260,000 |
) |
|
|
(840,000 |
) |
|
|
(0.20 |
)% |
|
|
|
|
|
|
|
|
|
|
|
|
|
|
|
|
|
|
|
|
|
|
|
|
|
| Total Unfunded Debt Investments |
|
|
|
|
|
|
|
|
|
$ |
61,949,132 |
|
|
$ |
(6,057,929 |
) |
|
$ |
(1,923,876 |
) |
|
|
(0.46 |
)% |
|
|
|
|
|
|
|
|
|
|
|
|
|
|
|
|
|
|
|
|
|
|
|
|
|
| Total Investments |
|
|
|
|
|
|
|
|
|
|
|
|
|
$ |
699,864,784 |
|
|
$ |
703,513,560 |
|
|
|
167.30 |
% |
|
|
|
|
|
|
|
|
|
|
|
|
|
|
|
|
|
|
|
|
|
|
|
|
|
| (1) |
Par Value amounts represent the drawn or undrawn (as indicated in type of investment) portion of the bridge facility, delayed draw or other future funding commitments.
|
| (2) |
The Holdings Credit Facility is collateralized by the indicated investments. |
| (3) |
The SLF Credit Facility is collateralized by the indicated investments. |
| (4) |
Par Value amounts represent the drawn or undrawn (as indicated in type of investment) portion of revolving credit facilities. Cost amounts represent the cash received at
settlement date net the impact of paydowns and cash paid for drawn revolvers. |
| (5) |
Investment is on non-accrual status. |
| (6) |
New Mountain Finance Holdings, L.L.C. (“NMF Holdings”) holds investments in two related entities of PODS, Inc. NMF Holdings directly holds warrants in Storapod
Holding Company, Inc. (“Storapod”) and has a credit investment in Storapod through Storapod WCF II Limited (“Storapod WCF II”). Storapod WCF II is a special purpose entity used to enter into a Shari’ah- compliant
financing arrangement with Storapod. Additionally, NMF Holdings has a credit investment in PODS Funding Corp. II (“PODS II”). PODS, Inc. is a wholly-owned subsidiary of PODS Holding, Inc., which in turn is a majority- owned
subsidiary of Storapod. PODS II is a special purpose entity used to enter into a Shari’ah-compliant financing arrangement with PODS, Inc. and its subsidiary, PODS Enterprises, Inc. |
| (7) |
Securities are exempt from registration under Rule 144A of the Securities Act of 1933. These securities are considered liquid and may be resold in transactions exempt from
registration to qualified institutional buyers. At December 31, 2011, the aggregate market value of these securities amounted to $15,877,500 or 3.78% of members’ capital. |
| * |
All or a portion of interest contains payments-in-kind (“PIK”). |
| ** |
Indicates assets that NMF Holdings deems to be “non-qualifying assets” under Section 55(a) of the Investment Company Act of 1940, as amended. Qualifying assets
must represent at least 70.00% of NMF Holdings’ total assets at the time of acquisition of any additional non-qualifying assets. |
The accompanying
notes are an integral part of these consolidated financial statements.
F-19
New Mountain Finance Holdings, L.L.C.
Consolidated Schedule of Investments (continued)
December 31, 2011
|
|
|
|
|
| |
|
December 31, 2011 |
|
| Investment Type |
|
Percent of
Total
Investments at
Fair Value |
|
| First lien |
|
|
58.32 |
% |
| Second lien |
|
|
37.34 |
% |
| Subordinated |
|
|
3.93 |
% |
| Equity and other |
|
|
0.41 |
% |
|
|
|
|
|
| Total investments |
|
|
100.00 |
% |
|
|
|
|
|
|
|
| |
|
December 31, 2011 |
|
| Industry Type |
|
Percent of
Total
Investments at
Fair Value |
|
| Software |
|
|
22.12 |
% |
| Healthcare Services |
|
|
16.71 |
% |
| Education |
|
|
14.47 |
% |
| Business Services |
|
|
10.86 |
% |
| Federal Services |
|
|
10.05 |
% |
| Consumer Services |
|
|
4.23 |
% |
| Information Services |
|
|
4.21 |
% |
| Healthcare Products |
|
|
3.54 |
% |
| Logistics |
|
|
3.50 |
% |
| Industrial Services |
|
|
2.49 |
% |
| Healthcare Information Technology |
|
|
2.01 |
% |
| Media |
|
|
1.67 |
% |
| Specialty Chemicals and Materials |
|
|
1.34 |
% |
| Power Generation |
|
|
1.22 |
% |
| Information Technology |
|
|
0.89 |
% |
| Telecommunication |
|
|
0.69 |
% |
|
|
|
|
|
| Total investments |
|
|
100.00 |
% |
|
|
|
|
|
The accompanying
notes are an integral part of these consolidated financial statements.
F-20
New Mountain Finance Corporation
Statement of Assets and Liabilities
|
|
|
|
|
|
|
|
|
| |
|
March 31, 2012 |
|
|
December 31, 2011 |
|
| |
|
(unaudited) |
|
|
|
|
| Assets |
|
|
|
|
|
|
|
|
| Investment in New Mountain Finance Holdings, L.L.C., at fair value (cost of $144,355,856 and $144,355,856,
respectively) |
|
$ |
150,251,855 |
|
|
$ |
145,486,821 |
|
|
|
|
|
|
|
|
|
|
| Total assets |
|
$ |
150,251,855 |
|
|
$ |
145,486,821 |
|
|
|
|
|
|
|
|
|
|
| Net assets |
|
|
|
|
|
|
|
|
| Common stock, par value $0.01 per share 10,697,691 shares issued and outstanding |
|
|
106,977 |
|
|
|
106,977 |
|
| Paid in capital in excess of par |
|
|
144,248,879 |
|
|
|
144,248,879 |
|
| Undistributed net investment income |
|
|
6,460 |
|
|
|
— |
|
| Accumulated undistributed realized gains |
|
|
634,827 |
|
|
|
286,307 |
|
| Net unrealized appreciation (depreciation) |
|
|
5,254,712 |
|
|
|
844,658 |
|
|
|
|
|
|
|
|
|
|
| Total net assets |
|
$ |
150,251,855 |
|
|
$ |
145,486,821 |
|
|
|
|
|
|
|
|
|
|
| Number of shares outstanding |
|
|
10,697,691 |
|
|
|
10,697,691 |
|
| Net asset value per share |
|
$ |
14.05 |
|
|
$ |
13.60 |
|
The accompanying notes are an integral part of these financial statements.
F-21
New Mountain Finance Corporation
Statement of Operations
Three months ended March 31, 2012(a)
(unaudited)
|
|
|
|
|
| Net investment income allocated from New Mountain Finance Holdings, L.L.C. |
|
|
|
|
| Interest income |
|
$ |
6,435,708 |
|
| Other income |
|
|
145,596 |
|
| Total expenses |
|
|
(3,151,583 |
) |
|
|
|
|
|
| Net investment income allocated from New Mountain Finance Holdings, L.L.C. |
|
|
3,429,721 |
|
| Realized and unrealized gain (loss) allocated from New Mountain Finance Holdings, L.L.C. |
|
|
|
|
| Realized gains on investments |
|
|
348,520 |
|
| Net change in unrealized appreciation (depreciation) of investments |
|
|
4,410,054 |
|
|
|
|
|
|
| Realized and unrealized gain (loss) allocated from New Mountain Finance Holdings, L.L.C. |
|
|
4,758,574 |
|
|
|
|
|
|
| Total net increase in net assets resulting from operations allocated from New Mountain Finance Holdings, L.L.C. |
|
|
8,188,295 |
|
|
|
|
|
|
| Net increase in net assets resulting from operations |
|
$ |
8,188,295 |
|
|
|
|
|
|
| Basic earnings per share |
|
$ |
0.77 |
|
| Weighted average shares of common stock outstanding—basic (See Note 11) |
|
|
10,697,691 |
|
| Diluted earnings per share |
|
$ |
0.77 |
|
| Weighted average shares of common stock outstanding—diluted (See Note 11) |
|
|
30,919,629 |
|
| (a) |
Fund commenced operations on May 19, 2011. |
The accompanying notes are an integral part of these financial statements.
F-22
New Mountain Finance Corporation
Statement of Changes in Net Assets
Three months ended March 31, 2012(a)
(unaudited)
|
|
|
|
|
| Increase (decrease) in net assets resulting from operations allocated from New Mountain Finance Holdings, L.L.C.: |
|
|
|
|
| Net investment income |
|
$ |
3,429,721 |
|
| Realized gains on investments |
|
|
348,520 |
|
| Net change in unrealized appreciation (depreciation) of investments |
|
|
4,410,054 |
|
|
|
|
|
|
| Total net increase in net assets resulting from operations allocated from New Mountain Finance Holdings, L.L.C. |
|
|
8,188,295 |
|
|
|
|
|
|
| Total net increase in net assets resulting from operations |
|
|
8,188,295 |
|
|
|
|
|
|
| Capital transactions |
|
|
|
|
| Dividends declared |
|
|
(3,423,261 |
) |
|
|
|
|
|
| Total net decrease in net assets resulting from capital transactions |
|
|
(3,423,261 |
) |
|
|
|
|
|
| Net increase in net assets |
|
|
4,765,034 |
|
| Net assets at beginning of period |
|
|
145,486,821 |
|
|
|
|
|
|
| Net assets at end of period |
|
$ |
150,251,855 |
|
|
|
|
|
|
| (a) |
Fund commenced operations on May 19, 2011. |
The accompanying notes are an integral part of these financial statements.
F-23
New Mountain Finance Corporation
Statement of Cash Flows
Three months ended March 31, 2012(a)
(unaudited)
|
|
|
|
|
| Cash flows from operating activities: |
|
|
|
|
| Net increase in net assets resulting from operations |
|
$ |
8,188,295 |
|
| Adjustments to reconcile net (increase) decrease in net assets resulting from operations to net cash (used in) provided by operating
activities: |
|
|
|
|
| Net investment income allocated from New Mountain Finance Holdings, L.L.C. |
|
|
(3,429,721 |
) |
| Realized and unrealized gains allocated from New Mountain Finance Holdings, L.L.C. |
|
|
(4,758,574 |
) |
| (Increase) decrease in operating assets: |
|
|
|
|
| Distribution from New Mountain Finance Holdings, L.L.C. |
|
|
3,423,261 |
|
|
|
|
|
|
| Net cash flows (used in) provided by operating activities |
|
|
3,423,261 |
|
|
|
|
|
|
| Cash flows from financing activities: |
|
|
|
|
| Dividends paid |
|
|
(3,423,261 |
) |
|
|
|
|
|
| Net cash flows provided by financing activities |
|
|
(3,423,261 |
) |
|
|
|
|
|
| Net increase (decrease) in cash and cash equivalents |
|
|
— |
|
| Cash and cash equivalents at the beginning of the period |
|
|
— |
|
|
|
|
|
|
| Cash and cash equivalents at the end of the period |
|
$ |
— |
|
|
|
|
|
|
| (a) |
Fund commenced operations on May 19, 2011. |
The accompanying notes are an integral part of these financial statements.
F-24
New Mountain Finance AIV Holdings Corporation
Statement of Assets and Liabilities
|
|
|
|
|
|
|
|
|
| |
|
March 31, 2012 |
|
|
December 31, 2011 |
|
| |
|
(unaudited) |
|
|
|
|
| Assets |
|
|
|
|
|
|
|
|
| Investment in New Mountain Finance Holdings, L.L.C., at fair value (cost of $290,847,952 and $290,847,952,
respectively) |
|
$ |
284,022,383 |
|
|
$ |
275,014,997 |
|
| Distribution receivable from New Mountain Finance Holdings, L.L.C. |
|
|
6,471,020 |
|
|
|
— |
|
|
|
|
|
|
|
|
|
|
| Total assets |
|
$ |
290,493,403 |
|
|
$ |
275,014,997 |
|
|
|
|
|
|
|
|
|
|
| Liabilities |
|
|
|
|
|
|
|
|
| Dividends payable |
|
|
6,471,020 |
|
|
|
— |
|
|
|
|
|
|
|
|
|
|
| Total liabilities |
|
|
6,471,020 |
|
|
|
— |
|
| Net assets |
|
|
|
|
|
|
|
|
| Common stock, par value $0.01 per share 100 shares issued and outstanding |
|
|
1 |
|
|
|
1 |
|
| Paid in capital in excess of par |
|
|
292,383,201 |
|
|
|
292,383,201 |
|
| Undistributed net investment income |
|
|
12,212 |
|
|
|
— |
|
| Distributions in excess of net realized gains |
|
|
(335,221 |
) |
|
|
(994,034 |
) |
| Net unrealized (depreciation) appreciation |
|
|
(8,037,810 |
) |
|
|
(16,374,171 |
) |
|
|
|
|
|
|
|
|
|
| Total net assets |
|
|
284,022,383 |
|
|
|
275,014,997 |
|
|
|
|
|
|
|
|
|
|
| Total liabilities and net assets |
|
$ |
290,493,403 |
|
|
$ |
275,014,997 |
|
|
|
|
|
|
|
|
|
|
The accompanying notes are an integral part of these financial statements.
F-25
New Mountain Finance AIV Holdings Corporation
Statement of Operations
Three months ended March 31, 2012(a)
(unaudited)
|
|
|
|
|
| Net investment income allocated from New Mountain Finance Holdings, L.L.C. |
|
|
|
|
| Interest income |
|
$ |
12,165,475 |
|
| Other income |
|
|
275,222 |
|
| Total expenses |
|
|
(5,957,465 |
) |
|
|
|
|
|
| Net investment income allocated from New Mountain Finance Holdings, L.L.C. |
|
|
6,483,232 |
|
| Realized and unrealized gain (loss) allocated from New Mountain Finance Holdings, L.L.C. |
|
|
|
|
| Realized gains on investments |
|
|
658,813 |
|
| Net change in unrealized appreciation (depreciation) of investments |
|
|
8,336,361 |
|
|
|
|
|
|
| Realized and unrealized gain (loss) allocated from New Mountain Finance Holdings, L.L.C. |
|
|
8,995,174 |
|
|
|
|
|
|
| Total net increase in net assets resulting from operations allocated from New Mountain Finance Holdings, L.L.C. |
|
|
15,478,406 |
|
|
|
|
|
|
| Net increase in net assets resulting from operations |
|
$ |
15,478,406 |
|
|
|
|
|
|
| (a) |
Fund commenced operations on May 19, 2011. |
The accompanying notes are an integral part of these financial statements.
F-26
New Mountain Finance AIV Holdings Corporation
Statement of Changes in Net Assets
Three months ended March 31, 2012(a)
(unaudited)
|
|
|
|
|
| Increase (decrease) in net assets resulting from operations allocated from New Mountain Finance
Holdings, L.L.C.: |
|
|
|
|
| Net investment income |
|
$ |
6,483,232 |
|
| Realized gains on investments |
|
|
658,813 |
|
| Net change in unrealized appreciation (depreciation) of investments |
|
|
8,336,361 |
|
|
|
|
|
|
| Total net increase in net assets resulting from operations allocated from New Mountain Finance Holdings, L.L.C. |
|
|
15,478,406 |
|
|
|
|
|
|
| Net increase in net assets resulting from operations |
|
|
15,478,406 |
|
|
|
|
|
|
| Capital transactions |
|
|
|
|
| Dividends declared |
|
|
(6,471,020 |
) |
|
|
|
|
|
| Total net decrease in net assets resulting from capital transactions |
|
|
(6,471,020 |
) |
|
|
|
|
|
| Net increase in net assets |
|
|
9,007,386 |
|
| Net assets at beginning of period |
|
|
275,014,997 |
|
|
|
|
|
|
| Net assets at end of period |
|
$ |
284,022,383 |
|
|
|
|
|
|
| (a) |
Fund commenced operations on May 19, 2011. |
The accompanying notes are an integral part of these financial statements.
F-27
New Mountain Finance AIV Holdings Corporation
Statement of Cash Flows
Three months ended March 31, 2012(a)
(unaudited)
|
|
|
|
|
| Cash flows from operating activities: |
|
|
|
|
| Net increase in net assets resulting from operations |
|
$ |
15,478,406 |
|
| Adjustments to reconcile net (increase) decrease in net assets resulting from operations to net cash (used in) provided by operating
activities: |
|
|
|
|
| Net investment income allocated from New Mountain Finance Holdings, L.L.C. |
|
|
(6,483,232 |
) |
| Realized and unrealized gains allocated from New Mountain Finance Holdings, L.L.C. |
|
|
(8,995,174 |
) |
|
|
|
|
|
| Net cash flows (used in) provided by operating activities |
|
|
— |
|
|
|
|
|
|
| Net increase (decrease) in cash and cash equivalents |
|
|
— |
|
| Cash and cash equivalents at the beginning of the period |
|
|
— |
|
|
|
|
|
|
| Cash and cash equivalents at the end of the period |
|
$ |
— |
|
|
|
|
|
|
| Non-cash operating activities: |
|
|
|
|
| Distribution receivable from New Mountain Finance Holdings, L.L.C. |
|
$ |
6,471,020 |
|
| Non-cash financing activities: |
|
|
|
|
| Dividends declared and payable |
|
$ |
(6,471,020 |
) |
| (a) |
Fund commenced operations on May 19, 2011. |
The accompanying notes are an integral part of these financial statements.
F-28
Combined Notes to the Consolidated Financial Statements of
New Mountain Finance Holdings, L.L.C.,
the Financial Statements of New Mountain Finance Corporation, and the Financial Statements
of New Mountain Finance AIV Holdings Corporation
March 31, 2012
(unaudited)
The information in these combined notes to the financial statements relates to each of the three separate registrants: New Mountain Finance
Holdings, L.L.C., New Mountain Finance Corporation and New Mountain Finance AIV Holdings Corporation (collectively, the “Companies”). Information that relates to an individual registrant will be specifically referenced by the respective
company. None of the Companies makes any representation as to the information related solely to the other registrants other than itself.
Note 1. Formation and Business Purpose
New Mountain Finance Holdings, L.L.C. (“NMF Holdings”, the “Operating Company” or the “Master Fund”) is a Delaware
limited liability company. NMF Holdings is externally managed and has elected to be treated as a business development company (“BDC”) under the Investment Company Act of 1940, as amended (the “1940 Act”). As such, NMF Holdings is
obligated to comply with certain regulatory requirements. NMF Holdings intends to be treated as a partnership for federal income tax purposes for so long as it has at least two members.
NMF Holdings is externally managed by New Mountain Finance Advisers BDC, L.L.C. (the “Investment Adviser”). New Mountain Finance
Administration, L.L.C. (the “Administrator”) provides the administrative services necessary for operations. The Investment Adviser and Administrator are wholly-owned subsidiaries of New Mountain Capital (defined as New Mountain Capital
Group, L.L.C. and its affiliates). New Mountain Capital is a firm with a track record of investing in the middle market and with assets under management (which includes amounts committed, not all of which have been drawn down and invested to date)
totaling approximately $9.0 billion as of March 31, 2012. New Mountain Capital focuses on investing in defensive growth companies across its private equity, public equity, and credit investment vehicles. NMF Holdings, formerly known as New
Mountain Guardian (Leveraged), L.L.C., was originally formed as a subsidiary of New Mountain Guardian AIV, L.P. (“Guardian AIV”) by New Mountain Capital in October 2008. Guardian AIV was formed through an allocation of
approximately $300.0 million of the $5.1 billion of commitments supporting New Mountain Partners III, L.P., a private equity fund managed by New Mountain Capital. In February 2009, New Mountain Capital formed a co-investment
vehicle, New Mountain Guardian Partners, L.P., comprising $20.4 million of commitments. New Mountain Guardian (Leveraged), L.L.C. and New Mountain Guardian Partners, L.P., together with their respective direct and indirect
wholly-owned subsidiaries, are defined as the “Predecessor Entities”.
New Mountain Finance Corporation (“NMFC”) is
a Delaware corporation that was originally incorporated on June 29, 2010. NMFC is a closed-end, non-diversified management investment company that has elected to be treated as a BDC under the 1940 Act. As such, NMFC is obligated to comply with
certain regulatory requirements. NMFC intends to be treated, and intends to comply with the requirements to qualify annually, as a regulated investment company (“RIC”) under Subchapter M of the Internal Revenue Code of 1986, as
amended, (the “Code”) commencing with its taxable year ended December 31, 2011.
New Mountain Finance AIV Holdings
Corporation (“AIV Holdings”) is a Delaware corporation that was originally incorporated on March 11, 2011. Guardian AIV, a Delaware limited partnership, is AIV Holdings’ sole stockholder. AIV Holdings is a closed-end,
non-diversified management investment company that has elected to be treated as a BDC under the 1940 Act. As such, AIV Holdings is obligated to comply with certain regulatory requirements. AIV Holdings intends to be treated, and intends to comply
with the requirements to qualify annually, as a RIC under the Code commencing with its taxable year ended December 31, 2011.
F-29
Combined Notes to the Consolidated Financial Statements of
New Mountain Finance Holdings, L.L.C.,
the Financial Statements of New Mountain Finance Corporation, and the Financial Statements
of New Mountain Finance AIV Holdings Corporation (continued)
On May 19, 2011, NMFC priced its initial public offering (the “IPO”) of 7,272,727
shares of common stock at a public offering price of $13.75 per share. Concurrently with the closing of the IPO and at the public offering price of $13.75 per share, NMFC sold an additional 2,172,000 shares of its common stock to certain executives
and employees of, and other individuals affiliated with, New Mountain Capital in a concurrent private placement (the “Concurrent Private Placement”). Additionally, 1,252,964 shares were issued to the limited partners of New Mountain
Guardian Partners, L.P. at that time for their ownership interest in the Predecessor Entities. In connection with NMFC’s IPO and through a series of transactions, NMF Holdings owns all of the operations of the Predecessor Entities,
including all of the assets and liabilities related to such operations.
NMFC and AIV Holdings are holding companies with no direct
operations of their own, and their sole asset is their ownership in NMF Holdings. NMFC and AIV Holdings each entered into a joinder agreement with respect to the Limited Liability Company Agreement, as amended and restated, of NMF Holdings, pursuant
to which NMFC and AIV Holdings were admitted as members of NMF Holdings. NMFC acquired from NMF Holdings, with the gross proceeds of the IPO and the Concurrent Private Placement, common membership units (“units”) of NMF Holdings (the
number of units are equal to the number of shares of NMFC’s common stock sold in the IPO and the Concurrent Private Placement). Additionally, NMFC received units of NMF Holdings equal to the number of shares of common stock of NMFC issued to
the limited partners of New Mountain Guardian Partners, L.P. Guardian AIV was the parent of NMF Holdings prior to the IPO and, as a result of the transactions completed in connection with the IPO, obtained units in NMF Holdings. Guardian AIV
contributed its units in NMF Holdings to its newly formed subsidiary, AIV Holdings, in exchange for common stock of AIV Holdings. AIV Holdings has the right to exchange all or any portion of its units in NMF Holdings for shares of NMFC’s common
stock on a one-for-one basis.
As of March 31, 2012, NMFC and AIV Holdings own approximately 34.6% and 65.4%, respectively, of the
units of NMF Holdings.
The current structure was designed to generally prevent NMFC from being allocated taxable income with respect to
unrecognized gains that existed at the time of the IPO in the Predecessor Entities’ assets, and rather such amounts would be allocated generally to AIV Holdings. The result is that any distributions made to NMFC’s stockholders that are
attributable to such gains generally will not be treated as taxable dividends but rather as return of capital.
F-30
Combined Notes to the Consolidated Financial Statements of
New Mountain Finance Holdings, L.L.C.,
the Financial Statements of New Mountain Finance Corporation, and the Financial Statements
of New Mountain Finance AIV Holdings Corporation (continued)
The diagram below depicts the Companies’ current organizational structure.

NMF Holdings’ investment objective is to generate current income and capital appreciation through the
sourcing and origination of debt securities at all levels of the capital structure, including first and second lien debt, notes, bonds and mezzanine securities. In some cases, NMF Holdings’ investments may also include equity interests. The
primary focus is in the debt of defensive growth companies, which are defined as generally exhibiting the following characteristics: (i) sustainable secular growth drivers, (ii) high barriers to competitive entry, (iii) high free cash
flow after capital expenditure and working capital needs, (iv) high returns on assets and (v) opportunities for niche market dominance.
F-31
Combined Notes to the Consolidated Financial Statements of
New Mountain Finance Holdings, L.L.C.,
the Financial Statements of New Mountain Finance Corporation, and the Financial Statements
of New Mountain Finance AIV Holdings Corporation (continued)
Note 2. Summary of Significant Accounting Policies
Basis of accounting—The Companies’ financial statements have been prepared in conformity with accounting principles
generally accepted in the United States of America (“GAAP”). NMF Holdings consolidates its wholly-owned subsidiary, New Mountain Finance SPV Funding, L.L.C. (“NMF SLF”). NMFC and AIV Holdings do not consolidate the Operating
Company. NMFC and AIV Holdings apply investment company master-feeder financial statement presentation, as described in Accounting Standards Codification 946, Financial Services—Investment Companies, (“ASC 946”) to their
interest in the Operating Company. NMFC and AIV Holdings observe that it is industry practice to follow the presentation prescribed for a Master Fund-Feeder fund structure in ASC 946 in instances in which a Master Fund is owned by more than one
feeder fund and that such presentation provides stockholders of NMFC and AIV Holdings with a clearer depiction of their investment in the Master Fund.
The Companies’ financial statements reflect all adjustments and reclassifications which, in the opinion of management, are necessary for the fair presentation of the results of operations and financial
condition for all periods presented. All intercompany transactions have been eliminated. Revenues are recognized when earned and expenses when incurred. The financial results of the Operating Company’s portfolio investments are not consolidated
in the financial statements. Prior to the IPO, an affiliate of the Predecessor Entities paid a majority of the management and incentive fees. Historical operating expenses do not reflect the allocation of certain professional fees, administrative
and other expenses that have been incurred following the completion of the IPO. Accordingly, the Operating Company’s historical operating expenses are not comparable to its operating expenses after the completion of the IPO.
The Companies’ interim financial statements are prepared in accordance with GAAP for interim financial information and pursuant to the
requirements for reporting on Form 10-Q and Articles 6 or 10 of Regulation S-X. Accordingly, the Companies’ interim financial statements do not include all of the information and notes required by GAAP for annual financial statements. In
the opinion of management, all adjustments, consisting solely of normal recurring accruals considered necessary for the fair presentation of financial statements for the interim period, have been included. The current period’s results of
operations will not necessarily be indicative of results that ultimately may be achieved for the fiscal year ending December 31, 2012.
Investments—The Operating Company applies fair value accounting in accordance with GAAP. Fair value is the amount that would be received to sell an asset or paid to transfer a liability in an
orderly transaction between market participants at the measurement date. Investments are reflected on the Operating Company’s Consolidated Statements of Assets, Liabilities and Members’ Capital at fair value, with changes in unrealized
gains and losses resulting from changes in fair value reflected in the Operating Company’s Consolidated Statements of Operations as “Net change in unrealized appreciation (depreciation) of investments” and realizations on portfolio
investments reflected in the Operating Company’s Consolidated Statements of Operations as “Realized gains (losses) on investments”.
The Operating Company values its assets on a quarterly basis, or more frequently if required under the 1940 Act. In all cases, the Operating Company’s board of directors is ultimately and solely responsible
for determining the fair value of the portfolio investments on a quarterly basis in good faith, including investments that are not publicly traded, those whose market prices are not readily available
F-32
Combined Notes to the Consolidated Financial Statements of
New Mountain Finance Holdings, L.L.C.,
the Financial Statements of New Mountain Finance Corporation, and the Financial Statements
of New Mountain Finance AIV Holdings Corporation (continued)
and any other situation where its portfolio investments require a fair value determination. Security transactions are accounted for on a trade date basis. The Operating Company’s quarterly
valuation procedures are set forth in more detail below:
(1) Investments for which market quotations are readily
available on an exchange are valued at such market quotations based on the closing price indicated from independent pricing services.
(2) Investments for which indicative prices are obtained from various pricing services and/or brokers or dealers are valued through a multi-step valuation process, as described below, to determine whether the
quote(s) obtained is representative of fair value in accordance with GAAP.
a. Bond quotes are obtained through
independent pricing services. Analytics are performed by the investment professionals of the Investment Adviser to ensure that the quote obtained is representative of fair value in accordance with GAAP and if so, the quote is used. If the Investment
Adviser is unable to sufficiently validate the quote(s) internally and if the investment’s par value exceeds the materiality threshold, the investment is valued similarly to those assets with no readily available quotes (see
(3) below); and
b. For investments other than bonds, the Operating Company looks at the number of quotes readily
available and performs the following:
i. Investments for which more than two quotes are received from a pricing service
are valued using the mean of the mean of the bid and ask of the quotes obtained;
ii. Investments for which one or two
quotes are received from a pricing service are validated internally. The investment professionals of the Investment Adviser analyze the market quotes obtained using an array of valuation methods (further described below) to validate the fair value.
If the Investment Adviser is unable to sufficiently validate the quote(s) internally and if the investment’s par value exceeds the materiality threshold, the investment is valued similarly to those assets with no readily available quotes
(see (3) below).
(3) Investments for which quotations are not readily available through exchanges, pricing
services, brokers, or dealers are valued through a multi-step valuation process:
a. Each portfolio company or investment
is initially valued by the investment professionals of the Investment Adviser responsible for the credit monitoring;
b.
Preliminary valuation conclusions will then be documented and discussed with the Operating Company’s senior management;
c. If an investment falls into (3) above for four consecutive quarters and if the investment’s par value exceeds the materiality threshold, then at least once each fiscal year, the valuation for each
portfolio investment for which the Operating Company does not have a readily available market quotation will be reviewed by an independent valuation firm engaged by our board of directors; and
d. Also, when deemed appropriate by the Operating Company’s management, an independent valuation firm may be engaged to review
and value investment(s) of a portfolio company, without any preliminary valuation being performed by the Investment Adviser. The investment professionals of the Investment Adviser will review and validate the value provided.
Valuation methods may include comparisons of financial ratios of the portfolio companies that issued such private securities to peer companies that
are public, the nature of and the realizable value
F-33
Combined Notes to the Consolidated Financial Statements of
New Mountain Finance Holdings, L.L.C.,
the Financial Statements of New Mountain Finance Corporation, and the Financial Statements
of New Mountain Finance AIV Holdings Corporation (continued)
of any collateral, the portfolio company’s earnings, discounted cash flows, the ability to make payments, the markets in which the portfolio company conducts business, and other relevant
factors, including available market data such as relevant and applicable market trading and transaction comparables; applicable market yields and multiples; security covenants; call protection provisions; information rights; comparable merger and
acquisition transactions; and the principal market and enterprise values. When an external event such as a purchase transaction, public offering or subsequent sale occurs, the Operating Company will consider the pricing indicated by the external
event to corroborate the private valuation.
The values assigned to investments are based upon available information and do not
necessarily represent amounts which might ultimately be realized, since such amounts depend on future circumstances and cannot be reasonably determined until the individual positions are liquidated. Due to the inherent uncertainty of determining the
fair value of investments that do not have a readily available market value, the fair value of NMF Holdings’ investments may fluctuate from period to period.
NMFC and AIV Holdings are holding companies with no direct operations of their own, and their sole asset is their ownership in the Operating Company. NMFC’s and AIV Holdings’ investments in the Operating
Company are carried at fair value and represent the respective pro-rata interest in the net assets of the Operating Company as of the applicable reporting date. NMFC and AIV Holdings value their ownership interest on a quarterly basis, or more
frequently if required under the 1940 Act.
See Note 3, Investments, for further discussion relating to investments.
Cash and cash equivalents—Cash and cash equivalents include cash and short-term, highly liquid investments. The
Companies define cash equivalents as securities that are readily convertible into known amounts of cash and so near maturity that there is insignificant risk of changes in value. Generally, these securities have original maturities of three months
or less.
Revenue recognition
The Operating Company’s revenue recognition policies are as follows:
Sales
and paydowns of investments: Realized gains and losses on investments are determined on the specific identification method.
Interest income: Interest income, including amortization of premium and discount using the effective interest method, is recorded on the accrual basis and periodically assessed for
collectability. Interest income also includes interest earned from cash on hand. Upon the prepayment of a loan or debt security, any prepayment penalties are recorded as part of interest income. The Operating Company has loans in the portfolio that
contain a payment-in-kind (“PIK”) provision. PIK represents interest that is accrued and recorded as interest income at the contractual rates, added to the loan principal on the respective capitalization dates, and generally due at
maturity.
Non-accrual income: Loans are placed on non-accrual status when principal or
interest payments are past due 30 days or more and when there is reasonable doubt that principal or interest will be collected. Accrued cash and un-capitalized PIK interest is generally reversed when a
F-34
Combined Notes to the Consolidated Financial Statements of
New Mountain Finance Holdings, L.L.C.,
the Financial Statements of New Mountain Finance Corporation, and the Financial Statements
of New Mountain Finance AIV Holdings Corporation (continued)
loan is placed on non-accrual status. Previously capitalized PIK interest is not reversed when an investment is placed on non-accrual status. Interest payments received on non-accrual loans may
be recognized as income or applied to principal depending upon management’s judgment of the ultimate outcome. Non-accrual loans are restored to accrual status when past due principal and interest is paid and, in management’s judgment, are
likely to remain current.
Other income: Other income represents delayed compensation,
consent or amendment fees, revolver fees and other miscellaneous fees received. Delayed compensation is income earned from counterparties on trades that do not settle within a set number of business days after trade date. Other income may also
include fees from bridge loans. NMF Holdings may from time to time enter into bridge financing commitments, an obligation to provide interim financing to a counterparty until permanent credit can be obtained. These commitments are short-term in
nature and may expire unfunded. A fee is received by NMF Holdings for providing such financing.
NMFC’s and AIV Holdings’
revenue recognition policies are as follows:
Revenue, expenses, and capital gains
(losses): At each quarterly valuation date, the Operating Company’s investment income, expenses, net realized gains (losses), and net increase (decrease) in unrealized appreciation (depreciation) are allocated to NMFC
and AIV Holdings based on their pro-rata interest in the net assets of the Operating Company. This is recorded on NMFC’s and AIV Holdings’ Statements of Operations. NMFC used the proceeds from its IPO and Concurrent Private Placement to
purchase units in the Operating Company at $13.75 per unit (its IPO price per share). At the IPO date, $13.75 per unit represented a discount to the actual net asset value per unit of the Operating Company. As a result, NMFC experienced immediate
unrealized appreciation on its investment. Concurrently, AIV Holdings experienced immediate unrealized depreciation on its investment in the Operating Company equal to the difference between NMFC’s IPO price of $13.75 per unit and the actual
net asset value per unit.
All expenses, including those of NMFC and AIV Holdings, are paid and recorded by the Operating
Company. Expenses are allocated to NMFC and AIV Holdings based on pro-rata ownership interest. In addition, the Operating Company paid all of the offering costs related to the IPO. NMFC and AIV Holdings have recorded their portion of the offering
costs as a direct reduction to net assets and the cost of their investment in the Operating Company.
With respect to the
expenses incident to any registration of shares of NMFC’s common stock issued in exchange for AIV Holdings’ units of the Operating Company, AIV Holdings is directly responsible for the expenses of any demand registration (including
underwriters’ discounts or commissions) and their pro-rata share of any “piggyback” registration expenses. No shares have been exchanged since formation.
Interest and other credit facility expenses—Interest and other credit facility fees are recorded on an accrual basis by the Operating Company. See Note 7, Borrowing Facilities, for
details.
Deferred credit facility costs—The deferred credit facility costs of the Operating Company consist of
capitalized expenses related to the origination and amending of the Operating Company’s existing credit facilities. The Operating Company amortizes these costs into expense using the straight-line method over the stated life of the related
credit facility. See Note 7, Borrowing Facilities, for details.
Income taxes—NMF Holdings is treated as
a partnership for federal income tax purposes. Accordingly, no provision for income taxes has been made in the accompanying financial statements,
F-35
Combined Notes to the Consolidated Financial Statements of
New Mountain Finance Holdings, L.L.C.,
the Financial Statements of New Mountain Finance Corporation, and the Financial Statements
of New Mountain Finance AIV Holdings Corporation (continued)
as the partners are individually responsible for reporting income or loss based on their respective share of the revenues and expenses. NMF Holdings files United States (“U.S.”)
federal, state, and local income tax returns.
NMFC and AIV Holdings intend to elect to be treated, and intend to comply with the
requirements to qualify annually, as RICs under subchapter M of the Code, commencing with the filing of their December 31, 2011 income tax returns. As RICs, NMFC and AIV Holdings are not subject to federal income tax on the portion of
taxable income and gains timely distributed to stockholders; therefore, no provision for income taxes has been recorded.
To qualify as
RICs, NMFC and AIV Holdings are required to meet certain income and asset diversification tests in addition to distributing at least 90.0% of their respective investment company taxable income, as defined by the Code. Since federal income tax
regulations differ from GAAP, distributions in accordance with tax regulations may differ from net investment income and realized gains recognized for financial reporting purposes.
Differences between taxable income and the results of operations for financial reporting purposes may be permanent or temporary in nature.
Permanent differences are reclassified among capital accounts in the financial statements to reflect their tax character. Differences in classification may also result from the treatment of short-term gains as ordinary income for tax purposes.
For federal income tax purposes, distributions paid to stockholders of NMFC and AIV Holdings are reported as ordinary income, return of
capital, long term capital gains or a combination thereof.
NMFC and AIV Holdings will be subject to a 4.0% nondeductible federal excise
tax on certain undistributed income unless NMFC and AIV Holdings distribute, in a timely manner as required by the Code, an amount at least equal to the sum of (1) 98.0% of their respective net ordinary income earned for the calendar year and
(2) 98.2% of their respective capital gain net income for the one-year period ending October 31 in the calendar year.
The
Companies have adopted the Income Taxes topic of the Codification (“ASC 740”). ASC 740 provides guidance for how uncertain income tax positions should be recognized, measured, and disclosed in the financial statements. Based on their
analyses, the Companies have determined that the adoption of ASC 740 did not have a material impact to the Companies’ financial statements.
Dividends—Distributions to common unit holders of NMF Holdings and common stockholders of NMFC and AIV Holdings are recorded on the record date as set by the respective board of directors. In
order for NMFC and AIV Holdings to pay a dividend or other distribution to holders of their common stock, it must be accompanied by a prior distribution by NMF Holdings to all of its unit holders. NMF Holdings intends to make distributions to its
unit holders that will be sufficient to enable NMFC and AIV Holdings to pay quarterly distributions to their stockholders and to obtain and maintain their status as RICs. NMFC and AIV Holdings intend to distribute approximately all of their portion
of NMF Holdings’ adjusted net investment income (see Note 5, Agreements) on a quarterly basis and substantially all of their portion of NMF Holdings’ taxable income on an annual basis, except that NMFC may retain certain net
capital gains for reinvestment.
Under certain circumstances, the distributions that NMF Holdings makes to its members may not be
sufficient for AIV Holdings to satisfy the annual distribution requirement necessary for AIV Holdings
F-36
Combined Notes to the Consolidated Financial Statements of
New Mountain Finance Holdings, L.L.C.,
the Financial Statements of New Mountain Finance Corporation, and the Financial Statements
of New Mountain Finance AIV Holdings Corporation (continued)
to qualify as a RIC. In that case, it is expected that Guardian AIV would consent to be treated as if it received distributions from AIV Holdings sufficient to satisfy the annual distribution
requirement. Guardian AIV would be required to include the consent dividend in its taxable income as a dividend from AIV Holdings, which would result in phantom (i.e., non-cash) taxable income to Guardian AIV. AIV Holdings intends to make
quarterly distributions to Guardian AIV, its sole stockholder, out of assets legally available for distribution each quarter.
NMF
Holdings and NMFC are required to take certain actions in order to maintain, at all times, a one-to-one ratio between the number of units held by NMFC and the number of shares of NMFC’s common stock outstanding. NMFC has adopted a dividend
reinvestment plan that provides on behalf of its stockholders for reinvestment of any distributions declared, unless a stockholder elects to receive cash. Cash distributions reinvested in additional shares of NMFC’s common stock will be
automatically reinvested by NMFC into additional units of NMF Holdings. In addition, AIV Holdings does not intend to reinvest any distributions received from NMF Holdings in additional units of NMF Holdings.
NMFC applies the following in implementing the dividend reinvestment plan. If the price at which newly issued shares are to be credited to
stockholders’ accounts is greater than 110.0% of the last determined net asset value of the shares, NMFC will use only newly issued shares to implement its dividend reinvestment plan. Under such circumstances, the number of shares to be issued
to a stockholder is determined by dividing the total dollar amount of the distribution payable to such stockholder by the market price per share of NMFC’s common stock on the New York Stock Exchange (“NYSE”) on the distribution
payment date. Market price per share on that date will be the closing price for such shares on the NYSE or, if no sale is reported for such day, the average of their electronically reported bid and asked prices. If NMFC uses newly issued shares to
implement the plan, NMFC will receive, on a one-for-one basis, additional units of NMF Holdings in exchange for cash distributions that are reinvested in shares of NMFC’s common stock under the dividend reinvestment plan.
If the price at which newly issued shares are to be credited to stockholders’ accounts is less than 110.0% of the last determined net asset
value of the shares, NMFC will either issue new shares or instruct the plan administrator to purchase shares in the open market to satisfy the additional shares required. Shares purchased in open market transactions by the plan administrator will be
allocated to a stockholder based on the average purchase price, excluding any brokerage charges or other charges, of all shares of common stock purchased in the open market. The number of shares of NMFC’s common stock to be outstanding after
giving effect to payment of the distribution cannot be established until the value per share at which additional shares will be issued has been determined and elections of NMFC’s stockholders have been tabulated.
Foreign securities—The accounting records of the Operating Company are maintained in U.S. dollars. Investment securities
denominated in foreign currencies are translated into U.S. dollars based on the rate of exchange of such currencies on the date of valuation. Purchases and sales of investment securities and income and expense items denominated in foreign currencies
are translated into U.S. dollars based on the rate of exchange of such currencies on the respective dates of the transactions. The Operating Company does not isolate that portion of the results of operations resulting from changes in foreign
exchange rates on investments from the fluctuations arising from changes in market prices of securities held. Such fluctuations are included with “Net change in unrealized (depreciation) appreciation of investments” and “Realized
gains on investments” in the Operating Company’s Consolidated Statements of Operations.
F-37
Combined Notes to the Consolidated Financial Statements of
New Mountain Finance Holdings, L.L.C.,
the Financial Statements of New Mountain Finance Corporation, and the Financial Statements
of New Mountain Finance AIV Holdings Corporation (continued)
Investments denominated in foreign currencies may be negatively affected by movements in the rate
of exchange between the U.S. dollar and such foreign currencies. This movement is beyond the control of the Operating Company and cannot be predicted.
Use of estimates—The preparation of the Companies’ financial statements in conformity with GAAP requires management to make estimates and assumptions that affect the reported amounts of
assets and liabilities at the date of the Companies’ financial statements and the reported amounts of revenues and expenses during the reporting periods. Changes in the economic environment, financial markets, and other metrics used in
determining these estimates could cause actual results to differ from the estimates used, and the differences could be material.
Note 3.
Investments
At March 31, 2012 the Operating Company’s investments consisted of the following:
Investment Cost and Fair Value by Type
|
|
|
|
|
|
|
|
|
| |
|
Cost |
|
|
Fair Value |
|
| First lien |
|
$ |
420,985,606 |
|
|
$ |
426,982,719 |
|
| Second lien |
|
|
272,268,456 |
|
|
|
275,332,857 |
|
| Subordinated |
|
|
45,447,460 |
|
|
|
53,052,490 |
|
| Equity and other |
|
|
3,120,824 |
|
|
|
2,849,471 |
|
|
|
|
|
|
|
|
|
|
| Total investments |
|
$ |
741,822,346 |
|
|
$ |
758,217,537 |
|
|
|
|
|
|
|
|
|
|
Investment Cost and Fair Value by Industry
|
|
|
|
|
|
|
|
|
| |
|
Cost |
|
|
Fair Value |
|
| Software |
|
$ |
150,161,978 |
|
|
$ |
159,087,213 |
|
| Healthcare Services |
|
|
130,707,841 |
|
|
|
136,176,078 |
|
| Education |
|
|
107,914,349 |
|
|
|
106,289,454 |
|
| Business Services |
|
|
89,768,884 |
|
|
|
93,921,116 |
|
| Federal Services |
|
|
69,971,459 |
|
|
|
71,141,881 |
|
| Healthcare Products |
|
|
31,065,834 |
|
|
|
32,041,250 |
|
| Consumer Services |
|
|
29,239,865 |
|
|
|
29,843,679 |
|
| Information Services |
|
|
29,467,940 |
|
|
|
29,734,784 |
|
| Logistics |
|
|
25,429,412 |
|
|
|
24,450,000 |
|
| Industrial Services |
|
|
19,237,507 |
|
|
|
19,061,879 |
|
| Healthcare Information Technology |
|
|
14,674,868 |
|
|
|
13,961,332 |
|
| Energy |
|
|
12,677,155 |
|
|
|
12,675,000 |
|
| Media |
|
|
11,733,073 |
|
|
|
11,731,500 |
|
| Consumer Products |
|
|
6,125,251 |
|
|
|
6,437,500 |
|
| Information Technology |
|
|
6,585,839 |
|
|
|
6,095,644 |
|
| Power Generation |
|
|
7,061,091 |
|
|
|
5,569,227 |
|
|
|
|
|
|
|
|
|
|
| Total investments |
|
$ |
741,822,346 |
|
|
$ |
758,217,537 |
|
|
|
|
|
|
|
|
|
|
F-38
Combined Notes to the Consolidated Financial Statements of
New Mountain Finance Holdings, L.L.C.,
the Financial Statements of New Mountain Finance Corporation, and the Financial Statements
of New Mountain Finance AIV Holdings Corporation (continued)
At December 31, 2011 the Operating Company’s investments consisted of the following:
Investment Cost and Fair Value by Type
|
|
|
|
|
|
|
|
|
| |
|
Cost |
|
|
Fair Value |
|
| First lien |
|
$ |
407,538,564 |
|
|
$ |
410,313,643 |
|
| Second lien |
|
|
262,532,416 |
|
|
|
262,701,495 |
|
| Subordinated |
|
|
26,672,980 |
|
|
|
27,648,951 |
|
| Equity and other |
|
|
3,120,824 |
|
|
|
2,849,471 |
|
|
|
|
|
|
|
|
|
|
| Total investments |
|
$ |
699,864,784 |
|
|
$ |
703,513,560 |
|
|
|
|
|
|
|
|
|
|
Investment Cost and Fair Value by Industry
|
|
|
|
|
|
|
|
|
| |
|
Cost |
|
|
Fair Value |
|
| Software |
|
$ |
153,797,485 |
|
|
$ |
155,642,372 |
|
| Healthcare Services |
|
|
113,200,121 |
|
|
|
117,544,595 |
|
| Education |
|
|
104,237,094 |
|
|
|
101,794,083 |
|
| Business Services |
|
|
73,143,286 |
|
|
|
76,435,801 |
|
| Federal Services |
|
|
70,665,154 |
|
|
|
70,674,563 |
|
| Consumer Services |
|
|
29,357,183 |
|
|
|
29,764,430 |
|
| Information Services |
|
|
29,516,875 |
|
|
|
29,626,611 |
|
| Healthcare Products |
|
|
24,037,614 |
|
|
|
24,875,000 |
|
| Logistics |
|
|
25,407,419 |
|
|
|
24,610,002 |
|
| Industrial Services |
|
|
19,220,188 |
|
|
|
17,543,793 |
|
| Healthcare Information Technology |
|
|
14,704,271 |
|
|
|
14,108,263 |
|
| Media |
|
|
11,756,172 |
|
|
|
11,731,350 |
|
| Specialty Chemicals and Materials |
|
|
9,449,821 |
|
|
|
9,430,359 |
|
| Power Generation |
|
|
9,966,951 |
|
|
|
8,609,943 |
|
| Information Technology |
|
|
6,570,081 |
|
|
|
6,249,251 |
|
| Telecommunication |
|
|
4,835,069 |
|
|
|
4,873,144 |
|
|
|
|
|
|
|
|
|
|
| Total investments |
|
$ |
699,864,784 |
|
|
$ |
703,513,560 |
|
|
|
|
|
|
|
|
|
|
As of March 31, 2012, the Operating Company’s original first lien position in ATI Acquisition Company
remained on non-accrual status due to the inability of the portfolio company to service its interest payment for the quarter then ended and uncertainty about its ability to pay such amounts in the future. As of March 31, 2012, this first lien
debt investment had a cost basis of $4,306,437, a fair value of $443,250 and total unearned interest income of $145,756 for the quarter then ended. Additionally, the Operating Company has two super priority first lien debt investments in ATI
Acquisition Company with a combined cost basis of $1,592,947 and a combined fair value of $1,750,554 as of March 31, 2012. Unrealized gains include a fee that the Operating Company would receive upon maturity of the two super priority first
lien debt investments. Neither super priority first lien positions are on non-accrual status. As of March 31, 2012, the Operating Company’s total investment in ATI Acquisition Company had an aggregate cost basis of $5,899,384 and an
aggregate fair value of $2,193,804. As of December 31, 2011, the Operating Company’s original first lien position in ATI Acquisition Company
F-39
Combined Notes to the Consolidated Financial Statements of
New Mountain Finance Holdings, L.L.C.,
the Financial Statements of New Mountain Finance Corporation, and the Financial Statements
of New Mountain Finance AIV Holdings Corporation (continued)
was put on non-accrual status, with a cost basis of $4,351,747, a fair value of $783,617 and total unearned interest income of $139,793 for the quarter and year then ended. The Operating
Company’s two super priority first lien debt investments in ATI Acquisition Company had a combined cost basis and fair value of $1,576,066 as of December 31, 2011. As of December 31, 2011, the Operating Company’s total investment
in ATI Acquisition Company had an aggregate cost basis of $5,927,813 and an aggregate fair value of $2,359,683.
As of March 31,
2012, the Operating Company had unfunded commitments on revolving credit facilities and bridge facilities of $18,498,500 and $0, respectively. Additionally, the Operating Company had unfunded commitments in the form of a delayed draw or other future
funding commitments of $4,209,820 as of March 31, 2012. These unfunded commitments are disclosed on the Operating Company’s Consolidated Schedules of Investments as of March 31, 2012.
As of December 31, 2011, the Operating Company had unfunded commitments on revolving credit facilities and bridge facilities of $22,698,500
and $35,000,000, respectively. Additionally, the Operating Company had unfunded commitments in the form of a delayed draw or other future funding commitments of $4,250,632 as of December 31, 2011. These unfunded commitments are disclosed on the
Operating Company’s Consolidated Schedules of Investments as of December 31, 2011.
Investment Risk
Factor—First and second lien debt that the Operating Company invests in is entirely, or almost entirely, rated below investment grade or may be unrated. These loans are considered speculative because of the credit risk of the issuers.
Such issuers are considered more likely than investment grade issuers to default on their payments of interest and principal and such defaults could reduce the net asset value and income distributions of the Operating Company. First and second lien
debt may also lose significant market value before a default occurs. Furthermore, an active trading market may not exist for these first and second lien loans. This illiquidity may make it more difficult to value the debt.
Subordinated debt is generally subject to similar risks as those associated with first and second lien debt, except that such debt is subordinated
in payment and /or lower in lien priority. Subordinated debt is subject to the additional risk that the cash flow of the borrower and the property securing the debt, if any, may be insufficient to meet scheduled payments after giving effect to the
senior secured and unsecured obligations of the borrower.
Note 4. Fair Value
Fair value is the amount that would be received to sell an asset or paid to transfer a liability in an orderly transaction between market
participants at the measurement date. Accounting Standards Codification 820, Fair Value Measurements and Disclosures (“ASC 820”), establishes a fair value hierarchy that prioritizes and ranks the inputs to valuation techniques used
in measuring investments at fair value. The hierarchy classifies the inputs used in measuring fair value into three levels as follows:
Level I—Quoted prices (unadjusted) are available in active markets for identical investments and the Operating Company has the ability to access such quotes as of the reporting date. The type of
investments which would generally be included in Level I include active exchange-traded equity securities and exchange-traded derivatives. As required by ASC 820, the Operating Company, to the extent that it holds such investments, does not
adjust the quoted price for these investments, even in situations where the Operating Company holds a large position and a sale could reasonably impact the quoted price.
F-40
Combined Notes to the Consolidated Financial Statements of
New Mountain Finance Holdings, L.L.C.,
the Financial Statements of New Mountain Finance Corporation, and the Financial Statements
of New Mountain Finance AIV Holdings Corporation (continued)
Level II—Pricing inputs are observable for the investments,
either directly or indirectly, as of the reporting date, but are not the same as those used in Level I. Level II inputs include the following:
| |
Ÿ |
|
Quoted prices for similar assets or liabilities in active markets; |
| |
Ÿ |
|
Quoted prices for identical or similar assets or liabilities in non-active markets (examples include corporate and municipal bonds, which trade infrequently);
|
| |
Ÿ |
|
Pricing models whose inputs are observable for substantially the full term of the asset or liability (examples include most over-the-counter derivatives,
including foreign exchange forward contracts); and |
| |
Ÿ |
|
Pricing models whose inputs are derived principally from or corroborated by observable market data through correlation or other means for substantially the full
term of the asset or liability. |
Level III—Pricing inputs are unobservable for the
investment and include situations where there is little, if any, market activity for the investment.
The inputs used to measure fair
value may fall into different levels. In all instances when the inputs fall within different levels of the hierarchy, the level within which the fair value measurement is categorized is based on the lowest level of input that is significant to the
fair value measurement in its entirety. As such, a Level III fair value measurement may include inputs that are both observable (Levels I and II) and unobservable (Level III). Gains and losses for such assets categorized within
the Level III table below may include changes in fair value that are attributable to both observable inputs (Levels II and III) and unobservable inputs (Level III).
The inputs into the determination of fair value require significant judgment or estimation by management and consider factors specific to each
investment. A review of the fair value hierarchy classifications is conducted on a quarterly basis. Changes in the observability of valuation inputs may result in the reclassification of certain investments within the fair value hierarchy from
period to period. Reclassifications impacting the fair value hierarchy are reported as transfers in/out of the respective leveling categories as of the beginning of the quarter in which the reclassifications occur.
The following table summarizes the levels in the fair value hierarchy that the Operating Company’s portfolio investments fall into as of
March 31, 2012:
|
|
|
|
|
|
|
|
|
|
|
|
|
|
|
|
|
| |
|
Total |
|
|
Level I |
|
|
Level II |
|
|
Level III |
|
| First lien |
|
$ |
426,982,719 |
|
|
$ |
— |
|
|
$ |
376,414,080 |
|
|
$ |
50,568,639 |
|
| Second lien |
|
|
275,332,857 |
|
|
|
— |
|
|
|
232,077,557 |
|
|
|
43,255,300 |
|
| Subordinated |
|
|
53,052,490 |
|
|
|
— |
|
|
|
46,481,039 |
|
|
|
6,571,451 |
|
| Equity and other |
|
|
2,849,471 |
|
|
|
— |
|
|
|
— |
|
|
|
2,849,471 |
|
|
|
|
|
|
|
|
|
|
|
|
|
|
|
|
|
|
| Total investments |
|
$ |
758,217,537 |
|
|
$ |
— |
|
|
$ |
654,972,676 |
|
|
$ |
103,244,861 |
|
|
|
|
|
|
|
|
|
|
|
|
|
|
|
|
|
|
F-41
Combined Notes to the Consolidated Financial Statements of
New Mountain Finance Holdings, L.L.C.,
the Financial Statements of New Mountain Finance Corporation, and the Financial Statements
of New Mountain Finance AIV Holdings Corporation (continued)
The following table summarizes the levels in the fair value hierarchy that the Operating
Company’s portfolio investments fall into as of December 31, 2011:
|
|
|
|
|
|
|
|
|
|
|
|
|
|
|
|
|
| |
|
Total |
|
|
Level I |
|
|
Level II |
|
|
Level III |
|
| First lien |
|
$ |
410,313,643 |
|
|
$ |
— |
|
|
$ |
377,172,906 |
|
|
$ |
33,140,737 |
|
| Second lien |
|
|
262,701,495 |
|
|
|
— |
|
|
|
214,296,195 |
|
|
|
48,405,300 |
|
| Subordinated |
|
|
27,648,951 |
|
|
|
— |
|
|
|
21,077,500 |
|
|
|
6,571,451 |
|
| Equity and other |
|
|
2,849,471 |
|
|
|
— |
|
|
|
— |
|
|
|
2,849,471 |
|
|
|
|
|
|
|
|
|
|
|
|
|
|
|
|
|
|
| Total investments |
|
$ |
703,513,560 |
|
|
$ |
— |
|
|
$ |
612,546,601 |
|
|
$ |
90,966,959 |
|
|
|
|
|
|
|
|
|
|
|
|
|
|
|
|
|
|
The following table summarizes the changes in fair value of Level III portfolio investments for the three
months ended March 31, 2012, as well as the portion of appreciation (depreciation) included in income attributable to unrealized appreciation (depreciation) related to those assets and liabilities still held by the Operating Company at
March 31, 2012:
|
|
|
|
|
|
|
|
|
|
|
|
|
|
|
|
|
|
|
|
|
| |
|
Total |
|
|
First Lien |
|
|
Second Lien |
|
|
Subordinated |
|
|
Equity and
other |
|
| Fair value, December 31, 2011 |
|
$ |
90,966,959 |
|
|
$ |
33,140,737 |
|
|
$ |
48,405,300 |
|
|
$ |
6,571,451 |
|
|
$ |
2,849,471 |
|
| Total gains or losses included in earnings: |
|
|
|
|
|
|
|
|
|
|
|
|
|
|
|
|
|
|
|
|
| Realized gains (losses) on investments |
|
|
22,352 |
|
|
|
(264 |
) |
|
|
22,616 |
|
|
|
— |
|
|
|
— |
|
| Net change in unrealized appreciation (depreciation) |
|
|
193,017 |
|
|
|
365,633 |
|
|
|
(172,616 |
) |
|
|
— |
|
|
|
— |
|
| Purchases, including capitalized PIK and revolver fundings |
|
|
34,574,071 |
|
|
|
34,574,071 |
|
|
|
— |
|
|
|
— |
|
|
|
— |
|
| Proceeds from sales and paydowns of investments |
|
|
(11,400,000 |
) |
|
|
(6,400,000 |
) |
|
|
(5,000,000 |
) |
|
|
— |
|
|
|
— |
|
| Transfers out of Level III(1) |
|
|
(11,111,538 |
) |
|
|
(11,111,538 |
) |
|
|
— |
|
|
|
— |
|
|
|
— |
|
|
|
|
|
|
|
|
|
|
|
|
|
|
|
|
|
|
|
|
|
|
| Fair value, March 31, 2012 |
|
$ |
103,244,861 |
|
|
$ |
50,568,639 |
|
|
$ |
43,255,300 |
|
|
$ |
6,571,451 |
|
|
$ |
2,849,471 |
|
|
|
|
|
|
|
|
|
|
|
|
|
|
|
|
|
|
|
|
|
|
| Unrealized appreciation (depreciation) for the period relating to those Level III assets that were still held
by the Operating Company at the end of the period: |
|
$ |
365,633 |
|
|
$ |
365,633 |
|
|
$ |
— |
|
|
$ |
— |
|
|
$ |
— |
|
|
|
|
|
|
|
|
|
|
|
|
|
|
|
|
|
|
|
|
|
|
| (1) |
As of March 31, 2012, the portfolio investments were transferred into Level III from Level II and out of Level III into Level II at fair value as of the
beginning of the quarter in which the reclassifications occurred. |
F-42
Combined Notes to the Consolidated Financial Statements of
New Mountain Finance Holdings, L.L.C.,
the Financial Statements of New Mountain Finance Corporation, and the Financial Statements
of New Mountain Finance AIV Holdings Corporation (continued)
The following table summarizes the changes in fair value of Level III portfolio investments
for the three months ended March 31, 2011, as well as the portion of appreciation (depreciation) included in income attributable to unrealized appreciation (depreciation) related to those assets and liabilities still held by the Operating
Company at March 31, 2011:
|
|
|
|
|
|
|
|
|
|
|
|
|
|
|
|
|
|
|
|
|
| |
|
Total |
|
|
First Lien |
|
|
Second Lien |
|
|
Subordinated |
|
|
Equity and
other |
|
| Fair value, December 31, 2010 |
|
$ |
30,255,961 |
|
|
$ |
16,975,334 |
|
|
$ |
— |
|
|
$ |
12,747,764 |
|
|
$ |
532,863 |
|
| Total gains or losses included in earnings: |
|
|
|
|
|
|
|
|
|
|
|
|
|
|
|
|
|
|
|
|
| Net change in unrealized appreciation (depreciation) |
|
|
611,296 |
|
|
|
418,088 |
|
|
|
— |
|
|
|
263,114 |
|
|
|
(69,906 |
) |
| Purchases, including capitalized PIK and revolver fundings |
|
|
(1,237,830 |
) |
|
|
(1,260,000 |
) |
|
|
— |
|
|
|
— |
|
|
|
22,170 |
|
| Transfers into Level III(1) |
|
|
(406,350 |
) |
|
|
(406,350 |
) |
|
|
— |
|
|
|
— |
|
|
|
— |
|
| Transfers out of Level III(2) |
|
|
217,500 |
|
|
|
217,500 |
|
|
|
— |
|
|
|
— |
|
|
|
— |
|
|
|
|
|
|
|
|
|
|
|
|
|
|
|
|
|
|
|
|
|
|
| Fair value, March 31, 2011 |
|
$ |
29,440,577 |
|
|
$ |
15,944,572 |
|
|
$ |
— |
|
|
$ |
13,010,878 |
|
|
$ |
485,127 |
|
|
|
|
|
|
|
|
|
|
|
|
|
|
|
|
|
|
|
|
|
|
| Unrealized appreciation (depreciation) for the period relating to those Level III assets that were still held by the Operating
Company at the end of the period: |
|
$ |
611,296 |
|
|
$ |
418,088 |
|
|
$ |
— |
|
|
$ |
263,114 |
|
|
$ |
(69,906 |
) |
|
|
|
|
|
|
|
|
|
|
|
|
|
|
|
|
|
|
|
|
|
| (1) |
The transfer into Level III represents the transfer of RGIS Services, LLC at a fair value of ($406,350). In accordance with the Companies’ valuation policy, this
asset was transferred from a Level II investment to a Level III investment during the three months ended March 31, 2011 as available market quotes were not representative of fair value. |
| (2) |
The transfer out of Level III represents the transfer of Education Management LLC at a fair value of $217,500. In accordance with the Companies’ valuation policy, this
asset was transferred from a Level III investment to a Level II investment during the three months ended March 31, 2011 as market quotes representative of fair value became available. |
Except as noted in the tables above, there were no other transfers in or out of Level I, II, or III during the three months ended
March 31, 2012 and March 31, 2011. Transfers into Level III occurred as quotations obtained through pricing services were not deemed representative of fair value as of the balance sheet date and such assets were internally valued. As
quotations obtained through pricing services were substantiated through additional market sources, investments were transferred out of Level III. The Operating Company invests in revolving credit facilities. These investments are categorized as
Level III investments as these assets are not actively traded and their fair values are often implied by the term loans of the respective portfolio companies.
NMF Holdings generally uses the following framework when determining the fair value of investments where there is little, if any, market activity or observable pricing inputs.
F-43
Combined Notes to the Consolidated Financial Statements of
New Mountain Finance Holdings, L.L.C.,
the Financial Statements of New Mountain Finance Corporation, and the Financial Statements
of New Mountain Finance AIV Holdings Corporation (continued)
Company Performance, Financial Review, and Analysis: Prior
to investment, as part of its due diligence process, NMF Holdings evaluates the overall performance and financial stability of the portfolio company. Post investment, NMF Holdings analyzes each portfolio company’s current operating performance
and relevant financial trends versus prior year and budgeted results, including, but not limited to, factors affecting its revenue and earnings before interest, taxes, depreciation, and amortization (“EBITDA”) growth, margin trends,
liquidity position, covenant compliance and changes to its capital structure. NMF Holdings also attempts to identify and subsequently track any developments at the portfolio company, within its customer or vendor base or within the industry or the
macroeconomic environment, generally, that may alter any material element of its original investment thesis. This analysis is specific to each portfolio company. NMF Holdings leverages the knowledge gained from its original due diligence process,
augmented by this subsequent monitoring, to continually refine its outlook for each of its portfolio companies and ultimately form the valuation of its investment in each portfolio company.
Market Based Approach: NMF Holdings typically estimates the total enterprise value of each portfolio company
by utilizing market value cash flow (EBITDA) multiples of publicly traded comparable companies. NMF Holdings carefully considers numerous factors when selecting the appropriate companies whose trading multiples are used to value its portfolio
companies. These factors include, but are not limited to, the type of organization, similarity to the business being valued, relevant risk factors, as well as size, profitability and growth expectations. NMF Holdings generally applies an average of
various relevant comparable company EBITDA multiples to the portfolio company’s latest twelve month (“LTM”) EBITDA or projected EBITDA to calculate portfolio company enterprise value. This is done in order to ensure that there is an
appropriate level of value coverage for each investment. In applying the market based approach as of March 31, 2012, NMF Holdings used a range of 3.5x to 9.0x relevant EBITDA to determine the enterprise value of its investments. NMF Holdings
believes this was a reasonable range in light of current comparable company trading levels and the specific companies involved.
Income Based Approach: NMF Holdings also typically uses a discounted cash flow analysis to estimate the fair
value of the investment. Projected cash flows represent the relevant security’s contractual interest, fee and principal payments plus the assumption of full principal recovery at the investment’s expected maturity date. These cash flows
are discounted at a rate established utilizing a yield calibration approach, which incorporates changes in the credit quality (as measured by relevant statistics) of the portfolio company, as compared to changes in the yield associated with
comparable credit quality market indices, between the date of origination and the valuation date. In applying the income based approach as of March 31, 2012, NMF Holdings used a discount range of 6.3% to 23.4% to value its investments.
Based on a comparison to similar BDC credit facilities, the terms and conditions of the Holdings Credit Facility and the SLF Credit
Facility are representative of market. While both facilities have been amended and restated on May 8, 2012 to lower the applicable interest rate spread by 0.25%, the carrying values of the Holdings Credit Facility and SLF Credit Facility
approximate fair value as of March 31, 2012, as both facilities are continually monitored and examined by both the borrower and the lender. The fair value of other financial assets and liabilities approximates their carrying value based on the
short term nature of these items. The fair value disclosures discussed in this paragraph are considered Level III.
F-44
Combined Notes to the Consolidated Financial Statements of
New Mountain Finance Holdings, L.L.C.,
the Financial Statements of New Mountain Finance Corporation, and the Financial Statements
of New Mountain Finance AIV Holdings Corporation (continued)
Fair value risk factors—The Operating Company seeks investment opportunities
that offer the possibility of attaining substantial capital appreciation. Certain events particular to each industry in which the Operating Company’s portfolio companies conduct their operations, as well as general economic and political
conditions, may have a significant negative impact on the operations and profitability of the Operating Company’s investments and/or on the fair value of the Operating Company’s investments. The Operating Company’s investments are
subject to the risk of non-payment of scheduled interest or principal, resulting in a reduction in income to the Operating Company and thus the income of NMFC and AIV Holdings, and their corresponding fair valuations. Also, there may be risk
associated with the concentration of investments in one geographic region or in certain industries. These events are beyond the control of the Operating Company and cannot be predicted. Furthermore, the ability to liquidate investments and realize
value is subject to uncertainties.
Note 5. Agreements
On May 19, 2011, NMFC entered into a joinder agreement with respect to the Limited Liability Company Agreement, as amended and restated, of the Operating Company pursuant to which NMFC was admitted as a member
of the Operating Company and agreed to acquire from the Operating Company a number of units of the Operating Company equal to the number of shares of common stock outstanding of NMFC. Additionally on May 19, 2011, in connection with the
contribution by Guardian AIV of its units to AIV Holdings, AIV Holdings entered into a joinder agreement with respect to the Limited Liability Company Agreement, as amended and restated, of the Operating Company pursuant to which AIV Holdings was
also admitted as a member of the Operating Company.
The Operating Company entered into an investment advisory and management agreement,
as amended and restated (the “Investment Management Agreement”) with the Investment Adviser. Under the Investment Management Agreement, the Investment Adviser manages the day-to-day operations of, and provides investment advisory services
to, the Operating Company. For providing these services, the Investment Adviser receives a fee from the Operating Company, consisting of two components—a base management fee and an incentive fee.
The base management fee is calculated at an annual rate of 1.75% of the Operating Company’s gross assets less (i) the borrowings under
the SLF Credit Facility (as defined in Note 7, Borrowing Facilities) and (ii) cash and cash equivalents. The base management fee is payable quarterly in arrears, and is calculated based on the average value of the Operating
Company’s gross assets, borrowings under the SLF Credit Facility, and cash and cash equivalents at the end of each of the two most recently completed calendar quarters, and appropriately adjusted on a pro rata basis for any equity capital
raises or repurchases during the current calendar quarter.
The incentive fee consists of two parts. The first part is calculated and
payable quarterly in arrears and equals 20.0% of the Operating Company’s “Pre-Incentive Fee Adjusted Net Investment Income” for the immediately preceding quarter, subject to a “preferred return”, or “hurdle”, and a
“catch-up” feature. “Pre-Incentive Fee Net Investment Income” means interest income, dividend income and any other income (including any other fees (other than fees for providing managerial assistance), such as commitment,
origination, structuring, diligence and consulting fees or other fees that the Operating Company receives from portfolio companies) accrued during the calendar quarter, minus the Operating Company’s operating expenses for the quarter (including
the base management fee, expenses payable under the Administration Agreement, as amended and restated, with the
F-45
Combined Notes to the Consolidated Financial Statements of
New Mountain Finance Holdings, L.L.C.,
the Financial Statements of New Mountain Finance Corporation, and the Financial Statements
of New Mountain Finance AIV Holdings Corporation (continued)
Administrator, and any interest expense and distributions paid on any issued and outstanding preferred membership units (of which there are none as of March 31, 2012), but excluding the
incentive fee). Pre-Incentive Fee Net Investment Income includes, in the case of investments with a deferred interest feature (such as original issue discount, debt instruments with PIK interest and zero coupon securities), accrued income that the
Operating Company has not yet received in cash. Pre-Incentive Fee Net Investment Income does not include any realized capital gains, realized capital losses or unrealized capital appreciation or depreciation.
Under GAAP, NMFC’s IPO did not step-up the cost basis of the Operating Company’s existing investments to fair market value at the IPO
date. Since the total value of the Operating Company’s investments at the time of the IPO was greater than the investments’ cost basis, a larger amount of amortization of purchase or original issue discount, as well as different amounts in
realized gain and unrealized appreciation, may be recognized under GAAP in each period than if the step-up had occurred. This will remain until such predecessor investments are sold or mature in the future. The Operating Company tracks the
transferred (or fair market) value of each of its investments as of the time of the IPO and, for purposes of the incentive fee calculation, adjusts Pre-Incentive Fee Net Investment Income to reflect the amortization of purchase or original issue
discount on the Operating Company’s investments as if each investment was purchased at the date of the IPO, or stepped up to fair market value. This is defined as “Pre-Incentive Fee Adjusted Net Investment Income”. The Operating
Company also uses the transferred (or fair market) value of each of its investments as of the time of the IPO to adjust capital gains (“Adjusted Realized Capital Gains”) or losses (“Adjusted Realized Capital Losses”) and
unrealized capital appreciation (“Adjusted Unrealized Capital Appreciation”) and unrealized capital depreciation (“Adjusted Unrealized Capital Depreciation”).
Pre-Incentive Fee Adjusted Net Investment Income, expressed as a rate of return on the value of the Operating Company’s net assets at the end
of the immediately preceding calendar quarter, will be compared to a “hurdle rate” of 2.0% per quarter (8.0% annualized), subject to a “catch-up” provision measured as of the end of each calendar quarter. The hurdle rate is
appropriately pro-rated for any partial periods. The calculation of the Operating Company’s incentive fee with respect to the Pre-Incentive Fee Adjusted Net Investment Income for each quarter is as follows:
| |
Ÿ |
|
No incentive fee is payable to the Investment Adviser in any calendar quarter in which the Operating Company’s Pre-Incentive Fee Adjusted Net Investment
Income does not exceed the hurdle rate of 2.0% (the “preferred return” or “hurdle”). |
| |
Ÿ |
|
100.0% of the Operating Company’s Pre-Incentive Fee Adjusted Net Investment Income with respect to that portion of such Pre-Incentive Fee Adjusted Net
Investment Income, if any, that exceeds the hurdle rate but is less than or equal to 2.5% in any calendar quarter (10.0% annualized) is payable to the Investment Adviser. This portion of the Operating Company’s Pre-Incentive Fee Adjusted Net
Investment Income (which exceeds the hurdle rate but is less than or equal to 2.5%) is referred to as the “catch-up”. The catch-up provision is intended to provide the Investment Adviser with an incentive fee of 20.0% on all of the
Operating Company’s Pre-Incentive Fee Adjusted Net Investment Income as if a hurdle rate did not apply when the Operating Company’s Pre-Incentive Fee Adjusted Net Investment Income exceeds 2.5% in any calendar quarter.
|
| |
Ÿ |
|
20.0% of the amount of the Operating Company’s Pre-Incentive Fee Adjusted Net Investment Income, if any, that exceeds 2.5% in any calendar quarter (10.0%
annualized) is payable to the Investment Adviser once the hurdle is reached and the catch-up is achieved. |
F-46
Combined Notes to the Consolidated Financial Statements of
New Mountain Finance Holdings, L.L.C.,
the Financial Statements of New Mountain Finance Corporation, and the Financial Statements
of New Mountain Finance AIV Holdings Corporation (continued)
The second part will be determined and payable in arrears as of the end of each calendar year (or
upon termination of the Investment Management Agreement) and will equal 20.0% of the Operating Company’s Adjusted Realized Capital Gains, if any, on a cumulative basis from inception through the end of each calendar year, computed net of all
Adjusted Realized Capital Losses and Adjusted Unrealized Capital Depreciation on a cumulative basis, less the aggregate amount of any previously paid capital gain incentive fee.
In accordance with GAAP, NMF Holdings accrues a hypothetical capital gains incentive fee based upon the cumulative net Adjusted Realized Capital
Gains and Adjusted Realized Capital Losses and the cumulative net Adjusted Unrealized Capital Appreciation and Adjusted Unrealized Capital Depreciation on investments held at the end of each period. Actual amounts paid to the Investment Adviser are
consistent with the Investment Management Agreement and are based only on actual Adjusted Realized Capital Gains computed net of all Adjusted Realized Capital Losses and Adjusted Unrealized Capital Depreciation on a cumulative basis from inception
through the end of each calendar year as if the entire portfolio was sold at fair value.
The management fee and incentive fee incurred
by the Operating Company were $2,514,296 and $3,361,463 for the three months ended March 31, 2012, which includes an accrual of $911,178 of capital gains incentive fees. These accrued capital gains incentive fees would be paid by the Operating
Company if the Operating Company ceased operations on March 31, 2012 and liquidated its investments at the current valuation. No accrual was required for the three months ended March 31, 2011. No management fee or incentive fees were
incurred by the Operating Company under the Investment Management Agreement for the three months ended March 31, 2011, as the Investment Management Agreement was not yet effective. For the three months ended March 31, 2011, the Operating
Company incurred $34,000 in management fees under the investment advisory and management agreements of the Predecessor Entities. The Operating Company’s Consolidated Statement of Operations below is adjusted as if step-up in cost basis to fair
market value had occurred at the IPO date, May 19, 2011.
|
|
|
|
|
|
|
|
|
|
|
|
|
| |
|
Three months ended
March 31, 2012 |
|
|
Adjustments |
|
|
Adjusted
three months ended
March 31, 2012 |
|
| Investment income |
|
|
|
|
|
|
|
|
|
|
|
|
| Interest income |
|
$ |
18,601,183 |
|
|
$ |
(1,022,995 |
) |
|
$ |
17,578,188 |
|
| Other income |
|
|
420,818 |
|
|
|
— |
|
|
|
420,818 |
|
|
|
|
|
|
|
|
|
|
|
|
|
|
| Total investment income |
|
|
19,022,001 |
|
|
|
(1,022,995 |
) |
|
|
17,999,006 |
|
|
|
|
|
|
|
|
|
|
|
|
|
|
| Total expenses pre-incentive fee |
|
|
5,747,585 |
|
|
|
— |
|
|
|
5,747,585 |
|
|
|
|
|
|
|
|
|
|
|
|
|
|
| Pre-Incentive Fee Net Investment Income |
|
|
13,274,416 |
|
|
|
(1,022,995 |
) |
|
|
12,251,421 |
|
|
|
|
|
|
|
|
|
|
|
|
|
|
| Incentive fee(1) |
|
|
3,361,463 |
|
|
|
— |
|
|
|
3,361,463 |
|
|
|
|
|
|
|
|
|
|
|
|
|
|
| Post-Incentive Fee Net Investment Income |
|
|
9,912,953 |
|
|
|
(1,022,995 |
) |
|
|
8,889,958 |
|
|
|
|
|
|
|
|
|
|
|
|
|
|
| Realized gains on investments |
|
|
1,007,333 |
|
|
|
(712,724 |
) |
|
|
294,609 |
|
| Net change in unrealized appreciation (depreciation) of investments |
|
|
12,746,415 |
|
|
|
1,735,719 |
|
|
|
14,482,134 |
|
|
|
|
|
|
|
|
|
|
|
|
|
|
| Net increase in capital resulting from operations |
|
$ |
23,666,701 |
|
|
|
|
|
|
$ |
23,666,701 |
|
|
|
|
|
|
|
|
|
|
|
|
|
|
| (1) |
For the three months ended March 31, 2012, the Operating Company incurred total incentive fees of $3,361,463, of which $911,178 related to capital gains incentive fees on a
hypothetical liquidation basis. |
F-47
Combined Notes to the Consolidated Financial Statements of
New Mountain Finance Holdings, L.L.C.,
the Financial Statements of New Mountain Finance Corporation, and the Financial Statements
of New Mountain Finance AIV Holdings Corporation (continued)
The Companies have entered into an Administration Agreement, as amended and restated, with the
Administrator under which the Administrator provides administrative services. The Administrator performs, or oversees the performance of, the Companies’ financial records, prepares reports filed with the Securities and Exchange Commission,
generally monitors the payment of the Companies’ expenses, and watches the performance of administrative and professional services rendered by others. NMF Holdings will reimburse the Administrator for the Companies’ allocable portion of
overhead and other expenses incurred by the Administrator in performing its obligations to the Companies under the Administration Agreement, as amended and restated. Pursuant to the Administration Agreement, as amended and restated, and further
restricted by the Operating Company, expenses payable to the Administrator by the Operating Company as well as other direct and indirect expenses (excluding interest and other credit facility expenses and management and incentive fees) have been
capped at $3,000,000 for the time period from April 1, 2011 to March 31, 2012.
The Operating Company incurred $549,804 in
expenses in excess of the expense cap for the three months ended March 31, 2012, of which $246,009 was receivable from an affiliate as of March 31, 2012. The Operating Company incurred $2,185,765 in expenses in excess of the expense cap
for the year ended December 31, 2011, of which $369,017 was receivable from affiliate as of December 31, 2011.
The Companies,
the Investment Adviser and the Administrator have also entered into a Trademark License Agreement, as amended, with New Mountain Capital, L.L.C., pursuant to which New Mountain Capital, L.L.C. has agreed to grant the Companies, the Investment
Adviser and the Administrator, a non-exclusive, royalty-free license to use the “New Mountain” and the “New Mountain Finance” names. Under the Trademark License Agreement, as amended, subject to certain conditions, the Companies,
the Investment Adviser and the Administrator will have a right to use the “New Mountain” and “New Mountain Finance” names, for so long as the Investment Adviser or one of its affiliates remains the investment adviser of the
Operating Company. Other than with respect to this limited license, the Companies, the Investment Adviser and the Administrator will have no legal right to the “New Mountain” or the “New Mountain Finance” names.
AIV Holdings entered into a Registration Rights Agreement with NMFC, Steven B. Klinsky (the Chairman of our board of directors), an entity related
to Steven B. Klinsky and the Investment Adviser. Subject to several exceptions, AIV Holdings and the Investment Adviser have the right to require NMFC to register for public resale under the Securities Act of 1933, as amended (the “Securities
Act of 1933”), all registerable securities that are held by any of them and that they request to be registered. Registerable securities subject to the Registration Rights Agreement are shares of NMFC’s common stock issued or issuable in
exchange for units and any other shares of NMFC’s common stock held by AIV Holdings, the Investment Adviser and any of their transferees. The rights under the Registration Rights Agreement can be conditionally exercised by AIV Holdings or the
Investment Adviser, meaning that prior to the effectiveness of the registration statement related to the shares, AIV Holdings or the Investment Adviser can withdraw their request to have the shares registered. AIV Holdings and the Investment Adviser
may each assign their rights to any person that acquires registerable securities subject to the Registration Rights Agreement and who agrees to be bound by the terms of the Registration Rights Agreement. Steven B. Klinsky and a related entity will
have the right to “piggyback”, or include their own registrable securities in such a registration.
F-48
Combined Notes to the Consolidated Financial Statements of
New Mountain Finance Holdings, L.L.C.,
the Financial Statements of New Mountain Finance Corporation, and the Financial Statements
of New Mountain Finance AIV Holdings Corporation (continued)
AIV Holdings and the Investment Adviser may require NMFC to use its reasonable best efforts to
register under the Securities Act of 1933 all or any portion of these registerable securities upon a “demand request”. The demand registration rights are subject to certain limitations.
The Registration Rights Agreement includes limited blackout and suspension periods. In addition, AIV Holdings and the Investment Adviser may also
require NMFC to file a shelf registration statement on Form N-2 for the resale of their registerable securities if NMFC is eligible to use Form N-2 at that time.
Holders of registerable securities have “piggyback” registration rights, including AIV Holdings, which means that these holders may
include their respective shares in any future registrations of NMFC’s equity securities, whether or not that registration relates to a primary offering by NMFC or a secondary offering by or on behalf of any of NMFC’s stockholders. AIV
Holdings, the Investment Adviser and Steven B. Klinsky (and a related entity) have priority over NMFC in any registration that is an underwritten offering.
AIV Holdings, the Investment Adviser and Steven B. Klinsky (and a related entity) will be responsible for the expenses of any demand registration (including underwriters’ discounts or commissions) and their
pro-rata share of any “piggyback” registration. NMFC has agreed to indemnify AIV Holdings, the Investment Adviser and Steven B. Klinsky (and a related entity) with respect to liabilities resulting from untrue statements or omissions in any
registration statement filed pursuant to the Registration Rights Agreement, other than untrue statements or omissions resulting from information furnished to NMFC by such parties. AIV Holdings, the Investment Adviser and Steven B. Klinsky (and a
related entity) have also agreed to indemnify NMFC with respect to liabilities resulting from untrue statements or omissions furnished by them to NMFC relating to them in any registration statement.
Note 6. Related Parties
The Companies
have entered into a number of business relationships with affiliated or related parties. NMFC and AIV Holdings own all the outstanding units of the Operating Company. As of March 31, 2012, NMFC and AIV Holdings own approximately 34.6% and
65.4%, respectively, of the units of NMF Holdings.
NMF Holdings has entered into the Investment Management Agreement with the
Investment Adviser, a wholly-owned subsidiary of New Mountain Capital. Therefore, New Mountain Capital is entitled to any profits earned by the Investment Adviser, which includes any fees payable to the Investment Adviser under the terms of the
Investment Management Agreement, less expenses incurred by the Investment Adviser in performing its services under the Investment Management Agreement.
The Companies have entered into an Administration Agreement, as amended and restated, with the Administrator, a wholly-owned subsidiary of New Mountain Capital. The Administrator arranges office space for the
Companies and provides office equipment and administrative services necessary to conduct their respective day-to-day operations pursuant to the Administration Agreement, as amended and restated. NMF Holdings reimburses the Administrator for the
allocable portion of overhead and other expenses incurred by it in performing its obligations to the Companies under the
F-49
Combined Notes to the Consolidated Financial Statements of
New Mountain Finance Holdings, L.L.C.,
the Financial Statements of New Mountain Finance Corporation, and the Financial Statements
of New Mountain Finance AIV Holdings Corporation (continued)
Administration Agreement, as amended and restated, including rent, the fees and expenses associated with performing administrative, finance and compliance functions, and the compensation of the
Companies’ chief financial officer and chief compliance officer and their respective staffs.
The Companies, the Investment Adviser
and the Administrator have entered into a royalty-free Trademark License Agreement, as amended, with New Mountain Capital, L.L.C., pursuant to which New Mountain Capital, L.L.C. has agreed to grant the Companies, the Investment Adviser and the
Administrator, a non-exclusive, royalty-free license to use the name “New Mountain” and “New Mountain Finance”.
The
Companies have adopted a formal code of ethics that governs the conduct of their respective officers and directors. These officers and directors also remain subject to the duties imposed by the 1940 Act, the Delaware General Corporation Law and the
Delaware Limited Liability Company Act.
The Investment Adviser and its affiliates may also manage other funds in the future that may
have investment mandates that are similar, in whole and in part, with NMF Holdings’ investment mandates. The Investment Adviser and its affiliates may determine that an investment is appropriate for NMF Holdings and for one or more of those
other funds. In such event, depending on the availability of such investment and other appropriate factors, the Investment Adviser or its affiliates may determine that the Operating Company should invest side-by-side with one or more other funds.
Any such investments will be made only to the extent permitted by applicable law and interpretive positions of the Securities and Exchange Commission and its staff, and consistent with the Investment Adviser’s allocation procedures.
Concurrently with the IPO, NMFC sold an additional 2,172,000 shares of its common stock to certain executives and employees of, and other
individuals affiliated with, New Mountain Capital in the Concurrent Private Placement.
Note 7. Borrowing Facilities
Holdings Credit Facility—The Loan and Security Agreement, as amended and restated, dated May 19, 2011 (the “Holdings Credit
Facility”) among NMF Holdings as the Borrower and Collateral Administrator, Wells Fargo Securities, L.L.C. as the Administrative Agent, and Wells Fargo Bank, National Association, as the Collateral Custodian, is structured as a revolving credit
facility and matures on October 21, 2015. The maximum amount of revolving borrowings available under the Holdings Credit Facility is $160,000,000. The Operating Company is permitted to borrow up to 45.0% or 25.0% of the purchase price of
pledged first lien or non-first lien debt securities, and up to 67.0% and 45.0% of the purchase price of specified first lien debt securities and specified non-first lien debt securities, respectively, subject to approval by Wells Fargo Bank,
National Association. The credit facility is collateralized by all of the investments of the Operating Company on an investment by investment basis. All fees associated with the origination or upsizing of the Holdings Credit Facility are capitalized
on the Consolidated Statement of Assets, Liabilities, and Members’ Capital and charged against income as other credit facility expenses over the life of the Holdings Credit Facility. The Holdings Credit Facility contains certain customary
affirmative and negative covenants and events of default, including the occurrence of a change in control. In addition, the Holdings Credit Facility requires the Operating Company to maintain a minimum asset coverage ratio. However, the covenants
are generally not tied to mark to market fluctuations in the prices of our investments, but rather to the performance of the underlying portfolio companies.
F-50
Combined Notes to the Consolidated Financial Statements of
New Mountain Finance Holdings, L.L.C.,
the Financial Statements of New Mountain Finance Corporation, and the Financial Statements
of New Mountain Finance AIV Holdings Corporation (continued)
The Operating Company became a party to the Holdings Credit Facility upon the IPO of NMFC. The
Holdings Credit Facility amends and restates the credit facility of the Predecessor Entities (the “Predecessor Credit Facility”). The Predecessor Credit Facility consisted of two separate facilities. First, the Loan and Security Agreement
dated October 21, 2009 among New Mountain Guardian (Leveraged), L.L.C. as the Collateral Manager, New Mountain Guardian Debt Funding, L.L.C. as the Borrower, Wells Fargo Securities, L.L.C. as the Administrative Agent, and Wells Fargo Bank,
National Association, as the Collateral Custodian, was structured as a revolving credit facility that matured on October 21, 2014. The maximum amount of revolving borrowings available under this credit facility was $112,500,000. Second, the
Loan and Security Agreement dated November 19, 2009 among New Mountain Guardian Partners (Leveraged), L.L.C as the Collateral Manager, New Mountain Guardian Partners Debt Funding, L.L.C. as the Borrower, Wells Fargo Securities, L.L.C. as the
Administrative Agent, and Wells Fargo Bank, National Association, as the Collateral Custodian, is structured as a revolving credit facility that matures on October 21, 2014. The maximum amount of revolving borrowings available under this credit
facility was $7,500,000.
The Holdings Credit Facility (as well as the Predecessor Credit Facility) bears interest at a rate of the
London Interbank Offered Rate (“LIBOR”) plus 3.0% per annum and charges a non-usage fee, based on the unused facility amount multiplied by the Non-Usage Fee Rate (as defined in the credit agreement). Interest expense and non-usage
fees were $1,061,909 and $39,236, respectively, for the three months ended March 31, 2012. Interest expense and non-usage fees were $527,347 and $198,675, respectively, for the three months ended March 31, 2011. The weighted average
interest rate for the three months ended March 31, 2012 and March 31, 2011 was 3.3% and 3.3%, respectively. The average debt outstanding for the three months ended March 31, 2012 and March 31, 2011 was $128,955,786 and
$62,611,936, respectively. The outstanding balance as of March 31, 2012 and December 31, 2011 was $151,922,888 and $129,037,813, respectively. As of March 31, 2012 and December 31, 2011, the Operating Company was in compliance
with all financial and operational covenants required by the credit facilities existing on such dates.
SLF Credit
Facility—The Operating Company’s senior loan fund’s Loan and Security Agreement, as amended and restated, dated October 27, 2010 (the “SLF Credit Facility”) among NMF SLF as the Borrower, NMF Holdings as the
Collateral Administrator, Wells Fargo Securities, L.L.C. as the Administrative Agent, and Wells Fargo Bank, National Association, as the Collateral Custodian, is structured as a revolving credit facility and matures on October 27, 2015. The
maximum amount of revolving borrowings available under the SLF Credit Facility is $175,000,000. The SLF Credit Facility is non-recourse to NMF Holdings and is secured by all assets owned by NMF SLF on an investment by investment basis. All fees
associated with the origination or upsizing of the SLF Credit Facility are capitalized on the Consolidated Statement of Assets, Liabilities, and Members’ Capital and charged against income as other credit facility expenses over the life of the
SLF Credit Facility. The SLF Credit Facility contains certain customary affirmative and negative covenants and events of default, including the occurrence of a change in control. The covenants are generally not tied to mark to market fluctuations in
the prices of our investments, but rather to the performance of the underlying portfolio companies.
The SLF Credit Facility permits
borrowings of up to 67.0% of the purchase price of pledged debt securities subject to approval by Wells Fargo Bank, National Association. Due to a fifth amendment to the SLF Credit Facility on October 27, 2011, NMF SLF is no longer restricted
from the purchase or sale of loans with an affiliate. Therefore, specified first lien loans can be moved as collateral between the Holdings Credit Facility and the SLF Credit Facility.
F-51
Combined Notes to the Consolidated Financial Statements of
New Mountain Finance Holdings, L.L.C.,
the Financial Statements of New Mountain Finance Corporation, and the Financial Statements
of New Mountain Finance AIV Holdings Corporation (continued)
The SLF Credit Facility bears interest at a rate of LIBOR plus 2.25% per annum. A non-usage
fee is paid, based on the unused facility amount multiplied by the Non-Usage Fee Rate (as defined in the credit agreement). Interest expense and non-usage fees were $1,091,122 and $3,678, respectively, for the three months ended March 31, 2012.
Interest expense and non-usage fees were $617,757 and $17,850, respectively, for the three months ended March 31, 2011. The weighted average interest rate for the three months ended March 31, 2012 and March 31, 2011 for the facility
was 2.5% and 2.5%, respectively. The average debt outstanding for the three months ended March 31, 2012 and March 31, 2011 was $172,090,248 and $98,497,713, respectively. The outstanding balance as of March 31, 2012 and
December 31, 2011 was $175,000,000 and $165,928,000, respectively. As of March 31, 2012 and December 31, 2011, NMF SLF was in compliance with all financial and operational covenants required by the SLF Credit Facility.
Leverage risk factors—The Operating Company utilizes and may utilize leverage to the maximum extent permitted by the law for
investment and other general business purposes. The Operating Company’s lenders will have fixed dollar claims on certain assets that are superior to the claims of the Operating Company’s unit holders, and therefore NMFC’s common
stockholders, and the Operating Company would expect such lenders to seek recovery against these assets in the event of a default. The use of leverage also magnifies the potential for gain or loss on amounts invested. Leverage may magnify interest
rate risk (particularly on the Operating Company’s fixed-rate investments), which is the risk that the prices of portfolio investments will fall or rise if market interest rates for those types of securities rise or fall. As a result, leverage
may cause greater changes in the Operating Company’s net asset value. Similarly, leverage may cause a sharper decline in the Operating Company’s income than if the Operating Company had not borrowed. Such a decline could negatively affect
the Operating Company’s ability to make dividend payments to its unit holders. Leverage is generally considered a speculative investment technique. The Operating Company’s ability to service any debt incurred will depend largely on
financial performance and will be subject to prevailing economic conditions and competitive pressures.
Note 8. Regulation
NMFC and AIV Holdings intend to elect to be treated, and intend to comply with the requirements to qualify annually, as RICs under Subchapter M
of the Code, commencing with the filing of their December 31, 2011 income tax returns. In order to qualify as RICs, among other things, NMFC and AIV Holdings are required to timely distribute to their stockholders at least 90.0% of investment
company taxable income, as defined by the Code, for each year. NMFC and AIV Holdings, among other things, intend to make and continue to make the requisite distributions to their stockholders, which will generally relieve NMFC and AIV Holdings from
U.S. federal, state, and local income taxes (excluding excise taxes which may be imposed under the Code). However, under certain circumstances, the distributions that the Operating Company makes to its members may not be sufficient for AIV Holdings
to satisfy the annual distribution requirement necessary for AIV Holdings to qualify as a RIC. In that case, it is expected that Guardian AIV would consent to be treated as if it received distributions from AIV Holdings sufficient to satisfy the
annual distribution requirement. Guardian AIV would be required to include the consent dividend in its taxable income as dividend from AIV Holdings, which would result in phantom (i.e., non-cash) taxable income to Guardian AIV.
Additionally as BDCs, the Companies must not acquire any assets other than “qualifying assets” specified in the 1940 Act unless, at the
time the acquisition is made, at least 70.0% of its total assets are qualifying assets (with certain limited exceptions).
F-52
Combined Notes to the Consolidated Financial Statements of
New Mountain Finance Holdings, L.L.C.,
the Financial Statements of New Mountain Finance Corporation, and the Financial Statements
of New Mountain Finance AIV Holdings Corporation (continued)
Note 9. Commitments and Contingencies
In the normal course of business, the Companies may enter into contracts that contain a variety of representations and warranties and which provide
general indemnifications. The Operating Company may also enter into future funding commitments such as revolving credit facilities, bridge financing commitments, or delayed draw commitments. As of March 31, 2012, NMF Holdings had unfunded
commitments on revolving credit facilities of $18,498,500, outstanding bridge financing commitments of $0 and other future funding commitments of $4,209,820, all of which are disclosed on NMF Holdings’ Consolidated Schedule of Investments. As
of December 31, 2011, NMF Holdings had unfunded commitments on revolving credit facilities of $22,698,500, outstanding bridge financing commitments of $35,000,000 and other future funding commitments of $4,250,632, all of which are disclosed on
NMF Holdings’ Consolidated Schedule of Investments.
The Operating Company also has revolving borrowings available under the
Holdings Credit Facility and the SLF Credit Facility as of March 31, 2012. See Note 7, Borrowing Facilities, for details.
The Operating Company may from time to time enter into financing commitment letters. As of March 31, 2012 and December 31, 2011, the Operating Company did not enter into any commitment letters to purchase
debt investments, which could require funding in the future.
Note 10. Stockholders’ Equity
The table below illustrates the effect of certain transactions on the capital accounts of NMFC:
|
|
|
|
|
|
|
|
|
|
|
|
|
|
|
|
|
|
|
|
|
|
|
|
|
|
|
|
|
| |
|
Common Stock |
|
|
Paid in
Capital
in
Excess
of Par |
|
|
Undistributed
Net
Investment
Income |
|
|
Accumulated
Undistributed
Realized
Gains
|
|
|
Net
Unrealized
Appreciation |
|
|
Total
Stockholders’
Equity |
|
| |
|
Shares |
|
|
Par
Amount |
|
|
|
|
|
|
| Balance at December 31, 2011 |
|
|
10,697,691 |
|
|
$ |
106,977 |
|
|
$ |
144,248,879 |
|
|
$ |
— |
|
|
$ |
286,307 |
|
|
$ |
844,658 |
|
|
$ |
145,486,821 |
|
| Dividends declared |
|
|
— |
|
|
|
— |
|
|
|
— |
|
|
|
(3,423,261 |
) |
|
|
— |
|
|
|
— |
|
|
|
(3,423,261 |
) |
| Net increase in stockholders’ equity resulting from operations |
|
|
— |
|
|
|
— |
|
|
|
— |
|
|
|
3,429,721 |
|
|
|
348,520 |
|
|
|
4,410,054 |
|
|
|
8,188,295 |
|
|
|
|
|
|
|
|
|
|
|
|
|
|
|
|
|
|
|
|
|
|
|
|
|
|
|
|
|
|
| Balance at March 31, 2012 |
|
|
10,697,691 |
|
|
$ |
106,977 |
|
|
$ |
144,248,879 |
|
|
$ |
6,460 |
|
|
$ |
634,827 |
|
|
$ |
5,254,712 |
|
|
$ |
150,251,855 |
|
|
|
|
|
|
|
|
|
|
|
|
|
|
|
|
|
|
|
|
|
|
|
|
|
|
|
|
|
|
F-53
Combined Notes to the Consolidated Financial Statements of
New Mountain Finance Holdings, L.L.C.,
the Financial Statements of New Mountain Finance Corporation, and the Financial Statements
of New Mountain Finance AIV Holdings Corporation (continued)
The table below illustrates the effect of certain transactions on the capital accounts of AIV
Holdings:
|
|
|
|
|
|
|
|
|
|
|
|
|
|
|
|
|
|
|
|
|
|
|
|
|
|
|
|
|
| |
|
Common Stock |
|
|
Paid in
Capital
in
Excess
of Par |
|
|
Undistributed
Net
Investment
Income |
|
|
Distributions
in
Excess of
Net
Realized
Gains |
|
|
Net
Unrealized
Appreciation
(Depreciation)
|
|
|
Total
Stockholders’
Equity
|
|
| |
|
Shares |
|
|
Par
Amount |
|
|
|
|
|
|
| Balance at December 31, 2011 |
|
|
100 |
|
|
$ |
1 |
|
|
$ |
292,383,201 |
|
|
$ |
— |
|
|
$ |
(994,034 |
) |
|
$ |
(16,374,171 |
) |
|
$ |
275,014,997 |
|
| Dividends declared |
|
|
— |
|
|
|
— |
|
|
|
— |
|
|
|
(6,471,020 |
) |
|
|
— |
|
|
|
— |
|
|
|
(6,471,020 |
) |
| Net increase in stockholders’ equity resulting from operations |
|
|
— |
|
|
|
— |
|
|
|
— |
|
|
|
6,483,232 |
|
|
|
658,813 |
|
|
|
8,336,361 |
|
|
|
15,478,406 |
|
|
|
|
|
|
|
|
|
|
|
|
|
|
|
|
|
|
|
|
|
|
|
|
|
|
|
|
|
|
| Balance at March 31, 2012 |
|
|
100 |
|
|
$ |
1 |
|
|
$ |
292,383,201 |
|
|
$ |
12,212 |
|
|
$ |
(335,221 |
) |
|
$ |
(8,037,810 |
) |
|
$ |
284,022,383 |
|
|
|
|
|
|
|
|
|
|
|
|
|
|
|
|
|
|
|
|
|
|
|
|
|
|
|
|
|
|
Note 11. Earnings Per Share
The following information sets forth the computation of basic and diluted net increase in NMFC’s net assets per share resulting from operations for the three months ended March 31, 2012:
|
|
|
|
|
| |
|
Three months ended
March 31,
2012 |
|
| Numerator for basic earnings per share: |
|
$ |
8,188,295 |
|
| Denominator for basic weighted average share: |
|
|
10,697,691 |
|
|
|
|
|
|
| Basic earnings per share: |
|
$ |
0.77 |
|
|
|
|
|
|
| Numerator for diluted earnings per share(a): |
|
$ |
23,666,701 |
|
| Denominator for diluted weighted average share(b): |
|
|
30,919,629 |
|
|
|
|
|
|
| Diluted earnings per share: |
|
$ |
0.77 |
|
|
|
|
|
|
| (a) |
Includes full income at the Operating Company for the period. |
| (b) |
Assumes AIV Holdings exchanges its units in the Operating Company for public shares of NMFC as of December 31, 2011 (see Note 1, Formation and Business Purpose).
|
F-54
Combined Notes to the Consolidated Financial Statements of
New Mountain Finance Holdings, L.L.C.,
the Financial Statements of New Mountain Finance Corporation, and the Financial Statements
of New Mountain Finance AIV Holdings Corporation (continued)
Note 12. Financial Highlights
The following information sets forth the financial highlights for the Operating Company for the respective three months ended March 31, 2012
and March 31, 2011.
|
|
|
|
|
|
|
|
|
| |
|
Three months ended |
|
| |
|
March 31, 2012 |
|
|
March 31, 2011 |
|
| Total return based on net asset value(a) |
|
|
5.63 |
% |
|
|
6.17 |
% |
| Average net assets for the period |
|
$ |
427,388,028 |
|
|
$ |
266,062,447 |
|
| Ratio to average net assets(b): |
|
|
|
|
|
|
|
|
| Net investment income |
|
|
9.33 |
% |
|
|
14.37 |
% |
| Total expenses (gross) |
|
|
9.09 |
% |
|
|
2.72 |
% |
| Total expenses (net of reimbursable expenses) |
|
|
8.57 |
% |
|
|
2.72 |
% |
| Net assets, end of period |
|
$ |
434,274,238 |
|
|
$ |
290,197,632 |
|
| Average debt outstanding—Holdings Credit Facility |
|
$ |
128,955,786 |
|
|
$ |
62,611,936 |
|
| Average debt outstanding—SLF Credit Facility |
|
$ |
172,090,248 |
|
|
$ |
98,497,713 |
|
| Weighted average shares outstanding |
|
|
30,919,629 |
|
|
|
N/A |
|
| Asset coverage ratio |
|
|
232.84 |
% |
|
|
268.95 |
% |
| Portfolio turnover |
|
|
9.81 |
% |
|
|
17.15 |
% |
| (a) |
For the three months ended March 31, 2012, total return is calculated assuming a purchase at net asset value on the opening of the first day of the year and a sale at net
asset value on the last day of the year. Dividends and distributions, if any, are assumed for purposes of this calculation, to be reinvested at the net asset value on the last day of the respective quarter. For the three months ended March 31,
2011, total return is the ratio of net income compared to capital, adjusted for capital contributions and distributions. |
| (b) |
Ratio to average net assets has been annualized. |
N/A—Not applicable.
|
|
|
|
|
| |
|
Three months ended
March 31, 2012 |
|
| Per unit data for the Operating Company: |
|
|
|
|
| Net asset value, January 1, 2012 |
|
$ |
13.60 |
|
| Net investment income |
|
|
0.32 |
|
| Net realized and unrealized gains |
|
|
0.45 |
|
| Dividends from net investment income |
|
|
(0.32 |
) |
|
|
|
|
|
| Net increase in net assets resulting from operations |
|
|
0.45 |
|
| Net asset value, March 31, 2012 |
|
$ |
14.05 |
|
|
|
|
|
|
F-55
Combined Notes to the Consolidated Financial Statements of
New Mountain Finance Holdings, L.L.C.,
the Financial Statements of New Mountain Finance Corporation, and the Financial Statements
of New Mountain Finance AIV Holdings Corporation (continued)
The following information sets forth the financial highlights for NMFC for the three months ended
March 31, 2012. The ratios to average net assets have been annualized.
|
|
|
|
|
| |
|
Three months ended
March 31, 2012 |
|
| Per share data: |
|
|
|
|
| Net asset value, January 1, 2012 |
|
$ |
13.60 |
|
| Net increase in net assets resulting from operations allocated from New Mountain Finance Holdings, L.L.C.: |
|
|
|
|
| Net investment income |
|
|
0.32 |
|
| Net realized and unrealized gains |
|
|
0.45 |
|
|
|
|
|
|
| Total net increase |
|
|
0.77 |
|
| Dividends declared |
|
|
(0.32 |
) |
|
|
|
|
|
| Net asset value, March 31, 2012 |
|
$ |
14.05 |
|
|
|
|
|
|
| Per share market value, March 31, 2012 |
|
$ |
13.74 |
|
|
|
|
|
|
| Total return based on market value(a) |
|
|
4.85 |
% |
| Total return based on net asset value(b) |
|
|
5.63 |
% |
| Average net assets for the period |
|
$ |
147,869,338 |
|
| Ratio to average net assets: |
|
|
|
|
| Total expenses allocated from New Mountain Finance Holdings, L.L.C. |
|
|
8.57 |
% |
| Net investment income allocated from New Mountain Finance Holdings, L.L.C. |
|
|
9.33 |
% |
| (a) |
Total return is calculated assuming a purchase of common stock at the opening of the first day of the year and a sale on the closing of the last business day of the period.
Dividends and distributions, if any, are assumed for purposes of this calculation, to be reinvested at prices obtained under NMFC’s dividend reinvestment plan. |
| (b) |
Total return is calculated assuming a purchase at net asset value on the opening of the first day of the period and a sale at net asset value on the last day of the period.
Dividends and distributions, if any, are assumed for purposes of this calculation, to be reinvested at the net asset value on the last day of the respective quarter. |
The following information sets forth the financial highlights for AIV Holdings for the three months ended March 31, 2012. The ratios to
average net assets have been annualized.
|
|
|
|
|
| |
|
Three months ended
March 31, 2012 |
|
| Total return based on net asset value(a) |
|
|
5.63 |
% |
| Average net assets for the period |
|
$ |
279,518,690 |
|
| Ratio to average net assets: |
|
|
|
|
| Total expenses |
|
|
8.57 |
% |
| Net investment income |
|
|
9.33 |
% |
| (a) |
Total return is calculated assuming a purchase at net asset value on the opening of the first day of the period and a sale at net asset value on the last day of the period.
Dividends and distributions, if any, are assumed for purposes of this calculation, to be reinvested at net asset value on the last day of the respective quarter. |
F-56
Combined Notes to the Consolidated Financial Statements of
New Mountain Finance Holdings, L.L.C.,
the Financial Statements of New Mountain Finance Corporation, and the Financial Statements
of New Mountain Finance AIV Holdings Corporation (continued)
Note 13. Recent Accounting Standards Updates
In May 2011, the Financial Accounting Standards Board (“FASB”) issued Accounting Standards Update No. 2011-04, Amendments to
Achieve Common Fair Value Measurement and Disclosure Requirements in U.S. GAAP and IFRSs (“ASU 2011-04”), which provides clarification about how to measure fair value and improves comparability of fair value measurements presented
and disclosed in accordance with GAAP and International Financial Reporting Standards. The amendments included in ASU 2011-04 clarify the FASB’s intent about the application of existing fair value measurement and disclosure requirements
outlined in ASC 820, as well as include some instances of changes to particular principles or requirements. ASU 2011-04 clarifies that (i) the concept of the highest and best use valuation premise applies only to nonfinancial assets,
(ii) instruments classified in stockholders’ equity should be valued from the perspective of a market participant that holds that instrument as an asset, and (iii) quantitative information should be disclosed about unobservable inputs
used in a fair value measurement that is categorized within Level III of the fair value hierarchy. ASU 2011-04 changes the guidance in (i) permitting an exception to ASC 820 by allowing an entity to measure the fair value of a group of
financial assets and financial liabilities exposed to market and credit risks to be consistent with the entity’s net risk exposures, instead of gross risk, (ii) applying premiums and discounts in a fair value measurement lacking a
Level I inputs to be consistent with the ASC 820 requirements of fair value measurement but that applying premiums and discounts in a fair value measurement related to size as a characteristic of the holding rather than as a characteristic of
the asset or liability is not permitted, and (iii) requiring additional disclosures about fair value measurements categorized within Level III of the fair value hierarchy, including the valuation processes used and the sensitivity of the
fair value measurement to changes in unobservable inputs and the interrelationships between those unobservable inputs. ASU 2011-04 is effective for the interim and annual periods beginning after December 15, 2011. The adoption of ASU 2011-04
did not have a significant impact on the Companies’ financial statements. Additional disclosure was added where applicable.
Note 14.
Subsequent Events
On May 8, 2012, the Operating Company’s board of directors, and subsequently NMFC’s board of
directors, declared a second quarter 2012 distribution of $0.34 per unit/share payable on June 29, 2012 to holders of record as of June 15, 2012. Subsequently, AIV Holdings’ board of directors declared a dividend payable on
June 29, 2012 to holders of record as of June 15, 2012 in an amount equal to $0.34 per unit multiplied by the total number of units owned by AIV Holdings of the Operating Company as of the record date.
On May 8, 2012, the Operating Company’s board of directors, and subsequently NMFC’s board of directors, declared a special
distribution of $0.23 per unit/share payable on May 31, 2012 to holders of record as of May 21, 2012 related to estimated realized capital gains attributable to the Operating Company’s investments in Lawson Software, Inc. and Infor
Lux Bond Company. As of this record date, NMFC and AIV Holdings will own 10,697,691 units and 20,221,938 units, respectively, of the Operating Company and will receive a total dividend of $2,460,469 and $4,651,046, respectively. Subsequently, AIV
Holdings’ board of directors declared a total dividend of $4,651,046 payable on May 31, 2012 to holders of record as of May 21, 2012.
F-57
Combined Notes to the Consolidated Financial Statements of
New Mountain Finance Holdings, L.L.C.,
the Financial Statements of New Mountain Finance Corporation, and the Financial Statements
of New Mountain Finance AIV Holdings Corporation (continued)
On May 8, 2012, NMF Holdings entered into a fifth amendment to the Holdings Credit Facility.
This amendment lowered the applicable interest rate spread by 0.25% to 2.75% from 3.00% and extended the maturity date by one year to October 27, 2016.
On May 8, 2012, NMF SLF entered into a ninth amendment to the SLF Credit Facility. This amendment lowered the applicable interest rate spread by 0.25% to 2.00% from 2.25% and extended the maturity date by one
year to October 27, 2016.
F-58
REPORT OF INDEPENDENT REGISTERED PUBLIC ACCOUNTING FIRM
To the Board of Directors of
New Mountain Finance Holdings, L.L.C.
New York, New York
We have reviewed the
accompanying Consolidated Statement of Assets, Liabilities and Members’ Capital of New Mountain Finance Holdings, L.L.C. (the “Company”), including the Consolidated Schedule of Investments as of March 31, 2012, and the related
Consolidated Statements of Operations, Changes in Members’ Capital, and Cash Flows for the three months ended March 31, 2012 and March 31, 2011. These interim financial statements are the responsibility of the Company’s
management.
We conducted our reviews in accordance with the standards of the Public Company Accounting Oversight Board (United States).
A review of interim financial information consists principally of applying analytical procedures and making inquiries of persons responsible for financial and accounting matters. It is substantially less in scope than an audit conducted in
accordance with the standards of the Public Company Accounting Oversight Board (United States), the objective of which is the expression of an opinion regarding the financial statements taken as a whole. Accordingly, we do not express such an
opinion.
Based on our reviews, we are not aware of any material modifications that should be made to such consolidated interim
financial statements for them to be in conformity with accounting principles generally accepted in the United States of America.
We
have previously audited, in accordance with the standards of the Public Company Accounting Oversight Board (United States), the Consolidated Statements of Assets, Liabilities and Members’ Capital of New Mountain Finance Holdings, L.L.C.,
including the Consolidated Schedules of Investments as of December 31, 2011, and the related Consolidated Statements of Operations, Changes in Members’ Capital, and Cash Flows for the year then ended (not presented herein); and in our
report dated March 7, 2012 we expressed an unqualified opinion on those consolidated financial statements. In our opinion, the information set forth in the accompanying Consolidated Statements of Assets, Liabilities and Members’ Capital as
of December 31, 2011 is fairly stated, in all material respects, in relation to the consolidated Statement of Assets, Liabilities, and Members’ Capital from which it has been derived.
/S/ DELOITTE & TOUCHE LLP
New York, New York
May 8, 2012
F-59
REPORT OF INDEPENDENT REGISTERED PUBLIC ACCOUNTING FIRM
To the Board of Directors and Stockholders of
New Mountain Finance
Corporation
New York, New York
We have
reviewed the accompanying Statement of Assets and Liabilities of New Mountain Finance Corporation (the “Company”) as of March 31, 2012, and the related Statements of Operations, Changes in Net Assets and Cash Flows for the three month
period ended March 31, 2012. These interim financial statements are the responsibility of the Company’s management.
We
conducted our review in accordance with the standards of the Public Company Accounting Oversight Board (United States). A review of interim financial information consists principally of applying analytical procedures and making inquiries of persons
responsible for financial and accounting matters. It is substantially less in scope than an audit conducted in accordance with the standards of the Public Company Accounting Oversight Board (United States), the objective of which is the expression
of an opinion regarding the financial statements taken as a whole. Accordingly, we do not express such an opinion.
Based on our review,
we are not aware of any material modifications that should be made to such consolidated interim financial statements for them to be in conformity with accounting principles generally accepted in the United States of America.
We have previously audited, in accordance with the standards of the Public Company Accounting Oversight Board (United States), the Statement of
Assets and Liabilities of New Mountain Finance Corporation as of December 31, 2011, and the related Statements of Operations, Changes in Net Assets, and Cash Flows for May 19,2011 (commencement of operations) to December 31, 2011 (not
presented herein); and in our report dated March 7, 2012 we expressed an unqualified opinion on those financial statements. In our opinion, the information set forth in the accompanying Statement of Assets and Liabilities as of
December 31, 2011 is fairly stated, in all material respects, in relation to the Statement of Assets and Liabilities from which it has been derived.
/S/ DELOITTE & TOUCHE LLP
New York, New York
May 8, 2012
F-60
REPORT OF INDEPENDENT REGISTERED PUBLIC ACCOUNTING FIRM
To the Board of Directors of
New Mountain Finance AIV Holdings
Corporation
New York, New York
We have
reviewed the accompanying Statement of Assets and Liabilities of New Mountain Finance AIV Holdings Corporation (the “Company”) as of March 31, 2012, and the related Statements of Operations, Changes in Net Assets and Cash Flows for
the three month period ended March 31, 2012. These interim financial statements are the responsibility of the Company’s management.
We conducted our review in accordance with the standards of the Public Company Accounting Oversight Board (United States). A review of interim financial information consists principally of applying analytical
procedures and making inquiries of persons responsible for financial and accounting matters. It is substantially less in scope than an audit conducted in accordance with the standards of the Public Company Accounting Oversight Board (United States),
the objective of which is the expression of an opinion regarding the financial statements taken as a whole. Accordingly, we do not express such an opinion.
Based on our review, we are not aware of any material modifications that should be made to such consolidated interim financial statements for them to be in conformity with accounting principles generally accepted
in the United States of America.
We have previously audited, in accordance with the standards of the Public Company Accounting
Oversight Board (United States), the Statement of Assets and Liabilities of New Mountain Finance AIV Holdings Corporation as of December 31, 2011, and the related Statements of Operations, Changes in Net Assets, and Cash Flows for May 19,
2011 (commencement of operations) to December 31, 2011 (not presented herein); and in our report dated March 7, 2012 we expressed an unqualified opinion on those financial statements. In our opinion, the information set forth in the
accompanying Statement of Assets and Liabilities as of December 31, 2011 is fairly stated, in all material respects, in relation to the Statement of Assets and Liabilities from which it has been derived.
/S/ DELOITTE & TOUCHE LLP
New York, New York
May 8, 2012
F-61
REPORT OF INDEPENDENT REGISTERED PUBLIC ACCOUNTING FIRM
To the Board of Directors of
New Mountain Finance Holdings,
L.L.C.:
We have audited the accompanying consolidated statements of assets, liabilities and members’ capital of New Mountain
Finance Holdings, L.L.C. (the “Company”), including the consolidated schedules of investments as of December 31, 2011 and 2010, and the related consolidated statements of operations, changes in members’ capital, and cash flows
for each of the three years in the period ended December 31, 2011 and the financial highlights for the period from October 29, 2008 (commencement of operations) to December 31, 2008 and each of the three years in the period ended
December 31, 2011. These financial statements and financial highlights are the responsibility of the Company’s management. Our responsibility is to express an opinion on these financial statements and financial highlights based on our
audits.
We conducted our audits in accordance with the standards of the Public Company Accounting Oversight Board (United States).
These standards require that we plan and perform the audit to obtain reasonable assurance about whether the financial statements are free of material misstatement. The Company is not required to have, nor were we engaged to perform, an audit of its
internal control over financial reporting. Our audits included consideration of internal control over financial reporting as a basis for designing audit procedures that are appropriate in the circumstances, but not for the purpose of expressing an
opinion on the effectiveness of the Company’s internal control over financial reporting. Accordingly, we express no such opinion. An audit also includes examining, on a test basis, evidence supporting the amounts and disclosures in the
financial statements, assessing the accounting principles used and significant estimates made by management, as well as evaluating the overall financial statement presentation. Our procedures included confirmation of investments as of
December 31, 2011, by correspondence with the custodian, loan agent or borrower; where replies were not received, we performed other auditing procedures. We believe that our audits provide a reasonable basis for our opinion.
In our opinion, such financial statements and financial highlights referred to above present fairly, in all material respects, the consolidated
financial position of New Mountain Finance Holdings, L.L.C. as of December 31, 2011 and 2010, and the consolidated results of its operations, its consolidated changes in members’ capital, and its consolidated cash flows for each of the
three years in the period ended December 31, 2011 and the financial highlights for the period from October 29, 2008 (commencement of operations) to December 31, 2008 and each of the three years in the period ended
December 31,2011 in conformity with accounting principles generally accepted in the United States of America.
As explained in
Note 4, the financial statements include investments valued at $90,966,959 (12.45% of total assets) and $30,255,961 (6.57% of total assets) as of December 31, 2011 and 2010, respectively, whose fair values have been estimated by the
Company in the absence of readily determinable fair values.
/s/ DELOITTE & TOUCHE LLP
New York, New York
March 7, 2012
F-62
REPORT OF INDEPENDENT REGISTERED PUBLIC ACCOUNTING FIRM
To the Board of Directors of
New Mountain Finance Corporation:
We have audited the accompanying statement of assets and liabilities of New Mountain Finance Corporation (the “Company”) as of
December 31, 2011, and the related statements of operations, changes in net assets, cash flows and the financial highlights for the period from May 19, 2011(commencement of operations) to December 31, 2011. These financial statements
and financial highlights are the responsibility of the Company’s management. Our responsibility is to express an opinion on these financial statements and financial highlights based on our audit.
We conducted our audit in accordance with the standards of the Public Company Accounting Oversight Board (United States). These standards require
that we plan and perform the audit to obtain reasonable assurance about whether the financial statements are free of material misstatement. The Company is not required to have, nor were we engaged to perform, an audit of its internal control over
financial reporting. Our audits included consideration of internal control over financial reporting as a basis for designing audit procedures that are appropriate in the circumstances, but not for the purpose of expressing an opinion on the
effectiveness of the Company’s internal control over financial reporting. Accordingly, we express no such opinion. An audit also includes examining, on a test basis, evidence supporting the amounts and disclosures in the financial statements,
assessing the accounting principles used and significant estimates made by management, as well as evaluating the overall financial statement presentation. We believe that our audit provides a reasonable basis for our opinion.
In our opinion, such financial statements and financial highlights referred to above present fairly, in all material respects, the financial
position of New Mountain Finance Corporation as of December 31, 2011 and the results of its operations, changes in its net assets, its cash flows, and the financial highlights for the period from May 19, 2011(commencement of operations) to
December 31, 2011 in conformity with accounting principles generally accepted in the United States of America.
/s/ DELOITTE & TOUCHE LLP
New York, New York
March 7, 2012
F-63
REPORT OF INDEPENDENT REGISTERED PUBLIC ACCOUNTING FIRM
To the Board of Directors of
New Mountain Finance AIV Holdings
Corporation:
We have audited the accompanying statement of assets and liabilities of New Mountain Finance AIV Holdings Corporation (the
“Company”) as of December 31, 2011, and the related statements of operations, changes in net assets, cash flows and the financial highlights for the period from May 19, 2011(commencement of operations) to December 31, 2011.
These financial statements and financial highlights are the responsibility of the Company’s management. Our responsibility is to express an opinion on these financial statements and financial highlights based on our audit.
We conducted our audit in accordance with the standards of the Public Company Accounting Oversight Board (United States). These standards require
that we plan and perform the audit to obtain reasonable assurance about whether the financial statements are free of material misstatement. The Company is not required to have, nor were we engaged to perform, an audit of its internal control over
financial reporting. Our audits included consideration of internal control over financial reporting as a basis for designing audit procedures that are appropriate in the circumstances, but not for the purpose of expressing an opinion on the
effectiveness of the Company’s internal control over financial reporting. Accordingly, we express no such opinion. An audit also includes examining, on a test basis, evidence supporting the amounts and disclosures in the financial statements,
assessing the accounting principles used and significant estimates made by management, as well as evaluating the overall financial statement presentation. We believe that our audit provides a reasonable basis for our opinion.
In our opinion, such financial statements and financial highlights referred to above present fairly, in all material respects, the financial
position of New Mountain Finance AIV Holdings Corporation as of December 31, 2011 and the results of its operations, changes in its net assets, its cash flows, and the financial highlights for the period from May 19, 2011 (commencement of
operations) to December 31, 2011 in conformity with accounting principles generally accepted in the United States of America.
/s/
DELOITTE & TOUCHE LLP
New York, New York
March 7, 2012
F-64
New Mountain Finance Holdings, L.L.C.
Consolidated Statements of Assets, Liabilities and Members’ Capital
|
|
|
|
|
|
|
|
|
| |
|
December 31,
2011 |
|
|
December 31,
2010 |
|
| Assets |
|
|
|
|
|
|
|
|
| Investments at fair value (cost of $699,864,784 and $414,308,823, respectively) |
|
$ |
703,513,560 |
|
|
$ |
441,057,840 |
|
| Cash and cash equivalents |
|
|
15,318,811 |
|
|
|
10,744,082 |
|
| Interest receivable |
|
|
7,307,092 |
|
|
|
3,007,787 |
|
| Deferred credit facility costs (net of accumulated amortization of $855,955 and $69,909, respectively) |
|
|
3,713,739 |
|
|
|
1,880,120 |
|
| Deferred offering costs |
|
|
— |
|
|
|
3,528,110 |
|
| Receivable from affiliate |
|
|
369,017 |
|
|
|
— |
|
| Other assets |
|
|
356,486 |
|
|
|
5,842 |
|
|
|
|
|
|
|
|
|
|
| Total assets |
|
$ |
730,578,705 |
|
|
$ |
460,223,781 |
|
|
|
|
|
|
|
|
|
|
| Liabilities |
|
|
|
|
|
|
|
|
| SLF Credit Facility |
|
|
165,928,000 |
|
|
|
56,936,000 |
|
| Holdings Credit Facility |
|
|
129,037,813 |
|
|
|
59,696,938 |
|
| Payable for unsettled securities purchased |
|
|
7,604,931 |
|
|
|
94,462,500 |
|
| Management fee payable |
|
|
2,200,354 |
|
|
|
— |
|
| Incentive fee payable |
|
|
2,317,328 |
|
|
|
— |
|
| Interest payable |
|
|
1,747,095 |
|
|
|
813,192 |
|
| Payable to affiliates |
|
|
— |
|
|
|
2,531,319 |
|
| Other liabilities |
|
|
1,241,366 |
|
|
|
3,856,571 |
|
|
|
|
|
|
|
|
|
|
| Total liabilities |
|
|
310,076,887 |
|
|
|
218,296,520 |
|
| Members’ Capital |
|
|
420,501,818 |
|
|
|
241,927,261 |
|
|
|
|
|
|
|
|
|
|
| Total liabilities and members’ capital |
|
$ |
730,578,705 |
|
|
$ |
460,223,781 |
|
|
|
|
|
|
|
|
|
|
| Outstanding common membership units(a) |
|
|
30,919,629 |
|
|
|
|
|
| Capital per unit(a) |
|
|
$13.60 |
|
|
|
|
|
| (a) |
Fund was not unitized as of December 31, 2010. |
The accompanying notes are an integral part of these consolidated financial statements.
F-65
New Mountain Finance Holdings, L.L.C.
Consolidated Statements of Operations
|
|
|
|
|
|
|
|
|
|
|
|
|
| |
|
Year ended December 31, |
|
| |
|
2011 |
|
|
2010 |
|
|
2009 |
|
| Investment income |
|
|
|
|
|
|
|
|
|
|
|
|
| Interest income |
|
$ |
55,809,453 |
|
|
$ |
40,485,158 |
|
|
$ |
21,108,672 |
|
| Other income |
|
|
713,991 |
|
|
|
889,619 |
|
|
|
658,035 |
|
|
|
|
|
|
|
|
|
|
|
|
|
|
| Total investment income |
|
|
56,523,444 |
|
|
|
41,374,777 |
|
|
|
21,766,707 |
|
|
|
|
|
|
|
|
|
|
|
|
|
|
| Expenses |
|
|
|
|
|
|
|
|
|
|
|
|
| Interest and other credit facility expenses |
|
|
7,086,019 |
|
|
|
2,948,460 |
|
|
|
490,189 |
|
| Management fee |
|
|
4,938,004 |
|
|
|
70,999 |
|
|
|
134,966 |
|
| Incentive fee |
|
|
3,522,330 |
|
|
|
— |
|
|
|
— |
|
| Administrative expenses (net of reimbursable expenses of $870,032, $0 and $0, respectively) |
|
|
744,959 |
|
|
|
401,133 |
|
|
|
162,978 |
|
| Professional fees (net of reimbursable expenses of $1,315,733, $0 and $0, respectively) |
|
|
721,578 |
|
|
|
327,331 |
|
|
|
381,877 |
|
| Other general and administrative expenses |
|
|
985,283 |
|
|
|
162,593 |
|
|
|
188,974 |
|
|
|
|
|
|
|
|
|
|
|
|
|
|
| Total expenses |
|
|
17,998,173 |
|
|
|
3,910,516 |
|
|
|
1,358,984 |
|
|
|
|
|
|
|
|
|
|
|
|
|
|
| Net investment income |
|
|
38,525,271 |
|
|
|
37,464,261 |
|
|
|
20,407,723 |
|
| Realized gains on investments |
|
|
16,252,062 |
|
|
|
66,287,267 |
|
|
|
37,128,956 |
|
| Net change in unrealized (depreciation) appreciation of investments |
|
|
(23,100,241 |
) |
|
|
(39,959,267 |
) |
|
|
68,143,411 |
|
|
|
|
|
|
|
|
|
|
|
|
|
|
| Net increase in capital resulting from operations |
|
$ |
31,677,092 |
|
|
$ |
63,792,261 |
|
|
$ |
125,680,090 |
|
|
|
|
|
|
|
|
|
|
|
|
|
|
The accompanying notes are an integral part of these consolidated financial statements.
F-66
New Mountain Finance Holdings, L.L.C.
Consolidated Statements of Changes in Members’ Capital
|
|
|
|
|
|
|
|
|
|
|
|
|
| |
|
Year ended December 31, |
|
| |
|
2011 |
|
|
2010 |
|
|
2009 |
|
| Increase (decrease) in members’ capital resulting from operations: |
|
|
|
|
|
|
|
|
|
|
|
|
| Net investment income |
|
$ |
38,525,271 |
|
|
$ |
37,464,261 |
|
|
$ |
20,407,723 |
|
| Realized gains on investments |
|
|
16,252,062 |
|
|
|
66,287,267 |
|
|
|
37,128,956 |
|
| Net change in unrealized (depreciation) appreciation of investments |
|
|
(23,100,241 |
) |
|
|
(39,959,267 |
) |
|
|
68,143,411 |
|
|
|
|
|
|
|
|
|
|
|
|
|
|
| Net increase in members’ capital resulting from operations |
|
|
31,677,092 |
|
|
|
63,792,261 |
|
|
|
125,680,090 |
|
| Distributions |
|
|
(10,249,155 |
) |
|
|
(115,940,206 |
) |
|
|
(202,095,083 |
) |
| Contributions |
|
|
195,294,674 |
|
|
|
54,634,523 |
|
|
|
285,501,773 |
|
| Dividends paid |
|
|
(26,590,881 |
) |
|
|
— |
|
|
|
— |
|
| Offering costs |
|
|
(11,557,173 |
) |
|
|
— |
|
|
|
— |
|
|
|
|
|
|
|
|
|
|
|
|
|
|
| Net increase in members’ capital |
|
|
178,574,557 |
|
|
|
2,486,578 |
|
|
|
209,086,780 |
|
| Members’ capital at beginning of period |
|
|
241,927,261 |
|
|
|
239,440,683 |
|
|
|
30,353,903 |
|
|
|
|
|
|
|
|
|
|
|
|
|
|
| Members’ capital at end of period |
|
$ |
420,501,818 |
|
|
$ |
241,927,261 |
|
|
$ |
239,440,683 |
|
|
|
|
|
|
|
|
|
|
|
|
|
|
The accompanying notes are an integral part of these consolidated financial statements.
F-67
New Mountain Finance Holdings, L.L.C.
Consolidated Statements of Cash Flows
|
|
|
|
|
|
|
|
|
|
|
|
|
| |
|
Year ended December 31, |
|
| |
|
2011 |
|
|
2010 |
|
|
2009 |
|
| Cash flows from operating activities |
|
|
|
|
|
|
|
|
|
|
|
|
| Net increase in capital resulting from operations |
|
$ |
31,677,092 |
|
|
$ |
63,792,261 |
|
|
$ |
125,680,090 |
|
| Adjustments to reconcile net (increase) decrease in capital resulting from operations to net cash (used in) provided by operating
activities: |
|
|
|
|
|
|
|
|
|
|
|
|
| Realized gains on investments |
|
|
(16,252,062 |
) |
|
|
(66,287,267 |
) |
|
|
(37,128,956 |
) |
| Net change in unrealized depreciation (appreciation) of investments |
|
|
23,100,241 |
|
|
|
39,959,267 |
|
|
|
(68,143,411 |
) |
| Amortization of purchase discount |
|
|
(5,861,691 |
) |
|
|
(16,326,857 |
) |
|
|
(10,030,920 |
) |
| Amortization of deferred credit facility costs |
|
|
786,046 |
|
|
|
69,909 |
|
|
|
— |
|
| Non-cash interest income |
|
|
(1,538,462 |
) |
|
|
(3,374,086 |
) |
|
|
(815,611 |
) |
| (Increase) decrease in operating assets: |
|
|
|
|
|
|
|
|
|
|
|
|
| Purchase of investments |
|
|
(494,693,776 |
) |
|
|
(332,708,278 |
) |
|
|
(274,180,589 |
) |
| Proceeds from sales and paydowns of investments |
|
|
231,962,469 |
|
|
|
260,039,529 |
|
|
|
125,429,657 |
|
| Cash received for purchase of undrawn portion of revolving credit facility |
|
|
1,363,154 |
|
|
|
— |
|
|
|
5,798,346 |
|
| Cash paid for sale of undrawn portion of revolving credit facility |
|
|
— |
|
|
|
(1,837,500 |
) |
|
|
— |
|
| Cash paid for drawn revolver |
|
|
(535,593 |
) |
|
|
— |
|
|
|
— |
|
| Interest receivable |
|
|
(4,299,305 |
) |
|
|
(2,209,025 |
) |
|
|
(770,292 |
) |
| Receivable from unsettled securities sold |
|
|
— |
|
|
|
5,124,622 |
|
|
|
(5,124,622 |
) |
| Receivable from affiliate |
|
|
(369,017 |
) |
|
|
— |
|
|
|
— |
|
| Other assets |
|
|
(350,644 |
) |
|
|
(4,435 |
) |
|
|
(1,407 |
) |
| Increase (decrease) in operating liabilities: |
|
|
|
|
|
|
|
|
|
|
|
|
| Payable for unsettled securities purchased |
|
|
(86,857,569 |
) |
|
|
82,230,235 |
|
|
|
(19,082,935 |
) |
| Management fee payable |
|
|
2,200,354 |
|
|
|
— |
|
|
|
— |
|
| Incentive fee payable |
|
|
2,317,328 |
|
|
|
— |
|
|
|
— |
|
| Interest payable |
|
|
933,903 |
|
|
|
340,503 |
|
|
|
472,689 |
|
| Payable to affiliates |
|
|
(394,279 |
) |
|
|
(190,500 |
) |
|
|
392,679 |
|
| Other liabilities |
|
|
533,795 |
|
|
|
432,931 |
|
|
|
274,641 |
|
| Net cash flows (used in) provided by operating activities |
|
|
(316,278,016 |
) |
|
|
29,051,309 |
|
|
|
(157,230,641 |
) |
| Cash flows from financing activities |
|
|
|
|
|
|
|
|
|
|
|
|
| Contributions |
|
|
195,294,674 |
|
|
|
54,634,523 |
|
|
|
285,501,773 |
|
| Distributions |
|
|
(10,249,155 |
) |
|
|
(115,940,206 |
) |
|
|
(202,095,083 |
) |
| Dividends paid |
|
|
(26,590,881 |
) |
|
|
— |
|
|
|
— |
|
| Offering costs paid |
|
|
(11,557,173 |
) |
|
|
— |
|
|
|
— |
|
| Proceeds from Holdings Credit Facility |
|
|
336,508,450 |
|
|
|
44,850,495 |
|
|
|
77,744,675 |
|
| Repayment of Holdings Credit Facility |
|
|
(267,167,575 |
) |
|
|
(62,898,232 |
) |
|
|
— |
|
| Proceeds from SLF Credit Facility |
|
|
172,060,007 |
|
|
|
56,936,000 |
|
|
|
— |
|
| Repayment of SLF Credit Facility |
|
|
(63,068,007 |
) |
|
|
— |
|
|
|
— |
|
| Deferred credit facility costs paid |
|
|
(4,377,595 |
) |
|
|
— |
|
|
|
— |
|
| Net cash flows provided by (used in) financing activities |
|
|
320,852,745 |
|
|
|
(22,417,420 |
) |
|
|
161,151,365 |
|
| Net increase in cash and cash equivalents |
|
|
4,574,729 |
|
|
|
6,633,889 |
|
|
|
3,920,724 |
|
| Cash and cash equivalents at the beginning of the period |
|
|
10,744,082 |
|
|
|
4,110,193 |
|
|
|
189,469 |
|
| Cash and cash equivalents at the end of the period |
|
$ |
15,318,811 |
|
|
$ |
10,744,082 |
|
|
$ |
4,110,193 |
|
| Supplemental disclosure of cash flow information |
|
|
|
|
|
|
|
|
|
|
|
|
| Interest paid |
|
$ |
4,358,103 |
|
|
$ |
2,130,839 |
|
|
$ |
— |
|
| Non-cash financing activities: |
|
|
|
|
|
|
|
|
|
|
|
|
| Accrual for offering costs |
|
$ |
— |
|
|
$ |
3,528,110 |
|
|
$ |
— |
|
| Accrual for deferred credit facility costs |
|
|
192,099 |
|
|
|
1,950,029 |
|
|
|
— |
|
The accompanying notes are an integral part of these consolidated financial statements.
F-68
New Mountain Finance Holdings, L.L.C.
Consolidated Schedule of Investments
December 31, 2011
|
|
|
|
|
|
|
|
|
|
|
|
|
|
|
|
|
|
|
|
|
|
|
|
|
| Portfolio Company, Location
and Industry |
|
Type of
Investment |
|
Interest Rate |
|
Maturity
Date |
|
|
Principal
Amount,
Par Value
or Shares |
|
|
Cost |
|
|
Fair
Value |
|
|
Percent of
Members’
Capital |
|
| Funded Debt Investments—United States |
|
|
|
|
|
|
|
|
|
|
|
|
|
|
|
|
|
|
|
|
|
|
|
|
| Novell, Inc. (fka Attachmate Corporation, NetIQ Corporation) |
|
|
|
|
|
|
|
|
|
|
|
|
|
|
|
|
|
|
|
|
|
|
|
|
| Software |
|
First lien(3) |
|
6.50% (Base Rate + 5.00%) |
|
|
4/27/2017 |
|
|
$ |
13,825,000 |
|
|
$ |
13,703,238 |
|
|
$ |
13,583,062 |
|
|
|
|
|
|
|
Second lien(2) |
|
9.50% (Base Rate + 8.00%) |
|
|
10/27/2017 |
|
|
|
20,000,000 |
|
|
|
19,669,018 |
|
|
|
19,200,000 |
|
|
|
|
|
|
|
|
|
|
|
|
|
|
|
|
|
|
|
|
|
|
|
|
|
|
|
|
|
|
|
|
|
|
|
|
|
|
|
|
|
33,825,000 |
|
|
|
33,372,256 |
|
|
|
32,783,062 |
|
|
|
7.80 |
% |
|
|
|
|
|
|
|
|
|
|
|
|
|
|
|
|
|
|
|
|
|
|
|
|
|
| Decision Resources, LLC |
|
|
|
|
|
|
|
|
|
|
|
|
|
|
|
|
|
|
|
|
|
|
|
|
| Business Services |
|
First lien(3) |
|
7.00% (Base Rate + 5.50%) |
|
|
12/28/2016 |
|
|
|
17,820,000 |
|
|
|
17,588,508 |
|
|
|
17,196,300 |
|
|
|
|
|
|
|
Second lien(2) |
|
9.50% (Base Rate + 8.00%) |
|
|
5/7/2018 |
|
|
|
14,500,000 |
|
|
|
14,368,204 |
|
|
|
14,282,500 |
|
|
|
|
|
|
|
|
|
|
|
|
|
|
|
|
|
|
|
|
|
|
|
|
|
|
|
|
|
|
|
|
|
|
|
|
|
|
|
|
|
32,320,000 |
|
|
|
31,956,712 |
|
|
|
31,478,800 |
|
|
|
7.48 |
% |
|
|
|
|
|
|
|
|
|
|
|
|
|
|
|
|
|
|
|
|
|
|
|
|
|
|
|
|
|
|
|
|
|
|
|
|
|
|
|
|
|
|
|
|
|
|
|
|
|
|
| Lawson Software, Inc. (fka SoftBrands, Inc.) |
|
|
|
|
|
|
|
|
|
|
|
|
|
|
|
|
|
|
|
|
|
|
|
|
| Software |
|
First lien(3) |
|
6.75% (Base Rate + 5.25%) |
|
|
7/5/2017 |
|
|
|
18,703,125 |
|
|
|
18,001,977 |
|
|
|
18,305,684 |
|
|
|
|
|
|
|
Subordinated(2) |
|
11.50% |
|
|
7/15/2018 |
|
|
|
13,500,000 |
|
|
|
12,329,105 |
|
|
|
13,162,500 |
|
|
|
|
|
|
|
|
|
|
|
|
|
|
|
|
|
|
|
|
|
|
|
|
|
|
|
|
|
|
|
|
|
|
|
|
|
|
|
|
|
32,203,125 |
|
|
|
30,331,082 |
|
|
|
31,468,184 |
|
|
|
7.47 |
% |
|
|
|
|
|
|
|
|
|
|
|
|
|
|
|
|
|
|
|
|
|
|
|
|
|
| Meritas Schools Holdings, LLC |
|
|
|
|
|
|
|
|
|
|
|
|
|
|
|
|
|
|
|
|
|
|
|
|
| Education |
|
First lien(3) |
|
7.50% (Base Rate + 6.00%) |
|
|
7/29/2017 |
|
|
|
9,500,000 |
|
|
|
9,409,890 |
|
|
|
9,357,500 |
|
|
|
|
|
|
|
Second lien(2) |
|
11.50% (Base Rate + 10.00%) |
|
|
1/29/2018 |
|
|
|
20,000,000 |
|
|
|
19,712,425 |
|
|
|
19,650,000 |
|
|
|
|
|
|
|
|
|
|
|
|
|
|
|
|
|
|
|
|
|
|
|
|
|
|
|
|
|
|
|
|
|
|
|
|
|
|
|
|
|
29,500,000 |
|
|
|
29,122,315 |
|
|
|
29,007,500 |
|
|
|
6.89 |
% |
|
|
|
|
|
|
|
|
|
|
|
|
|
|
|
|
|
|
|
|
|
|
|
|
|
| Global Knowledge Training LLC |
|
|
|
|
|
|
|
|
|
|
|
|
|
|
|
|
|
|
|
|
|
|
|
|
| Education |
|
First lien(3) |
|
6.50% (Base Rate + 5.00%) |
|
|
4/21/2017 |
|
|
|
4,867,647 |
|
|
|
4,796,665 |
|
|
|
4,794,632 |
|
|
|
|
|
|
|
Second lien(2) |
|
11.50% (Base Rate + 9.75%) |
|
|
10/21/2018 |
|
|
|
24,250,000 |
|
|
|
23,764,101 |
|
|
|
23,755,300 |
|
|
|
|
|
|
|
|
|
|
|
|
|
|
|
|
|
|
|
|
|
|
|
|
|
|
|
|
|
|
|
|
|
|
|
|
|
|
|
|
|
29,117,647 |
|
|
|
28,560,766 |
|
|
|
28,549,932 |
|
|
|
6.79 |
% |
|
|
|
|
|
|
|
|
|
|
|
|
|
|
|
|
|
|
|
|
|
|
|
|
|
| Managed Health Care Associates, Inc. |
|
|
|
|
|
|
|
|
|
|
|
|
|
|
|
|
|
|
|
|
|
|
|
|
| Healthcare Services |
|
First lien(2) |
|
3.55% (Base Rate + 3.25%) |
|
|
8/1/2014 |
|
|
|
15,467,673 |
|
|
|
12,941,252 |
|
|
|
14,462,274 |
|
|
|
|
|
|
|
Second lien(2) |
|
6.80% (Base Rate + 6.50%) |
|
|
2/1/2015 |
|
|
|
15,000,000 |
|
|
|
11,950,542 |
|
|
|
13,950,000 |
|
|
|
|
|
|
|
|
|
|
|
|
|
|
|
|
|
|
|
|
|
|
|
|
|
|
|
|
|
|
|
|
|
|
|
|
|
|
|
|
|
30,467,673 |
|
|
|
24,891,794 |
|
|
|
28,412,274 |
|
|
|
6.76 |
% |
|
|
|
|
|
|
|
|
|
|
|
|
|
|
|
|
|
|
|
|
|
|
|
|
|
| Insight Pharmaceuticals LLC |
|
|
|
|
|
|
|
|
|
|
|
|
|
|
|
|
|
|
|
|
|
|
|
|
| Healthcare Products |
|
Second lien(2) |
|
13.25% (Base Rate + 11.75%) |
|
|
8/25/2017 |
|
|
|
25,000,000 |
|
|
|
24,037,614 |
|
|
|
24,875,000 |
|
|
|
5.92 |
% |
| Renaissance Learning, Inc. |
|
|
|
|
|
|
|
|
|
|
|
|
|
|
|
|
|
|
|
|
|
|
|
|
| Education |
|
Second lien(2) |
|
12.00% (Base Rate + 10.50%) |
|
|
10/19/2018 |
|
|
$ |
20,000,000 |
|
|
$ |
19,016,871 |
|
|
$ |
20,100,000 |
|
|
|
4.78 |
% |
| Learning Care Group (US), Inc. |
|
|
|
|
|
|
|
|
|
|
|
|
|
|
|
|
|
|
|
|
|
|
|
|
| Education |
|
First lien(2) |
|
12.00% |
|
|
4/27/2016 |
|
|
|
17,368,421 |
|
|
|
17,115,609 |
|
|
|
16,695,606 |
|
|
|
|
|
|
|
Subordinated(2) |
|
15.00% PIK* |
|
|
6/30/2016 |
|
|
|
3,273,004 |
|
|
|
3,089,870 |
|
|
|
2,971,990 |
|
|
|
|
|
|
|
|
|
|
|
|
|
|
|
|
|
|
|
|
|
|
|
|
|
|
|
|
|
|
|
|
|
|
|
|
|
|
|
|
|
20,641,425 |
|
|
|
20,205,479 |
|
|
|
19,667,596 |
|
|
|
4.68 |
% |
|
|
|
|
|
|
|
|
|
|
|
|
|
|
|
|
|
|
|
|
|
|
|
|
|
| Transplace Texas, L.P. |
|
|
|
|
|
|
|
|
|
|
|
|
|
|
|
|
|
|
|
|
|
|
|
|
| Logistics |
|
Second lien(2) |
|
11.00% (Base Rate + 9.00%) |
|
|
4/12/2017 |
|
|
|
20,000,000 |
|
|
|
19,514,617 |
|
|
|
19,500,000 |
|
|
|
4.64 |
% |
| U.S. Healthworks Holding Company, Inc. |
|
|
|
|
|
|
|
|
|
|
|
|
|
|
|
|
|
|
|
|
|
|
|
|
| Healthcare Services |
|
Second lien(2) |
|
10.50% (Base Rate + 9.00%) |
|
|
6/15/2017 |
|
|
|
20,000,000 |
|
|
|
19,719,547 |
|
|
|
19,500,000 |
|
|
|
4.64 |
% |
| Unitek Global Services, Inc. |
|
|
|
|
|
|
|
|
|
|
|
|
|
|
|
|
|
|
|
|
|
|
|
|
| Business Services |
|
First lien(2) |
|
9.00% (Base Rate + 7.50%) |
|
|
4/15/2018 |
|
|
|
19,850,000 |
|
|
|
19,312,984 |
|
|
|
19,440,594 |
|
|
|
4.62 |
% |
| Ipreo Holdings LLC |
|
|
|
|
|
|
|
|
|
|
|
|
|
|
|
|
|
|
|
|
|
|
|
|
| Information Services |
|
First lien(3) |
|
8.00% (Base Rate + 6.50%) |
|
|
8/5/2017 |
|
|
|
18,703,125 |
|
|
|
18,308,298 |
|
|
|
18,282,305 |
|
|
|
4.35 |
% |
The accompanying
notes are an integral part of these consolidated financial statements.
F-69
New Mountain Finance Holdings, L.L.C.
Consolidated Schedule of Investments (continued)
December 31, 2011
|
|
|
|
|
|
|
|
|
|
|
|
|
|
|
|
|
|
|
|
|
|
|
|
|
| Portfolio Company, Location
and Industry |
|
Type of
Investment |
|
Interest Rate |
|
Maturity
Date |
|
|
Principal
Amount,
Par Value
or Shares |
|
|
Cost |
|
|
Fair
Value |
|
|
Percent
of
Members’
Capital |
|
| KeyPoint Government Solutions, Inc. |
|
|
|
|
|
|
|
|
|
|
|
|
|
|
|
|
|
|
|
|
|
|
|
|
| Federal Services |
|
First lien(2) |
|
10.00% (Base Rate + 8.00%) |
|
|
12/31/2015 |
|
|
|
17,820,000 |
|
|
|
17,521,860 |
|
|
|
17,909,100 |
|
|
|
4.26 |
% |
| Sotera Defense Solutions, Inc. (Global Defense Technology & Systems, Inc.) |
|
|
|
|
|
|
|
|
|
|
|
|
|
|
|
|
|
|
|
|
|
|
|
|
| Federal Services |
|
First lien(3) |
|
7.00% (Base Rate + 5.50%) |
|
|
4/21/2017 |
|
|
|
16,915,000 |
|
|
|
16,764,489 |
|
|
|
16,872,713 |
|
|
|
4.01 |
% |
| SRA International, Inc. |
|
|
|
|
|
|
|
|
|
|
|
|
|
|
|
|
|
|
|
|
|
|
|
|
| Federal Services |
|
First lien(3) |
|
6.50% (Base Rate + 5.25%) |
|
|
7/20/2018 |
|
|
|
17,433,389 |
|
|
|
16,624,324 |
|
|
|
16,416,447 |
|
|
|
3.90 |
% |
| OpenLink International, Inc. |
|
|
|
|
|
|
|
|
|
|
|
|
|
|
|
|
|
|
|
|
|
|
|
|
| Software |
|
First lien(2) |
|
7.75% (Base Rate + 6.25%) |
|
|
10/30/2017 |
|
|
|
15,000,000 |
|
|
|
14,706,514 |
|
|
|
15,056,250 |
|
|
|
3.58 |
% |
| Volume Services America, Inc. (Centerplate) |
|
|
|
|
|
|
|
|
|
|
|
|
|
|
|
|
|
|
|
|
|
|
|
|
| Consumer Services |
|
First lien(2) |
|
10.50% (Base Rate + 8.50%) |
|
|
9/16/2016 |
|
|
|
14,850,000 |
|
|
|
14,512,417 |
|
|
|
14,924,250 |
|
|
|
3.55 |
% |
| SonicWALL, Inc. |
|
|
|
|
|
|
|
|
|
|
|
|
|
|
|
|
|
|
|
|
|
|
|
|
| Software |
|
First lien(3) |
|
8.27% (Base Rate + 6.19%) |
|
|
1/23/2016 |
|
|
|
4,822,985 |
|
|
|
4,831,869 |
|
|
|
4,847,099 |
|
|
|
|
|
|
|
Second lien(2) |
|
12.00% (Base Rate + 10.00%) |
|
|
1/23/2017 |
|
|
|
10,000,000 |
|
|
|
9,746,209 |
|
|
|
9,950,000 |
|
|
|
|
|
|
|
|
|
|
|
|
|
|
|
|
|
|
|
|
|
|
|
|
|
|
|
|
|
|
|
|
|
|
|
|
|
|
|
|
|
14,822,985 |
|
|
|
14,578,078 |
|
|
|
14,797,099 |
|
|
|
3.52 |
% |
|
|
|
|
|
|
|
|
|
|
|
|
|
|
|
|
|
|
|
|
|
|
|
|
|
| PODS, Inc.(6) |
|
|
|
|
|
|
|
|
|
|
|
|
|
|
|
|
|
|
|
|
|
|
|
|
| Consumer Services |
|
|
|
|
|
|
|
|
|
|
|
|
|
|
|
|
|
|
|
|
|
|
|
|
| PODS Funding Corp. II |
|
First lien(2) |
|
8.50% (Base Rate + 7.00%) |
|
|
11/29/2016 |
|
|
$ |
11,561,538 |
|
|
$ |
11,218,525 |
|
|
$ |
11,214,692 |
|
|
|
|
|
| Storapod Holding Company, Inc. |
|
Subordinated(2) |
|
21.00% PIK* |
|
|
11/29/2017 |
|
|
|
3,728,642 |
|
|
|
3,600,214 |
|
|
|
3,599,461 |
|
|
|
|
|
|
|
|
|
|
|
|
|
|
|
|
|
|
|
|
|
|
|
|
|
|
|
|
|
|
|
|
|
|
|
|
|
|
|
|
|
15,290,180 |
|
|
|
14,818,739 |
|
|
|
14,814,153 |
|
|
|
3.52 |
% |
|
|
|
|
|
|
|
|
|
|
|
|
|
|
|
|
|
|
|
|
|
|
|
|
|
| Triple Point Technology, Inc. |
|
|
|
|
|
|
|
|
|
|
|
|
|
|
|
|
|
|
|
|
|
|
|
|
| Software |
|
First lien(3) |
|
8.00% (Base Rate + 6.50%) |
|
|
10/27/2017 |
|
|
|
14,500,000 |
|
|
|
13,932,051 |
|
|
|
14,536,250 |
|
|
|
3.46 |
% |
| Virtual Radiologic Corporation |
|
|
|
|
|
|
|
|
|
|
|
|
|
|
|
|
|
|
|
|
|
|
|
|
| Healthcare Information Technology |
|
First lien(3) |
|
7.75% (Base Rate + 4.50%) |
|
|
12/22/2016 |
|
|
|
14,889,987 |
|
|
|
14,704,271 |
|
|
|
14,108,263 |
|
|
|
3.36 |
% |
| Brock Holdings III, Inc. |
|
|
|
|
|
|
|
|
|
|
|
|
|
|
|
|
|
|
|
|
|
|
|
|
| Industrial Services |
|
Second lien(2) |
|
10.00% (Base Rate + 8.25%) |
|
|
3/16/2018 |
|
|
|
15,000,000 |
|
|
|
14,746,132 |
|
|
|
13,818,750 |
|
|
|
3.29 |
% |
| LANDesk Group, Inc. |
|
|
|
|
|
|
|
|
|
|
|
|
|
|
|
|
|
|
|
|
|
|
|
|
| Software |
|
First lien(3) |
|
7.00% (Base Rate + 5.25%) |
|
|
3/28/2016 |
|
|
|
14,062,500 |
|
|
|
13,828,336 |
|
|
|
13,798,828 |
|
|
|
3.28 |
% |
| Pacific Architects and Engineers Incorporated |
|
|
|
|
|
|
|
|
|
|
|
|
|
|
|
|
|
|
|
|
|
|
|
|
| Federal Services |
|
First lien(3) |
|
7.50% (Base Rate + 6.00%) |
|
|
4/4/2017 |
|
|
|
14,100,000 |
|
|
|
13,848,322 |
|
|
|
13,677,000 |
|
|
|
3.25 |
% |
| Smile Brands Group Inc. |
|
|
|
|
|
|
|
|
|
|
|
|
|
|
|
|
|
|
|
|
|
|
|
|
| Healthcare Services |
|
First lien(3) |
|
7.00% (Base Rate + 5.25%) |
|
|
12/21/2017 |
|
|
|
12,337,594 |
|
|
|
12,173,547 |
|
|
|
12,329,883 |
|
|
|
2.93 |
% |
| Mailsouth, Inc. |
|
|
|
|
|
|
|
|
|
|
|
|
|
|
|
|
|
|
|
|
|
|
|
|
| Media |
|
First lien(3) |
|
6.75% (Base Rate + 4.99%) |
|
|
12/14/2016 |
|
|
|
11,910,000 |
|
|
|
11,756,172 |
|
|
|
11,731,350 |
|
|
|
2.79 |
% |
| Vision Solutions, Inc. |
|
|
|
|
|
|
|
|
|
|
|
|
|
|
|
|
|
|
|
|
|
|
|
|
| Software |
|
Second lien(2) |
|
9.50% (Base Rate + 8.00%) |
|
|
7/23/2017 |
|
|
|
12,000,000 |
|
|
|
11,893,985 |
|
|
|
11,640,000 |
|
|
|
2.77 |
% |
| TravelCLICK, Inc. (fka TravelCLICK Acquisition Co.) |
|
|
|
|
|
|
|
|
|
|
|
|
|
|
|
|
|
|
|
|
|
|
|
|
| Information Services |
|
First lien(3) |
|
6.50% (Base Rate + 5.00%) |
|
|
3/16/2016 |
|
|
|
11,401,313 |
|
|
|
11,208,577 |
|
|
|
11,344,306 |
|
|
|
2.70 |
% |
| Merrill Communications LLC |
|
|
|
|
|
|
|
|
|
|
|
|
|
|
|
|
|
|
|
|
|
|
|
|
| Business Services |
|
First lien(2) |
|
7.50% (Base Rate + 5.50%) |
|
|
12/24/2012 |
|
|
|
11,421,788 |
|
|
|
10,284,637 |
|
|
|
11,002,985 |
|
|
|
2.62 |
% |
| Brickman Group Holdings, Inc. |
|
|
|
|
|
|
|
|
|
|
|
|
|
|
|
|
|
|
|
|
|
|
|
|
| Business Services |
|
First lien(3) |
|
7.25% (Base Rate + 5.50%) |
|
|
10/14/2016 |
|
|
|
7,957,406 |
|
|
|
8,005,917 |
|
|
|
7,982,272 |
|
|
|
|
|
|
|
Subordinated(2) |
|
9.13% |
|
|
11/1/2018 |
|
|
|
3,000,000 |
|
|
|
2,716,216 |
|
|
|
2,715,000 |
|
|
|
|
|
|
|
|
|
|
|
|
|
|
|
|
|
|
|
|
|
|
|
|
|
|
|
|
|
|
|
|
|
|
|
|
|
|
|
|
|
10,957,406 |
|
|
|
10,722,133 |
|
|
|
10,697,272 |
|
|
|
2.54 |
% |
|
|
|
|
|
|
|
|
|
|
|
|
|
|
|
|
|
|
|
|
|
|
|
|
|
The accompanying
notes are an integral part of these consolidated financial statements.
F-70
New Mountain Finance Holdings, L.L.C.
Consolidated Schedule of Investments (continued)
December 31, 2011
|
|
|
|
|
|
|
|
|
|
|
|
|
|
|
|
|
|
|
|
|
|
|
|
|
| Portfolio Company, Location
and Industry |
|
Type of
Investment |
|
Interest Rate |
|
Maturity
Date |
|
|
Principal
Amount,
Par Value
or Shares |
|
|
Cost |
|
|
Fair
Value |
|
|
Percent
of
Members’
Capital |
|
| Immucor, Inc. |
|
|
|
|
|
|
|
|
|
|
|
|
|
|
|
|
|
|
|
|
|
|
|
|
| Healthcare Services |
|
First lien(3) |
|
7.25% (Base Rate + 5.75%) |
|
|
8/19/2018 |
|
|
$ |
4,987,500 |
|
|
$ |
4,795,791 |
|
|
$ |
5,022,826 |
|
|
|
|
|
|
|
Subordinated(2) |
|
11.13% |
|
|
8/15/2019 |
|
|
|
5,000,000 |
|
|
|
4,937,575 |
|
|
|
5,200,000 |
|
|
|
|
|
|
|
|
|
|
|
|
|
|
|
|
|
|
|
|
|
|
|
|
|
|
|
|
|
|
|
|
|
|
|
|
|
|
|
|
|
9,987,500 |
|
|
|
9,733,366 |
|
|
|
10,222,826 |
|
|
|
2.43 |
% |
|
|
|
|
|
|
|
|
|
|
|
|
|
|
|
|
|
|
|
|
|
|
|
|
|
| CHG Companies, Inc. |
|
|
|
|
|
|
|
|
|
|
|
|
|
|
|
|
|
|
|
|
|
|
|
|
| Healthcare Services |
|
Second lien(2) |
|
11.25% (Base Rate + 9.50%) |
|
|
4/7/2017 |
|
|
|
10,000,000 |
|
|
|
9,826,548 |
|
|
|
10,025,000 |
|
|
|
2.38 |
% |
| Vertafore, Inc. |
|
|
|
|
|
|
|
|
|
|
|
|
|
|
|
|
|
|
|
|
|
|
|
|
| Software |
|
Second lien(2) |
|
9.75% (Base Rate + 8.25%) |
|
|
10/29/2017 |
|
|
|
10,000,000 |
|
|
|
9,912,104 |
|
|
|
9,725,000 |
|
|
|
2.31 |
% |
| Merge Healthcare Inc. |
|
|
|
|
|
|
|
|
|
|
|
|
|
|
|
|
|
|
|
|
|
|
|
|
| Healthcare Services |
|
First lien(2) |
|
11.75% |
|
|
5/1/2015 |
|
|
|
9,000,000 |
|
|
|
8,879,303 |
|
|
|
9,585,000 |
|
|
|
2.28 |
% |
| Porex Corporation |
|
|
|
|
|
|
|
|
|
|
|
|
|
|
|
|
|
|
|
|
|
|
|
|
| Specialty Chemicals and Materials |
|
First lien(3) |
|
6.75% (Base Rate + 5.25%) |
|
|
3/31/2015 |
|
|
|
9,573,968 |
|
|
|
9,449,821 |
|
|
|
9,430,359 |
|
|
|
2.24 |
% |
| Sunquest Information Systems, Inc. (Misys Hospital Systems, Inc.) |
|
|
|
|
|
|
|
|
|
|
|
|
|
|
|
|
|
|
|
|
|
|
|
|
| Healthcare Services |
|
Second lien(2) |
|
9.75% (Base Rate + 8.50%) |
|
|
6/16/2017 |
|
|
|
9,000,000 |
|
|
|
8,840,688 |
|
|
|
8,910,000 |
|
|
|
2.12 |
% |
| Mach Gen, LLC |
|
|
|
|
|
|
|
|
|
|
|
|
|
|
|
|
|
|
|
|
|
|
|
|
| Power Generation |
|
Second lien(2) |
|
8.03% PIK (Base Rate + 7.50%)* |
|
|
2/22/2015 |
|
|
|
12,063,894 |
|
|
|
9,966,951 |
|
|
|
8,609,943 |
|
|
|
2.05 |
% |
| Research Pharmaceutical Services, Inc. |
|
|
|
|
|
|
|
|
|
|
|
|
|
|
|
|
|
|
|
|
|
|
|
|
| Healthcare Services |
|
First lien(3) |
|
6.75% (Base Rate + 5.24%) |
|
|
2/18/2017 |
|
|
|
7,453,125 |
|
|
|
7,354,306 |
|
|
|
7,192,266 |
|
|
|
1.71 |
% |
| Airvana Network Solutions Inc. |
|
|
|
|
|
|
|
|
|
|
|
|
|
|
|
|
|
|
|
|
|
|
|
|
| Software |
|
First lien(2) |
|
10.00% (Base Rate + 8.00%) |
|
|
3/25/2015 |
|
|
|
7,009,524 |
|
|
|
6,895,616 |
|
|
|
7,044,571 |
|
|
|
1.68 |
% |
| Surgery Center Holdings, Inc. |
|
|
|
|
|
|
|
|
|
|
|
|
|
|
|
|
|
|
|
|
|
|
|
|
| Healthcare Services |
|
First lien(3) |
|
6.50% (Base Rate + 5.00%) |
|
|
2/6/2017 |
|
|
|
6,947,500 |
|
|
|
6,916,695 |
|
|
|
6,478,544 |
|
|
|
1.54 |
% |
| Stratus Technologies, Inc. |
|
|
|
|
|
|
|
|
|
|
|
|
|
|
|
|
|
|
|
|
|
|
|
|
| Information Technology |
|
First lien(2) |
|
12.00% |
|
|
3/29/2015 |
|
|
|
6,827,000 |
|
|
|
6,490,139 |
|
|
|
6,212,570 |
|
|
|
1.48 |
% |
| Alion Science and Technology Corporation |
|
|
|
|
|
|
|
|
|
|
|
|
|
|
|
|
|
|
|
|
|
|
|
|
| Federal Services |
|
First lien(2) |
|
10.00% + 2.00% PIK* |
|
|
11/1/2014 |
|
|
|
6,195,238 |
|
|
|
5,613,308 |
|
|
|
5,555,066 |
|
|
|
1.32 |
% |
| Datatel, Inc. |
|
|
|
|
|
|
|
|
|
|
|
|
|
|
|
|
|
|
|
|
|
|
|
|
| Software |
|
Second lien(2) |
|
8.75% (Base Rate + 7.25%) |
|
|
2/19/2018 |
|
|
|
5,000,000 |
|
|
|
4,977,238 |
|
|
|
5,150,000 |
|
|
|
1.22 |
% |
| Ozburn-Hessey Holding Company LLC |
|
|
|
|
|
|
|
|
|
|
|
|
|
|
|
|
|
|
|
|
|
|
|
|
| Logistics |
|
Second lien(2) |
|
11.50% (Base Rate + 9.50%) |
|
|
10/8/2016 |
|
|
|
6,000,000 |
|
|
|
5,892,802 |
|
|
|
5,110,002 |
|
|
|
1.22 |
% |
| Asurion, LLC (fka Asurion Corporation) |
|
|
|
|
|
|
|
|
|
|
|
|
|
|
|
|
|
|
|
|
|
|
|
|
| Business Services |
|
Second lien(2) |
|
9.00% (Base Rate + 7.50%) |
|
|
5/24/2019 |
|
|
|
5,000,000 |
|
|
|
4,976,820 |
|
|
|
4,950,000 |
|
|
|
1.18 |
% |
| Pharmaceutical Product Development, Inc. (Jaguar Holdings, LLC) |
|
|
|
|
|
|
|
|
|
|
|
|
|
|
|
|
|
|
|
|
|
|
|
|
| Healthcare Services |
|
First lien(3) |
|
6.25% (Base Rate + 5.00%) |
|
|
12/5/2018 |
|
|
$ |
4,894,921 |
|
|
$ |
4,864,327 |
|
|
$ |
4,888,802 |
|
|
|
1.16 |
% |
| Fibertech Networks, LLC (fka Firefox Merger Sub, LLC) |
|
|
|
|
|
|
|
|
|
|
|
|
|
|
|
|
|
|
|
|
|
|
|
|
| Telecommunication |
|
First lien(3) |
|
6.75% (Base Rate + 5.00%) |
|
|
11/30/2016 |
|
|
|
4,897,632 |
|
|
|
4,835,069 |
|
|
|
4,873,144 |
|
|
|
1.16 |
% |
| LVI Services Inc. |
|
|
|
|
|
|
|
|
|
|
|
|
|
|
|
|
|
|
|
|
|
|
|
|
| Industrial Services |
|
First lien(2) |
|
9.25% (Base Rate + 7.50%) |
|
|
3/31/2014 |
|
|
|
5,120,334 |
|
|
|
4,474,056 |
|
|
|
3,725,043 |
|
|
|
0.89 |
% |
| ATI Acquisition Company (fka Ability Acquisition, Inc.) |
|
|
|
|
|
|
|
|
|
|
|
|
|
|
|
|
|
|
|
|
|
|
|
|
| Education |
|
First lien(2) |
|
12.25% (Base Rate + 5.00% + 4.00% PIK)(5)* |
|
|
12/30/2014 |
|
|
|
4,477,810 |
|
|
|
4,351,747 |
|
|
|
783,617 |
|
|
|
|
|
The accompanying
notes are an integral part of these consolidated financial statements.
F-71
New Mountain Finance Holdings, L.L.C.
Consolidated Schedule of Investments (continued)
December 31, 2011
|
|
|
|
|
|
|
|
|
|
|
|
|
|
|
|
|
|
|
|
|
|
|
|
|
| Portfolio Company, Location
and Industry |
|
Type of
Investment |
|
Interest Rate |
|
Maturity
Date |
|
|
Principal
Amount, Par
Value or
Shares |
|
|
Cost |
|
|
Fair
Value |
|
|
Percent
of
Members’
Capital |
|
|
|
First lien(2) |
|
17.25% (Base Rate + 10.00% + 4.00% PIK)* |
|
|
6/30/2012 |
|
|
|
91,696 |
|
|
|
91,696 |
|
|
|
91,696 |
|
|
|
|
|
|
|
First lien(2) |
|
17.25% (Base Rate +
10.00% + 4.00% PIK)* |
|
|
6/30/2012 |
|
|
|
1,484,370 |
|
|
|
1,484,370 |
|
|
|
1,484,370 |
|
|
|
|
|
|
|
|
|
|
|
|
|
|
|
|
|
|
|
|
|
|
|
|
|
|
|
|
|
|
|
|
|
|
|
|
|
|
|
|
|
6,053,876 |
|
|
|
5,927,813 |
|
|
|
2,359,683 |
|
|
|
0.56 |
% |
|
|
|
|
|
|
|
|
|
|
|
|
|
|
|
|
|
|
|
|
|
|
|
|
|
| Total Funded Debt Investments |
|
|
|
|
|
|
|
|
|
$ |
727,364,649 |
|
|
$ |
702,801,889 |
|
|
$ |
702,587,965 |
|
|
|
167.08 |
% |
|
|
|
|
|
|
|
|
|
|
|
|
|
|
|
|
|
|
|
|
|
|
|
|
|
| Equity—United States |
|
|
|
|
|
|
|
|
|
|
|
|
|
|
|
|
|
|
|
|
|
|
|
|
| Stratus Technologies, Inc. |
|
|
|
|
|
|
|
|
|
|
|
|
|
|
|
|
|
|
|
|
|
|
|
|
| Information Technology |
|
Ordinary shares(2) |
|
— |
|
|
— |
|
|
|
144,270 |
|
|
$ |
65,123 |
|
|
$ |
29,881 |
|
|
|
|
|
|
|
Preferred shares(2) |
|
— |
|
|
— |
|
|
|
32,830 |
|
|
|
14,819 |
|
|
|
6,800 |
|
|
|
|
|
|
|
|
|
|
|
|
|
|
|
|
|
|
|
|
|
|
|
|
|
|
|
|
|
|
|
|
|
|
|
|
|
|
|
|
|
|
|
|
|
79,942 |
|
|
|
36,681 |
|
|
|
0.01 |
% |
|
|
|
|
|
|
|
|
|
|
|
|
|
|
|
|
|
|
|
|
|
|
|
|
|
| Global Knowledge Training LLC |
|
|
|
|
|
|
|
|
|
|
|
|
|
|
|
|
|
|
|
|
|
|
|
|
| Education |
|
Ordinary shares(2) |
|
— |
|
|
— |
|
|
|
2 |
|
|
|
2,109 |
|
|
|
2,109 |
|
|
|
|
|
|
|
Preferred shares(2) |
|
— |
|
|
— |
|
|
|
2,423 |
|
|
|
2,422,891 |
|
|
|
2,422,891 |
|
|
|
|
|
|
|
|
|
|
|
|
|
|
|
|
|
|
|
|
|
|
|
|
|
|
|
|
|
|
|
|
|
|
|
|
|
|
|
|
|
|
|
|
|
2,425,000 |
|
|
|
2,425,000 |
|
|
|
0.58 |
% |
|
|
|
|
|
|
|
|
|
|
|
|
|
|
|
|
|
|
|
|
|
|
|
|
|
| Total Shares |
|
|
|
|
|
|
|
|
|
|
|
|
|
$ |
2,504,942 |
|
|
$ |
2,461,681 |
|
|
|
0.59 |
% |
|
|
|
|
|
|
|
|
|
|
|
|
|
|
|
|
|
|
|
|
|
|
|
|
|
| Warrants—United States |
|
|
|
|
|
|
|
|
|
|
|
|
|
|
|
|
|
|
|
|
|
|
|
|
| Alion Science and Technology Corporation |
|
|
|
|
|
|
|
|
|
|
|
|
|
|
|
|
|
|
|
|
|
|
|
|
| Federal Services |
|
Warrants(2) |
|
— |
|
|
— |
|
|
|
6,000 |
|
|
$ |
292,851 |
|
|
$ |
244,237 |
|
|
|
0.06 |
% |
| PODS, Inc.(6) |
|
|
|
|
|
|
|
|
|
|
|
|
|
|
|
|
|
|
|
|
|
|
|
|
| Storapod Holding Company, Inc. |
|
|
|
|
|
|
|
|
|
|
|
|
|
|
|
|
|
|
|
|
|
|
|
|
| Consumer Services |
|
Warrants(2) |
|
— |
|
|
— |
|
|
|
298,398 |
|
|
|
129,181 |
|
|
|
129,181 |
|
|
|
0.03 |
% |
| Learning Care Group (US), Inc. |
|
|
|
|
|
|
|
|
|
|
|
|
|
|
|
|
|
|
|
|
|
|
|
|
| Education |
|
Warrants(2) |
|
— |
|
|
— |
|
|
|
844 |
|
|
|
193,850 |
|
|
|
14,372 |
|
|
|
0.00 |
% |
|
|
|
|
|
|
|
|
|
|
|
|
|
|
|
|
|
|
|
|
|
|
|
|
|
| Total Warrants |
|
|
|
|
|
|
|
|
|
|
|
|
|
$ |
615,882 |
|
|
$ |
387,790 |
|
|
|
0.09 |
% |
|
|
|
|
|
|
|
|
|
|
|
|
|
|
|
|
|
|
|
|
|
|
|
|
|
| Total Funded Investments |
|
|
|
|
|
|
|
|
|
|
|
|
|
$ |
705,922,713 |
|
|
$ |
705,437,436 |
|
|
|
167.76 |
% |
|
|
|
|
|
|
|
|
|
|
|
|
|
|
|
|
|
|
|
|
|
|
|
|
|
| Unfunded Debt Investments—United States |
|
|
|
|
|
|
|
|
|
|
|
|
|
|
|
|
|
|
|
|
|
|
|
|
| Datatel, Inc. |
|
|
|
|
|
|
|
|
|
|
|
|
|
|
|
|
|
|
|
|
|
|
|
|
| Software |
|
Subordinated
—Bridge(1)(2) |
|
— |
|
|
12/13/2012 |
|
|
$ |
20,000,000 |
|
|
$ |
— |
|
|
$ |
— |
|
|
|
0.00 |
% |
| Physio-Control International, Inc. |
|
|
|
|
|
|
|
|
|
|
|
|
|
|
|
|
|
|
|
|
|
|
|
|
| Healthcare Products |
|
First lien—
Bridge(1)(2) |
|
— |
|
|
— |
|
|
|
15,000,000 |
|
|
|
— |
|
|
|
— |
|
|
|
0.00 |
% |
| ATI Acquisition Company (fka Ability Acquisition, Inc.) |
|
|
|
|
|
|
|
|
|
|
|
|
|
|
|
|
|
|
|
|
|
|
|
|
| Education |
|
First lien(1)(2)—
Undrawn |
|
— |
|
|
1/1/2012 |
|
|
|
39,947 |
|
|
|
— |
|
|
|
— |
|
|
|
|
|
|
|
First lien(1)(2)—
Undrawn |
|
— |
|
|
1/1/2012 |
|
|
|
865 |
|
|
|
— |
|
|
|
— |
|
|
|
|
|
|
|
|
|
|
|
|
|
|
|
|
|
|
|
|
|
|
|
|
|
|
|
|
|
|
|
|
|
|
|
|
|
|
|
|
|
40,812 |
|
|
|
— |
|
|
|
— |
|
|
|
0.00 |
% |
|
|
|
|
|
|
|
|
|
|
|
|
|
|
|
|
|
|
|
|
|
|
|
|
|
The accompanying
notes are an integral part of these consolidated financial statements.
F-72
New Mountain Finance Holdings, L.L.C.
Consolidated Schedule of Investments (continued)
December 31, 2011
|
|
|
|
|
|
|
|
|
|
|
|
|
|
|
|
|
|
|
|
|
|
|
|
|
| Portfolio Company, Location
and Industry |
|
Type of Investment |
|
Interest
Rate |
|
Maturity
Date |
|
|
Principal
Amount,
Par Value
or Shares |
|
|
Cost |
|
|
Fair
Value |
|
|
Percent
of
Members’
Capital |
|
| PODS, Inc.(6) |
|
|
|
|
|
|
|
|
|
|
|
|
|
|
|
|
|
|
|
|
|
|
|
|
| Consumer Services |
|
First lien(1)(2)—Undrawn |
|
— |
|
|
11/29/2016 |
|
|
|
3,438,462 |
|
|
|
(103,154 |
) |
|
|
(103,154 |
) |
|
|
|
|
| PODS Funding Corp. II |
|
|
|
|
|
|
|
|
|
|
|
|
|
|
|
|
|
|
|
|
|
|
|
|
| Storapod Holding Company, Inc. |
|
Subordinated(1)(2)—Undrawn |
|
— |
|
|
11/29/2017 |
|
|
|
771,358 |
|
|
|
— |
|
|
|
— |
|
|
|
|
|
|
|
|
|
|
|
|
|
|
|
|
|
|
|
|
|
|
|
|
|
|
|
|
|
|
|
|
|
|
|
|
|
|
|
|
|
4,209,820 |
|
|
|
(103,154 |
) |
|
|
(103,154 |
) |
|
|
(0.03 |
)% |
|
|
|
|
|
|
|
|
|
|
|
|
|
|
|
|
|
|
|
|
|
|
|
|
|
| RGIS Services, LLC |
|
|
|
|
|
|
|
|
|
|
|
|
|
|
|
|
|
|
|
|
|
|
|
|
| Business Services |
|
First lien(2)(4)—Undrawn |
|
— |
|
|
4/30/2013 |
|
|
|
5,000,000 |
|
|
|
(2,850,000 |
) |
|
|
(293,850 |
) |
|
|
(0.07 |
)% |
| Education Management LLC |
|
|
|
|
|
|
|
|
|
|
|
|
|
|
|
|
|
|
|
|
|
|
|
|
| Education |
|
First lien(2)(4)—Undrawn |
|
— |
|
|
6/1/2012 |
|
|
|
3,000,000 |
|
|
|
(1,215,000 |
) |
|
|
(330,000 |
) |
|
|
(0.08 |
)% |
| Kronos Incorporated |
|
|
|
|
|
|
|
|
|
|
|
|
|
|
|
|
|
|
|
|
|
|
|
|
| Software |
|
First lien(2)(4)—Undrawn |
|
— |
|
|
6/11/2013 |
|
|
$ |
4,198,500 |
|
|
$ |
(629,775 |
) |
|
$ |
(356,872 |
) |
|
|
(0.08 |
)% |
| Advantage Sales & Marketing Inc. |
|
|
|
|
|
|
|
|
|
|
|
|
|
|
|
|
|
|
|
|
|
|
|
|
| Business Services |
|
First lien(2)(4)—Undrawn |
|
— |
|
|
12/17/2015 |
|
|
|
10,500,000 |
|
|
|
(1,260,000 |
) |
|
|
(840,000 |
) |
|
|
(0.20 |
)% |
|
|
|
|
|
|
|
|
|
|
|
|
|
|
|
|
|
|
|
|
|
|
|
|
|
| Total Unfunded Debt Investments |
|
|
|
|
|
|
|
|
|
$ |
61,949,132 |
|
|
$ |
(6,057,929 |
) |
|
$ |
(1,923,876 |
) |
|
|
(0.46 |
)% |
|
|
|
|
|
|
|
|
|
|
|
|
|
|
|
|
|
|
|
|
|
|
|
|
|
| Total Investments |
|
|
|
|
|
|
|
|
|
|
|
|
|
$ |
699,864,784 |
|
|
$ |
703,513,560 |
|
|
|
167.30 |
% |
|
|
|
|
|
|
|
|
|
|
|
|
|
|
|
|
|
|
|
|
|
|
|
|
|
| (1) |
Par Value amounts represent the drawn or undrawn (as indicated in type of investment) portion of the bridge facility, delayed draw or other future funding commitments.
|
| (2) |
The Holdings Credit Facility is collateralized by the indicated investments. |
| (3) |
The SLF Credit Facility is collateralized by the indicated investments. |
| (4) |
Par Value amounts represent the drawn or undrawn (as indicated in type of investment) portion of revolving credit facilities. Cost amounts represent the cash received at
settlement date net the impact of paydowns and cash paid for drawn revolvers. |
| (5) |
Investment is on non-accrual status. |
| (6) |
New Mountain Finance Holdings, L.L.C. (“NMF Holdings”) holds investments in two related entities of PODS, Inc. NMF Holdings directly holds warrants in Storapod
Holding Company, Inc. (“Storapod”) and has a credit investment in Storapod through Storapod WCF II Limited (“Storapod WCF II”). Storapod WCF II is a special purpose entity used to enter into a Shari’ah- compliant
financing arrangement with Storapod. Additionally, NMF Holdings has a credit investment in PODS Funding Corp. II (“PODS II”). PODS, Inc. is a wholly-owned subsidiary of PODS Holding, Inc., which in turn is a majority- owned
subsidiary of Storapod. PODS II is a special purpose entity used to enter into a Shari’ah-compliant financing arrangement with PODS, Inc. and its subsidiary, PODS Enterprises, Inc. |
The accompanying notes are an integral part of these consolidated financial statements.
F-73
New Mountain Finance Holdings, L.L.C.
Consolidated Schedule of Investments (continued)
December 31, 2011
|
|
|
|
|
| |
|
December 31, 2011 |
|
| Investment Type |
|
Percent of
Total
Investments at
Fair Value |
|
| First lien |
|
|
58.32 |
% |
| Second lien |
|
|
37.34 |
% |
| Subordinated |
|
|
3.93 |
% |
| Equity and other |
|
|
0.41 |
% |
|
|
|
|
|
| Total investments |
|
|
100.00 |
% |
|
|
|
|
|
|
|
| |
|
December 31, 2011 |
|
| Industry Type |
|
Percent of
Total
Investments at
Fair Value |
|
| Software |
|
|
22.12 |
% |
| Healthcare Services |
|
|
16.71 |
% |
| Education |
|
|
14.47 |
% |
| Business Services |
|
|
10.86 |
% |
| Federal Services |
|
|
10.05 |
% |
| Consumer Services |
|
|
4.23 |
% |
| Information Services |
|
|
4.21 |
% |
| Healthcare Products |
|
|
3.54 |
% |
| Logistics |
|
|
3.50 |
% |
| Industrial Services |
|
|
2.49 |
% |
| Healthcare Information Technology |
|
|
2.01 |
% |
| Media |
|
|
1.67 |
% |
| Specialty Chemicals and Materials |
|
|
1.34 |
% |
| Power Generation |
|
|
1.22 |
% |
| Information Technology |
|
|
0.89 |
% |
| Telecommunication |
|
|
0.69 |
% |
|
|
|
|
|
| Total investments |
|
|
100.00 |
% |
|
|
|
|
|
The accompanying notes are an integral part of these consolidated financial statements.
F-74
New Mountain Finance Holdings, L.L.C.
Consolidated Schedule of Investments
December 31, 2010
|
|
|
|
|
|
|
|
|
|
|
|
|
|
|
|
|
|
|
|
|
|
|
|
|
| Portfolio Company, Location
and Industry |
|
Type of
Investment |
|
Interest Rate |
|
Maturity
Date |
|
|
Principal
Amount,
Par Value
or Shares |
|
|
Cost |
|
|
Fair
Value |
|
|
Percent
of
Members’
Capital |
|
| Funded Debt Investments—Canada |
|
|
|
|
|
|
|
|
|
|
|
|
|
|
|
|
|
|
|
|
|
|
|
|
| Trident Exploration Corp.(2) |
|
|
|
|
|
|
|
|
|
|
|
|
|
|
|
|
|
|
|
|
|
|
|
|
| Energy |
|
First lien(3) |
|
12.50% (Base Rate + 9.50%) |
|
|
6/30/2014 |
|
|
$ |
4,477,500 |
|
|
$ |
4,357,151 |
|
|
$ |
4,746,150 |
|
|
|
1.96 |
% |
|
|
|
|
|
|
|
|
|
|
|
|
|
|
|
|
|
|
|
|
|
|
|
|
|
| Total Canada |
|
|
|
|
|
|
|
|
|
$ |
4,477,500 |
|
|
$ |
4,357,151 |
|
|
$ |
4,746,150 |
|
|
|
1.96 |
% |
|
|
|
|
|
|
|
|
|
|
|
|
|
|
|
|
|
|
|
|
|
|
|
|
|
| Funded Debt Investments—United States |
|
|
|
|
|
|
|
|
|
|
|
|
|
|
|
|
|
|
|
|
|
|
|
|
| Managed Health Care Associates, Inc. |
|
|
|
|
|
|
|
|
|
|
|
|
|
|
|
|
|
|
|
|
|
|
|
|
| Healthcare Services |
|
First lien(3) |
|
3.52% (Base Rate + 3.25%) |
|
|
8/1/2014 |
|
|
$ |
22,467,673 |
|
|
$ |
17,462,237 |
|
|
$ |
20,557,920 |
|
|
|
|
|
|
|
Second lien(3) |
|
6.77% (Base Rate + 6.50%) |
|
|
2/1/2015 |
|
|
|
15,000,000 |
|
|
|
11,227,497 |
|
|
|
13,200,001 |
|
|
|
|
|
|
|
|
|
|
|
|
|
|
|
|
|
|
|
|
|
|
|
|
|
|
|
|
|
|
|
|
|
|
|
|
|
|
|
|
|
37,467,673 |
|
|
|
28,689,734 |
|
|
|
33,757,921 |
|
|
|
13.95 |
% |
|
|
|
|
|
|
|
|
|
|
|
|
|
|
|
|
|
|
|
|
|
|
|
|
|
| Attachmate Corporation, NetIQ Corporation |
|
|
|
|
|
|
|
|
|
|
|
|
|
|
|
|
|
|
|
|
|
|
|
|
| Software |
|
Second lien(3) |
|
7.04% (Base Rate + 6.75%) |
|
|
10/13/2013 |
|
|
|
22,500,000 |
|
|
|
17,121,571 |
|
|
|
22,275,000 |
|
|
|
9.21 |
% |
| Learning Care Group (US), Inc. |
|
|
|
|
|
|
|
|
|
|
|
|
|
|
|
|
|
|
|
|
|
|
|
|
| Education |
|
First lien(3) |
|
12.00% |
|
|
4/27/2016 |
|
|
|
17,368,422 |
|
|
|
17,057,656 |
|
|
|
17,192,834 |
|
|
|
|
|
|
|
Subordinated |
|
15.00% |
|
|
6/30/2016 |
|
|
|
2,832,237 |
|
|
|
2,610,113 |
|
|
|
2,630,413 |
|
|
|
|
|
|
|
|
|
|
|
|
|
|
|
|
|
|
|
|
|
|
|
|
|
|
|
|
|
|
|
|
|
|
|
|
|
|
|
|
|
20,200,659 |
|
|
|
19,667,769 |
|
|
|
19,823,247 |
|
|
|
8.19 |
% |
|
|
|
|
|
|
|
|
|
|
|
|
|
|
|
|
|
|
|
|
|
|
|
|
|
| Decision Resources, LLC |
|
|
|
|
|
|
|
|
|
|
|
|
|
|
|
|
|
|
|
|
|
|
|
|
| Business Services |
|
First lien(4) |
|
7.75% (Base Rate + 4.50%) |
|
|
12/28/2016 |
|
|
|
18,000,000 |
|
|
|
17,730,000 |
|
|
|
17,820,001 |
|
|
|
7.37 |
% |
| KeyPoint Government Solutions, Inc |
|
|
|
|
|
|
|
|
|
|
|
|
|
|
|
|
|
|
|
|
|
|
|
|
| Federal Services |
|
First lien(3) |
|
10.00% (Base Rate + 8.00%) |
|
|
12/31/2015 |
|
|
|
18,000,000 |
|
|
|
17,640,000 |
|
|
|
17,730,000 |
|
|
|
7.33 |
% |
| Smile Brands Group, Inc. |
|
|
|
|
|
|
|
|
|
|
|
|
|
|
|
|
|
|
|
|
|
|
|
|
| Healthcare Services |
|
First lien(4) |
|
7.50% (Base Rate + 4.25%) |
|
|
12/21/2017 |
|
|
|
17,500,000 |
|
|
|
17,237,500 |
|
|
|
17,390,625 |
|
|
|
7.19 |
% |
| Volume Services America, Inc. (Centerplate) |
|
|
|
|
|
|
|
|
|
|
|
|
|
|
|
|
|
|
|
|
|
|
|
|
| Consumer Services |
|
First lien(3) |
|
10.50% (Base Rate + 8.50%) |
|
|
9/16/2016 |
|
|
|
14,962,500 |
|
|
|
14,527,858 |
|
|
|
15,056,016 |
|
|
|
6.22 |
% |
| MLM Holdings, Inc. |
|
|
|
|
|
|
|
|
|
|
|
|
|
|
|
|
|
|
|
|
|
|
|
|
| Software |
|
First lien(4) |
|
7.00% (Base Rate + 5.25%) |
|
|
12/1/2016 |
|
|
|
14,962,500 |
|
|
|
14,739,863 |
|
|
|
14,775,469 |
|
|
|
6.11 |
% |
| LANDesk Software, Inc. |
|
|
|
|
|
|
|
|
|
|
|
|
|
|
|
|
|
|
|
|
|
|
|
|
| Software |
|
First lien(4) |
|
7.00% (Base Rate + 5.25%) |
|
|
3/28/2016 |
|
|
|
15,000,000 |
|
|
|
14,701,917 |
|
|
|
14,718,750 |
|
|
|
6.08 |
% |
| SonicWALL, Inc. |
|
|
|
|
|
|
|
|
|
|
|
|
|
|
|
|
|
|
|
|
|
|
|
|
| Software |
|
First lien(4) |
|
8.26% (Base Rate + 6.19%) |
|
|
1/23/2016 |
|
|
|
4,485,887 |
|
|
|
4,507,797 |
|
|
|
4,519,531 |
|
|
|
|
|
|
|
Second lien(3) |
|
12.00% (Base Rate + 10.00%) |
|
|
1/23/2017 |
|
|
|
10,000,000 |
|
|
|
9,712,391 |
|
|
|
10,050,000 |
|
|
|
|
|
|
|
|
|
|
|
|
|
|
|
|
|
|
|
|
|
|
|
|
|
|
|
|
|
|
|
|
|
|
|
|
|
|
|
|
|
14,485,887 |
|
|
|
14,220,188 |
|
|
|
14,569,531 |
|
|
|
6.02 |
% |
|
|
|
|
|
|
|
|
|
|
|
|
|
|
|
|
|
|
|
|
|
|
|
|
|
| Virtual Radiologic Corporation |
|
|
|
|
|
|
|
|
|
|
|
|
|
|
|
|
|
|
|
|
|
|
|
|
| Healthcare Information Technology |
|
First lien(4) |
|
7.75% (Base Rate + 4.50%) |
|
|
12/22/2016 |
|
|
$ |
14,000,000 |
|
|
$ |
13,790,000 |
|
|
$ |
13,965,000 |
|
|
|
5.77 |
% |
| Asurion, LLC |
|
|
|
|
|
|
|
|
|
|
|
|
|
|
|
|
|
|
|
|
|
|
|
|
| Business Services |
|
First lien(4) |
|
6.75% (Base Rate + 5.25%) |
|
|
3/31/2015 |
|
|
|
13,000,000 |
|
|
|
12,494,497 |
|
|
|
13,052,234 |
|
|
|
5.40 |
% |
| Aspen Dental Management, Inc. |
|
|
|
|
|
|
|
|
|
|
|
|
|
|
|
|
|
|
|
|
|
|
|
|
| Healthcare Services |
|
First lien(4) |
|
7.72% (Base Rate + 6.00%) |
|
|
10/6/2016 |
|
|
|
12,967,500 |
|
|
|
12,713,475 |
|
|
|
13,016,128 |
|
|
|
5.38 |
% |
The accompanying
notes are an integral part of these consolidated financial statements.
F-75
New Mountain Finance Holdings, L.L.C.
Consolidated Schedule of Investments (continued)
December 31, 2010
|
|
|
|
|
|
|
|
|
|
|
|
|
|
|
|
|
|
|
|
|
|
|
|
|
| Portfolio Company, Location
and Industry |
|
Type of
Investment |
|
Interest Rate |
|
Maturity
Date |
|
|
Principal
Amount,
Par Value
or Shares |
|
|
Cost |
|
|
Fair
Value |
|
|
Percent
of
Members’
Capital |
|
| Firefox Merger Sub, LLC
(f/k/a Fibertech Networks, LLC) |
|
|
|
|
|
|
|
|
|
|
|
|
|
|
|
|
|
|
|
|
|
|
|
|
| Telecommunication |
|
First lien(4) |
|
6.75% (Base Rate + 5.00%) |
|
|
11/30/2016 |
|
|
|
12,000,000 |
|
|
|
11,821,633 |
|
|
|
12,240,000 |
|
|
|
5.06 |
% |
| Airvana Network Solutions Inc. |
|
|
|
|
|
|
|
|
|
|
|
|
|
|
|
|
|
|
|
|
|
|
|
|
| Software |
|
First lien(3) |
|
11.00% (Base Rate + 9.00%) |
|
|
8/27/2014 |
|
|
|
11,833,333 |
|
|
|
11,611,357 |
|
|
|
11,890,039 |
|
|
|
4.92 |
% |
| Mailsouth, Inc. |
|
|
|
|
|
|
|
|
|
|
|
|
|
|
|
|
|
|
|
|
|
|
|
|
| Media |
|
First lien(4) |
|
7.00% (Base Rate + 3.75%) |
|
|
12/14/2016 |
|
|
|
12,000,000 |
|
|
|
11,820,000 |
|
|
|
11,880,000 |
|
|
|
4.91 |
% |
| Merge Healthcare Inc. |
|
|
|
|
|
|
|
|
|
|
|
|
|
|
|
|
|
|
|
|
|
|
|
|
| Healthcare Services |
|
First lien(3) |
|
11.75% |
|
|
5/1/2015 |
|
|
|
11,000,000 |
|
|
|
10,808,642 |
|
|
|
11,770,000 |
|
|
|
4.87 |
% |
| Merrill Communications LLC |
|
|
|
|
|
|
|
|
|
|
|
|
|
|
|
|
|
|
|
|
|
|
|
|
| Business Services |
|
First lien(3) |
|
8.50% (Base Rate + 6.50%) |
|
|
12/22/2012 |
|
|
|
11,421,788 |
|
|
|
9,332,773 |
|
|
|
11,393,234 |
|
|
|
4.71 |
% |
| PODS Holding Funding Corp. |
|
|
|
|
|
|
|
|
|
|
|
|
|
|
|
|
|
|
|
|
|
|
|
|
| Consumer Services |
|
Subordinated |
|
16.64% |
|
|
12/23/2015 |
|
|
|
11,664,000 |
|
|
|
10,137,299 |
|
|
|
10,117,351 |
|
|
|
4.18 |
% |
| Vertafore, Inc |
|
|
|
|
|
|
|
|
|
|
|
|
|
|
|
|
|
|
|
|
|
|
|
|
| Software |
|
Second lien(3) |
|
9.75% (Base Rate + 8.25%) |
|
|
10/29/2017 |
|
|
|
10,000,000 |
|
|
|
9,901,457 |
|
|
|
10,106,250 |
|
|
|
4.18 |
% |
| CHG Companies, Inc. |
|
|
|
|
|
|
|
|
|
|
|
|
|
|
|
|
|
|
|
|
|
|
|
|
| Healthcare Services |
|
Second lien(3) |
|
11.25% (Base Rate + 9.50%) |
|
|
4/7/2017 |
|
|
|
10,000,000 |
|
|
|
9,804,011 |
|
|
|
9,900,000 |
|
|
|
4.09 |
% |
| First Data Corporation |
|
|
|
|
|
|
|
|
|
|
|
|
|
|
|
|
|
|
|
|
|
|
|
|
| Business Services |
|
First lien(3) |
|
3.01% (Base Rate + 2.75%) |
|
|
9/24/2014 |
|
|
|
10,646,143 |
|
|
|
7,932,011 |
|
|
|
9,842,273 |
|
|
|
4.07 |
% |
| Focus Brands, Inc. |
|
|
|
|
|
|
|
|
|
|
|
|
|
|
|
|
|
|
|
|
|
|
|
|
| Franchises |
|
First lien(4) |
|
7.25% (Base Rate + 5.50%) |
|
|
11/5/2016 |
|
|
|
9,181,818 |
|
|
|
9,091,224 |
|
|
|
9,285,114 |
|
|
|
3.84 |
% |
| Sunquest Information Systems, Inc. |
|
|
|
|
|
|
|
|
|
|
|
|
|
|
|
|
|
|
|
|
|
|
|
|
| Healthcare Services |
|
Second lien |
|
9.75% (Base Rate + 8.50%) |
|
|
6/16/2017 |
|
|
|
9,000,000 |
|
|
|
8,820,000 |
|
|
|
9,000,000 |
|
|
|
3.72 |
% |
| Mach Gen, LLC |
|
|
|
|
|
|
|
|
|
|
|
|
|
|
|
|
|
|
|
|
|
|
|
|
| Power Generation |
|
Second lien |
|
7.79% (Base Rate + 7.50%) |
|
|
2/22/2015 |
|
|
|
11,145,736 |
|
|
|
8,580,242 |
|
|
|
7,803,431 |
|
|
|
3.23 |
% |
| SSI Investments II Limited |
|
|
|
|
|
|
|
|
|
|
|
|
|
|
|
|
|
|
|
|
|
|
|
|
| Education |
|
Subordinated(3) |
|
11.13% |
|
|
6/1/2018 |
|
|
|
7,000,000 |
|
|
|
7,064,923 |
|
|
|
7,630,000 |
|
|
|
3.15 |
% |
| Hyland Software, Inc. |
|
|
|
|
|
|
|
|
|
|
|
|
|
|
|
|
|
|
|
|
|
|
|
|
| Software |
|
First lien(4) |
|
6.75% (Base Rate + 5.00%) |
|
|
12/19/2016 |
|
|
$ |
7,500,000 |
|
|
$ |
7,425,000 |
|
|
$ |
7,528,125 |
|
|
|
3.11 |
% |
| Wyle Services Corporation |
|
|
|
|
|
|
|
|
|
|
|
|
|
|
|
|
|
|
|
|
|
|
|
|
| Federal Services |
|
First lien(4) |
|
7.75% (Base Rate + 5.75%) |
|
|
3/25/2016 |
|
|
|
7,481,234 |
|
|
|
7,508,583 |
|
|
|
7,509,290 |
|
|
|
3.10 |
% |
| RGIS Services, LLC |
|
|
|
|
|
|
|
|
|
|
|
|
|
|
|
|
|
|
|
|
|
|
|
|
| Business Services |
|
First lien(3) |
|
2.80% (Base Rate + 2.50%) |
|
|
4/30/2014 |
|
|
|
7,394,480 |
|
|
|
5,807,941 |
|
|
|
6,913,839 |
|
|
|
2.86 |
% |
| Kronos Incorporated |
|
|
|
|
|
|
|
|
|
|
|
|
|
|
|
|
|
|
|
|
|
|
|
|
| Software |
|
Second lien(3) |
|
6.05% (Base Rate + 5.75%) |
|
|
6/11/2015 |
|
|
|
6,700,000 |
|
|
|
5,041,455 |
|
|
|
6,563,206 |
|
|
|
2.71 |
% |
| Alion Science and Technology Corporation |
|
|
|
|
|
|
|
|
|
|
|
|
|
|
|
|
|
|
|
|
|
|
|
|
| Federal Services |
|
First lien(3) |
|
12.00% |
|
|
11/1/2014 |
|
|
|
6,073,149 |
|
|
|
5,392,607 |
|
|
|
6,273,057 |
|
|
|
2.59 |
% |
| Bartlett Holdings, Inc. |
|
|
|
|
|
|
|
|
|
|
|
|
|
|
|
|
|
|
|
|
|
|
|
|
| Industrial Services |
|
First lien(4) |
|
6.75% (Base Rate + 5.00%) |
|
|
11/23/2016 |
|
|
|
6,000,000 |
|
|
|
5,940,644 |
|
|
|
6,037,500 |
|
|
|
2.50 |
% |
| Ozburn-Hessey Holding Company LLC |
|
|
|
|
|
|
|
|
|
|
|
|
|
|
|
|
|
|
|
|
|
|
|
|
| Logistics |
|
Second lien |
|
10.50% (Base Rate + 8.50%) |
|
|
10/8/2016 |
|
|
|
6,000,000 |
|
|
|
5,874,951 |
|
|
|
5,985,000 |
|
|
|
2.47 |
% |
| Vision Solutions, Inc. |
|
|
|
|
|
|
|
|
|
|
|
|
|
|
|
|
|
|
|
|
|
|
|
|
| Software |
|
First lien(4) |
|
7.75% (Base Rate + 6.00%) |
|
|
7/23/2016 |
|
|
|
5,775,000 |
|
|
|
5,662,174 |
|
|
|
5,753,344 |
|
|
|
2.38 |
% |
The accompanying
notes are an integral part of these consolidated financial statements.
F-76
New Mountain Finance Holdings, L.L.C.
Consolidated Schedule of Investments (continued)
December 31, 2010
|
|
|
|
|
|
|
|
|
|
|
|
|
|
|
|
|
|
|
|
|
|
|
|
|
| Portfolio Company, Location
and Industry |
|
Type of
Investment |
|
Interest Rate |
|
Maturity
Date |
|
|
Principal
Amount, Par
Value or
Shares |
|
|
Cost |
|
|
Fair
Value |
|
|
Percent
of
Members’
Capital |
|
| LVI Services Inc |
|
|
|
|
|
|
|
|
|
|
|
|
|
|
|
|
|
|
|
|
|
|
|
|
| Industrial Services |
|
First lien(3) |
|
9.25% (Base Rate + 7.50%) |
|
|
3/31/2014 |
|
|
|
5,162,883 |
|
|
|
4,304,472 |
|
|
|
4,388,450 |
|
|
|
1.81 |
% |
| Stratus Technologies, Inc. |
|
|
|
|
|
|
|
|
|
|
|
|
|
|
|
|
|
|
|
|
|
|
|
|
| Information Technology |
|
First lien |
|
12.00% |
|
|
3/29/2015 |
|
|
|
5,000,000 |
|
|
|
4,796,989 |
|
|
|
4,225,000 |
|
|
|
1.75 |
% |
| ATI Acquisition Company |
|
|
|
|
|
|
|
|
|
|
|
|
|
|
|
|
|
|
|
|
|
|
|
|
| Education |
|
First lien(3) |
|
8.25% (Base Rate + 5.99%) |
|
|
12/30/2014 |
|
|
|
4,455,000 |
|
|
|
4,304,106 |
|
|
|
4,076,325 |
|
|
|
1.68 |
% |
| Physiotherapy Associates, Inc. / Benchmark Medical, Inc. |
|
|
|
|
|
|
|
|
|
|
|
|
|
|
|
|
|
|
|
|
|
|
|
|
| Healthcare Facilities |
|
First lien(3) |
|
7.50% (Base Rate + 4.25%) |
|
|
6/28/2013 |
|
|
|
3,823,549 |
|
|
|
3,063,441 |
|
|
|
3,594,136 |
|
|
|
1.49 |
% |
| Brickman Group Holdings, Inc. |
|
|
|
|
|
|
|
|
|
|
|
|
|
|
|
|
|
|
|
|
|
|
|
|
| Business Services |
|
First lien(4) |
|
7.25% (Base Rate + 5.50%) |
|
|
10/14/2016 |
|
|
|
3,000,000 |
|
|
|
3,035,496 |
|
|
|
3,042,501 |
|
|
|
1.26 |
% |
| Datatel, Inc |
|
|
|
|
|
|
|
|
|
|
|
|
|
|
|
|
|
|
|
|
|
|
|
|
| Software |
|
Second lien(3) |
|
10.25% (Base Rate + 8.25%) |
|
|
12/9/2016 |
|
|
|
2,000,000 |
|
|
|
1,964,077 |
|
|
|
2,042,500 |
|
|
|
0.84 |
% |
| Applied Systems, Inc. |
|
|
|
|
|
|
|
|
|
|
|
|
|
|
|
|
|
|
|
|
|
|
|
|
| Software |
|
Second lien |
|
9.25% (Base Rate + 7.75%) |
|
|
6/8/2017 |
|
|
|
2,000,000 |
|
|
|
1,980,093 |
|
|
|
2,009,166 |
|
|
|
0.83 |
% |
|
|
|
|
|
|
|
|
|
|
|
|
|
|
|
|
|
|
|
|
|
|
|
|
|
| Total United States |
|
|
|
|
|
|
|
|
|
$ |
448,304,832 |
|
|
$ |
414,101,973 |
|
|
$ |
436,749,053 |
|
|
|
180.53 |
% |
|
|
|
|
|
|
|
|
|
|
|
|
|
|
|
|
|
|
|
|
|
|
|
|
|
| Total Funded Debt Investments |
|
|
|
|
|
|
|
|
|
$ |
452,782,332 |
|
|
$ |
418,459,124 |
|
|
$ |
441,495,203 |
|
|
|
182.49 |
% |
|
|
|
|
|
|
|
|
|
|
|
|
|
|
|
|
|
|
|
|
|
|
|
|
|
| Equity—United States |
|
|
|
|
|
|
|
|
|
|
|
|
|
|
|
|
|
|
|
|
|
|
|
|
| Stratus Technologies, Inc. |
|
|
|
|
|
|
|
|
|
|
|
|
|
|
|
|
|
|
|
|
|
|
|
|
| Information Technology |
|
Ordinary shares |
|
— |
|
|
— |
|
|
|
103,050 |
|
|
$ |
47,063 |
|
|
$ |
45,149 |
|
|
|
|
|
|
|
Preferred shares |
|
— |
|
|
— |
|
|
|
23,450 |
|
|
|
10,710 |
|
|
|
10,274 |
|
|
|
|
|
|
|
|
|
|
|
|
|
|
|
|
|
|
|
|
|
|
|
|
|
|
|
|
|
|
|
|
|
|
|
|
|
|
|
|
|
|
|
|
|
57,773 |
|
|
|
55,423 |
|
|
|
0.02 |
% |
|
|
|
|
|
|
|
|
|
|
|
|
|
|
|
|
|
|
|
|
|
|
|
|
|
| Total Shares |
|
|
|
|
|
|
|
|
|
|
|
|
|
$ |
57,773 |
|
|
$ |
55,423 |
|
|
|
0.02 |
% |
|
|
|
|
|
|
|
|
|
|
|
|
|
|
|
|
|
|
|
|
|
|
|
|
|
| Warrants—United States |
|
|
|
|
|
|
|
|
|
|
|
|
|
|
|
|
|
|
|
|
|
|
|
|
| Alion Science and Technology Corporation |
|
|
|
|
|
|
|
|
|
|
|
|
|
|
|
|
|
|
|
|
|
|
|
|
| Federal Services |
|
Warrants(3) |
|
— |
|
|
— |
|
|
|
6,000 |
|
|
$ |
292,851 |
|
|
$ |
283,698 |
|
|
|
0.12 |
% |
| Learning Care Group (US), Inc. |
|
|
|
|
|
|
|
|
|
|
|
|
|
|
|
|
|
|
|
|
|
|
|
|
| Education |
|
Warrants |
|
— |
|
|
— |
|
|
|
845 |
|
|
|
193,850 |
|
|
|
193,742 |
|
|
|
0.08 |
% |
|
|
|
|
|
|
|
|
|
|
|
|
|
|
|
|
|
|
|
|
|
|
|
|
|
| Total Warrants |
|
|
|
|
|
|
|
|
|
|
|
|
|
$ |
486,701 |
|
|
$ |
477,440 |
|
|
|
0.20 |
% |
|
|
|
|
|
|
|
|
|
|
|
|
|
|
|
|
|
|
|
|
|
|
|
|
|
| Total Funded Investments |
|
|
|
|
|
|
|
|
|
|
|
|
|
$ |
419,003,598 |
|
|
$ |
442,028,066 |
|
|
|
182.71 |
% |
|
|
|
|
|
|
|
|
|
|
|
|
|
|
|
|
|
|
|
|
|
|
|
|
|
The accompanying
notes are an integral part of these consolidated financial statements.
F-77
New Mountain Finance Holdings, L.L.C.
Consolidated Schedule of Investments (continued)
December 31, 2010
|
|
|
|
|
|
|
|
|
|
|
|
|
|
|
|
|
|
|
|
|
|
|
|
|
| Portfolio Company, Location
and Industry |
|
Type of
Investment |
|
Interest Rate |
|
Maturity
Date |
|
|
Principal
Amount,
Par Value
or Shares |
|
|
Cost |
|
|
Fair
Value |
|
|
Percent
of
Members’
Capital |
|
| Unfunded Debt Investments—United States |
|
|
|
|
|
|
|
|
|
|
|
|
|
|
|
|
|
|
|
|
|
|
|
|
| Education Management LLC |
|
|
|
|
|
|
|
|
|
|
|
|
|
|
|
|
|
|
|
|
|
|
|
|
| Education |
|
First lien(1) |
|
— |
|
|
6/1/2012 |
|
|
$ |
3,000,000 |
|
|
$ |
(1,215,000 |
) |
|
$ |
(217,500 |
) |
|
|
(0.09 |
)% |
| Kronos Incorporated |
|
|
|
|
|
|
|
|
|
|
|
|
|
|
|
|
|
|
|
|
|
|
|
|
| Software |
|
First lien(1) |
|
— |
|
|
6/11/2013 |
|
|
|
4,198,500 |
|
|
|
(629,775 |
) |
|
|
(346,376 |
) |
|
|
(0.14 |
)% |
| RGIS Services, LLC |
|
|
|
|
|
|
|
|
|
|
|
|
|
|
|
|
|
|
|
|
|
|
|
|
| Business Services |
|
First lien(1) |
|
— |
|
|
4/30/2013 |
|
|
|
5,000,000 |
|
|
|
(2,850,000 |
) |
|
|
(406,350 |
) |
|
|
(0.17 |
)% |
|
|
|
|
|
|
|
|
|
|
|
|
|
|
|
|
|
|
|
|
|
|
|
|
|
| Total Unfunded Debt Investments |
|
|
|
|
|
|
|
|
|
$ |
12,198,500 |
|
|
$ |
(4,694,775 |
) |
|
$ |
(970,226 |
) |
|
|
(0.40 |
)% |
|
|
|
|
|
|
|
|
|
|
|
|
|
|
|
|
|
|
|
|
|
|
|
|
|
| Total Investments |
|
|
|
|
|
|
|
|
|
|
|
|
|
$ |
414,308,823 |
|
|
$ |
441,057,840 |
|
|
|
182.31 |
% |
|
|
|
|
|
|
|
|
|
|
|
|
|
|
|
|
|
|
|
|
|
|
|
|
|
| (1) |
Par Value amounts represent the undrawn portion of revolving credit facilities. Cost amounts represent the cash received at settlement date increased for paydowns at par minus
the purchase price. |
| (2) |
The company is headquartered in Canada. The debt is issued in United States dollars. |
| (3) |
The Holdings credit facility (formerly known as the Debt Funding Credit Facility) is collateralized by the indicated investments. |
| (4) |
The SLF credit facility is collateralized by the indicated investments. |
The accompanying notes are an integral part of these consolidated financial statements.
F-78
New Mountain Finance Holdings, L.L.C.
Consolidated Schedule of Investments (continued)
December 31, 2010
|
|
|
|
|
| |
|
December 31, 2010 |
|
| Investment Type |
|
Percent of Total
Investments at Fair Value |
|
| First lien |
|
|
72.83 |
% |
| Second lien |
|
|
22.43 |
% |
| Subordinated |
|
|
4.62 |
% |
| Equity and other |
|
|
0.12 |
% |
|
|
|
|
|
| Total investments |
|
|
100.00 |
% |
|
|
|
|
|
|
|
| |
|
December 31, 2010 |
|
| Industry Type |
|
Percent of Total
Investments at Fair Value |
|
| Software |
|
|
25.37 |
% |
| Healthcare Services |
|
|
21.50 |
% |
| Business Services |
|
|
13.98 |
% |
| Federal Services |
|
|
7.21 |
% |
| Education |
|
|
7.14 |
% |
| Consumer Services |
|
|
5.71 |
% |
| Healthcare Information Technology |
|
|
3.17 |
% |
| Telecommunication |
|
|
2.77 |
% |
| Media |
|
|
2.69 |
% |
| Industrial Services |
|
|
2.36 |
% |
| Franchises |
|
|
2.11 |
% |
| Power Generation |
|
|
1.77 |
% |
| Logistics |
|
|
1.36 |
% |
| Energy |
|
|
1.08 |
% |
| Information Technology |
|
|
0.97 |
% |
| Healthcare Facilities |
|
|
0.81 |
% |
|
|
|
|
|
| Total investments |
|
|
100.00 |
% |
|
|
|
|
|
The accompanying notes are an integral
part of these consolidated financial statements.
F-79
New Mountain Finance Corporation
Statement of Assets and Liabilities
December 31, 2011
|
|
|
|
|
| Assets |
|
|
|
|
| Investment in New Mountain Finance Holdings, L.L.C., at fair value
(cost of $144,355,856) |
|
$ |
145,486,821 |
|
|
|
|
|
|
| Total assets |
|
$ |
145,486,821 |
|
|
|
|
|
|
| Net assets |
|
|
|
|
| Common stock, par value $0.01 per share 10,697,691 shares issued and outstanding |
|
|
106,977 |
|
| Paid in capital in excess of par |
|
|
144,248,879 |
|
| Accumulated undistributed realized gains |
|
|
286,307 |
|
| Net unrealized appreciation (depreciation) |
|
|
844,658 |
|
|
|
|
|
|
| Total net assets |
|
$ |
145,486,821 |
|
|
|
|
|
|
| Number of shares outstanding |
|
|
10,697,691 |
|
| Net asset value per share |
|
$ |
13.60 |
|
The accompanying notes are an integral part of these financial statements.
F-80
New Mountain Finance Corporation
Statement of Operations
May 19, 2011 (commencement of operations) to December 31, 2011
|
|
|
|
|
| Net investment income allocated from New Mountain Finance Holdings, L.L.C. |
|
|
|
|
| Interest income |
|
$ |
13,436,693 |
|
| Other income |
|
|
231,919 |
|
| Total expenses |
|
|
(5,323,309 |
) |
|
|
|
|
|
| Net investment income allocated from New Mountain Finance Holdings, L.L.C. |
|
|
8,345,303 |
|
| Realized and unrealized gain (loss) allocated from New Mountain Finance Holdings, L.L.C. |
|
|
|
|
| Realized gains on investments |
|
|
1,141,018 |
|
| Net change in unrealized (depreciation) appreciation of investments |
|
|
(5,375,862 |
) |
|
|
|
|
|
| Realized and unrealized (loss) gain allocated from New Mountain Finance Holdings, L.L.C. |
|
|
(4,234,844 |
) |
|
|
|
|
|
| Total net increase in net assets resulting from operations allocated from New Mountain Finance Holdings, L.L.C. |
|
|
4,110,459 |
|
|
|
|
|
|
| Unrealized appreciation in New Mountain Finance Holdings, L.L.C. resulting from public offering price |
|
|
6,220,520 |
|
| Net increase in net assets resulting from operations |
|
$ |
10,330,979 |
|
|
|
|
|
|
| Basic earnings per share |
|
$ |
0.97 |
|
| Weighted average shares of common stock outstanding—basic (See Note 12) |
|
|
10,697,691 |
|
| Diluted earnings per share |
|
$ |
0.38 |
|
| Weighted average shares of common stock outstanding—diluted (See Note 12) |
|
|
30,919,629 |
|
The accompanying notes are an integral part of these financial statements.
F-81
New Mountain Finance Corporation
Statement of Changes in Net Assets
May 19, 2011 (commencement of operations) to December 31, 2011
|
|
|
|
|
| Increase (decrease) in net assets resulting from operations allocated from New Mountain Finance Holdings, L.L.C.: |
|
|
|
|
| Net investment income |
|
$ |
8,345,303 |
|
| Realized gains on investments |
|
|
1,141,018 |
|
| Net change in unrealized (depreciation) appreciation of investments |
|
|
(5,375,862 |
) |
|
|
|
|
|
| Total net increase in net assets resulting from operations allocated from New Mountain Finance Holdings, L.L.C. |
|
|
4,110,459 |
|
| Unrealized appreciation (depreciation) in New Mountain Finance Holdings, L.L.C. resulting from public offering price |
|
|
6,220,520 |
|
|
|
|
|
|
| Total net increase in net assets resulting from operations |
|
|
10,330,979 |
|
|
|
|
|
|
| Capital transactions |
|
|
|
|
| Proceeds from shares sold |
|
|
129,864,996 |
|
| Deferred offering costs allocated from New Mountain Finance Holdings, L.L.C. |
|
|
(3,998,597 |
) |
| Contributions from exchanged shares |
|
|
18,489,457 |
|
| Dividends paid |
|
|
(9,200,014 |
) |
|
|
|
|
|
| Total net increase in net assets resulting from capital transactions |
|
|
135,155,842 |
|
|
|
|
|
|
| Net increase in net assets |
|
|
145,486,821 |
|
| Net assets at beginning of period |
|
|
— |
|
|
|
|
|
|
| Net assets at end of period |
|
$ |
145,486,821 |
|
|
|
|
|
|
The accompanying notes are an integral part of these financial statements.
F-82
New Mountain Finance Corporation
Statement of Cash Flows
May 19, 2011 (commencement of operations) to December 31, 2011
|
|
|
|
|
| Cash flows from operating activities: |
|
|
|
|
| Net increase in net assets resulting from operations |
|
$ |
10,330,979 |
|
| Adjustments to reconcile net (increase) decrease in net assets resulting from operations to net cash used in operating
activities: |
|
|
|
|
| Net investment income allocated from New Mountain Finance Holdings, L.L.C. |
|
|
(8,345,303 |
) |
| Realized and unrealized loss allocated from New Mountain Finance Holdings, L.L.C. |
|
|
4,234,844 |
|
| Unrealized appreciation in New Mountain Finance Holdings, L.L.C. resulting from public offering price |
|
|
(6,220,520 |
) |
| (Increase) decrease in operating assets: |
|
|
|
|
| Purchase of investment |
|
|
(129,864,996 |
) |
| Distributions from New Mountain Finance Holdings, L.L.C. |
|
|
9,200,014 |
|
|
|
|
|
|
| Net cash flows used in operating activities |
|
|
(120,664,982 |
) |
|
|
|
|
|
| Cash flows from financing activities: |
|
|
|
|
| Proceeds from shares sold |
|
|
129,864,996 |
|
| Dividends paid |
|
|
(9,200,014 |
) |
|
|
|
|
|
| Net cash flows provided by financing activities |
|
|
120,664,982 |
|
|
|
|
|
|
| Net increase (decrease) in cash and cash equivalents |
|
|
— |
|
| Cash and cash equivalents at the beginning of the period |
|
|
— |
|
|
|
|
|
|
| Cash and cash equivalents at the end of the period |
|
$ |
— |
|
|
|
|
|
|
| Non-cash financing activities: |
|
|
|
|
| New Mountain Guardian Partners, L.P. exchange of Operating Company units for shares |
|
$ |
18,489,457 |
|
| Deferred offering costs allocated from New Mountain Finance Holdings, L.L.C. |
|
$ |
(3,998,597 |
) |
The accompanying notes are an integral part of these financial statements.
F-83
New Mountain Finance AIV Holdings Corporation
Statement of Assets and Liabilities
December 31, 2011
|
|
|
|
|
| Assets |
|
|
|
|
| Investment in New Mountain Finance Holdings, L.L.C., at fair value
(cost of $290,847,952) |
|
$ |
275,014,997 |
|
|
|
|
|
|
| Total assets |
|
$ |
275,014,997 |
|
|
|
|
|
|
|
|
| Net assets |
|
|
|
|
| Common stock, par value $0.01 per share 100 shares issued and outstanding |
|
|
1 |
|
| Paid in capital in excess of par (see Note 10) |
|
|
292,383,201 |
|
| Distributions in excess of net investment income and realized gains
(see Note 10) |
|
|
(994,034 |
) |
| Net unrealized (depreciation) appreciation |
|
|
(16,374,171 |
) |
|
|
|
|
|
| Total net assets |
|
$ |
275,014,997 |
|
|
|
|
|
|
The accompanying notes are an integral part of these financial statements.
F-84
New Mountain Finance AIV Holdings Corporation
Statement of Operations
May 19, 2011 (commencement of operations) to December 31, 2011
|
|
|
|
|
| Net investment income allocated from New Mountain Finance Holdings, L.L.C. |
|
|
|
|
| Interest income |
|
$ |
25,399,498 |
|
| Other income |
|
|
438,399 |
|
| Total expenses |
|
|
(10,062,692 |
) |
|
|
|
|
|
| Net investment income allocated from New Mountain Finance Holdings, L.L.C. |
|
|
15,775,205 |
|
| Realized and unrealized gain (loss) allocated from New Mountain Finance Holdings, L.L.C. |
|
|
|
|
| Realized gains on investments |
|
|
2,156,878 |
|
| Net change in unrealized (depreciation) appreciation of investments |
|
|
(10,162,038 |
) |
|
|
|
|
|
| Realized and unrealized (loss) gain allocated from New Mountain Finance Holdings, L.L.C. |
|
|
(8,005,160 |
) |
|
|
|
|
|
| Total net increase in net assets resulting from operations allocated from New Mountain Finance Holdings, L.L.C. |
|
|
7,770,045 |
|
|
|
|
|
|
| Unrealized (depreciation) appreciation in New Mountain Finance Holdings, L.L.C. resulting from public offering price |
|
|
(6,212,133 |
) |
| Net increase in net assets resulting from operations |
|
$ |
1,557,912 |
|
|
|
|
|
|
The accompanying notes are an integral part of these financial statements.
F-85
New Mountain Finance AIV Holdings Corporation
Statement of Changes in Net Assets
May 19, 2011 (commencement of operations) to December 31, 2011
|
|
|
|
|
| Increase (decrease) in net assets resulting from operations allocated from New Mountain Finance
Holdings, L.L.C.: |
|
| Net investment income |
|
$ |
15,775,205 |
|
| Realized gains on investments |
|
|
2,156,878 |
|
| Net change in unrealized (depreciation) appreciation of investments |
|
|
(10,162,038 |
) |
|
|
|
|
|
| Total net increase in net assets resulting from operations allocated from New Mountain Finance Holdings, L.L.C. |
|
|
7,770,045 |
|
| Unrealized (depreciation) appreciation in New Mountain Finance Holdings, L.L.C. resulting from public offering price |
|
|
(6,212,133 |
) |
|
|
|
|
|
| Net increase in net assets resulting from operations |
|
|
1,557,912 |
|
|
|
|
|
|
| Capital transactions |
|
|
|
|
| Deferred offering costs allocated from New Mountain Finance Holdings, L.L.C. |
|
|
(7,558,581 |
) |
| Contributions from exchanged shares |
|
|
298,406,533 |
|
| Dividends paid |
|
|
(17,390,867 |
) |
|
|
|
|
|
| Total net increase in net assets resulting from capital transactions |
|
|
273,457,085 |
|
|
|
|
|
|
| Net increase in net assets |
|
|
275,014,997 |
|
| Net assets at beginning of period |
|
|
— |
|
|
|
|
|
|
| Net assets at end of period |
|
$ |
275,014,997 |
|
|
|
|
|
|
The accompanying notes are an integral part of these financial statements.
F-86
New Mountain Finance AIV Holdings Corporation
Statement of Cash Flows
May 19, 2011 (commencement of operations) to December 31, 2011
|
|
|
|
|
| Cash flows from operating activities: |
|
|
|
|
| Net increase in net assets resulting from operations |
|
$ |
1,557,912 |
|
| Adjustments to reconcile net (increase) decrease in net assets resulting from operations to net cash used in operating
activities: |
|
|
|
|
| Net investment income allocated from New Mountain Finance Holdings, L.L.C. |
|
|
(15,775,205 |
) |
| Realized and unrealized loss allocated from New Mountain Finance Holdings, L.L.C. |
|
|
8,005,160 |
|
| Unrealized depreciation (appreciation) in New Mountain Finance Holdings, L.L.C. resulting from public offering price |
|
|
6,212,133 |
|
| (Increase) decrease in operating assets: |
|
|
|
|
| Distributions from New Mountain Finance Holdings, L.L.C. |
|
|
17,390,867 |
|
|
|
|
|
|
| Net cash flows used in operating activities |
|
|
17,390,867 |
|
|
|
|
|
|
| Cash flows from financing activities: |
|
|
|
|
| Dividends paid |
|
|
(17,390,867 |
) |
|
|
|
|
|
| Net cash flows provided by financing activities |
|
|
(17,390,867 |
) |
|
|
|
|
|
| Net increase (decrease) in cash and cash equivalents |
|
|
— |
|
| Cash and cash equivalents at the beginning of the period |
|
|
— |
|
|
|
|
|
|
| Cash and cash equivalents at the end of the period |
|
$ |
— |
|
|
|
|
|
|
| Non-cash financing activities: |
|
|
|
|
| New Mountain Guardian AIV, L.P. contribution of New Mountain Finance Holdings, L.L.C units for shares of New Mountain Finance AIV
Holdings, L.L.C. |
|
$ |
298,406,533 |
|
| Deferred offering costs allocated from New Mountain Finance Holdings, L.L.C. |
|
$ |
(7,558,581 |
) |
The accompanying notes are an integral part of these financial statements.
F-87
Combined Notes to the Consolidated Financial Statements of
New Mountain Finance Holdings, L.L.C.,
the Financial Statements of New Mountain Finance Corporation, and the Financial Statements
of New Mountain Finance AIV Holdings Corporation
December 31, 2011
The information in these combined notes to the financial statements
relates to each of the three separate registrants: New Mountain Finance Holdings, L.L.C., New Mountain Finance Corporation and New Mountain Finance AIV Holdings Corporation (collectively, “we”, “us”, “our” or the
“Companies”). Information that relates to an individual registrant will be specifically referenced by the respective company. None of the Companies makes any representation as to the information related solely to the other registrants
other than itself.
Note 1. Formation and Business Purpose
New Mountain Finance Holdings, L.L.C. (“NMF Holdings”, the “Operating Company” or the “Master Fund”) is a Delaware limited liability company. NMF Holdings is externally managed and has
elected to be treated as a business development company (“BDC”) under the Investment Company Act of 1940, as amended (the “1940 Act”). As such, NMF Holdings is obligated to comply with certain regulatory requirements. NMF
Holdings intends to be treated as a partnership for federal income tax purposes for so long as it has at least two members.
NMF
Holdings is externally managed by New Mountain Finance Advisers BDC, L.L.C. (the “Investment Adviser”). New Mountain Finance Administration, L.L.C. (the “Administrator”) provides the administrative services necessary for
operations. The Investment Adviser and Administrator are wholly-owned subsidiaries of New Mountain Capital (defined as New Mountain Capital Group, L.L.C. and its affiliates). New Mountain Capital is a firm with a track record of investing in the
middle market and with assets under management (which includes amounts committed, not all of which have been drawn down and invested to date) totaling approximately $9.0 billion as of December 31, 2011. New Mountain Capital focuses on
investing in defensive growth companies across its private equity, public equity, and credit investment vehicles. NMF Holdings, formerly known as New Mountain Guardian (Leveraged), L.L.C., was originally formed as a subsidiary of New Mountain
Guardian AIV, L.P. (“Guardian AIV”) by New Mountain Capital in October 2008. Guardian AIV was formed through an allocation of approximately $300.0 million of the $5.1 billion of commitments supporting New Mountain Partners
III, L.P., a private equity fund managed by New Mountain Capital. In February 2009, New Mountain Capital formed a co-investment vehicle, New Mountain Guardian Partners, L.P., comprising $20.4 million of commitments. New Mountain
Guardian (Leveraged), L.L.C. and New Mountain Guardian Partners, L.P., together with their respective direct and indirect wholly-owned subsidiaries, are defined as the “Predecessor Entities”.
New Mountain Finance Corporation (“New Mountain Finance”) is a Delaware corporation that was originally incorporated on June 29,
2010. New Mountain Finance is a closed-end, non-diversified management investment company that has elected to be treated as a BDC under the 1940 Act. As such, New Mountain Finance is obligated to comply with certain regulatory requirements. New
Mountain Finance intends to be treated, and intends to comply with the requirements to qualify annually, as a regulated investment company (“RIC”) under Subchapter M of the Internal Revenue Code of 1986, as amended, (the
“Code”) commencing with its taxable year ended December 31, 2011.
New Mountain Finance AIV Holdings Corporation
(“AIV Holdings”) is a Delaware corporation that was originally incorporated on March 11, 2011. Guardian AIV, a Delaware limited partnership, is AIV Holdings’ sole stockholder. AIV Holdings is a closed-end, non-diversified
management investment
F-88
Combined Notes to the Consolidated Financial Statements of
New Mountain Finance Holdings, L.L.C.,
the Financial Statements of New Mountain Finance Corporation, and the Financial Statements
of New Mountain Finance AIV Holdings Corporation (continued)
company that has elected to be treated as a BDC under the 1940 Act. As such, AIV Holdings is obligated to comply with certain regulatory requirements. AIV Holdings intends to be treated, and
intends to comply with the requirements to qualify annually, as a RIC under the Code commencing with its taxable year ended December 31, 2011.
On May 19, 2011, New Mountain Finance priced its initial public offering (the “IPO”) of 7,272,727 shares of common stock at a public offering price of $13.75 per share. Concurrently with the closing
of the IPO and at the public offering price of $13.75 per share, New Mountain Finance sold an additional 2,172,000 shares of its common stock to certain executives and employees of, and other individuals affiliated with, New Mountain Capital in a
concurrent private placement (the “Concurrent Private Placement”). Additionally, 1,252,964 shares were issued to the limited partners of New Mountain Guardian Partners, L.P. at that time for their ownership interest in the Predecessor
Entities. In connection with New Mountain Finance’s IPO and through a series of transactions, NMF Holdings owns all of the operations of the Predecessor Entities, including all of the assets and liabilities related to such operations.
New Mountain Finance and AIV Holdings are holding companies with no direct operations of their own, and their sole asset is their
ownership in NMF Holdings. New Mountain Finance and AIV Holdings each entered into a joinder agreement with respect to the Limited Liability Company Agreement, as amended and restated, of NMF Holdings, pursuant to which New Mountain Finance and AIV
Holdings were admitted as members of NMF Holdings. New Mountain Finance acquired from NMF Holdings, with the gross proceeds of the IPO and the Concurrent Private Placement, common membership units (“units”) of NMF Holdings (the number of
units are equal to the number of shares of New Mountain Finance’s common stock sold in the IPO and the Concurrent Private Placement). Additionally, New Mountain Finance received units of NMF Holdings equal to the number of shares of common
stock of New Mountain Finance issued to the limited partners of New Mountain Guardian Partners, L.P. Guardian AIV was the parent of NMF Holdings prior to the IPO and, as a result of the transactions completed in connection with the IPO,
obtained units in NMF Holdings. Guardian AIV contributed its units in NMF Holdings to its newly formed subsidiary, AIV Holdings, in exchange for common stock of AIV Holdings. AIV Holdings has the right to exchange all or any portion of its units in
NMF Holdings for shares of New Mountain Finance’s common stock on a one-for-one basis.
As of December 31, 2011, New Mountain
Finance and AIV Holdings own approximately 34.6% and 65.4%, respectively, of the units of NMF Holdings.
The current structure was
designed to generally prevent New Mountain Finance from being allocated taxable income with respect to unrecognized gains that existed at the time of the IPO in the Predecessor Entities’ assets, and rather such amounts would be allocated
generally to AIV Holdings. The result is that any distributions made to New Mountain Finance’s stockholders that are attributable to such gains generally will not be treated as taxable dividends but rather as return of capital.
F-89
Combined Notes to the Consolidated Financial Statements of
New Mountain Finance Holdings, L.L.C.,
the Financial Statements of New Mountain Finance Corporation, and the Financial Statements
of New Mountain Finance AIV Holdings Corporation (continued)
The diagram below depicts our current organizational structure.
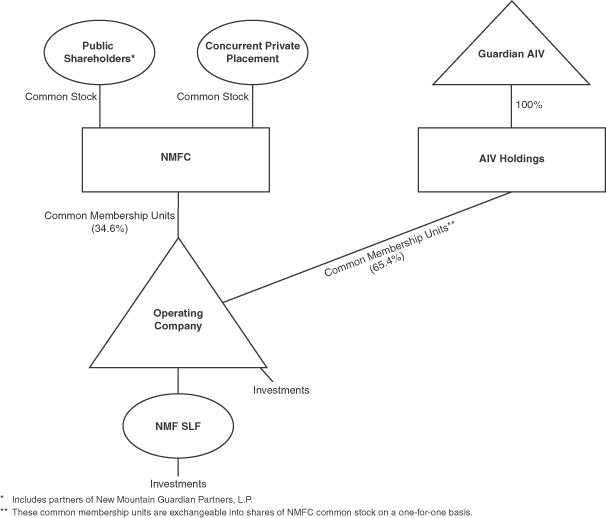
NMF Holdings’ investment objective is to generate current income and capital appreciation through the
sourcing and origination of debt securities at all levels of the capital structure, including first and second lien debt, notes, bonds and mezzanine securities. In some cases, NMF Holdings’ investments may also include equity interests. The
primary focus is in the debt of defensive growth companies, which are defined as generally exhibiting the following characteristics: (i) sustainable secular growth drivers, (ii) high barriers to competitive entry, (iii) high free cash
flow after capital expenditure and working capital needs, (iv) high returns on assets and (v) opportunities for niche market dominance.
Note 2. Summary of Significant Accounting Policies
Basis of accounting—The Companies’ financial statements have been prepared in conformity with accounting principles generally accepted in the United States of America (“GAAP”). NMF
Holdings
F-90
Combined Notes to the Consolidated Financial Statements of
New Mountain Finance Holdings, L.L.C.,
the Financial Statements of New Mountain Finance Corporation, and the Financial Statements
of New Mountain Finance AIV Holdings Corporation (continued)
consolidates its wholly-owned subsidiary, New Mountain Finance SPV Funding, L.L.C. (“NMF SLF”). New Mountain Finance and AIV Holdings do not consolidate the Operating Company. New
Mountain Finance and AIV Holdings apply investment company master-feeder financial statement presentation, as described in Accounting Standards Codification 946, Financial Services—Investment Companies, (“ASC 946”) to their
interest in the Operating Company. New Mountain Finance and AIV Holdings observe that it is industry practice to follow the presentation prescribed for a Master Fund-Feeder fund structure in ASC 946 in instances in which a Master Fund is owned by
more than one feeder fund and that such presentation provides stockholders of New Mountain Finance and AIV Holdings with a clearer depiction of their investment in the Master Fund.
The Companies’ financial statements reflect all adjustments and reclassifications which, in the opinion of management, are necessary for the
fair presentation of the results of operations and financial condition for all periods presented. All intercompany transactions have been eliminated. Revenues are recognized when earned and expenses when incurred. The financial results of the
Operating Company’s portfolio investments are not consolidated in the financial statements.
The Companies’ financial
statements are prepared in accordance with GAAP and pursuant to the requirements for reporting on Form 10-K and Articles 6 of Regulation S-X. In the opinion of management, all adjustments, consisting solely of normal recurring
accruals considered necessary for the fair presentation of financial statements have been included.
Investments—The
Operating Company applies fair value accounting in accordance with GAAP. Fair value is the amount that would be received to sell an asset or paid to transfer a liability in an orderly transaction between market participants at the measurement date.
Investments are reflected on the Operating Company’s Consolidated Statements of Assets, Liabilities and Members’ Capital at fair value, with changes in unrealized gains and losses resulting from changes in fair value reflected in the
Operating Company’s Consolidated Statements of Operations as “Net change in unrealized appreciation (depreciation) of investments” and realizations on portfolio investments reflected in the Operating Company’s Consolidated
Statements of Operations as “Realized gains (losses) on investments”.
The Operating Company values its assets on a quarterly
basis, or more frequently if required under the 1940 Act. In all cases, the Operating Company’s board of directors is ultimately and solely responsible for determining the fair value of the its portfolio investments on a quarterly basis in good
faith, including investments that are not publicly traded, those whose market prices are not readily available and any other situation where its portfolio investments require a fair value determination. Security transactions are accounted for on a
trade date basis. The Operating Company’s quarterly valuation procedures are set forth in more detail below:
(1)
Investments for which market quotations are readily available on an exchange are valued at such market quotations based on the closing price indicated from independent pricing services.
(2) Investments for which indicative prices are obtained from various pricing services and/or brokers or dealers are valued through
a multi-step valuation process, as described below, to determine whether the quote(s) obtained is representative of fair value in accordance with GAAP.
a. Bond quotes are obtained through independent pricing services. Analytics are performed by the investment professionals of the Investment Adviser to ensure that the quote obtained is representative of fair value
in accordance with GAAP and if so, the quote is used. If the
F-91
Combined Notes to the Consolidated Financial Statements of
New Mountain Finance Holdings, L.L.C.,
the Financial Statements of New Mountain Finance Corporation, and the Financial Statements
of New Mountain Finance AIV Holdings Corporation (continued)
Investment Adviser is unable to sufficiently validate the quote(s) internally and if the investment’s par value exceeds the materiality threshold, the investment is valued similarly to those
assets with no readily available quotes (see (3) below); and
b. For investments other than bonds, the Operating
Company looks at the number of quotes readily available and performs the following:
i. Investments for which more than
two quotes are received from a pricing service are valued using the mean of the mean of the bid and ask of the quotes obtained;
ii. Investments for which one or two quotes are received from a pricing service are validated internally. The investment professionals of the Investment Adviser analyze the market quotes obtained using an array of
valuation methods (further described below) to validate the fair value. If the Investment Adviser is unable to sufficiently validate the quote(s) internally and if the investment’s par value exceeds the materiality threshold, the investment is
valued similarly to those assets with no readily available quotes (see (3) below).
(3) Investments for which
quotations are not readily available through exchanges, pricing services, brokers, or dealers are valued through a multi-step valuation process:
a. Each portfolio company or investment is initially valued by the investment professionals of the Investment Adviser responsible for the credit monitoring;
b. Preliminary valuation conclusions will then be documented and discussed with the Operating Company’s senior management;
c. If an investment falls into (3) above for four consecutive quarters and if the investment’s par value
exceeds the materiality threshold, then at least once each fiscal year, the valuation for each portfolio investment for which the Operating Company does not have a readily available market quotation will be reviewed by an independent valuation firm
engaged by our board of directors; and
d. Also, when deemed appropriate by the Operating Company’s management, an
independent valuation firm may be engaged to review and value investment(s) of a portfolio company, without any preliminary valuation being performed by the Investment Adviser. The investment professionals of the Investment Adviser will review and
validate the value provided.
Valuation methods may include comparisons of financial ratios of the portfolio companies that issued such
private securities to peer companies that are public, the nature of and the realizable value of any collateral, the portfolio company’s earnings, discounted cash flows, the ability to make payments, the markets in which the portfolio company
conducts business, and other relevant factors, including available market data such as relevant and applicable market trading and transaction comparables; applicable market yields and multiples; security covenants; call protection provisions;
information rights; comparable merger and acquisition transactions; and the principal market and enterprise values. When an external event such as a purchase transaction, public offering or subsequent sale occurs, the Operating Company will consider
the pricing indicated by the external event to corroborate the private valuation.
The values assigned to investments are based upon
available information and do not necessarily represent amounts which might ultimately be realized, since such amounts depend on future circumstances and cannot be reasonably determined until the individual positions are liquidated. Due
F-92
Combined Notes to the Consolidated Financial Statements of
New Mountain Finance Holdings, L.L.C.,
the Financial Statements of New Mountain Finance Corporation, and the Financial Statements
of New Mountain Finance AIV Holdings Corporation (continued)
to the inherent uncertainty of determining the fair value of investments that do not have a readily available market value, the fair value of NMF Holdings’ investments may fluctuate from
period to period.
New Mountain Finance and AIV Holdings are holding companies with no direct operations of their own, and their sole
asset is their ownership in the Operating Company. New Mountain Finance’s and AIV Holdings’ investments in the Operating Company are carried at fair value and represent the respective pro-rata interest in the net assets of the Operating
Company as of the applicable reporting date. New Mountain Finance and AIV Holdings value their ownership interest on a quarterly basis, or more frequently if required under the 1940 Act.
See Note 3, Investments, for further discussion relating to investments.
Cash and cash equivalents—Cash and cash equivalents include cash and short-term, highly liquid investments. The Companies define
cash equivalents as securities that are readily convertible into known amounts of cash and so near maturity that there is insignificant risk of changes in value. Generally, these securities have original maturities of three months or less.
Revenue recognition
The
Operating Company’s revenue recognition policies are as follows:
Sales and paydowns of
investments: Realized gains and losses on investments are determined on the specific identification method.
Interest income: Interest income, including amortization of premium and discount using the effective interest method, is recorded on the accrual basis and periodically assessed for
collectability. Interest income also includes interest earned from cash on hand. Upon the prepayment of a loan or debt security, any prepayment penalties are recorded as part of interest income. The Operating Company has loans in the portfolio that
contain a payment-in-kind (“PIK”) provision. PIK represents interest that is accrued and recorded as interest income at the contractual rates, added to the loan principal on the respective capitalization dates, and generally due at
maturity.
Non-accrual income: Loans are placed on non-accrual status when principal or
interest payments are past due 30 days or more or when there is reasonable doubt that principal or interest will be collected. Accrued cash and un-capitalized PIK interest is generally reversed when a loan is placed on non-accrual status.
Previously capitalized PIK interest is not reversed when an investment is placed on non-accrual status. Interest payments received on non-accrual loans may be recognized as income or applied to principal depending upon management’s judgment of
the ultimate outcome. Non-accrual loans are restored to accrual status when past due principal and interest is paid and, in management’s judgment, are likely to remain current.
Other income: Other income represents delayed compensation and miscellaneous fees received. Delayed
compensation is income earned from counterparties on trades that do not settle within a set number of business days after trade date.
New Mountain Finance’s and AIV Holdings’ revenue recognition policies are as follows:
Revenue, expenses, and capital gains (losses): At each quarterly valuation date, the Operating
Company’s investment income, expenses, net realized gains (losses), and net increase (decrease)
F-93
Combined Notes to the Consolidated Financial Statements of
New Mountain Finance Holdings, L.L.C.,
the Financial Statements of New Mountain Finance Corporation, and the Financial Statements
of New Mountain Finance AIV Holdings Corporation (continued)
in unrealized appreciation (depreciation) are allocated to New Mountain Finance and AIV Holdings based on their pro-rata interest in the net assets of the Operating Company. This is recorded on
New Mountain Finance’s and AIV Holdings’ Statements of Operations. New Mountain Finance used the proceeds from its IPO and Concurrent Private Placement to purchase units in the Operating Company at $13.75 per unit (its IPO price per
share). At the IPO date, $13.75 per unit represented a discount to the actual net asset value per unit of the Operating Company. As a result, New Mountain Finance experienced immediate unrealized appreciation on its investment. Concurrently, AIV
Holdings experienced immediate unrealized depreciation on its investment in the Operating Company equal to the difference between New Mountain Finance’s IPO price of $13.75 per unit and the actual net asset value per unit. This unrealized
appreciation and unrealized depreciation is shown separately on the Statements of Operations of New Mountain Finance and AIV Holdings, respectively.
All expenses, including those of New Mountain Finance and AIV Holdings, are paid and recorded by the Operating Company. Expenses are allocated to New Mountain Finance and AIV Holdings based on pro-rata ownership
interest. In addition, the Operating Company paid all of the offering costs related to the IPO. New Mountain Finance and AIV Holdings have recorded their portion of the offering costs as a direct reduction to net assets and the cost of their
investment in the Operating Company.
With respect to the expenses incident to any registration of shares of New Mountain
Finance’s common stock issued in exchange for units of the Operating Company, AIV Holdings is responsible for the expenses of any demand registration (including underwriters’ discounts or commissions) and their pro-rata share of any
“piggyback” registration expenses. No shares have been exchanged since formation.
Interest and other credit facility
expenses—Interest and other credit facility fees are recorded on an accrual basis by the Operating Company. See Note 7, Borrowing Facilities, for details.
Deferred credit facility costs—The deferred credit facility costs of the Operating Company consist of capitalized expenses
related to the origination of the Operating Company’s existing credit facilities. The Operating Company amortizes these costs into expense using the straight-line method over the stated life of the related credit facility. See Note 7,
Borrowing Facilities, for details.
Income taxes—NMF Holdings is treated as a partnership for federal income
tax purposes. Accordingly, no provision for income taxes has been made in the accompanying financial statements, as the partners are individually responsible for reporting income or loss based on their respective share of the revenues or expenses.
NMF Holdings files United States (“U.S.”) federal, state, and local income tax returns.
New Mountain Finance and AIV Holdings
intend to elect to be treated, and intend to comply with the requirements to qualify annually, as RICs under subchapter M of the Code, commencing with the filing of their December 31, 2011 income tax returns. As RICs, New Mountain Finance
and AIV Holdings are not subject to federal income tax on the portion of taxable income and gains timely distributed to stockholders; therefore, no provision for income taxes has been recorded.
To qualify as RICs, New Mountain Finance and AIV Holdings are required to meet certain income and asset diversification tests in addition to
distributing at least 90.0% of their respective investment
F-94
Combined Notes to the Consolidated Financial Statements of
New Mountain Finance Holdings, L.L.C.,
the Financial Statements of New Mountain Finance Corporation, and the Financial Statements
of New Mountain Finance AIV Holdings Corporation (continued)
company taxable income, as defined by the Code. Since federal income tax regulations differ from GAAP, distributions in accordance with tax regulations may differ from net investment income and
realized gains recognized for financial reporting purposes.
Differences between taxable income and the results of operations for
financial reporting purposes may be permanent or temporary in nature. Permanent differences are reclassified among capital accounts in the financial statements to reflect their tax character. Differences in classification may also result from the
treatment of short-term gains as ordinary income for tax purposes.
For federal income tax purposes, distributions paid to stockholders
of New Mountain Finance and AIV Holdings are reported as ordinary income, return of capital, long term capital gains or a combination thereof.
New Mountain Finance and AIV Holdings will be subject to a 4.0% nondeductible federal excise tax on certain undistributed income unless New Mountain Finance and AIV Holdings distribute, in a timely manner as
required by the Code, an amount at least equal to the sum of (1) 98.0% of their respective net ordinary income earned for the calendar year and (2) 98.2% of their respective capital gain net income for the one-year period ending
October 31 in the calendar year.
The Companies have adopted the Income Taxes topic of the Codification (“ASC 740”). ASC
740 provides guidance for how uncertain income tax positions should be recognized, measured, and disclosed in the financial statements. Based on their analyses, the Companies have determined that the adoption of ASC 740 did not have a material
impact to the Companies’ financial statements.
Dividends—Distributions to common unit holders of NMF Holdings
and common stockholders of New Mountain Finance and AIV Holdings are recorded on the record date as set by the respective board of directors. In order for New Mountain Finance and AIV Holdings to pay a dividend or other distribution to holders of
their common stock, it must be accompanied by a prior distribution by NMF Holdings to all of its unit holders. NMF Holdings intends to make distributions to its unit holders that will be sufficient to enable New Mountain Finance and AIV Holdings to
pay quarterly distributions to their stockholders and to obtain and maintain their status as RICs. New Mountain Finance and AIV Holdings intend to distribute approximately all of their portion of NMF Holdings’ adjusted net investment income
(see Note 5, Agreements) on a quarterly basis and substantially all of their portion of NMF Holdings’ taxable income on an annual basis, except that New Mountain Finance may retain certain net capital gains for reinvestment.
Under certain circumstances, the distributions that NMF Holdings makes to its members may not be sufficient for AIV Holdings to satisfy
the annual distribution requirement necessary for AIV Holdings to qualify as a RIC. In that case, it is expected that Guardian AIV would consent to be treated as if it received distributions from AIV Holdings sufficient to satisfy the annual
distribution requirement. Guardian AIV would be required to include the consent dividend in its taxable income as a dividend from AIV Holdings, which would result in phantom (i.e., non-cash) taxable income to Guardian AIV. AIV Holdings intends
to make quarterly distributions to Guardian AIV, its sole stockholder, out of assets legally available for distribution each quarter.
NMF Holdings and New Mountain Finance are required to take certain actions in order to maintain, at all times, a one-to-one ratio between the
number of units held by New Mountain Finance
F-95
Combined Notes to the Consolidated Financial Statements of
New Mountain Finance Holdings, L.L.C.,
the Financial Statements of New Mountain Finance Corporation, and the Financial Statements
of New Mountain Finance AIV Holdings Corporation (continued)
and the number of shares of New Mountain Finance’s common stock outstanding. New Mountain Finance has adopted a dividend reinvestment plan that provides on behalf of its stockholders for
reinvestment of any distributions declared, unless a stockholder elects to receive cash. Cash distributions reinvested in additional shares of New Mountain Finance’s common stock will be automatically reinvested by New Mountain Finance into
additional units of NMF Holdings. In addition, AIV Holdings does not intend to reinvest any distributions received from NMF Holdings in additional units of NMF Holdings.
New Mountain Finance applies the following in implementing the dividend reinvestment plan. If the price at which newly issued shares are to be credited to stockholders’ accounts is greater than 110.0% of the
last determined net asset value of the shares, New Mountain Finance will use only newly issued shares to implement its dividend reinvestment plan. Under such circumstances, the number of shares to be issued to a stockholder is determined by dividing
the total dollar amount of the distribution payable to such stockholder by the market price per share of New Mountain Finance’s common stock on the New York Stock Exchange (“NYSE”) on the distribution payment date. Market price per
share on that date will be the closing price for such shares on the NYSE or, if no sale is reported for such day, the average of their electronically reported bid and asked prices. If New Mountain Finance uses newly issued shares to implement the
plan, New Mountain Finance will receive, on a one-for-one basis, additional units of NMF Holdings in exchange for cash distributions that are reinvested in shares of New Mountain Finance’s common stock under the dividend reinvestment plan.
If the price at which newly issued shares are to be credited to stockholders’ accounts is less than 110.0% of the last determined
net asset value of the shares, New Mountain Finance will either issue new shares or instruct the plan administrator to purchase shares in the open market to satisfy the additional shares required. Shares purchased in open market transactions by the
plan administrator will be allocated to a stockholder based on the average purchase price, excluding any brokerage charges or other charges, of all shares of common stock purchased in the open market. The number of shares of New Mountain
Finance’s common stock to be outstanding after giving effect to payment of the distribution cannot be established until the value per share at which additional shares will be issued has been determined and elections of New Mountain
Finance’s stockholders have been tabulated.
Foreign securities—The accounting records of the Operating Company
are maintained in U.S. dollars. Investment securities denominated in foreign currencies are translated into U.S. dollars based on the rate of exchange of such currencies on the date of valuation. Purchases and sales of investment securities and
income and expense items denominated in foreign currencies are translated into U.S. dollars based on the rate of exchange of such currencies on the respective dates of the transactions. The Operating Company does not isolate that portion of the
results of operations resulting from changes in foreign exchange rates on investments from the fluctuations arising from changes in market prices of securities held. Such fluctuations are included with “Net change in unrealized (depreciation)
appreciation of investments” and “Realized gains on investments” in the Operating Company’s Consolidated Statements of Operations.
Investments denominated in foreign currencies may be negatively affected by movements in the rate of exchange between the U.S. dollar and such foreign currencies. This movement is beyond the control of the
Operating Company and cannot be predicted.
F-96
Combined Notes to the Consolidated Financial Statements of
New Mountain Finance Holdings, L.L.C.,
the Financial Statements of New Mountain Finance Corporation, and the Financial Statements
of New Mountain Finance AIV Holdings Corporation (continued)
Use of estimates—The preparation of the Companies’ financial statements
in conformity with GAAP requires management to make estimates and assumptions that affect the reported amounts of assets and liabilities at the date of the Companies’ financial statements and the reported amounts of revenues and expenses during
the reporting periods. Changes in the economic environment, financial markets, and other metrics used in determining these estimates could cause actual results to differ from the estimates used, and the differences could be material.
Note 3. Investments
At
December 31, 2011 the Operating Company’s investments consisted of the following:
Investment Cost and Fair Value by Type
|
|
|
|
|
|
|
|
|
| |
|
Cost |
|
|
Fair Value |
|
| First lien |
|
$ |
407,538,564 |
|
|
$ |
410,313,643 |
|
| Second lien |
|
|
262,532,416 |
|
|
|
262,701,495 |
|
| Subordinated |
|
|
26,672,980 |
|
|
|
27,648,951 |
|
| Equity and other |
|
|
3,120,824 |
|
|
|
2,849,471 |
|
|
|
|
|
|
|
|
|
|
| Total investments |
|
$ |
699,864,784 |
|
|
$ |
703,513,560 |
|
|
|
|
|
|
|
|
|
|
Investment Cost and Fair Value by Industry
|
|
|
|
|
|
|
|
|
| |
|
Cost |
|
|
Fair Value |
|
| Business Services |
|
$ |
73,143,286 |
|
|
$ |
76,435,801 |
|
| Consumer Services |
|
|
29,357,183 |
|
|
|
29,764,430 |
|
| Education |
|
|
104,237,094 |
|
|
|
101,794,083 |
|
| Federal Services |
|
|
70,665,154 |
|
|
|
70,674,563 |
|
| Healthcare Information Technology |
|
|
14,704,271 |
|
|
|
14,108,263 |
|
| Healthcare Products |
|
|
24,037,614 |
|
|
|
24,875,000 |
|
| Healthcare Services |
|
|
113,200,121 |
|
|
|
117,544,595 |
|
| Industrial Services |
|
|
19,220,188 |
|
|
|
17,543,793 |
|
| Information Services |
|
|
29,516,875 |
|
|
|
29,626,611 |
|
| Information Technology |
|
|
6,570,081 |
|
|
|
6,249,251 |
|
| Logistics |
|
|
25,407,419 |
|
|
|
24,610,002 |
|
| Media |
|
|
11,756,172 |
|
|
|
11,731,350 |
|
| Power Generation |
|
|
9,966,951 |
|
|
|
8,609,943 |
|
| Software |
|
|
153,797,485 |
|
|
|
155,642,372 |
|
| Specialty Chemicals and Materials |
|
|
9,449,821 |
|
|
|
9,430,359 |
|
| Telecommunication |
|
|
4,835,069 |
|
|
|
4,873,144 |
|
|
|
|
|
|
|
|
|
|
| Total investments |
|
$ |
699,864,784 |
|
|
$ |
703,513,560 |
|
|
|
|
|
|
|
|
|
|
F-97
Combined Notes to the Consolidated Financial Statements of
New Mountain Finance Holdings, L.L.C.,
the Financial Statements of New Mountain Finance Corporation, and the Financial Statements
of New Mountain Finance AIV Holdings Corporation (continued)
At December 31, 2010, the Operating Company’s investments consisted of the following:
Investment Cost and Fair Value by Type
|
|
|
|
|
|
|
|
|
| |
|
Cost |
|
|
Fair Value |
|
| First lien |
|
$ |
303,924,269 |
|
|
$ |
321,212,659 |
|
| Second lien |
|
|
90,027,745 |
|
|
|
98,934,554 |
|
| Subordinated |
|
|
19,812,335 |
|
|
|
20,377,764 |
|
| Equity and other |
|
|
544,474 |
|
|
|
532,863 |
|
|
|
|
|
|
|
|
|
|
| Total investments |
|
$ |
414,308,823 |
|
|
$ |
441,057,840 |
|
|
|
|
|
|
|
|
|
|
Investment Cost and Fair Value by Industry
|
|
|
|
|
|
|
|
|
| |
|
Cost |
|
|
Fair Value |
|
| Business Services |
|
$ |
53,482,718 |
|
|
$ |
61,657,732 |
|
| Consumer Services |
|
|
24,665,157 |
|
|
|
25,173,367 |
|
| Education |
|
|
30,015,648 |
|
|
|
31,505,814 |
|
| Energy |
|
|
4,357,151 |
|
|
|
4,746,150 |
|
| Federal Services |
|
|
30,834,041 |
|
|
|
31,796,045 |
|
| Franchises |
|
|
9,091,224 |
|
|
|
9,285,114 |
|
| Healthcare Facilities |
|
|
3,063,441 |
|
|
|
3,594,136 |
|
| Healthcare Information Technology |
|
|
13,790,000 |
|
|
|
13,965,000 |
|
| Healthcare Services |
|
|
88,073,362 |
|
|
|
94,834,674 |
|
| Industrial Services |
|
|
10,245,116 |
|
|
|
10,425,950 |
|
| Information Technology |
|
|
4,854,762 |
|
|
|
4,280,423 |
|
| Logistics |
|
|
5,874,951 |
|
|
|
5,985,000 |
|
| Media |
|
|
11,820,000 |
|
|
|
11,880,000 |
|
| Power Generation |
|
|
8,580,242 |
|
|
|
7,803,431 |
|
| Software |
|
|
103,739,377 |
|
|
|
111,885,004 |
|
| Telecommunication |
|
|
11,821,633 |
|
|
|
12,240,000 |
|
|
|
|
|
|
|
|
|
|
| Total investments |
|
$ |
414,308,823 |
|
|
$ |
441,057,840 |
|
|
|
|
|
|
|
|
|
|
As of December 31, 2011, the Operating Company’s original first lien position in ATI Acquisition Company
was put on non-accrual status due to the inability of the portfolio company to service its interest payment for the quarter then ended. As of December 31, 2011, this first lien debt investment had a cost basis of $4,351,747 and a fair value of
$783,617. Additionally, the Operating Company has two super priority first lien debt investments in ATI Acquisition Company with a combined cost basis and fair value of $1,576,066 as of December 31, 2011. Neither super priority first lien
positions are on non-accrual status. As of December 31, 2011, the Operating Company’s total investment in ATI Acquisition Company had an aggregate cost basis of $5,927,813 and an aggregate fair value of $2,359,683. As of December 31,
2010, the Operating Company did not have any assets being accounted for on a non-accrual basis.
As of December 31, 2011, the
Operating Company had unfunded commitments on revolving credit facilities and bridge facilities of $22,698,500 and $35,000,000, respectively. Additionally, the Operating Company had unfunded commitments in the form of a delayed draw or other future
funding
F-98
Combined Notes to the Consolidated Financial Statements of
New Mountain Finance Holdings, L.L.C.,
the Financial Statements of New Mountain Finance Corporation, and the Financial Statements
of New Mountain Finance AIV Holdings Corporation (continued)
commitments of $4,250,632 as of December 31, 2011. These unfunded commitments are disclosed on the Operating Company’s Consolidated Schedules of Investments as of December 31,
2011.
As of December 31, 2010, the Operating Company’s only unfunded commitments were revolving credit facilities of
$12,198,500. These revolving credit facilities are disclosed on the Operating Company’s Consolidated Schedules of Investments as of December 31, 2010.
Investment Risk Factor—First and second lien debt that the Operating Company invests in is entirely, or almost entirely, rated below investment grade or may be unrated. These loans are considered
speculative because of the credit risk of the issuers. Such issuers are considered more likely than investment grade issuers to default on their payments of interest and principal and such defaults could reduce the net asset value and income
distributions of the Operating Company. First and second lien debt may also lose significant market value before a default occurs. Furthermore, an active trading market may not exist for these first and second lien loans. This illiquidity may make
it more difficult to value the debt.
Subordinated debt is generally subject to similar risks as those associated with first and second
lien debt, except that such debt is subordinated in payment and /or lower in lien priority. Subordinated debt is subject to the additional risk that the cash flow of the borrower and the property securing the debt, if any, may be insufficient to
meet scheduled payments after giving effect to the senior secured and unsecured obligations of the borrower.
Note 4. Fair Value
Fair value is the amount that would be received to sell an asset or paid to transfer a liability in an orderly transaction between market
participants at the measurement date. Accounting Standards Codification 820, Fair Value Measurements and Disclosures (“ASC 820”), establishes a fair value hierarchy that prioritizes and ranks the inputs to valuation techniques
used in measuring investments at fair value. The hierarchy classifies the inputs used in measuring fair value into three levels as follows:
Level I—Quoted prices (unadjusted) are available in active markets for identical investments and the Operating Company has the ability to access such quotes as of the reporting date. The type of
investments which would generally be included in Level I include active exchange-traded equity securities and exchange-traded derivatives. As required by ASC 820, the Operating Company, to the extent that it holds such investments, does not
adjust the quoted price for these investments, even in situations where the Operating Company holds a large position and a sale could reasonably impact the quoted price.
Level II—Pricing inputs are observable for the investments, either directly or indirectly, as of the reporting
date, but are not the same as those used in Level I. Level II inputs include the following:
| |
Ÿ |
|
Quoted prices for similar assets or liabilities in active markets; |
| |
Ÿ |
|
Quoted prices for identical or similar assets or liabilities in non-active markets (examples include corporate and municipal bonds, which trade infrequently);
|
| |
Ÿ |
|
Pricing models whose inputs are observable for substantially the full term of the asset or liability (examples include most over-the-counter derivatives,
including foreign exchange forward contracts); and |
F-99
Combined Notes to the Consolidated Financial Statements of
New Mountain Finance Holdings, L.L.C.,
the Financial Statements of New Mountain Finance Corporation, and the Financial Statements
of New Mountain Finance AIV Holdings Corporation (continued)
| |
Ÿ |
|
Pricing models whose inputs are derived principally from or corroborated by observable market data through correlation or other means for substantially the full
term of the asset or liability. |
Level III—Pricing inputs are unobservable for the
investment and include situations where there is little, if any, market activity for the investment.
The inputs used to measure fair
value may fall into different levels. In all instances when the inputs fall within different levels of the hierarchy, the level within which the fair value measurement is categorized is based on the lowest level of input that is significant to the
fair value measurement in its entirety. As such, a Level III fair value measurement may include inputs that are both observable (Levels I and II) and unobservable (Level III). Gains and losses for such assets categorized within
the Level III table below may include changes in fair value that are attributable to both observable inputs (Levels II and III) and unobservable inputs (Level III).
The inputs into the determination of fair value require significant judgment or estimation by management and consider factors specific to each
investment. A review of the fair value hierarchy classifications is conducted on a quarterly basis. Changes in the observability of valuation inputs may result in the reclassification of certain investments within the fair value hierarchy from
period to period. Reclassifications impacting the fair value hierarchy are reported as transfers in/out of the respective leveling categories as of the beginning of the quarter in which the reclassifications occur.
The following table summarizes the levels in the fair value hierarchy that the Operating Company’s portfolio investments fall into as of
December 31, 2011:
|
|
|
|
|
|
|
|
|
|
|
|
|
|
|
|
|
| |
|
Total |
|
|
Level I |
|
|
Level II |
|
|
Level III |
|
| First lien |
|
$ |
410,313,643 |
|
|
$ |
— |
|
|
$ |
377,172,906 |
|
|
$ |
33,140,737 |
|
| Second lien |
|
|
262,701,495 |
|
|
|
— |
|
|
|
214,296,195 |
|
|
|
48,405,300 |
|
| Subordinated |
|
|
27,648,951 |
|
|
|
— |
|
|
|
21,077,500 |
|
|
|
6,571,451 |
|
| Equity and other |
|
|
2,849,471 |
|
|
|
— |
|
|
|
— |
|
|
|
2,849,471 |
|
|
|
|
|
|
|
|
|
|
|
|
|
|
|
|
|
|
| Total investments |
|
$ |
703,513,560 |
|
|
$ |
— |
|
|
$ |
612,546,601 |
|
|
$ |
90,966,959 |
|
|
|
|
|
|
|
|
|
|
|
|
|
|
|
|
|
|
The following table summarizes the levels in the fair value hierarchy that the Operating Company’s portfolio
investments fall into as of December 31, 2010:
|
|
|
|
|
|
|
|
|
|
|
|
|
|
|
|
|
| |
|
Total |
|
|
Level I |
|
|
Level II |
|
|
Level III |
|
| First lien |
|
$ |
321,212,659 |
|
|
$ |
— |
|
|
$ |
304,237,325 |
|
|
$ |
16,975,334 |
|
| Second lien |
|
|
98,934,554 |
|
|
|
— |
|
|
|
98,934,554 |
|
|
|
— |
|
| Subordinated |
|
|
20,377,764 |
|
|
|
— |
|
|
|
7,630,000 |
|
|
|
12,747,764 |
|
| Equity and other |
|
|
532,863 |
|
|
|
— |
|
|
|
— |
|
|
|
532,863 |
|
|
|
|
|
|
|
|
|
|
|
|
|
|
|
|
|
|
| Total investments |
|
$ |
441,057,840 |
|
|
$ |
— |
|
|
$ |
410,801,879 |
|
|
$ |
30,255,961 |
|
|
|
|
|
|
|
|
|
|
|
|
|
|
|
|
|
|
F-100
Combined Notes to the Consolidated Financial Statements of
New Mountain Finance Holdings, L.L.C.,
the Financial Statements of New Mountain Finance Corporation, and the Financial Statements
of New Mountain Finance AIV Holdings Corporation (continued)
The following table summarizes the changes in fair value of Level III portfolio investments
for the year ended December 31, 2011, as well as the portion of appreciation (depreciation) included in income attributable to unrealized appreciation (depreciation) related to those assets and liabilities still held by the Operating Company at
December 31, 2011:
|
|
|
|
|
|
|
|
|
|
|
|
|
|
|
|
|
|
|
|
|
| |
|
Total |
|
|
First Lien |
|
|
Second Lien |
|
|
Subordinated |
|
|
Equity and
other |
|
| Fair value, December 31, 2010 |
|
$ |
30,255,961 |
|
|
$ |
16,975,334 |
|
|
$ |
— |
|
|
$ |
12,747,764 |
|
|
$ |
532,863 |
|
| Total gains or losses included in earnings: |
|
|
|
|
|
|
|
|
|
|
|
|
|
|
|
|
|
|
|
|
| Realized gains (losses) on investments |
|
|
1,353,118 |
|
|
|
— |
|
|
|
— |
|
|
|
1,353,118 |
|
|
|
— |
|
| Net change in unrealized appreciation (depreciation) |
|
|
(951,089 |
) |
|
|
(910,688 |
) |
|
|
125,000 |
|
|
|
94,341 |
|
|
|
(259,742 |
) |
| Purchases, including capitalized PIK and revolver fundings |
|
|
105,375,018 |
|
|
|
31,503,140 |
|
|
|
67,255,300 |
|
|
|
4,040,228 |
|
|
|
2,576,350 |
|
| Proceeds from sales and paydowns of investments |
|
|
(12,199,593 |
) |
|
|
(535,593 |
) |
|
|
— |
|
|
|
(11,664,000 |
) |
|
|
— |
|
| Transfers into Level III(1) |
|
|
5,833,544 |
|
|
|
808,544 |
|
|
|
5,025,000 |
|
|
|
— |
|
|
|
— |
|
| Transfers out of Level III(1) |
|
|
(38,700,000 |
) |
|
|
(14,700,000 |
) |
|
|
(24,000,000 |
) |
|
|
— |
|
|
|
— |
|
|
|
|
|
|
|
|
|
|
|
|
|
|
|
|
|
|
|
|
|
|
| Fair value, December 31, 2011 |
|
$ |
90,966,959 |
|
|
$ |
33,140,737 |
|
|
$ |
48,405,300 |
|
|
$ |
6,571,451 |
|
|
$ |
2,849,471 |
|
|
|
|
|
|
|
|
|
|
|
|
|
|
|
|
|
|
|
|
|
|
| Unrealized appreciation (depreciation) for the period relating to those Level III assets that were still held by the Operating
Company at the end of the period: |
|
$ |
(1,144,620 |
) |
|
$ |
(910,688 |
) |
|
$ |
125,000 |
|
|
$ |
(99,190 |
) |
|
$ |
(259,742 |
) |
|
|
|
|
|
|
|
|
|
|
|
|
|
|
|
|
|
|
|
|
|
| (1) |
As of December 31, 2011, the portfolio investments were transferred into Level III from Level II and out of Level III into Level II at fair value as of
the beginning of the quarter in which the reclassifications occurred. |
F-101
Combined Notes to the Consolidated Financial Statements of
New Mountain Finance Holdings, L.L.C.,
the Financial Statements of New Mountain Finance Corporation, and the Financial Statements
of New Mountain Finance AIV Holdings Corporation (continued)
The following table summarizes the changes in fair value of Level III portfolio investments
for the year ended December 31, 2010, as well as the portion of appreciation (depreciation) included in income attributable to unrealized appreciation (depreciation) related to those assets and liabilities still held by the Operating Company at
December 31, 2010:
|
|
|
|
|
|
|
|
|
|
|
|
|
|
|
|
|
| |
|
Total |
|
|
First Lien |
|
|
Subordinated |
|
|
Equity and
other |
|
| Fair value, December 31, 2009 |
|
$ |
— |
|
|
$ |
— |
|
|
$ |
— |
|
|
$ |
— |
|
| Total gains or losses included in earnings: |
|
|
|
|
|
|
|
|
|
|
|
|
|
|
|
|
| Net change in unrealized appreciation (depreciation) |
|
|
146,416 |
|
|
|
157,678 |
|
|
|
349 |
|
|
|
(11,611 |
) |
| Purchases, including capitalized PIK(1)(2) |
|
|
30,349,545 |
|
|
|
17,057,656 |
|
|
|
12,747,415 |
|
|
|
544,474 |
|
| Transfers into Level III(3) |
|
|
(240,000 |
) |
|
|
(240,000 |
) |
|
|
— |
|
|
|
— |
|
|
|
|
|
|
|
|
|
|
|
|
|
|
|
|
|
|
| Fair value, December 31, 2010 |
|
$ |
30,255,961 |
|
|
$ |
16,975,334 |
|
|
$ |
12,747,764 |
|
|
$ |
532,863 |
|
|
|
|
|
|
|
|
|
|
|
|
|
|
|
|
|
|
| Unrealized appreciation (depreciation) for the period relating to those Level III assets that were still held by the Operating
Company at the end of the period: |
|
$ |
146,416 |
|
|
$ |
157,678 |
|
|
$ |
349 |
|
|
$ |
(11,611 |
) |
|
|
|
|
|
|
|
|
|
|
|
|
|
|
|
|
|
| (1) |
Includes net amortization of purchase discounts or premiums of approximately $184,263, $36,603, $147,660 and $0, respectively. |
| (2) |
The purchases include the purchase of PODS Holding Funding Corporation at the cost of $8,433,541. In accordance with the Companies’ valuation policy, this asset was
transferred from a Level II investment to a Level III investment during the three months ended September 30, 2010. |
| (3) |
The transfer into Level III represents the transfer of Education Management Corporation at a fair value of ($240,000). In accordance with the Companies’ valuation
policy, this asset was transferred from a Level II investment to a Level III investment during the three months ended December 31, 2010. |
Except as noted in the tables above, there were no other transfers in or out of Level I, II, or III during the years ended December 31, 2011 and December 31, 2010. Transfers into Level III
occurred as quotations obtained through pricing services were not deemed representative of fair value as of the balance sheet date and such assets were internally valued. As quotations obtained through pricing services were substantiated through
additional market sources, investments were transferred out of Level III. The Operating Company invests in revolving credit facilities. These investments are categorized as Level III investments as these assets are not actively traded and
their fair values are often implied by the term loans of the respective portfolio companies.
There were no investments classified as
Level III as of December 31, 2009.
The fair value of other financial assets and liabilities approximates their carrying value
based on the short term nature of these items.
Fair value risk factors—The Operating Company seeks investment
opportunities that offer the possibility of attaining substantial capital appreciation. Certain events particular to each industry in which the Operating Company’s portfolio companies conduct their operations, as well as general
F-102
Combined Notes to the Consolidated Financial Statements of
New Mountain Finance Holdings, L.L.C.,
the Financial Statements of New Mountain Finance Corporation, and the Financial Statements
of New Mountain Finance AIV Holdings Corporation (continued)
economic and political conditions, may have a significant negative impact on the operations and profitability of the Operating Company’s investments and/or on the fair value of the Operating
Company’s investments. The Operating Company’s investments are subject to the risk of non-payment of scheduled interest or principal, resulting in a reduction in income to the Operating Company and thus the income of New Mountain Finance
and AIV Holdings, and their corresponding fair valuations. Also, there may be risk associated with the concentration of investments in one geographic region or in certain industries. These events are beyond the control of the Operating Company and
cannot be predicted. Furthermore, the ability to liquidate investments and realize value is subject to uncertainties.
Note 5. Agreements
On May 19, 2011, New Mountain Finance entered into a joinder agreement with respect to the Limited Liability Company Agreement,
as amended and restated, of the Operating Company pursuant to which New Mountain Finance was admitted as a member of the Operating Company and agreed to acquire from the Operating Company a number of units of the Operating Company equal to the
number of shares of common stock outstanding of New Mountain Finance. Additionally on May 19, 2011, in connection with the contribution by Guardian AIV of its units to AIV Holdings, AIV Holdings entered into a joinder agreement with respect to
the Limited Liability Company Agreement, as amended and restated, of the Operating Company pursuant to which AIV Holdings was also admitted as a member of the Operating Company.
The Operating Company entered into an Investment Management Agreement with the Investment Adviser. Under the Investment Management Agreement, the
Investment Adviser manages the day-to-day operations of, and provides investment advisory services to, the Operating Company. For providing these services, the Investment Adviser receives a fee from the Operating Company, consisting of two
components—a base management fee and an incentive fee.
The base management fee is calculated at an annual rate of 1.75% of the
Operating Company’s gross assets less (i) the borrowings under the SLF Credit Facility (as defined in Note 7, Borrowing Facilities) and (ii) cash and cash equivalents. The base management fee is payable quarterly in
arrears, and is calculated based on the average value of the Operating Company’s gross assets, borrowings under the SLF Credit Facility, and cash and cash equivalents at the end of each of the two most recently completed calendar quarters, and
appropriately adjusted on a pro rata basis for any equity capital raises or repurchases during the current calendar quarter.
The
incentive fee consists of two parts. The first part is calculated and payable quarterly in arrears and equals 20.0% of the Operating Company’s “Pre-Incentive Fee Adjusted Net Investment Income” for the immediately preceding quarter,
subject to a “preferred return”, or “hurdle”, and a “catch-up” feature. “Pre-Incentive Fee Net Investment Income” means interest income, dividend income and any other income (including any other fees (other
than fees for providing managerial assistance), such as commitment, origination, structuring, diligence and consulting fees or other fees that the Operating Company receives from portfolio companies) accrued during the calendar quarter, minus the
Operating Company’s operating expenses for the quarter (including the base management fee, expenses payable under the Administration Agreement, as amended and restated, with the Administrator, and any interest expense and distributions paid on
any issued and outstanding preferred membership units (of which there are none as of December 31, 2011), but excluding the incentive fee). Pre-Incentive Fee Net Investment Income includes, in the case of investments with a deferred interest
feature (such as original
F-103
Combined Notes to the Consolidated Financial Statements of
New Mountain Finance Holdings, L.L.C.,
the Financial Statements of New Mountain Finance Corporation, and the Financial Statements
of New Mountain Finance AIV Holdings Corporation (continued)
issue discount, debt instruments with PIK interest and zero coupon securities), accrued income that the Operating Company has not yet received in cash. Pre-Incentive Fee Net Investment Income
does not include any realized capital gains, realized capital losses or unrealized capital appreciation or depreciation.
Under GAAP,
New Mountain Finance’s IPO did not step-up the cost basis of the Operating Company’s existing investments to fair market value at the IPO date. Since the total value of the Operating Company’s investments at the time of the IPO was
greater than the investments’ cost basis, a larger amount of amortization of purchase or original issue discount, as well as different amounts in realized gain and unrealized appreciation, may be recognized under GAAP in each period than if the
step-up had occurred. This will remain until such predecessor investments are sold or mature in the future. The Operating Company tracks the transferred (or fair market) value of each of its investments as of the time of the IPO and, for purposes of
the incentive fee calculation, adjusts Pre-Incentive Fee Net Investment Income to reflect the amortization of purchase or original issue discount on the Operating Company’s investments as if each investment was purchased at the date of the IPO,
or stepped up to fair market value. This is defined as “Pre-Incentive Fee Adjusted Net Investment Income”. The Operating Company also uses the transferred (or fair market) value of each of its investments as of the time of the IPO to
adjust capital gains (“Adjusted Realized Capital Gains”) or losses (“Adjusted Realized Capital Losses”) and unrealized capital appreciation (“Adjusted Unrealized Capital Appreciation”) and unrealized capital
depreciation (“Adjusted Unrealized Capital Depreciation”).
Pre-Incentive Fee Adjusted Net Investment Income, expressed as a
rate of return on the value of the Operating Company’s net assets at the end of the immediately preceding calendar quarter, will be compared to a “hurdle rate” of 2.0% per quarter (8.0% annualized), subject to a
“catch-up” provision measured as of the end of each calendar quarter. The hurdle rate is appropriately pro-rated for any partial periods. The calculation of the Operating Company’s incentive fee with respect to the Pre-Incentive Fee
Adjusted Net Investment Income for each quarter is as follows:
| |
Ÿ |
|
No incentive fee is payable to the Investment Adviser in any calendar quarter in which the Operating Company’s Pre-Incentive Fee Adjusted Net Investment
Income does not exceed the hurdle rate of 2.0% (the “preferred return” or “hurdle”). |
| |
Ÿ |
|
100.0% of the Operating Company’s Pre-Incentive Fee Adjusted Net Investment Income with respect to that portion of such Pre-Incentive Fee Adjusted Net
Investment Income, if any, that exceeds the hurdle rate but is less than or equal to 2.5% in any calendar quarter (10.0% annualized) is payable to the Investment Adviser. This portion of the Operating Company’s Pre-Incentive Fee Adjusted Net
Investment Income (which exceeds the hurdle rate but is less than or equal to 2.5%) is referred to as the “catch-up”. The catch-up provision is intended to provide the Investment Adviser with an incentive fee of 20.0% on all of the
Operating Company’s Pre-Incentive Fee Adjusted Net Investment Income as if a hurdle rate did not apply when the Operating Company’s Pre-Incentive Fee Adjusted Net Investment Income exceeds 2.5% in any calendar quarter.
|
| |
Ÿ |
|
20.0% of the amount of the Operating Company’s Pre-Incentive Fee Adjusted Net Investment Income, if any, that exceeds 2.5% in any calendar quarter (10.0%
annualized) is payable to the Investment Adviser once the hurdle is reached and the catch-up is achieved. |
The second
part will be determined and payable in arrears as of the end of each calendar year (or upon termination of the Investment Management Agreement) and will equal 20.0% of the Operating
F-104
Combined Notes to the Consolidated Financial Statements of
New Mountain Finance Holdings, L.L.C.,
the Financial Statements of New Mountain Finance Corporation, and the Financial Statements
of New Mountain Finance AIV Holdings Corporation (continued)
Company’s Adjusted Realized Capital Gains, if any, on a cumulative basis from inception through the end of each calendar year, computed net of all Adjusted Realized Capital Losses and
Adjusted Unrealized Capital Depreciation on a cumulative basis, less the aggregate amount of any previously paid capital gain incentive fee.
In accordance with GAAP, NMF Holdings accrues a hypothetical capital gains incentive fee based upon the cumulative net Adjusted Realized Capital Gains and Adjusted Realized Capital Losses and the cumulative net
Adjusted Unrealized Capital Appreciation and Adjusted Unrealized Capital Depreciation on investments held at the end of each period. Actual amounts paid to the Investment Adviser are consistent with the Investment Management Agreement and are based
only on actual Adjusted Realized Capital Gains computed net of all Adjusted Realized Capital Losses and Adjusted Unrealized Capital Depreciation on a cumulative basis from inception through the end of each calendar year. No accrual was required for
the period from May 19, 2011 (effective date of the Investment Management Agreement) to December 31, 2011.
The management fee
and incentive fee incurred by the Operating Company were $4,938,004 and $3,522,330 for the period from May 19, 2011 (effective date of the Investment Management Agreement) to December 31, 2011. The Operating Company’s Consolidated
Statement of Operations below is adjusted as if step-up in cost basis to fair market value had occurred at the IPO date. This statement begins on May 19, 2011, the effective date of the Investment Management Agreement.
The following Statement of Operations for the Operating Company for the period May 19, 2011 (effective date of the Investment Management
Agreement) to December 31, 2011 is adjusted to reflect this step-up to fair market value.
|
|
|
|
|
|
|
|
|
|
|
|
|
| |
|
Period from
May 19, 2011
to December 31,
2011 |
|
|
Adjustments |
|
|
Adjusted
Period from
May 19,
2011
to December 31,
2011 |
|
| Investment income |
|
|
|
|
|
|
|
|
|
|
|
|
| Interest income |
|
$ |
38,836,191 |
|
|
$ |
(2,019,153 |
) |
|
$ |
36,817,038 |
|
| Other income |
|
|
670,318 |
|
|
|
|
|
|
|
670,318 |
|
|
|
|
|
|
|
|
|
|
|
|
|
|
| Total investment income |
|
|
39,506,509 |
|
|
|
(2,019,153 |
) |
|
|
37,487,356 |
|
|
|
|
|
|
|
|
|
|
|
|
|
|
| Total expenses pre-incentive fee |
|
|
11,863,671 |
|
|
|
|
|
|
|
11,863,671 |
|
|
|
|
|
|
|
|
|
|
|
|
|
|
| Pre-Incentive Fee Net Investment Income |
|
|
27,642,838 |
|
|
|
(2,019,153 |
) |
|
|
25,623,685 |
|
|
|
|
|
|
|
|
|
|
|
|
|
|
| Incentive fee |
|
|
3,522,330 |
|
|
|
|
|
|
|
3,522,330 |
|
|
|
|
|
|
|
|
|
|
|
|
|
|
| Post-Incentive Fee Net Investment Income |
|
|
24,120,508 |
|
|
|
(2,019,153 |
) |
|
|
22,101,355 |
|
|
|
|
|
|
|
|
|
|
|
|
|
|
| Realized gain (loss) on investments |
|
|
3,297,896 |
|
|
|
(2,421,518 |
) |
|
|
876,378 |
|
| Net change in unrealized (depreciation) appreciation of investments |
|
|
(15,537,900 |
) |
|
|
4,440,671 |
|
|
|
(11,097,229 |
) |
|
|
|
|
|
|
|
|
|
|
|
|
|
| Net decrease in capital resulting from operations |
|
$ |
11,880,504 |
|
|
|
|
|
|
$ |
11,880,504 |
|
|
|
|
|
|
|
|
|
|
|
|
|
|
The Companies have entered into an Administration Agreement, as amended and restated, with the Administrator under
which the Administrator provides administrative services. The Administrator performs, or oversees the performance of, the Companies’ financial records, prepares reports filed with
F-105
Combined Notes to the Consolidated Financial Statements of
New Mountain Finance Holdings, L.L.C.,
the Financial Statements of New Mountain Finance Corporation, and the Financial Statements
of New Mountain Finance AIV Holdings Corporation (continued)
the Securities and Exchange Commission, generally monitors the payment of the Companies’ expenses, and watches the performance of administrative and professional services rendered by others.
NMF Holdings will reimburse the Administrator for the Companies’ allocable portion of overhead and other expenses incurred by the Administrator in performing its obligations to the Companies under the Administration Agreement, as amended and
restated. Pursuant to the Administration Agreement, as amended and restated, and further restricted by the Operating Company, expenses payable to the Administrator by the Operating Company as well as other direct and indirect expenses (excluding
interest and other credit facility expenses and management and incentive fees) has been capped at $3,000,000 for the time period from April 1, 2011 to March 31, 2012.
The Operating Company incurred $2,185,765 in expenses in excess of the expense cap for the year ended December 31, 2011, of which $369,017 was
receivable from affiliate as of December 31, 2011.
The Companies, the Investment Adviser and the Administrator have also entered
into a Trademark License Agreement, as amended, with New Mountain Capital, L.L.C., pursuant to which New Mountain Capital, L.L.C. has agreed to grant the Companies, the Investment Adviser and the Administrator, a non-exclusive, royalty-free license
to use the New Mountain and the New Mountain Finance names. Under the Trademark License Agreement, as amended, subject to certain conditions, the Companies, the Investment Adviser and the Administrator will have a right to use the New Mountain and
New Mountain Finance names, for so long as the Investment Adviser or one of its affiliates remains the investment adviser of the Operating Company. Other than with respect to this limited license, the Companies, the Investment Adviser and the
Administrator will have no legal right to the New Mountain or the New Mountain Finance names.
AIV Holdings entered into a Registration
Rights Agreement with New Mountain Finance, Steven B. Klinsky (the Chairman of our board of directors), an entity related to Steven B. Klinsky and the Investment Adviser. Subject to several exceptions, AIV Holdings and the Investment Adviser have
the right to require New Mountain Finance to register for public resale under the Securities Act of 1933, as amended (the “Securities Act of 1933”), all registerable securities that are held by any of them and that they request to be
registered. Registerable securities subject to the Registration Rights Agreement are shares of New Mountain Finance’s common stock issued or issuable in exchange for units and any other shares of New Mountain Finance’s common stock held by
AIV Holdings, the Investment Adviser and any of their transferees. The rights under the Registration Rights Agreement can be conditionally exercised by AIV Holdings or the Investment Adviser, meaning that prior to the effectiveness of the
registration statement related to the shares, AIV Holdings or the Investment Adviser can withdraw their request to have the shares registered. AIV Holdings and the Investment Adviser may each assign their rights to any person that acquires
registerable securities subject to the Registration Rights Agreement and who agrees to be bound by the terms of the Registration Rights Agreement. Steven B. Klinsky and a related entity will have the right to “piggyback”, or include their
own registrable securities in such a registration.
AIV Holdings and the Investment Adviser may require New Mountain Finance to use its
reasonable best efforts to register under the Securities Act of 1933 all or any portion of these registerable securities upon a “demand request”. The demand registration rights are subject to certain limitations.
F-106
Combined Notes to the Consolidated Financial Statements of
New Mountain Finance Holdings, L.L.C.,
the Financial Statements of New Mountain Finance Corporation, and the Financial Statements
of New Mountain Finance AIV Holdings Corporation (continued)
The Registration Rights Agreement includes limited blackout and suspension periods. In addition,
AIV Holdings and the Investment Adviser may also require New Mountain Finance to file a shelf registration statement on Form N-2 for the resale of their registerable securities if New Mountain Finance is eligible to use Form N-2 at
that time.
Holders of registerable securities have “piggyback” registration rights, including AIV Holdings, which means that
these holders may include their respective shares in any future registrations of New Mountain Finance’s equity securities, whether or not that registration relates to a primary offering by New Mountain Finance or a secondary offering by or on
behalf of any of New Mountain Finance’s stockholders. AIV Holdings, the Investment Adviser and Steven B. Klinsky (and a related entity) have priority over New Mountain Finance in any registration that is an underwritten offering.
AIV Holdings, the Investment Adviser and Steven B. Klinsky (and a related entity) will be responsible for the expenses of any demand registration
(including underwriters’ discounts or commissions) and their pro-rata share of any “piggyback” registration. New Mountain Finance has agreed to indemnify AIV Holdings, the Investment Adviser and Steven B. Klinsky (and a related
entity) with respect to liabilities resulting from untrue statements or omissions in any registration statement filed pursuant to the Registration Rights Agreement, other than untrue statements or omissions resulting from information furnished to
New Mountain Finance by such parties. AIV Holdings, the Investment Adviser and Steven B. Klinsky (and a related entity) have also agreed to indemnify New Mountain Finance with respect to liabilities resulting from untrue statements or omissions
furnished by them to New Mountain Finance relating to them in any registration statement.
Note 6. Related Parties
The Companies have entered into a number of business relationships with affiliated or related parties. New Mountain Finance and AIV Holdings own all
the outstanding units of the Operating Company. As of December 31, 2011, New Mountain Finance and AIV Holdings own approximately 34.6% and 65.4%, respectively, of the units of NMF Holdings.
NMF Holdings has entered into an Investment Management Agreement with the Investment Adviser, a wholly-owned subsidiary of New Mountain Capital.
Therefore, New Mountain Capital is entitled to any profits earned by the Investment Adviser, which includes any fees payable to the Investment Adviser under the terms of the Investment Management Agreement, less expenses incurred by the Investment
Adviser in performing its services under the Investment Management Agreement.
The Companies have entered into an Administration
Agreement, as amended and restated, with the Administrator, a wholly-owned subsidiary of New Mountain Capital. The Administrator arranges office space for the Companies and provides office equipment and administrative services necessary to conduct
their respective day-to-day operations pursuant to the Administration Agreement, as amended and restated. NMF Holdings reimburses the Administrator for the allocable portion of overhead and other expenses incurred by it in performing its obligations
to the Companies under the Administration Agreement, as amended and restated, including rent, the fees and expenses associated with performing administrative, finance and compliance functions, and the compensation of the Companies’ chief
financial officer and chief compliance officer and their respective staffs.
F-107
Combined Notes to the Consolidated Financial Statements of
New Mountain Finance Holdings, L.L.C.,
the Financial Statements of New Mountain Finance Corporation, and the Financial Statements
of New Mountain Finance AIV Holdings Corporation (continued)
The Companies, the Investment Adviser and the Administrator have entered into a royalty-free
Trademark License Agreement, as amended, with New Mountain Capital, L.L.C., pursuant to which New Mountain Capital, L.L.C. has agreed to grant the Companies, the Investment Adviser and the Administrator, a non-exclusive, royalty-free license to use
the name “New Mountain” and “New Mountain Finance”.
The Companies have adopted a formal code of ethics that governs
the conduct of their respective officers and directors. These officers and directors also remain subject to the duties imposed by the 1940 Act, the Delaware General Corporation Law and the Delaware Limited Liability Company Act.
The Investment Adviser and its affiliates may also manage other funds in the future that may have investment mandates that are similar, in whole
and in part, with NMF Holdings’ investment mandates. The Investment Adviser and its affiliates may determine that an investment is appropriate for NMF Holdings and for one or more of those other funds. In such event, depending on the
availability of such investment and other appropriate factors, the Investment Adviser or its affiliates may determine that the Operating Company should invest side-by-side with one or more other funds. Any such investments will be made only to the
extent permitted by applicable law and interpretive positions of the Securities and Exchange Commission and its staff, and consistent with the Investment Adviser’s allocation procedures.
Concurrently with the IPO, New Mountain Finance sold an additional 2,172,000 shares of its common stock to certain executives and employees of, and
other individuals affiliated with, New Mountain Capital in the Concurrent Private Placement.
Note 7. Borrowing Facilities
Holdings Credit Facility—The Loan and Security Agreement, as amended and restated, dated May 19, 2011 (the “Holdings Credit
Facility”) among NMF Holdings as the Borrower and Collateral Administrator, Wells Fargo Securities, L.L.C. as the Administrative Agent, and Wells Fargo Bank, National Association, as the Collateral Custodian, is structured as a revolving credit
facility and matures on October 21, 2015. The maximum amount of revolving borrowings available under the Holdings Credit Facility is $160,000,000. Under the original terms of the Holdings Credit Facility, the Operating Company is permitted to
borrow up to 45.0% or 25.0% of the purchase price of pledged first lien or non-first lien debt securities, subject to approval by Wells Fargo Bank, National Association. On October 27, 2011, NMF Holdings entered into a second amendment to the
Holdings Credit Facility, which permitted NMF Holdings to borrow up to 67.0% and 45.0% of the purchase price of specified first lien debt securities and specified non-first lien debt securities, respectively, subject to approval by Wells Fargo Bank,
National Association. The credit facility is collateralized by all of the investments of NMF Holdings on an investment by investment basis. All fees associated with the origination or upsizing of the Holdings Credit Facility are capitalized on the
Consolidated Statement of Assets, Liabilities, and Members’ Capital and charged against income as other credit facility expenses over the life of the Holdings Credit Facility. The Holdings Credit Facility contains certain customary affirmative
and negative covenants and events of default, including the occurrence of a change in control. In addition, the Holdings Credit Facility requires the Operating Company to maintain a minimum asset coverage ratio. However, the covenants are generally
not tied to mark to market fluctuations in the prices of our investments, but rather to the performance of the underlying portfolio companies.
F-108
Combined Notes to the Consolidated Financial Statements of
New Mountain Finance Holdings, L.L.C.,
the Financial Statements of New Mountain Finance Corporation, and the Financial Statements
of New Mountain Finance AIV Holdings Corporation (continued)
The Operating Company became a party to the Holdings Credit Facility upon the IPO of New Mountain
Finance. The Holdings Credit Facility amends and restates the credit facility of the Predecessor Entities (the “Predecessor Credit Facility”). The Predecessor Credit Facility consisted of two separate facilities. First, the Loan and
Security Agreement dated October 21, 2009 among New Mountain Guardian (Leveraged), L.L.C. as the Collateral Manager, New Mountain Guardian Debt Funding, L.L.C. as the Borrower, Wells Fargo Securities, L.L.C. as the Administrative Agent, and
Wells Fargo Bank, National Association, as the Collateral Custodian, was structured as a revolving credit facility that matured on October 21, 2014. The maximum amount of revolving borrowings available under this credit facility was
$112,500,000. Second, the Loan and Security Agreement dated November 19, 2009 among New Mountain Guardian Partners (Leveraged), L.L.C as the Collateral Manager, New Mountain Guardian Partners Debt Funding, L.L.C. as the Borrower, Wells Fargo
Securities, L.L.C. as the Administrative Agent, and Wells Fargo Bank, National Association, as the Collateral Custodian, is structured as a revolving credit facility that matures on October 21, 2014. The maximum amount of revolving borrowings
available under this credit facility was $7,500,000.
The Holdings Credit Facility (as well as the Predecessor Credit Facility) bears
interest at a rate of LIBOR plus 3.0% per annum and charges a non-usage fee, based on the unused facility amount multiplied by the Non-Usage Fee Rate (as defined in the credit agreement). Interest expense and non-usage fees were $2,043,267 and
$607,972, respectively, for the year ended December 31, 2011. Interest expense and non-usage fees were $2,248,078 and $320,848, respectively, for the year ended December 31, 2010. Interest expense and non-usage fees were $420,723 and
$51,966, respectively, for the year ended December 31, 2009. The weighted average interest rate for the years ended December 31, 2011, December 31, 2010 and December 31, 2009 was 3.2%, 3.3% and 3.2%, respectively. The average
debt outstanding for the years ended December 31, 2011, December 31, 2010 and December 31, 2009 was $61,560,781, $68,343,217 and $65,014,057, respectively. The outstanding balance as of December 31, 2011, December 31, 2010
and December 31, 2009 was $129,037,813, $59,696,938 and $77,744,675, respectively. As of December 31, 2011 and December 31, 2010, the Operating Company was in compliance with all financial and operational covenants required by the
credit facilities existing on such dates.
SLF Credit Facility—The Operating Company’s senior loan fund’s Loan and
Security Agreement, as amended and restated, dated October 27, 2010 (the “SLF Credit Facility”) among NMF SLF as the Borrower, NMF Holdings as the Collateral Administrator, Wells Fargo Securities, L.L.C. as the Administrative Agent,
and Wells Fargo Bank, National Association, as the Collateral Custodian, is structured as a revolving credit facility and matures on October 27, 2015. The maximum amount of revolving borrowings available under the SLF Credit Facility is
$175,000,000. The SLF Credit Facility is non-recourse to NMF Holdings and is secured by all assets owned by NMF SLF on an investment by investment basis. All fees associated with the origination or upsizing of the SLF Credit Facility are capitalized
on the Consolidated Statement of Assets, Liabilities, and Members’ Capital and charged against income as other credit facility expenses over the life of the SLF Credit Facility. The SLF Credit Facility contains certain customary affirmative and
negative covenants and events of default, including the occurrence of a change in control. The covenants are generally not tied to mark to market fluctuations in the prices of our investments, but rather to the performance of the underlying
portfolio companies.
The SLF Credit Facility permits borrowings of up to 67.0% of the purchase price of pledged debt securities subject
to approval by Wells Fargo Bank, National Association. Due to a fifth amendment to
F-109
Combined Notes to the Consolidated Financial Statements of
New Mountain Finance Holdings, L.L.C.,
the Financial Statements of New Mountain Finance Corporation, and the Financial Statements
of New Mountain Finance AIV Holdings Corporation (continued)
the SLF Credit Facility on October 27, 2011, NMF SLF is no longer restricted from the purchase or sale of loans with an affiliate. Therefore, specified first lien loans can be moved as
collateral between the Holdings Credit Facility and the SLF Credit Facility.
The SLF Credit Facility bears interest at a rate of LIBOR
plus 2.25% per annum. A non-usage fee is paid, based on the unused facility amount multiplied by the Non-Usage Fee Rate (as defined in the credit agreement). Interest expense and non-usage fees were $3,368,867 and $94,500, respectively, for the
year ended December 31, 2011. For the period October 7, 2010 (commencement of NMF SLF operations) through December 31, 2010, interest expense and non-usage fees for the SLF Credit Facility were $127,325 and $66,301, respectively. The
weighted average interest rate for the year ended December 31, 2011 for the facility was 2.5%. The weighted average interest rate for the period October 7, 2010 (commencement of NMF SLF operations) through December 31, 2010 for each
facility was 2.5%. The average debt outstanding for the years ended December 31, 2011 and December 31, 2010 was $133,824,553 and $27,672,121, respectively. The SLF Credit Facility did not exist for the full year ended December 31,
2010 and did not exist in the year ended December 31, 2009. The outstanding balance as of December 31, 2011 and December 31, 2010 was $165,928,000 and $56,936,000, respectively. As of December 31, 2011 and December 31, 2010,
NMF SLF was in compliance with all financial and operational covenants required by the SLF Credit Facility.
Based on a comparison to
similar BDC credit facilities, the terms and conditions of the Holdings Credit Facility and the SLF Credit Facility are representative of market. Additionally, both facilities have recently been amended and restated, and therefore examined by both
the borrower and the lender.
Leverage risk factors—The Operating Company utilizes and may utilize leverage to the
maximum extent permitted by the law for investment and other general business purposes. The Operating Company’s lenders will have fixed dollar claims on certain assets that are superior to the claims of the Operating Company’s unit
holders, and therefore New Mountain Finance’s common stockholders, and the Operating Company would expect such lenders to seek recovery against these assets in the event of a default. The use of leverage also magnifies the potential for gain or
loss on amounts invested. Leverage may magnify interest rate risk (particularly on the Operating Company’s fixed-rate investments), which is the risk that the prices of portfolio investments will fall or rise if market interest rates for those
types of securities rise or fall. As a result, leverage may cause greater changes in the Operating Company’s net asset value. Similarly, leverage may cause a sharper decline in the Operating Company’s income than if the Operating Company
had not borrowed. Such a decline could negatively affect the Operating Company’s ability to make dividend payments to its unit holders. Leverage is generally considered a speculative investment technique. The Operating Company’s ability to
service any debt incurred will depend largely on financial performance and will be subject to prevailing economic conditions and competitive pressures.
Note 8. Regulation
New Mountain
Finance and AIV Holdings intend to elect to be treated, and intend to comply with the requirements to qualify annually, as RICs under Subchapter M of the Code, commencing with the filing of their December 31, 2011 income tax returns. In
order to qualify as RICs, among other things, New Mountain Finance and AIV Holdings are required to timely distribute to their stockholders at least 90.0% of investment company taxable income, as defined by the Code, for each year. New Mountain
Finance and AIV Holdings, among other things, intend to make and continue to make the requisite
F-110
Combined Notes to the Consolidated Financial Statements of
New Mountain Finance Holdings, L.L.C.,
the Financial Statements of New Mountain Finance Corporation, and the Financial Statements
of New Mountain Finance AIV Holdings Corporation (continued)
distributions to their stockholders, which will generally relieve New Mountain Finance and AIV Holdings from U.S. federal, state, and local income taxes (excluding excise taxes which may be
imposed under the Code). However, under certain circumstances, the distributions that the Operating Company makes to its members may not be sufficient for AIV Holdings to satisfy the annual distribution requirement necessary for AIV Holdings to
qualify as a RIC. In that case, it is expected that Guardian AIV would consent to be treated as if it received distributions from AIV Holdings sufficient to satisfy the annual distribution requirement. Guardian AIV would be required to include the
consent dividend in its taxable income as dividend from AIV Holdings, which would result in phantom (i.e., non-cash) taxable income to Guardian AIV.
Additionally as BDCs, the Companies must not acquire any assets other than “qualifying assets” specified in the 1940 Act unless, at the time the acquisition is made, at least 70.0% of its total assets are
qualifying assets (with certain limited exceptions).
Note 9. Commitments and Contingencies
In the normal course of business, the Companies may enter into contracts that contain a variety of representations and warranties and which provide
general indemnifications. The Operating Company may also enter into future funding commitments such as revolving credit facilities, bridge financing commitments, or delayed draw commitments. As of December 31, 2011, NMF Holdings had unfunded
commitments on revolving credit facilities of $22,698,500, outstanding bridge financing commitments of $35,000,000 and other future funding commitments of $4,250,632, all of which are disclosed on NMF Holdings’ Consolidated Schedule of
Investments. As of December 30, 2010, the Operating Company had $12,198,500 in unfunded revolving credit facilities and no other unfunded future funding commitments.
The Operating Company also has revolving borrowings available under the Holdings Credit Facility and the SLF Credit Facility as of December 31, 2011. See Note 7, Borrowing Facilities, for details.
The Operating Company may from time to time enter into financing commitment letters. As of December 31, 2011 and December 31,
2010, the Operating Company did not enter into any commitment letters to purchase debt investments, which could require funding in the future.
Note 10. Distributions
Differences
between taxable income and the results of operations for financial reporting purposes may be permanent or temporary in nature. Permanent differences are reclassified among capital accounts in the financial statements to reflect their tax character.
Differences in classification may also result from the treatment of short-term gains as ordinary income for tax purposes. During the year ended December 31, 2011, New Mountain Finance did not have any reclassifications of amounts for book
purposes arising from permanent book/tax differences. During the year ended December 31, 2011, AIV Holdings had reclassifications of amounts for book purposes arising from permanent book/tax differences related to consent dividends.
|
|
|
|
|
|
|
|
|
| |
|
New Mountain Finance |
|
|
AIV Holdings |
|
| Accumulated net investment income (loss) |
|
$ |
— |
|
|
$ |
(1,535,250 |
) |
| Accumulated net realized gains (losses) on investments |
|
|
— |
|
|
|
— |
|
| Additional paid-in-capital |
|
|
— |
|
|
|
1,535,250 |
|
F-111
Combined Notes to the Consolidated Financial Statements of
New Mountain Finance Holdings, L.L.C.,
the Financial Statements of New Mountain Finance Corporation, and the Financial Statements
of New Mountain Finance AIV Holdings Corporation (continued)
For federal income tax purposes, distributions paid to stockholders of New Mountain Finance and
AIV Holdings are reported as ordinary income, return of capital, long term capital gains or a combination thereof. The tax character of distributions paid by New Mountain Finance and AIV Holdings for the year ended December 31, 2011 were
estimated to be as follows:
|
|
|
|
|
|
|
|
|
| |
|
New Mountain Finance |
|
|
AIV Holdings |
|
| Ordinary income(a) |
|
$ |
8,944,135 |
|
|
$ |
14,694,056 |
|
| Capital gains |
|
|
255,879 |
|
|
|
2,696,811 |
|
| Return of capital |
|
|
— |
|
|
|
— |
|
|
|
|
|
|
|
|
|
|
| Total |
|
$ |
9,200,014 |
|
|
$ |
17,390,867 |
|
| (a) |
Ordinary income is reported on Form 1099-DIV as non-qualified. |
As of December 31, 2011, the costs of investments for New Mountain Finance and AIV Holdings for tax purposes were $144,377,789 and $275,360,096, respectively.
At December 31, 2011, the components of distributable earnings on a tax basis differ from the amounts reflected per New Mountain
Finance’s and AIV Holdings’ respective Statements of Assets and Liabilities by temporary book/tax differences primarily arising from differences between the tax and book basis of New Mountain Finance’s and AIV Holdings’
respective investment in New Mountain Finance Holdings, L.L.C. and undistributed income.
As of December 31, 2011, the components
of accumulated earning/(deficit) on a tax basis were as follows:
|
|
|
|
|
|
|
|
|
| |
|
New Mountain Finance |
|
|
AIV Holdings |
|
| Accumulated capital gain/(losses) |
|
$ |
— |
|
|
$ |
— |
|
| Other temporary differences |
|
|
— |
|
|
|
— |
|
| Undistributed ordinary income |
|
|
65,789 |
|
|
|
1,778,113 |
|
| Unrealized (appreciation)/depreciation |
|
|
822,725 |
|
|
|
(886,315 |
) |
|
|
|
|
|
|
|
|
|
| Components of distributable earnings |
|
$ |
888,514 |
|
|
$ |
891,798 |
|
New Mountain Finance and AIV Holdings are subject to a 4.0% nondeductible federal excise tax on certain
undistributed income unless New Mountain Finance and AIV Holdings distribute, in a timely manner as required by the Code, an amount at least equal to the sum of (1) 98.0% of their respective net ordinary income earned for the calendar year and
(2) 98.2% of their respective capital gain net income for the one-year period ending October 31 in the calendar year. For the year ended December 31, 2011, both New Mountain Finance and AIV Holdings have no accrued estimated excise
taxes.
F-112
Combined Notes to the Consolidated Financial Statements of
New Mountain Finance Holdings, L.L.C.,
the Financial Statements of New Mountain Finance Corporation, and the Financial Statements
of New Mountain Finance AIV Holdings Corporation (continued)
Note 11. Stockholders’ Equity
The table below illustrates the effect of certain transactions on the capital accounts of New Mountain Finance:
|
|
|
|
|
|
|
|
|
|
|
|
|
|
|
|
|
|
|
|
|
|
|
|
|
|
|
|
|
| |
|
Common Stock |
|
|
Paid in
Capital
in Excess
of
Par |
|
|
Dividends
Paid |
|
|
Accumulated
Undistributed
Realized
Gains
|
|
|
Net
Unrealized
Appreciation |
|
|
Total
Stockholders’
Equity |
|
| |
Shares |
|
|
Par
Amount |
|
|
|
|
|
|
| Balance at December 31, 2010 |
|
|
— |
|
|
$ |
— |
|
|
$ |
— |
|
|
$ |
— |
|
|
$ |
— |
|
|
$ |
— |
|
|
$ |
— |
|
| Issuances of common stock in the IPO(1) |
|
|
7,272,727 |
|
|
|
72,727 |
|
|
|
99,927,269 |
|
|
|
— |
|
|
|
— |
|
|
|
— |
|
|
|
99,999,996 |
|
| Issuances of common stock in private placement(2) |
|
|
2,172,000 |
|
|
|
21,720 |
|
|
|
29,843,280 |
|
|
|
— |
|
|
|
— |
|
|
|
— |
|
|
|
29,865,000 |
|
| Issuances of common stock to New Mountain Guardian Partners, L.P.(3) |
|
|
1,252,964 |
|
|
|
12,530 |
|
|
|
18,476,927 |
|
|
|
— |
|
|
|
— |
|
|
|
— |
|
|
|
18,489,457 |
|
| Deferred offering costs allocated from New Mountain Finance Holdings, L.L.C. |
|
|
— |
|
|
|
— |
|
|
|
(3,998,597 |
) |
|
|
— |
|
|
|
— |
|
|
|
— |
|
|
|
(3,998,597 |
) |
| Dividends paid |
|
|
— |
|
|
|
— |
|
|
|
— |
|
|
|
(9,200,014 |
) |
|
|
— |
|
|
|
— |
|
|
|
(9,200,014 |
) |
| Net increase in stockholders’ equity resulting from operations |
|
|
— |
|
|
|
— |
|
|
|
— |
|
|
|
— |
|
|
|
9,486,321 |
|
|
|
844,658 |
|
|
|
10,330,979 |
|
|
|
|
|
|
|
|
|
|
|
|
|
|
|
|
|
|
|
|
|
|
|
|
|
|
|
|
|
|
| Balance at December 31, 2011 |
|
|
10,697,691 |
|
|
$ |
106,977 |
|
|
$ |
144,248,879 |
|
|
$ |
(9,200,014 |
) |
|
$ |
9,486,321 |
|
|
$ |
844,658 |
|
|
$ |
145,486,821 |
|
|
|
|
|
|
|
|
|
|
|
|
|
|
|
|
|
|
|
|
|
|
|
|
|
|
|
|
|
|
| (1) |
On May 19, 2011, New Mountain Finance priced its IPO of 7,272,727 shares of common stock at a public offering price of $13.75 per share. |
| (2) |
Concurrently with the closing of the IPO and at the public offering price of $13.75 per share, New Mountain Finance sold an additional 2,172,000 shares of its common stock to
certain executives and employees of, and other individuals affiliated with, New Mountain Capital in the Concurrent Private Placement. |
| (3) |
On May 19, 2011, New Mountain Finance issued 1,252,964 shares of common stock to New Mountain Guardian Partners, L.P. for their respective ownership interest in the
Predecessor Entities. |
F-113
Combined Notes to the Consolidated Financial Statements of
New Mountain Finance Holdings, L.L.C.,
the Financial Statements of New Mountain Finance Corporation, and the Financial Statements
of New Mountain Finance AIV Holdings Corporation (continued)
The table below illustrates the effect of certain transactions on the capital accounts of AIV
Holdings:
|
|
|
|
|
|
|
|
|
|
|
|
|
|
|
|
|
|
|
|
|
|
|
|
|
|
|
|
|
| |
|
Common Stock |
|
|
Paid in
Capital
in Excess
of Par |
|
|
Dividends
Paid |
|
|
Distributions
in
Excess of Net
Investment
Income and
Realized
Gains |
|
|
Net
Unrealized
Depreciation |
|
|
Total
Stockholders’
Equity |
|
| |
|
Shares |
|
|
Par
Amount |
|
|
|
|
|
|
| Balance at December 31, 2010 |
|
|
— |
|
|
$ |
— |
|
|
$ |
— |
|
|
$ |
— |
|
|
$ |
— |
|
|
$ |
— |
|
|
$ |
— |
|
| Issuances of common stock to New Mountain Guardian AIV, L.P.(1) |
|
|
100 |
|
|
|
1 |
|
|
|
298,406,532 |
|
|
|
— |
|
|
|
— |
|
|
|
— |
|
|
|
298,406,533 |
|
| Deferred offering costs allocated from New Mountain Finance Holdings, L.L.C. |
|
|
— |
|
|
|
— |
|
|
|
(7,558,581 |
) |
|
|
— |
|
|
|
— |
|
|
|
— |
|
|
|
(7,558,581 |
) |
| Dividends paid |
|
|
— |
|
|
|
— |
|
|
|
— |
|
|
|
(17,390,867 |
) |
|
|
— |
|
|
|
— |
|
|
|
(17,390,867 |
) |
| Net increase in stockholders’ equity resulting from operations |
|
|
— |
|
|
|
— |
|
|
|
— |
|
|
|
— |
|
|
|
17,932,083 |
|
|
|
(16,374,171 |
) |
|
|
1,557,912 |
|
| Tax reclassifications related to consent dividends (See Note 10) |
|
|
— |
|
|
|
— |
|
|
|
1,535,250 |
|
|
|
— |
|
|
|
(1,535,250 |
) |
|
|
— |
|
|
|
— |
|
|
|
|
|
|
|
|
|
|
|
|
|
|
|
|
|
|
|
|
|
|
|
|
|
|
|
|
|
|
| Balance at December 31, 2011 |
|
|
100 |
|
|
$ |
1 |
|
|
$ |
292,383,201 |
|
|
$ |
(17,390,867 |
) |
|
$ |
16,396,833 |
|
|
$ |
(16,374,171 |
) |
|
$ |
275,014,997 |
|
|
|
|
|
|
|
|
|
|
|
|
|
|
|
|
|
|
|
|
|
|
|
|
|
|
|
|
|
|
| (1) |
On May 19, 2011, AIV Holdings issued 100 shares of common stock to New Mountain Guardian AIV, L.P. for their respective ownership interest in the Predecessor Entities.
|
Note 12. Earnings Per Share
The following information sets forth the computation of basic and diluted net increase in New Mountain Finance’s net assets per share resulting from operations for the period May 19, 2011 to
December 31, 2011:
|
|
|
|
|
| |
|
May 19, 2011 (commencement
of operations) to December
31,
2011 |
|
| Numerator for basic earnings per share: |
|
$ |
10,330,979 |
|
| Denominator for basic weighted average share: |
|
|
10,697,691 |
|
|
|
|
|
|
| Basic earnings per share: |
|
$ |
0.97 |
|
|
|
|
|
|
| Numerator for diluted earnings per share(a): |
|
$ |
11,880,504 |
|
| Denominator for diluted weighted average share(b): |
|
|
30,919,629 |
|
|
|
|
|
|
| Diluted earnings per share: |
|
$ |
0.38 |
|
|
|
|
|
|
| (a) |
Includes full income at the Operating Company for the period. New Mountain Finance’s unrealized appreciation in the Operating Company resulting from the IPO is netted
against AIV Holdings’ unrealized depreciation in the Operating Company resulting from the IPO. |
| (b) |
Assumes AIV Holdings exchanges its units in the Operating Company for public shares of New Mountain Finance on May 19, 2011 (see Note 1, Formation and Business
Purpose). |
F-114
Combined Notes to the Consolidated Financial Statements of
New Mountain Finance Holdings, L.L.C.,
the Financial Statements of New Mountain Finance Corporation, and the Financial Statements
of New Mountain Finance AIV Holdings Corporation (continued)
Note 13. Financial Highlights
The following information sets forth the financial highlights for the Operating Company for the respective years ended December 31.
|
|
|
|
|
|
|
|
|
|
|
|
|
|
|
|
|
| |
|
Year ended December 31, |
|
|
Period from
October 29, 2008
(commencement of
operations) to
December 31, 2008 |
|
| |
|
2011 |
|
|
2010 |
|
|
2009 |
|
|
| Total return based on net asset value(a) |
|
|
10.09 |
% |
|
|
26.54 |
% |
|
|
76.38 |
% |
|
|
NM |
|
| Average net assets for the period |
|
$ |
361,030,642 |
|
|
$ |
245,951,174 |
|
|
$ |
195,467,257 |
|
|
$ |
7,249,648 |
|
| Ratio to average net assets: |
|
|
|
|
|
|
|
|
|
|
|
|
|
|
|
|
| Net investment income |
|
|
10.67 |
% |
|
|
15.23 |
% |
|
|
10.44 |
% |
|
|
9.44 |
%(b) |
| Total expenses (gross) |
|
|
5.59 |
% |
|
|
1.59 |
% |
|
|
0.72 |
% |
|
|
— |
% |
| Total expenses (net of reimbursable expenses) |
|
|
4.99 |
% |
|
|
1.59 |
% |
|
|
0.72 |
% |
|
|
— |
% |
| Net assets, end of year |
|
$ |
420,501,818 |
|
|
$ |
241,927,261 |
|
|
$ |
239,440,683 |
|
|
$ |
30,353,903 |
|
| Average debt outstanding—Holdings Credit Facility |
|
$ |
61,560,781 |
|
|
$ |
68,343,217 |
|
|
$ |
65,014,057 |
|
|
|
N/A |
|
| Average debt outstanding—SLF Credit Facility |
|
$ |
133,824,553 |
|
|
$ |
27,672,121 |
|
|
|
N/A |
|
|
|
N/A |
|
| Weighted average shares outstanding |
|
|
30,919,629 |
|
|
|
N/A |
|
|
|
N/A |
|
|
|
N/A |
|
| Asset coverage ratio |
|
|
242.56 |
% |
|
|
307.43 |
% |
|
|
407.98 |
% |
|
|
N/A |
|
| Portfolio turnover |
|
|
42.13 |
% |
|
|
76.69 |
% |
|
|
57.50 |
% |
|
|
0.22 |
% |
| (a) |
For the year ended December 31, 2011, total return is calculated in two parts: (1) from the opening of the first day of the year to New Mountain Finance’s IPO
date, total return is calculated based on net income over weighted average net assets and (2) from New Mountain Finance’s IPO date to the last day of the year, total return is calculated assuming a purchase at net asset value on New
Mountain Finance’s IPO date and a sale at net asset value on the last day of the year. Dividends and distributions, if any, are assumed for purposes of this calculation, to be reinvested at the net asset value on the last day of the respective
quarter. For the years ended December 31, 2010 and December 31, 2009, total return is the ratio of net income compared to capital, adjusted for capital contributions and distributions. |
| (b) |
Ratio to average net assets has been annualized. |
NM—Total
return from commencement of operations through December 31, 2008 was deemed not meaningful due to the scaling of operations during this short time period.
N/A—Not applicable.
|
|
|
|
|
| |
|
May 19, 2011 to
December 31,
2011(a) |
|
| Per unit data for the Operating Company: |
|
|
|
|
| Net asset value, May 19, 2011 |
|
$ |
14.08 |
|
| Net investment income |
|
|
0.78 |
|
| Net realized and unrealized loss |
|
|
(0.40 |
) |
| Dividends paid |
|
|
(0.86 |
) |
|
|
|
|
|
| Net decrease in net assets resulting from operations |
|
|
(0.48 |
) |
| Net asset value, December 31, 2011 |
|
$ |
13.60 |
|
|
|
|
|
|
| (a) |
Data presented from May 19, 2011 forward as the Operating Company became unitized on that date, the IPO date. |
F-115
Combined Notes to the Consolidated Financial Statements of
New Mountain Finance Holdings, L.L.C.,
the Financial Statements of New Mountain Finance Corporation, and the Financial Statements
of New Mountain Finance AIV Holdings Corporation (continued)
The following information sets forth the financial highlights for New Mountain Finance for the
period May 19, 2011 to December 31, 2011. The ratios to average net assets have been annualized.
|
|
|
|
|
| |
|
Period ended
December 31,
2011 |
|
| Per share data: |
|
|
|
|
| Net asset value, beginning of period |
|
$ |
13.50 |
|
| Net increase (decrease) in net assets resulting from operations allocated from New Mountain Finance Holdings, L.L.C.: |
|
|
|
|
| Net investment income |
|
|
0.78 |
|
| Net realized and unrealized gain (loss) |
|
|
(0.40 |
) |
|
|
|
|
|
| Total net increase |
|
|
0.38 |
|
| Unrealized appreciation in New Mountain Finance Holdings, L.L.C. resulting from public offering price |
|
|
0.58 |
|
| Dividends paid |
|
|
(0.86 |
) |
|
|
|
|
|
| Net asset value, end of period |
|
$ |
13.60 |
|
|
|
|
|
|
| Per share market value, end of period |
|
$ |
13.41 |
|
|
|
|
|
|
| Total return based on market value(a) |
|
|
4.16 |
% |
| Total return based on net asset value(b) |
|
|
2.82 |
% |
| Average net assets for the period |
|
$ |
147,765,945 |
|
| Ratio to average net assets: |
|
|
|
|
| Total expenses allocated from New Mountain Finance Holdings, L.L.C. |
|
|
5.79 |
% |
| Net investment income allocated from New Mountain Finance Holdings, L.L.C. |
|
|
9.08 |
% |
| (a) |
Total return is calculated assuming a purchase of common stock at IPO and a sale on the closing of the last business day of the period. Dividends and distributions, if any, are
assumed for purposes of this calculation, to be reinvested at prices obtained under New Mountain Finance’s dividend reinvestment plan. |
| (b) |
Total return is calculated assuming a purchase at net asset value on the opening of the first day of the period and a sale at net asset value on the last day of the period.
Dividends and distributions, if any, are assumed for purposes of this calculation, to be reinvested at the net asset value on the last day of the respective quarter. |
The following information sets forth the financial highlights for AIV Holdings for the period May 19, 2011 to December 31, 2011. The
ratios to average net assets have been annualized.
|
|
|
|
|
| |
|
Period Ended
December 31,
2011 |
|
| Total return based on net asset value(a) |
|
|
(5.44 |
)% |
| Average net assets for the period |
|
$ |
279,323,246 |
|
| Ratio to average net assets: |
|
|
|
|
| Total expenses |
|
|
5.79 |
% |
| Net investment income |
|
|
9.08 |
% |
| (a) |
Total return is calculated assuming a purchase at net asset value on the opening of the first day of the period and a sale at net asset value on the last day of the period.
Dividends and distributions, if any, are assumed for purposes of this calculation, to be reinvested at net asset value on the last day of the respective quarter. |
F-116
Combined Notes to the Consolidated Financial Statements of
New Mountain Finance Holdings, L.L.C.,
the Financial Statements of New Mountain Finance Corporation, and the Financial Statements
of New Mountain Finance AIV Holdings Corporation (continued)
Note 14. Selected Quarterly Financial Data (unaudited)
The below selected quarterly financial data is for the Operating Company.
|
|
|
|
|
|
|
|
|
|
|
|
|
|
|
|
|
|
|
|
|
|
|
|
|
|
|
|
|
|
|
|
|
| (in thousands except for per share data) |
|
|
|
|
|
|
|
|
|
|
|
|
| |
|
Investment
Income |
|
|
Net Investment
Income |
|
|
Total Net Realized
Gains and
Net Change
in Unrealized
Appreciation
(Depreciation)
of
Investments |
|
|
Net Increase
(Decrease) in
Capital Resulting
from Operations |
|
| Quarter Ended |
|
Total |
|
|
Per
Unit |
|
|
Total |
|
|
Per
Unit |
|
|
Total |
|
|
Per
Unit |
|
|
Total |
|
|
Per
Unit |
|
| December 31, 2011 |
|
$ |
17,127 |
|
|
$ |
0.55 |
|
|
$ |
9,541 |
|
|
$ |
0.31 |
|
|
$ |
8,316 |
|
|
$ |
0.27 |
|
|
$ |
17,857 |
|
|
$ |
0.58 |
|
| September 30, 2011 |
|
|
15,069 |
|
|
|
0.49 |
|
|
|
10,002 |
|
|
|
0.32 |
|
|
|
(21,255 |
) |
|
|
(0.68 |
) |
|
|
(11,253 |
) |
|
|
(0.36 |
) |
| June 30, 2011 |
|
|
13,116 |
|
|
|
0.42 |
|
|
|
9,554 |
|
|
|
0.31 |
|
|
|
(899 |
) |
|
|
(0.03 |
) |
|
|
8,655 |
|
|
|
0.28 |
|
| March 31, 2011 |
|
|
11,212 |
|
|
|
N/A |
|
|
|
9,429 |
|
|
|
N/A |
|
|
|
6,990 |
|
|
|
N/A |
|
|
|
16,419 |
|
|
|
N/A |
|
|
|
|
|
|
|
|
|
|
| December 31, 2010 |
|
$ |
9,820 |
|
|
|
N/A |
|
|
$ |
8,335 |
|
|
|
N/A |
|
|
$ |
7,978 |
|
|
|
N/A |
|
|
$ |
16,313 |
|
|
|
N/A |
|
| September 30, 2010 |
|
|
13,881 |
|
|
|
N/A |
|
|
|
13,145 |
|
|
|
N/A |
|
|
|
5,560 |
|
|
|
N/A |
|
|
|
18,705 |
|
|
|
N/A |
|
| June 30, 2010 |
|
|
8,597 |
|
|
|
N/A |
|
|
|
7,777 |
|
|
|
N/A |
|
|
|
(5,349 |
) |
|
|
N/A |
|
|
|
2,428 |
|
|
|
N/A |
|
| March 31, 2010 |
|
|
9,077 |
|
|
|
N/A |
|
|
|
8,208 |
|
|
|
N/A |
|
|
|
18,138 |
|
|
|
N/A |
|
|
|
26,346 |
|
|
|
N/A |
|
|
|
|
|
|
|
|
|
|
| December 31, 2009 |
|
$ |
7,617 |
|
|
|
N/A |
|
|
$ |
6,617 |
|
|
|
N/A |
|
|
$ |
1,617 |
|
|
|
N/A |
|
|
$ |
8,234 |
|
|
|
N/A |
|
| September 30, 2009 |
|
|
6,148 |
|
|
|
N/A |
|
|
|
6,030 |
|
|
|
N/A |
|
|
|
33,709 |
|
|
|
N/A |
|
|
|
39,739 |
|
|
|
N/A |
|
| June 30, 2009 |
|
|
5,092 |
|
|
|
N/A |
|
|
|
4,877 |
|
|
|
N/A |
|
|
|
42,562 |
|
|
|
N/A |
|
|
|
47,439 |
|
|
|
N/A |
|
| March 31, 2009 |
|
|
2,910 |
|
|
|
N/A |
|
|
|
2,883 |
|
|
|
N/A |
|
|
|
27,385 |
|
|
|
N/A |
|
|
|
30,268 |
|
|
|
N/A |
|
N/A—Not
applicable, as the Operating Company was not unitized until May 19, 2011.
The below selected quarterly financial data is for New
Mountain Finance.
|
|
|
|
|
|
|
|
|
|
|
|
|
|
|
|
|
|
|
|
|
|
|
|
|
| (in thousands) |
|
|
|
|
|
|
|
|
|
| |
|
Net Investment
Income allocated
from
NMF Holdings |
|
|
Total Net
Realized and
Unrealized
Gains (Losses) |
|
|
Net Increase
(Decrease) in
Capital Resulting
from Operations |
|
| Quarter Ended |
|
Total |
|
|
Per
Unit |
|
|
Total |
|
|
Per
Unit |
|
|
Total |
|
|
Per
Unit |
|
| December 31, 2011 |
|
$ |
3,301 |
|
|
$ |
0.31 |
|
|
$ |
2,877 |
|
|
$ |
0.27 |
|
|
$ |
6,178 |
|
|
$ |
0.58 |
|
| September 30, 2011 |
|
|
3,460 |
|
|
|
0.32 |
|
|
|
(7,353 |
) |
|
|
(0.68 |
) |
|
|
(3,893 |
) |
|
|
(0.36 |
) |
| June 30, 2011 |
|
|
1,584 |
|
|
|
0.15 |
|
|
|
6,462 |
|
|
|
0.60 |
|
|
|
8,046 |
|
|
|
0.75 |
|
| March 31, 2011 |
|
|
N/A |
|
|
|
N/A |
|
|
|
N/A |
|
|
|
N/A |
|
|
|
N/A |
|
|
|
N/A |
|
N/A—Not
applicable, as New Mountain Finance did not commence operations until May 19, 2011.
The below selected quarterly financial data is
for AIV Holdings.
|
|
|
|
|
|
|
|
|
|
|
|
|
| (in thousands) |
|
|
|
|
|
|
|
|
|
| Quarter Ended |
|
Net Investment
Income allocated
from
NMF Holdings |
|
|
Total Net
Realized and
Unrealized
Gains (Losses) |
|
|
Net Increase (Decrease)
in Capital Resulting
from
Operations |
|
| December 31, 2011 |
|
$ |
6,240 |
|
|
$ |
5,439 |
|
|
$ |
11,679 |
|
| September 30, 2011 |
|
|
6,542 |
|
|
|
(13,902 |
) |
|
|
(7,360 |
) |
| June 30, 2011 |
|
|
2,994 |
|
|
|
(5,755 |
) |
|
|
(2,761 |
) |
| March 31, 2011 |
|
|
N/A |
|
|
|
N/A |
|
|
|
N/A |
|
F-117
Combined Notes to the Consolidated Financial Statements of
New Mountain Finance Holdings, L.L.C.,
the Financial Statements of New Mountain Finance Corporation, and the Financial Statements
of New Mountain Finance AIV Holdings Corporation (continued)
N/A—Not applicable, as AIV Holdings did not commence operations until May 19, 2011.
Note 15. Recent Accounting Standards Updates
In May 2011, the Financial Accounting
Standards Board (“FASB”) issued Accounting Standards Update No. 2011-04, Amendments to Achieve Common Fair Value Measurement and Disclosure Requirements in U.S. GAAP and IFRSs (“ASU 2011-04”), which provides
clarification about how to measure fair value and improves comparability of fair value measurements presented and disclosed in accordance with GAAP and International Financial Reporting Standards. The amendments included in ASU 2011-04 clarify the
FASB’s intent about the application of existing fair value measurement and disclosure requirements outlined in ASC 820, as well as include some instances of changes to particular principles or requirements. ASU 2011-04 clarifies that
(i) the concept of the highest and best use valuation premise applies only to nonfinancial assets, (ii) instruments classified in stockholders’ equity should be valued from the perspective of a market participant that holds that
instrument as an asset, and (iii) quantitative information should be disclosed about unobservable inputs used in a fair value measurement that is categorized within Level III of the fair value hierarchy. ASU 2011-04 changes the guidance in
(i) permitting an exception to ASC 820 by allowing an entity to measure the fair value of a group of financial assets and financial liabilities exposed to market and credit risks to be consistent with the entity’s net risk exposures,
instead of gross risk, (ii) applying premiums and discounts in a fair value measurement lacking a Level I inputs to be consistent with the ASC 820 requirements of fair value measurement but that applying premiums and discounts in a fair
value measurement related to size as a characteristic of the holding rather than as a characteristic of the asset or liability is not permitted, and (iii) requiring additional disclosures about fair value measurements categorized within
Level III of the fair value hierarchy, including the valuation processes used and the sensitivity of the fair value measurement to changes in unobservable inputs and the interrelationships between those unobservable inputs. ASU 2011-04 is
effective for the interim and annual periods beginning after December 15, 2011. The Companies are currently assessing the impact that adoption of ASU 2011-04 will have on the financial statements.
Note 16. Subsequent Events
On
February 23, 2012, AIV Holdings’ board of directors and the sole stockholder of AIV Holdings approved an Amended and Restated Certificate of Incorporation of AIV Holdings, which reduced the total amount of shares of all classes of capital
stock which AIV Holdings will have the authority to issue to 100 shares of common stock, par value $0.01 per share.
On March 7,
2012, the Operating Company’s board of directors, and subsequently New Mountain Finance’s board of directors, declared a first quarter 2012 distribution of $0.32 per unit/share payable on March 30, 2012 to holders of record as of
March 15, 2012. As of this record date, New Mountain Finance and AIV Holdings own 10,697,691 units and 20,221,938 units, respectively, of the Operating Company and therefore will receive a total dividend of $3,423,261 and $6,471,020,
respectively. Subsequently, AIV Holdings’ board of directors declared a total dividend of $6,471,020 payable on March 30, 2012 to holders of record as of March 15, 2012.
F-118
3,000,000 Shares
New Mountain Finance Corporation
Common Stock
PRELIMINARY PROSPECTUS
SUPPLEMENT
|
|
|
| Goldman, Sachs & Co. |
|
Wells Fargo Securities |
|
|
| RBC Capital Markets |
|
Stifel Nicolaus Weisel |