Table of Contents
UNITED STATES
SECURITIES AND EXCHANGE COMMISSION
Washington, D.C. 20549
FORM 10-Q
x Quarterly Report Pursuant to Section 13 or 15(d) of the Securities Exchange Act of 1934
For the Quarter Ended June 30, 2012
o Transition Report Pursuant to Section 13 or 15(d) of the Securities Exchange Act of 1934
|
Commission
File Number |
|
Exact name of registrants as specified in their charters, addresses of principal executive
offices, telephone numbers and states or other jurisdictions of incorporation or organization |
|
I.R.S. Employer
Identification Number |
|
814-00839 |
|
New Mountain Finance Holdings, L.L.C.
787 Seventh Avenue, 48th Floor
New York, New York 10019
Telephone: (212) 720-0300
State of Incorporation: Delaware |
|
26-3633318 |
|
814-00832 |
|
New Mountain Finance Corporation
787 Seventh Avenue, 48th Floor
New York, New York 10019
Telephone: (212) 720-0300
State of Incorporation: Delaware |
|
27-2978010 |
|
814-00902 |
|
New Mountain Finance AIV Holdings Corporation
787 Seventh Avenue, 48th Floor
New York, New York 10019
Telephone: (212) 720-0300
State of Incorporation: Delaware |
|
80-0721242 |
Indicate by check mark whether the registrant (1) has filed all reports required to be filed by Section 13 or 15(d) of the Securities Exchange Act of 1934 during the preceding 12 months and (2) has been subject to such filing requirements for the past 90 days.
|
New Mountain Finance Holdings, L.L.C. |
|
Yes x No o |
|
|
|
New Mountain Finance Corporation |
|
Yes x No o |
|
|
|
New Mountain Finance AIV Holdings Corporation |
|
Yes x No o |
|
|
Indicate by check mark whether the registrant has submitted electronically and posted on its corporate Web site, if any, every Interactive Data File required to be submitted and posted pursuant to Rule 405 of Regulation S-T during the preceding 12 months (or for such shorter period that the registrant was required to submit and post such files).
|
New Mountain Finance Holdings, L.L.C. |
|
Yes o No o |
|
|
|
New Mountain Finance Corporation |
|
Yes o No o |
|
|
|
New Mountain Finance AIV Holdings Corporation |
|
Yes o No o |
|
|
Indicate by check mark whether the registrant is a large accelerated filer, an accelerated filer, or a non-accelerated filer. See definition of “accelerated filer and large accelerated filer” in Rule 12b-2 of the Exchange Act. (Check one):
|
New Mountain Finance Holdings, L.L.C. |
|
Large accelerated filer o |
|
Accelerated filer o |
|
|
|
Non-accelerated filer x |
|
Smaller reporting company o |
|
New Mountain Finance Corporation |
|
Large accelerated filer o |
|
Accelerated filer o |
|
|
|
Non-accelerated filer x |
|
Smaller reporting company o |
|
New Mountain Finance AIV Holdings Corporation |
|
Large accelerated filer o |
|
Accelerated filer o |
|
|
|
Non-accelerated filer x |
|
Smaller reporting company o |
Indicate by check mark whether the registrant is a shell company (as defined in Rule 12b-2 of the Exchange Act).
|
New Mountain Finance Holdings, L.L.C. |
|
Yes o No x |
|
|
|
New Mountain Finance Corporation |
|
Yes o No x |
|
|
|
New Mountain Finance AIV Holdings Corporation |
|
Yes o No x |
|
|
|
Registrants |
|
Description |
|
Shares / Units as of August 8, 2012 |
|
New Mountain Finance Holdings, L.L.C. |
|
Common membership units |
|
30,919,629 |
|
New Mountain Finance Corporation |
|
Common stock, $0.01 par value |
|
10,697,691 |
|
New Mountain Finance AIV Holdings Corporation |
|
Common stock, $0.01 par value |
|
100 |
This combined Form 10-Q is filed separately by three registrants: New Mountain Finance Holdings, L.L.C., New Mountain Finance Corporation and New Mountain Finance AIV Holdings Corporation (collectively, the “New Mountain Finance Registrant(s)” or the “Registrant(s)”). Information contained herein relating to any New Mountain Finance Registrant is filed by such registrant solely on its own behalf. Each New Mountain Finance Registrant makes no representation as to information relating exclusively to the other registrants.
Table of Contents
FORM 10-Q FOR THE QUARTER ENDED JUNE 30, 2012
TABLE OF CONTENTS
|
|
|
PAGE |
|
|
|
|
|
PART I. FINANCIAL INFORMATION |
2 |
|
|
|
|
|
Item 1. |
Financial Statements |
2 |
|
|
|
|
|
|
New Mountain Finance Holdings, L.L.C. |
|
|
|
Consolidated Statements of Assets, Liabilities and Members’ Capital as of June 30, 2012 (unaudited) and December 31, 2011 |
2 |
|
|
Consolidated Statements of Operations for the three months and six months ended June 30, 2012 (unaudited) and June 30, 2011 (unaudited) |
3 |
|
|
Consolidated Statements of Changes in Members’ Capital for the six months ended June 30, 2012 (unaudited) and June 30, 2011 (unaudited) |
4 |
|
|
Consolidated Statements of Cash Flows for the six months ended June 30, 2012 (unaudited) and June 30, 2011 (unaudited) |
5 |
|
|
Consolidated Schedule of Investments as of June 30, 2012 (unaudited) |
6 |
|
|
Consolidated Schedule of Investments as of December 31, 2011 |
12 |
|
|
New Mountain Finance Corporation |
|
|
|
Statement of Assets and Liabilities as of June 30, 2012 (unaudited) and December 31, 2011 |
18 |
|
|
Statements of Operations for the three months and six months ended June 30, 2012 (unaudited) and from May 19, 2011 (commencement of operations) to June 30, 2011 (unaudited) |
19 |
|
|
Statement of Changes in Net Assets for the six months ended June 30, 2012 (unaudited) and from May 19, 2011 (commencement of operations) to June 30, 2011 (unaudited) |
20 |
|
|
Statement of Cash Flows for the six months ended June 30, 2012 (unaudited) and from May 19, 2011 (commencement of operations) to June 30, 2011 (unaudited) |
21 |
|
|
New Mountain Finance AIV Holdings Corporation |
|
|
|
Statement of Assets and Liabilities as of June 30, 2012 (unaudited) and December 31, 2011 |
22 |
|
|
Statements of Operations for the three months and six months ended June 30, 2012 (unaudited) and from May 19, 2011 (commencement of operations) to June 30, 2011 (unaudited) |
23 |
|
|
Statement of Changes in Net Assets for the six months ended June 30, 2012 (unaudited) and from May 19, 2011 (commencement of operations) to June 30, 2011 (unaudited) |
24 |
|
|
Statement of Cash Flows for the six months ended June 30, 2012 (unaudited) and from May 19, 2011 (commencement of operations) to June 30, 2011 (unaudited) |
25 |
|
|
|
|
|
|
Combined Notes to the Financial Statements for New Mountain Finance Holdings, L.L.C., New Mountain Finance Corporation and New Mountain Finance AIV Holdings Corporation |
26 |
|
|
|
|
|
|
Report of Independent Registered Public Accounting Firm |
49 |
|
|
|
|
|
Item 2. |
Management’s Discussion and Analysis of Financial Condition and Results of Operations |
50 |
|
Item 3. |
Quantitative and Qualitative Disclosures About Market Risk |
67 |
|
Item 4. |
Controls and Procedures |
68 |
|
|
|
|
|
PART II. OTHER INFORMATION |
69 |
|
|
|
|
|
Item 1. |
Legal Proceedings |
69 |
|
Item 1A. |
Risk Factors |
69 |
|
Item 2. |
Unregistered Sales of Equity Securities and Use of Proceeds |
69 |
|
Item 3. |
Defaults upon Senior Securities |
69 |
|
Item 4. |
Mine Safety Disclosures |
69 |
|
Item 5. |
Other Information |
69 |
|
Item 6. |
Exhibits |
70 |
|
|
Signatures |
74 |
1
Table of Contents
PART I. FINANCIAL INFORMATION
Item 1. Financial Statements
New Mountain Finance Holdings, L.L.C.
Consolidated Statements of Assets, Liabilities and Members’ Capital
|
|
|
June 30, 2012 |
|
December 31, 2011 |
|
|
|
|
(unaudited) |
|
|
|
|
Assets |
|
|
|
|
|
|
Investments at fair value (cost of $747,213,642 and $699,864,784, respectively) |
|
$ |
751,078,894 |
|
$ |
703,513,560 |
|
|
Cash and cash equivalents |
|
9,508,403 |
|
15,318,811 |
|
|
Interest receivable |
|
7,045,804 |
|
7,307,092 |
|
|
Deferred credit facility costs (net of accumulated amortization of $1,367,025 and $855,955, respectively) |
|
4,938,821 |
|
3,713,739 |
|
|
Deferred offering costs |
|
187,359 |
|
— |
|
|
Receivable from affiliate |
|
118,853 |
|
369,017 |
|
|
Other assets |
|
795,788 |
|
356,486 |
|
|
Total assets |
|
$ |
773,673,922 |
|
$ |
730,578,705 |
|
|
Liabilities |
|
|
|
|
|
|
SLF Credit Facility |
|
173,112,281 |
|
165,928,000 |
|
|
Holdings Credit Facility |
|
138,756,913 |
|
129,037,813 |
|
|
Payable for unsettled securities purchased |
|
19,200,000 |
|
7,604,931 |
|
|
Dividends payable |
|
6,875,459 |
|
— |
|
|
Incentive fee payable |
|
3,682,368 |
|
2,317,328 |
|
|
Management fee payable |
|
2,605,561 |
|
2,200,354 |
|
|
Interest payable |
|
571,386 |
|
1,747,095 |
|
|
Other liabilities |
|
1,135,145 |
|
1,241,366 |
|
|
Total liabilities |
|
345,939,113 |
|
310,076,887 |
|
|
Members’ Capital |
|
427,734,809 |
|
420,501,818 |
|
|
Total liabilities and members’ capital |
|
$ |
773,673,922 |
|
$ |
730,578,705 |
|
|
Outstanding common membership units |
|
30,919,629 |
|
30,919,629 |
|
|
Capital per unit |
|
$ |
13.83 |
|
$ |
13.60 |
|
The accompanying notes are an integral part of these consolidated financial statements.
2
Table of Contents
New Mountain Finance Holdings, L.L.C.
Consolidated Statements of Operations
(unaudited)
|
|
|
Three months ended |
|
Six months ended |
|
|
|
|
June 30, 2012 |
|
June 30, 2011 |
|
June 30, 2012 |
|
June 30, 2011 |
|
|
Investment income |
|
|
|
|
|
|
|
|
|
|
|
|
|
|
|
|
|
|
|
|
|
Interest income |
|
$ |
20,124,043 |
|
$ |
12,810,147 |
|
$ |
38,725,226 |
|
$ |
23,978,194 |
|
|
Other income |
|
174,980 |
|
306,144 |
|
595,798 |
|
349,817 |
|
|
Total investment income |
|
20,299,023 |
|
13,116,291 |
|
39,321,024 |
|
24,328,011 |
|
|
|
|
|
|
|
|
|
|
|
|
|
Expenses |
|
|
|
|
|
|
|
|
|
|
|
|
|
|
|
|
|
|
|
|
|
Incentive fee |
|
2,771,189 |
|
504,393 |
|
6,132,652 |
|
504,393 |
|
|
Management fee |
|
2,605,561 |
|
773,509 |
|
5,119,857 |
|
807,509 |
|
|
Interest and other credit facility expenses |
|
2,401,028 |
|
1,534,147 |
|
4,884,317 |
|
3,080,900 |
|
|
Professional fees (net of reimbursable expenses of $118,853, $130,186, $364,862 and $130,186, respectively) |
|
307,535 |
|
516,678 |
|
509,373 |
|
569,834 |
|
|
Administrative expenses (net of reimbursable expenses of $279,048, $180,255, $582,843 and $180,255, respectively) |
|
224,875 |
|
62,610 |
|
476,744 |
|
203,418 |
|
|
Other general and administrative expenses |
|
342,590 |
|
170,712 |
|
638,883 |
|
178,568 |
|
|
Total expenses |
|
8,652,778 |
|
3,562,049 |
|
17,761,826 |
|
5,344,622 |
|
|
Net investment income |
|
11,646,245 |
|
9,554,242 |
|
21,559,198 |
|
18,983,389 |
|
|
|
|
|
|
|
|
|
|
|
|
|
Net realized gains on investments |
|
11,968,454 |
|
6,659,833 |
|
12,975,787 |
|
12,552,163 |
|
|
Net change in unrealized (depreciation) appreciation of investments |
|
(12,529,939 |
) |
(7,559,450 |
) |
216,476 |
|
(6,462,113 |
) |
|
Net increase in capital resulting from operations |
|
$ |
11,084,760 |
|
$ |
8,654,625 |
|
$ |
34,751,461 |
|
$ |
25,073,439 |
|
The accompanying notes are an integral part of these consolidated financial statements.
3
Table of Contents
New Mountain Finance Holdings, L.L.C.
Consolidated Statements of Changes in Members’ Capital
(unaudited)
|
|
|
Six months ended |
|
|
|
|
June 30, 2012 |
|
June 30, 2011 |
|
|
Increase (decrease) in members’ capital resulting from operations: |
|
|
|
|
|
|
Net investment income |
|
$ |
21,559,198 |
|
$ |
18,983,389 |
|
|
Net realized gains on investments |
|
12,975,787 |
|
12,552,163 |
|
|
Net change in unrealized appreciation (depreciation) of investments |
|
216,476 |
|
(6,462,113 |
) |
|
Net increase in members’ capital resulting from operations |
|
34,751,461 |
|
25,073,439 |
|
|
Distributions |
|
— |
|
(10,249,155 |
) |
|
Contributions |
|
— |
|
195,294,674 |
|
|
Dividends declared |
|
(27,518,470 |
) |
— |
|
|
Offering costs |
|
— |
|
(11,440,923 |
) |
|
Net increase in members’ capital |
|
7,232,991 |
|
198,678,035 |
|
|
Members’ capital at beginning of period |
|
420,501,818 |
|
241,927,261 |
|
|
Members’ capital at end of period |
|
$ |
427,734,809 |
|
$ |
440,605,296 |
|
The accompanying notes are an integral part of these consolidated financial statements.
4
Table of Contents
New Mountain Finance Holdings, L.L.C.
Consolidated Statements of Cash Flows
(unaudited)
|
|
|
Six months ended |
|
|
|
|
June 30, 2012 |
|
June 30, 2011 |
|
|
Cash flows from operating activities |
|
|
|
|
|
|
Net increase in capital resulting from operations |
|
$ |
34,751,461 |
|
$ |
25,073,439 |
|
|
Adjustments to reconcile net (increase) decrease in capital resulting from operations to net cash (used in) provided by operating activities: |
|
|
|
|
|
|
Net realized gains on investments |
|
(12,975,787 |
) |
(12,552,163 |
) |
|
Net change in unrealized (appreciation) depreciation of investments |
|
(216,476 |
) |
6,462,113 |
|
|
Amortization of purchase discount |
|
(3,006,326 |
) |
(3,401,906 |
) |
|
Amortization of deferred credit facility costs |
|
511,070 |
|
311,283 |
|
|
Non-cash interest income |
|
(715,298 |
) |
(727,135 |
) |
|
(Increase) decrease in operating assets: |
|
|
|
|
|
|
Purchase of investments |
|
(233,117,132 |
) |
(245,993,220 |
) |
|
Proceeds from sales and paydowns of investments |
|
203,830,686 |
|
152,208,584 |
|
|
Cash received for purchase of undrawn portion of revolving credit facility |
|
— |
|
1,260,000 |
|
|
Cash paid for drawn revolvers |
|
(7,665,000 |
) |
(535,593 |
) |
|
Cash repayments on drawn revolvers |
|
6,300,000 |
|
— |
|
|
Interest receivable |
|
261,288 |
|
(1,038,712 |
) |
|
Receivable from affiliate |
|
250,164 |
|
— |
|
|
Other assets |
|
(439,302 |
) |
(754,525 |
) |
|
Increase (decrease) in operating liabilities: |
|
|
|
|
|
|
Payable for unsettled securities purchased |
|
11,595,069 |
|
(71,576,780 |
) |
|
Incentive fee payable |
|
1,365,040 |
|
504,393 |
|
|
Management fee payable |
|
405,207 |
|
807,509 |
|
|
Interest payable |
|
(1,175,709 |
) |
279,149 |
|
|
Payable to affiliates |
|
— |
|
(202,180 |
) |
|
Other liabilities |
|
(61,335 |
) |
(326,040 |
) |
|
Net cash flows (used in) provided by operating activities |
|
(102,380 |
) |
(150,201,784 |
) |
|
Cash flows from financing activities |
|
|
|
|
|
|
Contributions |
|
— |
|
195,294,674 |
|
|
Distributions |
|
— |
|
(10,249,155 |
) |
|
Dividends paid |
|
(20,643,011 |
) |
— |
|
|
Offering costs paid |
|
(101,299 |
) |
(8,344,393 |
) |
|
Proceeds from Holdings Credit Facility |
|
177,618,025 |
|
63,281,605 |
|
|
Repayment of Holdings Credit Facility |
|
(167,898,925 |
) |
(88,678,542 |
) |
|
Proceeds from SLF Credit Facility |
|
46,943,332 |
|
92,043,800 |
|
|
Repayment of SLF Credit Facility |
|
(39,759,051 |
) |
(22,062,352 |
) |
|
Deferred credit facility costs paid |
|
(1,867,099 |
) |
(3,977,249 |
) |
|
Net cash flows (used in) provided by financing activities |
|
(5,708,028 |
) |
217,308,388 |
|
|
Net (decrease) increase in cash and cash equivalents |
|
(5,810,408 |
) |
67,106,604 |
|
|
Cash and cash equivalents at the beginning of the period |
|
15,318,811 |
|
10,744,082 |
|
|
Cash and cash equivalents at the end of the period |
|
$ |
9,508,403 |
|
$ |
77,850,686 |
|
|
Supplemental disclosure of cash flow information |
|
|
|
|
|
|
Interest paid |
|
$ |
5,323,912 |
|
$ |
1,962,278 |
|
|
Non-cash financing activities: |
|
|
|
|
|
|
Dividends declared and payable |
|
$ |
6,875,459 |
|
$ |
— |
|
|
Accrual for offering costs |
|
86,060 |
|
3,096,530 |
|
|
Accrual for deferred credit facility costs |
|
61,153 |
|
— |
|
The accompanying notes are an integral part of these consolidated financial statements.
5
Table of Contents
New Mountain Finance Holdings, L.L.C.
Consolidated Schedule of Investments
June 30, 2012
(unaudited)
|
Portfolio Company, Location and
Industry |
|
Type of
Investment |
|
Interest Rate |
|
Maturity
Date |
|
Principal
Amount,
Par Value
or Shares |
|
Cost |
|
Fair
Value |
|
Percent of
Members’
Capital |
|
|
|
|
|
|
|
|
|
|
|
|
|
|
|
|
|
|
|
Funded Debt Investments—United Kingdom |
|
|
|
|
|
|
|
|
|
|
|
|
|
|
|
|
Magic Newco, LLC** |
|
|
|
|
|
|
|
|
|
|
|
|
|
|
|
|
Software |
|
First lien (3) |
|
7.25% (Base Rate + 6.00%) |
|
12/12/2018 |
|
$ |
15,000,000 |
|
$ |
14,552,352 |
|
$ |
14,722,500 |
|
3.44 |
% |
|
|
|
|
|
|
|
|
|
|
|
|
|
|
|
|
|
|
Total Funded Debt Investments—United Kingdom |
|
|
|
|
|
|
|
$ |
15,000,000 |
|
$ |
14,552,352 |
|
$ |
14,722,500 |
|
3.44 |
% |
|
|
|
|
|
|
|
|
|
|
|
|
|
|
|
|
|
|
Funded Debt Investments—United States |
|
|
|
|
|
|
|
|
|
|
|
|
|
|
|
|
Plato, Inc. (Archipelago Learning, Inc.) |
|
|
|
|
|
|
|
|
|
|
|
|
|
|
|
|
Education |
|
First lien (3) |
|
7.50% (Base Rate + 6.00%) |
|
5/17/2018 |
|
$ |
12,000,000 |
|
$ |
11,646,435 |
|
$ |
11,962,500 |
|
|
|
|
|
|
Second lien (2) |
|
11.25% (Base Rate + 9.75%) |
|
5/17/2019 |
|
25,000,000 |
|
24,505,115 |
|
24,703,125 |
|
|
|
|
|
|
|
|
|
|
|
|
37,000,000 |
|
36,151,550 |
|
36,665,625 |
|
8.57 |
% |
|
|
|
|
|
|
|
|
|
|
|
|
|
|
|
|
|
|
Meritas Schools Holdings, LLC |
|
|
|
|
|
|
|
|
|
|
|
|
|
|
|
|
Education |
|
First lien (3) |
|
7.50% (Base Rate + 6.00%) |
|
7/29/2017 |
|
9,000,000 |
|
8,920,755 |
|
8,977,500 |
|
|
|
|
|
|
Second lien (2) |
|
11.50% (Base Rate + 10.00%) |
|
1/29/2018 |
|
20,000,000 |
|
19,729,250 |
|
20,050,000 |
|
|
|
|
|
|
|
|
|
|
|
|
29,000,000 |
|
28,650,005 |
|
29,027,500 |
|
6.79 |
% |
|
|
|
|
|
|
|
|
|
|
|
|
|
|
|
|
|
|
Global Knowledge Training LLC |
|
|
|
|
|
|
|
|
|
|
|
|
|
|
|
|
Education |
|
First lien (3) |
|
6.50% (Base Rate + 4.99%) |
|
4/21/2017 |
|
4,837,224 |
|
4,772,210 |
|
4,764,666 |
|
|
|
|
|
|
Second lien (2) |
|
11.50% (Base Rate + 9.75%) |
|
10/21/2018 |
|
24,250,000 |
|
23,788,152 |
|
23,755,300 |
|
|
|
|
|
|
|
|
|
|
|
|
29,087,224 |
|
28,560,362 |
|
28,519,966 |
|
6.67 |
% |
|
|
|
|
|
|
|
|
|
|
|
|
|
|
|
|
|
|
Managed Health Care Associates, Inc. |
|
|
|
|
|
|
|
|
|
|
|
|
|
|
|
|
Healthcare Services |
|
First lien (2) |
|
3.50% (Base Rate + 3.25%) |
|
8/1/2014 |
|
14,755,543 |
|
12,784,371 |
|
14,275,988 |
|
|
|
|
|
|
Second lien (2) |
|
6.75% (Base Rate + 6.50%) |
|
2/1/2015 |
|
15,000,000 |
|
12,354,185 |
|
13,950,000 |
|
|
|
|
|
|
|
|
|
|
|
|
29,755,543 |
|
25,138,556 |
|
28,225,988 |
|
6.60 |
% |
|
|
|
|
|
|
|
|
|
|
|
|
|
|
|
|
|
|
Novell, Inc. (fka Attachmate Corporation, NetIQ Corporation) |
|
|
|
|
|
|
|
|
|
|
|
|
|
|
|
|
Software |
|
First lien (3) |
|
7.25% (Base Rate + 5.75%) |
|
11/22/2017 |
|
8,000,000 |
|
7,842,359 |
|
7,916,000 |
|
|
|
|
|
|
Second lien (2) |
|
11.00% (Base Rate + 9.50%) |
|
11/22/2018 |
|
20,000,000 |
|
19,406,247 |
|
19,587,500 |
|
|
|
|
|
|
|
|
|
|
|
|
28,000,000 |
|
27,248,606 |
|
27,503,500 |
|
6.43 |
% |
|
|
|
|
|
|
|
|
|
|
|
|
|
|
|
|
|
|
Insight Pharmaceuticals LLC |
|
|
|
|
|
|
|
|
|
|
|
|
|
|
|
|
Healthcare Products |
|
Second lien (2) |
|
13.25% (Base Rate + 11.75%) |
|
8/25/2017 |
|
25,000,000 |
|
24,095,068 |
|
24,625,000 |
|
5.76 |
% |
|
|
|
|
|
|
|
|
|
|
|
|
|
|
|
|
|
|
Unitek Global Services, Inc. |
|
|
|
|
|
|
|
|
|
|
|
|
|
|
|
|
Business Services |
|
First lien (2) |
|
9.00% (Base Rate + 7.50%) |
|
4/15/2018 |
|
19,800,000 |
|
19,306,272 |
|
19,354,500 |
|
|
|
|
|
|
First lien (2) |
|
9.00% (Base Rate + 7.50%) |
|
4/15/2018 |
|
5,000,000 |
|
4,803,707 |
|
4,887,500 |
|
|
|
|
|
|
|
|
|
|
|
|
24,800,000 |
|
24,109,979 |
|
24,242,000 |
|
5.67 |
% |
|
|
|
|
|
|
|
|
|
|
|
|
|
|
|
|
|
|
Renaissance Learning, Inc. |
|
|
|
|
|
|
|
|
|
|
|
|
|
|
|
|
Education |
|
Second lien (2) |
|
12.00% (Base Rate + 10.50%) |
|
10/19/2018 |
|
20,000,000 |
|
19,063,864 |
|
20,100,000 |
|
4.70 |
% |
|
|
|
|
|
|
|
|
|
|
|
|
|
|
|
|
|
|
Learning Care Group (US), Inc. |
|
|
|
|
|
|
|
|
|
|
|
|
|
|
|
|
Education |
|
First lien (2) |
|
12.00% |
|
4/27/2016 |
|
17,368,421 |
|
17,144,523 |
|
16,695,606 |
|
|
|
|
|
|
Subordinated (2) |
|
15.00% PIK* |
|
6/30/2016 |
|
3,518,479 |
|
3,354,963 |
|
3,194,889 |
|
|
|
|
|
|
|
|
|
|
|
|
20,886,900 |
|
20,499,486 |
|
19,890,495 |
|
4.65 |
% |
|
|
|
|
|
|
|
|
|
|
|
|
|
|
|
|
|
|
U.S. Healthworks Holding Company, Inc. |
|
|
|
|
|
|
|
|
|
|
|
|
|
|
|
|
Healthcare Services |
|
Second lien (2) |
|
10.50% (Base Rate + 9.00%) |
|
6/15/2017 |
|
20,000,000 |
|
19,738,856 |
|
19,700,000 |
|
4.60 |
% |
|
|
|
|
|
|
|
|
|
|
|
|
|
|
|
|
|
|
Transplace Texas, L.P. |
|
|
|
|
|
|
|
|
|
|
|
|
|
|
|
|
Logistics |
|
Second lien (2) |
|
11.00% (Base Rate + 9.00%) |
|
4/12/2017 |
|
20,000,000 |
|
19,549,196 |
|
19,500,000 |
|
4.56 |
% |
|
|
|
|
|
|
|
|
|
|
|
|
|
|
|
|
|
|
eResearchTechnology, Inc. |
|
|
|
|
|
|
|
|
|
|
|
|
|
|
|
|
Healthcare Services |
|
First lien (2) |
|
8.00% (Base Rate + 6.50%) |
|
5/2/2018 |
|
20,000,000 |
|
19,200,000 |
|
19,200,000 |
|
4.49 |
% |
|
|
|
|
|
|
|
|
|
|
|
|
|
|
|
|
|
|
Ipreo Holdings LLC |
|
|
|
|
|
|
|
|
|
|
|
|
|
|
|
|
Information Services |
|
First lien (3) |
|
8.00% (Base Rate + 6.50%) |
|
8/5/2017 |
|
18,609,375 |
|
18,244,485 |
|
18,562,852 |
|
4.34 |
% |
The accompanying notes are an integral part of these consolidated financial statements.
6
Table of Contents
New Mountain Finance Holdings, L.L.C.
Consolidated Schedule of Investments (continued)
June 30, 2012
(unaudited)
|
Portfolio Company, Location and
Industry |
|
Type of
Investment |
|
Interest Rate |
|
Maturity
Date |
|
Principal
Amount,
Par Value
or Shares |
|
Cost |
|
Fair
Value |
|
Percent of
Members’
Capital |
|
|
|
|
|
|
|
|
|
|
|
|
|
|
|
|
|
|
|
NEWAsurion Corporation (6) |
|
|
|
|
|
|
|
|
|
|
|
|
|
|
|
|
Business Services |
|
|
|
|
|
|
|
|
|
|
|
|
|
|
|
|
Asurion, LLC (fka Asurion Corporation) |
|
Second lien (2) |
|
9.00% (Base Rate + 7.50%) |
|
5/24/2019 |
|
$ |
5,000,000 |
|
$ |
4,978,378 |
|
$ |
5,128,125 |
|
|
|
|
Lonestar Intermediate Super Holdings, LLC |
|
Subordinated (2) |
|
11.00% (Base Rate + 9.50%) |
|
9/2/2019 |
|
12,000,000 |
|
11,649,756 |
|
12,342,000 |
|
|
|
|
|
|
|
|
|
|
|
|
17,000,000 |
|
16,628,134 |
|
17,470,125 |
|
4.08 |
% |
|
Rocket Software, Inc. |
|
|
|
|
|
|
|
|
|
|
|
|
|
|
|
|
Software |
|
Second lien (2) |
|
10.25% (Base Rate + 8.75%) |
|
2/8/2019 |
|
17,500,000 |
|
17,283,942 |
|
17,412,500 |
|
4.07 |
% |
|
|
|
|
|
|
|
|
|
|
|
|
|
|
|
|
|
|
PODS, Inc. (7) |
|
|
|
|
|
|
|
|
|
|
|
|
|
|
|
|
Consumer Services |
|
|
|
|
|
|
|
|
|
|
|
|
|
|
|
|
PODS Funding Corp. II |
|
First lien (3) |
|
8.50% (Base Rate + 7.00%) |
|
11/29/2016 |
|
12,734,077 |
|
12,386,167 |
|
12,670,407 |
|
|
|
|
Storapod Holding Company, Inc. |
|
Subordinated (2) |
|
21.00% PIK* |
|
11/29/2017 |
|
4,500,000 |
|
4,352,251 |
|
4,344,095 |
|
|
|
|
|
|
|
|
|
|
|
|
17,234,077 |
|
16,738,418 |
|
17,014,502 |
|
3.98 |
% |
|
|
|
|
|
|
|
|
|
|
|
|
|
|
|
|
|
|
Sotera Defense Solutions, Inc. (Global Defense Technology & Systems, Inc.) |
|
|
|
|
|
|
|
|
|
|
|
|
|
|
|
|
Federal Services |
|
First lien (3) |
|
7.00% (Base Rate + 5.50%) |
|
4/21/2017 |
|
16,830,035 |
|
16,694,323 |
|
16,661,734 |
|
3.89 |
% |
|
|
|
|
|
|
|
|
|
|
|
|
|
|
|
|
|
|
KeyPoint Government Solutions, Inc. |
|
|
|
|
|
|
|
|
|
|
|
|
|
|
|
|
Federal Services |
|
First lien (2) |
|
10.00% (Base Rate + 8.00%) |
|
12/31/2015 |
|
16,406,308 |
|
16,161,010 |
|
16,488,340 |
|
3.85 |
% |
|
|
|
|
|
|
|
|
|
|
|
|
|
|
|
|
|
|
OpenLink International, Inc. |
|
|
|
|
|
|
|
|
|
|
|
|
|
|
|
|
Software |
|
First lien (3) |
|
7.75% (Base Rate + 6.25%) |
|
10/30/2017 |
|
14,925,000 |
|
14,652,855 |
|
14,980,969 |
|
3.50 |
% |
|
|
|
|
|
|
|
|
|
|
|
|
|
|
|
|
|
|
Brock Holdings III, Inc. |
|
|
|
|
|
|
|
|
|
|
|
|
|
|
|
|
Industrial Services |
|
Second lien (2) |
|
10.00% (Base Rate + 8.25%) |
|
3/16/2018 |
|
15,000,000 |
|
14,754,147 |
|
14,850,000 |
|
3.47 |
% |
|
|
|
|
|
|
|
|
|
|
|
|
|
|
|
|
|
|
Volume Services America, Inc. (Centerplate) |
|
|
|
|
|
|
|
|
|
|
|
|
|
|
|
|
Consumer Services |
|
First lien (2) |
|
10.50% (Base Rate + 8.50%) |
|
9/16/2016 |
|
14,775,000 |
|
14,469,492 |
|
14,821,172 |
|
3.46 |
% |
|
|
|
|
|
|
|
|
|
|
|
|
|
|
|
|
|
|
Landslide Holdings, Inc. (Crimson Acquisition Corp.) |
|
|
|
|
|
|
|
|
|
|
|
|
|
|
|
|
Software |
|
First lien (2) |
|
7.00% (Base Rate + 5.75%) |
|
6/19/2018 |
|
15,000,000 |
|
14,700,654 |
|
14,700,000 |
|
3.44 |
% |
|
|
|
|
|
|
|
|
|
|
|
|
|
|
|
|
|
|
SRA International, Inc. |
|
|
|
|
|
|
|
|
|
|
|
|
|
|
|
|
Federal Services |
|
First lien (3) |
|
6.50% (Base Rate + 5.25%) |
|
7/20/2018 |
|
15,163,953 |
|
14,505,783 |
|
14,699,557 |
|
3.44 |
% |
|
|
|
|
|
|
|
|
|
|
|
|
|
|
|
|
|
|
Triple Point Technology, Inc. |
|
|
|
|
|
|
|
|
|
|
|
|
|
|
|
|
Software |
|
First lien (3) |
|
8.00% (Base Rate + 6.50%) |
|
10/27/2017 |
|
14,427,500 |
|
13,899,706 |
|
14,535,706 |
|
3.40 |
% |
|
|
|
|
|
|
|
|
|
|
|
|
|
|
|
|
|
|
Pacific Architects and Engineers Incorporated |
|
|
|
|
|
|
|
|
|
|
|
|
|
|
|
|
Federal Services |
|
First lien (3) |
|
7.50% (Base Rate + 6.00%) |
|
4/4/2017 |
|
14,100,000 |
|
13,871,885 |
|
14,100,000 |
|
3.30 |
% |
|
|
|
|
|
|
|
|
|
|
|
|
|
|
|
|
|
|
Virtual Radiologic Corporation |
|
|
|
|
|
|
|
|
|
|
|
|
|
|
|
|
Healthcare Information Technology |
|
First lien (3) |
|
7.75% (Base Rate + 4.50%) |
|
12/22/2016 |
|
14,814,975 |
|
14,645,542 |
|
13,222,365 |
|
3.09 |
% |
|
|
|
|
|
|
|
|
|
|
|
|
|
|
|
|
|
|
Aspen Dental Management, Inc |
|
|
|
|
|
|
|
|
|
|
|
|
|
|
|
|
Healthcare Services |
|
First lien (3) |
|
7.00% (Base Rate + 5.50%) |
|
10/6/2016 |
|
12,935,000 |
|
12,690,433 |
|
12,886,494 |
|
3.01 |
% |
|
|
|
|
|
|
|
|
|
|
|
|
|
|
|
|
|
|
Smile Brands Group Inc. |
|
|
|
|
|
|
|
|
|
|
|
|
|
|
|
|
Healthcare Services |
|
First lien (3) |
|
7.00% (Base Rate + 5.25%) |
|
12/21/2017 |
|
12,275,283 |
|
12,123,296 |
|
12,290,627 |
|
2.87 |
% |
|
|
|
|
|
|
|
|
|
|
|
|
|
|
|
|
|
|
Vision Solutions, Inc. |
|
|
|
|
|
|
|
|
|
|
|
|
|
|
|
|
Software |
|
Second lien (2) |
|
9.50% (Base Rate + 8.00%) |
|
7/23/2017 |
|
12,000,000 |
|
11,903,462 |
|
11,940,000 |
|
2.79 |
% |
|
|
|
|
|
|
|
|
|
|
|
|
|
|
|
|
|
|
Permian Tank & Manufacturing, Inc. |
|
|
|
|
|
|
|
|
|
|
|
|
|
|
|
|
Energy |
|
First lien (3) |
|
9.00% (Base Rate + 7.25%) |
|
3/15/2017 |
|
11,828,829 |
|
11,546,638 |
|
11,533,108 |
|
2.70 |
% |
|
|
|
|
|
|
|
|
|
|
|
|
|
|
|
|
|
|
TravelCLICK, Inc. (fka TravelCLICK Acquisition Co.) |
|
|
|
|
|
|
|
|
|
|
|
|
|
|
|
|
Information Services |
|
First lien (3) |
|
6.50% (Base Rate + 5.00%) |
|
3/16/2016 |
|
11,343,875 |
|
11,174,700 |
|
11,358,055 |
|
2.65 |
% |
|
|
|
|
|
|
|
|
|
|
|
|
|
|
|
|
|
|
|
The accompanying notes are an integral part of these consolidated financial statements.
7
Table of Contents
New Mountain Finance Holdings, L.L.C.
Consolidated Schedule of Investments (continued)
June 30, 2012
(unaudited)
|
Portfolio Company, Location and
Industry |
|
Type of
Investment |
|
Interest Rate |
|
Maturity
Date |
|
Principal
Amount,
Par Value
or Shares |
|
Cost |
|
Fair
Value |
|
Percent of
Members’
Capital |
|
|
|
|
|
|
|
|
|
|
|
|
|
|
|
|
|
|
|
Mailsouth, Inc. |
|
|
|
|
|
|
|
|
|
|
|
|
|
|
|
|
Media |
|
First lien (3) |
|
6.75% (Base Rate + 4.99%) |
|
12/14/2016 |
|
$ |
11,192,992 |
|
$ |
11,060,805 |
|
$ |
11,025,097 |
|
2.58 |
% |
|
|
|
|
|
|
|
|
|
|
|
|
|
|
|
|
|
|
Merrill Communications LLC |
|
|
|
|
|
|
|
|
|
|
|
|
|
|
|
|
Business Services |
|
First lien (2) |
|
7.75% (Base Rate + 4.50%) |
|
12/24/2012 |
|
11,421,788 |
|
10,834,927 |
|
10,765,035 |
|
2.52 |
% |
|
|
|
|
|
|
|
|
|
|
|
|
|
|
|
|
|
|
Immucor, Inc. |
|
|
|
|
|
|
|
|
|
|
|
|
|
|
|
|
Healthcare Services |
|
First lien (3) |
|
7.25% (Base Rate + 5.75%) |
|
8/19/2018 |
|
4,962,500 |
|
4,782,927 |
|
5,002,820 |
|
|
|
|
|
|
Subordinated (2) |
|
11.13% |
|
8/15/2019 |
|
5,000,000 |
|
4,940,257 |
|
5,500,000 |
|
|
|
|
|
|
|
|
|
|
|
|
9,962,500 |
|
9,723,184 |
|
10,502,820 |
|
2.46 |
% |
|
|
|
|
|
|
|
|
|
|
|
|
|
|
|
|
|
|
CHG Companies, Inc. |
|
|
|
|
|
|
|
|
|
|
|
|
|
|
|
|
Healthcare Services |
|
Second lien (2) |
|
11.25% (Base Rate + 9.50%) |
|
4/7/2017 |
|
10,000,000 |
|
9,838,824 |
|
10,050,000 |
|
2.35 |
% |
|
|
|
|
|
|
|
|
|
|
|
|
|
|
|
|
|
|
YP Intermediate Holdings Corp. / YP Intermediate Holdings II LLC |
|
|
|
|
|
|
|
|
|
|
|
|
|
|
|
|
Media |
|
Second lien (1)(2) |
|
15.00% (12.00% + 3.00% PIK)* |
|
5/18/2017 |
|
10,329,897 |
|
10,026,652 |
|
10,020,000 |
|
2.34 |
% |
|
|
|
|
|
|
|
|
|
|
|
|
|
|
|
|
|
|
Vertafore, Inc. |
|
|
|
|
|
|
|
|
|
|
|
|
|
|
|
|
Software |
|
Second lien (2) |
|
9.75% (Base Rate + 8.25%) |
|
10/29/2017 |
|
10,000,000 |
|
9,917,822 |
|
9,950,000 |
|
2.33 |
% |
|
|
|
|
|
|
|
|
|
|
|
|
|
|
|
|
|
|
Premier Dental Services, Inc. (Western) |
|
|
|
|
|
|
|
|
|
|
|
|
|
|
|
|
Healthcare Services |
|
First lien (2) |
|
5.97% (Base Rate + 5.50%) |
|
7/1/2013 |
|
9,961,832 |
|
9,420,645 |
|
9,463,740 |
|
2.21 |
% |
|
|
|
|
|
|
|
|
|
|
|
|
|
|
|
|
|
|
Merge Healthcare Inc.** |
|
|
|
|
|
|
|
|
|
|
|
|
|
|
|
|
Healthcare Services |
|
First lien (2) |
|
11.75% |
|
5/1/2015 |
|
9,000,000 |
|
8,897,244 |
|
9,337,500 |
|
2.18 |
% |
|
|
|
|
|
|
|
|
|
|
|
|
|
|
|
|
|
|
Sunquest Information Systems, Inc. (Misys Hospital Systems, Inc.) |
|
|
|
|
|
|
|
|
|
|
|
|
|
|
|
|
Healthcare Services |
|
Second lien (2) |
|
9.75% (Base Rate + 8.50%) |
|
6/16/2017 |
|
9,000,000 |
|
8,851,864 |
|
9,270,000 |
|
2.17 |
% |
|
|
|
|
|
|
|
|
|
|
|
|
|
|
|
|
|
|
Tekelec Global, Inc. |
|
|
|
|
|
|
|
|
|
|
|
|
|
|
|
|
Software |
|
First lien (3) |
|
9.00% (Base Rate + 7.50%) |
|
1/29/2018 |
|
7,820,000 |
|
7,709,062 |
|
7,702,700 |
|
1.80 |
% |
|
|
|
|
|
|
|
|
|
|
|
|
|
|
|
|
|
|
Physio-Control International, Inc. |
|
|
|
|
|
|
|
|
|
|
|
|
|
|
|
|
Healthcare Products |
|
First lien (2)(8) |
|
9.88% |
|
1/15/2019 |
|
7,000,000 |
|
7,000,000 |
|
7,490,000 |
|
1.75 |
% |
|
|
|
|
|
|
|
|
|
|
|
|
|
|
|
|
|
|
Surgery Center Holdings, Inc. |
|
|
|
|
|
|
|
|
|
|
|
|
|
|
|
|
Healthcare Services |
|
First lien (3) |
|
6.50% (Base Rate + 5.00%) |
|
2/6/2017 |
|
6,868,750 |
|
6,841,269 |
|
6,834,406 |
|
1.60 |
% |
|
|
|
|
|
|
|
|
|
|
|
|
|
|
|
|
|
|
Research Pharmaceutical Services, Inc. |
|
|
|
|
|
|
|
|
|
|
|
|
|
|
|
|
Healthcare Services |
|
First lien (3) |
|
7.00% (Base Rate + 5.50%) |
|
2/18/2017 |
|
7,312,500 |
|
7,223,525 |
|
6,581,250 |
|
1.54 |
% |
|
|
|
|
|
|
|
|
|
|
|
|
|
|
|
|
|
|
Alion Science and Technology Corporation |
|
|
|
|
|
|
|
|
|
|
|
|
|
|
|
|
Federal Services |
|
First lien (2) |
|
10.00% + 2.00% PIK* |
|
11/1/2014 |
|
6,257,192 |
|
6,017,932 |
|
5,876,549 |
|
1.37 |
% |
|
|
|
|
|
|
|
|
|
|
|
|
|
|
|
|
|
|
Stratus Technologies, Inc. |
|
|
|
|
|
|
|
|
|
|
|
|
|
|
|
|
Information Technology |
|
First lien (2) |
|
12.00% |
|
3/29/2015 |
|
6,664,000 |
|
6,364,947 |
|
5,831,000 |
|
1.36 |
% |
|
|
|
|
|
|
|
|
|
|
|
|
|
|
|
|
|
|
Ozburn-Hessey Holding Company LLC |
|
|
|
|
|
|
|
|
|
|
|
|
|
|
|
|
Logistics |
|
Second lien (2) |
|
11.50% (Base Rate + 9.50%) |
|
10/10/2016 |
|
6,000,000 |
|
5,902,813 |
|
5,220,000 |
|
1.22 |
% |
|
|
|
|
|
|
|
|
|
|
|
|
|
|
|
|
|
|
LVI Services Inc. |
|
|
|
|
|
|
|
|
|
|
|
|
|
|
|
|
Industrial Services |
|
First lien (2) |
|
9.75% (Base Rate + 6.50%) |
|
3/31/2014 |
|
5,063,248 |
|
4,547,127 |
|
4,354,394 |
|
1.02 |
% |
|
|
|
|
|
|
|
|
|
|
|
|
|
|
|
|
|
|
Education Management LLC** |
|
|
|
|
|
|
|
|
|
|
|
|
|
|
|
|
Education |
|
First lien (3) |
|
8.25% (Base Rate + 7.00%) |
|
3/30/2018 |
|
3,989,171 |
|
3,873,125 |
|
3,890,690 |
|
0.91 |
% |
|
|
|
|
|
|
|
|
|
|
|
|
|
|
|
|
|
|
|
The accompanying notes are an integral part of these consolidated financial statements.
8
Table of Contents
New Mountain Finance Holdings, L.L.C.
Consolidated Schedule of Investments (continued)
June 30, 2012
(unaudited)
|
Portfolio Company, Location and
Industry |
|
Type of
Investment |
|
Interest Rate |
|
Maturity
Date |
|
Principal
Amount,
Par Value
or Shares |
|
Cost |
|
Fair
Value |
|
Percent of
Members’
Capital |
|
|
|
|
|
|
|
|
|
|
|
|
|
|
|
|
|
|
|
Mach Gen, LLC |
|
|
|
|
|
|
|
|
|
|
|
|
|
|
|
|
Power Generation |
|
Second lien (2) |
|
7.97% PIK (Base Rate + 7.50%)* |
|
2/22/2015 |
|
$ |
5,391,921 |
|
$ |
4,670,806 |
|
$ |
3,696,603 |
|
0.86 |
% |
|
|
|
|
|
|
|
|
|
|
|
|
|
|
|
|
|
|
Brickman Group Holdings, Inc. |
|
|
|
|
|
|
|
|
|
|
|
|
|
|
|
|
Business Services |
|
Subordinated (2)(8) |
|
9.13% |
|
11/1/2018 |
|
3,650,000 |
|
3,323,358 |
|
3,577,000 |
|
0.84 |
% |
|
|
|
|
|
|
|
|
|
|
|
|
|
|
|
|
|
|
Airvana Network Solutions Inc. |
|
|
|
|
|
|
|
|
|
|
|
|
|
|
|
|
Software |
|
First lien (2) |
|
10.00% (Base Rate + 8.00%) |
|
3/25/2015 |
|
3,428,571 |
|
3,381,359 |
|
3,325,714 |
|
0.78 |
% |
|
|
|
|
|
|
|
|
|
|
|
|
|
|
|
|
|
|
ATI Acquisition Company (fka Ability Acquisition, Inc.) |
|
|
|
|
|
|
|
|
|
|
|
|
|
|
|
|
Education |
|
First lien (2) |
|
12.25% (Base Rate + 5.00% + 4.00% PIK) (5)* |
|
12/30/2014 |
|
4,432,500 |
|
4,306,437 |
|
332,438 |
|
|
|
|
|
|
First lien (2) |
|
17.25% (Base Rate + 10.00% + 4.00% PIK)* |
|
6/30/2012— Past Due |
|
102,861 |
|
93,691 |
|
82,289 |
|
|
|
|
|
|
First lien (2) |
|
17.25% (Base Rate + 10.00% + 4.00% PIK)* |
|
6/30/2012— Past Due |
|
1,665,103 |
|
1,516,666 |
|
1,332,082 |
|
|
|
|
|
|
|
|
|
|
|
|
6,200,464 |
|
5,916,794 |
|
1,746,809 |
|
0.41 |
% |
|
|
|
|
|
|
|
|
|
|
|
|
|
|
|
|
|
|
Advantage Sales & Marketing Inc. |
|
|
|
|
|
|
|
|
|
|
|
|
|
|
|
|
Business Services |
|
First lien (2)(4) |
|
6.25% (Base Rate + 3.00%) |
|
12/17/2015 |
|
1,365,000 |
|
1,365,000 |
|
1,262,625 |
|
0.30 |
% |
|
|
|
|
|
|
|
|
|
|
|
|
|
|
|
|
|
|
Total Funded Debt Investments—United States |
|
|
|
|
|
|
|
$ |
753,578,703 |
|
$ |
731,403,517 |
|
$ |
734,502,112 |
|
171.72 |
% |
|
|
|
|
|
|
|
|
|
|
|
|
|
|
|
|
|
|
Equity—United States |
|
|
|
|
|
|
|
|
|
|
|
|
|
|
|
|
Global Knowledge Training LLC |
|
|
|
|
|
|
|
|
|
|
|
|
|
|
|
|
Education |
|
Ordinary shares (2) |
|
— |
|
— |
|
2 |
|
$ |
2,109 |
|
$ |
2,109 |
|
|
|
|
|
|
Preferred shares (2) |
|
— |
|
— |
|
2,423 |
|
2,422,891 |
|
2,422,891 |
|
|
|
|
|
|
|
|
|
|
|
|
|
|
2,425,000 |
|
2,425,000 |
|
0.57 |
% |
|
Stratus Technologies, Inc. |
|
|
|
|
|
|
|
|
|
|
|
|
|
|
|
|
Information Technology |
|
Ordinary shares (2) |
|
— |
|
— |
|
144,270 |
|
65,123 |
|
5,869 |
|
|
|
|
|
|
Preferred shares (2) |
|
— |
|
— |
|
32,830 |
|
14,819 |
|
1,336 |
|
|
|
|
|
|
|
|
|
|
|
|
|
|
79,942 |
|
7,205 |
|
0.00 |
% |
|
|
|
|
|
|
|
|
|
|
|
|
|
|
|
|
|
|
Total Shares |
|
|
|
|
|
|
|
|
|
$ |
2,504,942 |
|
$ |
2,432,205 |
|
0.57 |
% |
|
|
|
|
|
|
|
|
|
|
|
|
|
|
|
|
|
|
Warrants—United States |
|
|
|
|
|
|
|
|
|
|
|
|
|
|
|
|
Alion Science and Technology Corporation |
|
|
|
|
|
|
|
|
|
|
|
|
|
|
|
|
Federal Services |
|
Warrants (2) |
|
— |
|
— |
|
6,000 |
|
$ |
292,851 |
|
$ |
209,827 |
|
0.05 |
% |
|
|
|
|
|
|
|
|
|
|
|
|
|
|
|
|
|
|
PODS, Inc. (7) |
|
|
|
|
|
|
|
|
|
|
|
|
|
|
|
|
Storapod Holding Company, Inc. |
|
|
|
|
|
|
|
|
|
|
|
|
|
|
|
|
Consumer Services |
|
Warrants (2) |
|
— |
|
— |
|
360,129 |
|
155,905 |
|
155,906 |
|
0.04 |
% |
|
|
|
|
|
|
|
|
|
|
|
|
|
|
|
|
|
|
Learning Care Group (US), Inc. |
|
|
|
|
|
|
|
|
|
|
|
|
|
|
|
|
Education |
|
Warrants (2) |
|
— |
|
— |
|
844 |
|
193,850 |
|
14,372 |
|
0.00 |
% |
|
|
|
|
|
|
|
|
|
|
|
|
|
|
|
|
|
|
Total Warrants |
|
|
|
|
|
|
|
|
|
$ |
642,606 |
|
$ |
380,105 |
|
0.09 |
% |
|
|
|
|
|
|
|
|
|
|
|
|
|
|
|
|
|
|
Total Funded Investments |
|
|
|
|
|
|
|
|
|
$ |
749,103,417 |
|
$ |
752,036,922 |
|
175.82 |
% |
|
|
|
|
|
|
|
|
|
|
|
|
|
|
|
|
|
|
Unfunded Debt Investments—United States |
|
|
|
|
|
|
|
|
|
|
|
|
|
|
|
|
|
|
|
|
|
|
|
|
|
|
|
|
|
|
|
|
|
Kronos Incorporated |
|
|
|
|
|
|
|
|
|
|
|
|
|
|
|
|
Software |
|
First lien (2)(4)— Undrawn |
|
— |
|
6/11/2013 |
|
4,198,500 |
|
(629,775 |
) |
(272,903 |
) |
(0.07 |
)% |
The accompanying notes are an integral part of these consolidated financial statements.
9
Table of Contents
New Mountain Finance Holdings, L.L.C.
Consolidated Schedule of Investments (continued)
June 30, 2012
(unaudited)
|
Portfolio Company, Location and
Industry |
|
Type of
Investment |
|
Interest Rate |
|
Maturity
Date |
|
Principal
Amount,
Par Value
or Shares |
|
Cost |
|
Fair
Value |
|
Percent of
Members’
Capital |
|
|
|
|
|
|
|
|
|
|
|
|
|
|
|
|
|
|
|
Advantage Sales & Marketing Inc. |
|
|
|
|
|
|
|
|
|
|
|
|
|
|
|
|
Business Services |
|
First lien (2)(4)—Undrawn |
|
— |
|
12/17/2015 |
|
$ |
9,135,000 |
|
$ |
(1,260,000 |
) |
$ |
(685,125 |
) |
(0.16 |
)% |
|
|
|
|
|
|
|
|
|
|
|
|
|
|
|
|
|
|
Total Unfunded Debt Investments |
|
|
|
|
|
|
|
$ |
13,333,500 |
|
$ |
(1,889,775 |
) |
$ |
(958,028 |
) |
(0.23 |
)% |
|
|
|
|
|
|
|
|
|
|
|
|
|
|
|
|
|
|
Total Investments |
|
|
|
|
|
|
|
|
|
$ |
747,213,642 |
|
$ |
751,078,894 |
|
175.59 |
% |
(1) Investment includes a warrant to purchase a percentage interest of YP Equity Investors, LLC.
(2) The Holdings Credit Facility is collateralized by the indicated investments.
(3) The SLF Credit Facility is collateralized by the indicated investments.
(4) Par Value amounts represent the drawn or undrawn (as indicated in type of investment) portion of revolving credit facilities. Cost amounts represent the cash received at settlement date net the impact of paydowns and cash paid for drawn revolvers.
(5) Investment is on non-accrual status.
(6) New Mountain Finance Holdings, L.L.C. (“NMF Holdings”) holds investments in two related entities of NEWAsurion Corporation. NMF Holdings has credit investments in Asurion, LLC and Lonestar Intermediate Super Holdings, LLC. Asurion, LLC is a wholly-owned subsidiary of Lonestar Intermediate Holdings, LLC, which in turn is a wholly-owned subsidiary of Lonestar Intermediate Super Holdings, LLC.
(7) NMF Holdings holds investments in two related entities of PODS, Inc. NMF Holdings directly holds warrants in Storapod Holding Company, Inc. (“Storapod”) and has a credit investment in Storapod through Storapod WCF II Limited (“Storapod WCF II”). Storapod WCF II is a special purpose entity used to enter into a Shari’ah- compliant financing arrangement with Storapod. Additionally, NMF Holdings has a credit investment in PODS Funding Corp. II (“PODS II”). PODS, Inc. is a wholly-owned subsidiary of PODS Holding, Inc., which in turn is a majority-owned subsidiary of Storapod. PODS II is a special purpose entity used to enter into a Shari’ah-compliant financing arrangement with PODS, Inc. and its subsidiary, PODS Enterprises, Inc.
(8) Securities are exempt from registration under Rule 144A of the Securities Act of 1933. These securities are considered liquid and may be resold in transactions exempt from registration to qualified institutional buyers. At June 30, 2012, the aggregate market value of these securities amounted to $11,067,000 or 2.59% of members’ capital.
* All or a portion of interest contains payments-in-kind (“PIK”).
** Indicates assets that NMF Holdings deems to be “non-qualifying assets” under Section 55(a) of the Investment Company Act of 1940, as amended. Qualifying assets must represent at least 70.00% of NMF Holdings’ total assets at the time of acquisition of any additional non-qualifying assets.
The accompanying notes are an integral part of these consolidated financial statements.
10
Table of Contents
New Mountain Finance Holdings, L.L.C.
Consolidated Schedule of Investments (continued)
June 30, 2012
(unaudited)
|
|
|
June 30, 2012 |
|
|
Investment Type |
|
Percent of Total
Investments at Fair Value |
|
|
First lien |
|
58.02 |
% |
|
Second lien |
|
37.75 |
% |
|
Subordinated |
|
3.86 |
% |
|
Equity and other |
|
0.37 |
% |
|
Total investments |
|
100.00 |
% |
|
|
|
June 30, 2012 |
|
|
Industry Type |
|
Percent of Total
Investments at Fair Value |
|
|
Healthcare Services |
|
20.55 |
% |
|
Education |
|
18.94 |
% |
|
Software |
|
18.17 |
% |
|
Federal Services |
|
9.06 |
% |
|
Business Services |
|
7.54 |
% |
|
Healthcare Products |
|
4.28 |
% |
|
Consumer Services |
|
4.26 |
% |
|
Information Services |
|
3.98 |
% |
|
Logistics |
|
3.29 |
% |
|
Media |
|
2.80 |
% |
|
Industrial Services |
|
2.56 |
% |
|
Healthcare Information Technology |
|
1.76 |
% |
|
Energy |
|
1.54 |
% |
|
Information Technology |
|
0.78 |
% |
|
Power Generation |
|
0.49 |
% |
|
Total investments |
|
100.00 |
% |
The accompanying notes are an integral part of these consolidated financial statements.
11
Table of Contents
New Mountain Finance Holdings, L.L.C.
Consolidated Schedule of Investments
December 31, 2011
|
Portfolio Company, Location and
Industry |
|
Type of
Investment |
|
Interest Rate |
|
Maturity
Date |
|
Principal
Amount,
Par Value
or Shares |
|
Cost |
|
Fair
Value |
|
Percent of
Members’
Capital |
|
|
|
|
|
|
|
|
|
|
|
|
|
|
|
|
|
|
|
Funded Debt Investments—United States |
|
|
|
|
|
|
|
|
|
|
|
|
|
|
|
|
Novell, Inc. (fka Attachmate Corporation, NetIQ Corporation) |
|
|
|
|
|
|
|
|
|
|
|
|
|
|
|
|
Software |
|
First lien (3) |
|
6.50% (Base Rate + 5.00%) |
|
4/27/2017 |
|
$ |
13,825,000 |
|
$ |
13,703,238 |
|
$ |
13,583,062 |
|
|
|
|
|
|
Second lien (2) |
|
9.50% (Base Rate + 8.00%) |
|
10/27/2017 |
|
20,000,000 |
|
19,669,018 |
|
19,200,000 |
|
|
|
|
|
|
|
|
|
|
|
|
33,825,000 |
|
33,372,256 |
|
32,783,062 |
|
7.80 |
% |
|
|
|
|
|
|
|
|
|
|
|
|
|
|
|
|
|
|
Decision Resources, LLC |
|
|
|
|
|
|
|
|
|
|
|
|
|
|
|
|
Business Services |
|
First lien (3) |
|
7.00% (Base Rate + 5.50%) |
|
12/28/2016 |
|
17,820,000 |
|
17,588,508 |
|
17,196,300 |
|
|
|
|
|
|
Second lien (2) |
|
9.50% (Base Rate + 8.00%) |
|
5/7/2018 |
|
14,500,000 |
|
14,368,204 |
|
14,282,500 |
|
|
|
|
|
|
|
|
|
|
|
|
32,320,000 |
|
31,956,712 |
|
31,478,800 |
|
7.48 |
% |
|
|
|
|
|
|
|
|
|
|
|
|
|
|
|
|
|
|
Lawson Software, Inc. (fka SoftBrands, Inc.) |
|
|
|
|
|
|
|
|
|
|
|
|
|
|
|
|
Software |
|
First lien (3) |
|
6.75% (Base Rate + 5.25%) |
|
7/5/2017 |
|
18,703,125 |
|
18,001,977 |
|
18,305,684 |
|
|
|
|
|
|
Subordinated (2)(7) |
|
11.50% |
|
7/15/2018 |
|
13,500,000 |
|
12,329,105 |
|
13,162,500 |
|
|
|
|
|
|
|
|
|
|
|
|
32,203,125 |
|
30,331,082 |
|
31,468,184 |
|
7.47 |
% |
|
|
|
|
|
|
|
|
|
|
|
|
|
|
|
|
|
|
Meritas Schools Holdings, LLC |
|
|
|
|
|
|
|
|
|
|
|
|
|
|
|
|
Education |
|
First lien (3) |
|
7.50% (Base Rate + 6.00%) |
|
7/29/2017 |
|
9,500,000 |
|
9,409,890 |
|
9,357,500 |
|
|
|
|
|
|
Second lien (2) |
|
11.50% (Base Rate + 10.00%) |
|
1/29/2018 |
|
20,000,000 |
|
19,712,425 |
|
19,650,000 |
|
|
|
|
|
|
|
|
|
|
|
|
29,500,000 |
|
29,122,315 |
|
29,007,500 |
|
6.89 |
% |
|
|
|
|
|
|
|
|
|
|
|
|
|
|
|
|
|
|
Global Knowledge Training LLC |
|
|
|
|
|
|
|
|
|
|
|
|
|
|
|
|
Education |
|
First lien (3) |
|
6.50% (Base Rate + 5.00%) |
|
4/21/2017 |
|
4,867,647 |
|
4,796,665 |
|
4,794,632 |
|
|
|
|
|
|
Second lien (2) |
|
11.50% (Base Rate + 9.75%) |
|
10/21/2018 |
|
24,250,000 |
|
23,764,101 |
|
23,755,300 |
|
|
|
|
|
|
|
|
|
|
|
|
29,117,647 |
|
28,560,766 |
|
28,549,932 |
|
6.79 |
% |
|
|
|
|
|
|
|
|
|
|
|
|
|
|
|
|
|
|
Managed Health Care Associates, Inc. |
|
|
|
|
|
|
|
|
|
|
|
|
|
|
|
|
Healthcare Services |
|
First lien (2) |
|
3.55% (Base Rate + 3.25%) |
|
8/1/2014 |
|
15,467,673 |
|
12,941,252 |
|
14,462,274 |
|
|
|
|
|
|
Second lien (2) |
|
6.80% (Base Rate + 6.50%) |
|
2/1/2015 |
|
15,000,000 |
|
11,950,542 |
|
13,950,000 |
|
|
|
|
|
|
|
|
|
|
|
|
30,467,673 |
|
24,891,794 |
|
28,412,274 |
|
6.76 |
% |
|
|
|
|
|
|
|
|
|
|
|
|
|
|
|
|
|
|
Insight Pharmaceuticals LLC |
|
|
|
|
|
|
|
|
|
|
|
|
|
|
|
|
Healthcare Products |
|
Second lien (2) |
|
13.25% (Base Rate + 11.75%) |
|
8/25/2017 |
|
25,000,000 |
|
24,037,614 |
|
24,875,000 |
|
5.92 |
% |
|
|
|
|
|
|
|
|
|
|
|
|
|
|
|
|
|
|
Renaissance Learning, Inc. |
|
|
|
|
|
|
|
|
|
|
|
|
|
|
|
|
Education |
|
Second lien (2) |
|
12.00% (Base Rate + 10.50%) |
|
10/19/2018 |
|
20,000,000 |
|
19,016,871 |
|
20,100,000 |
|
4.78 |
% |
|
|
|
|
|
|
|
|
|
|
|
|
|
|
|
|
|
|
Learning Care Group (US), Inc. |
|
|
|
|
|
|
|
|
|
|
|
|
|
|
|
|
Education |
|
First lien (2) |
|
12.00% |
|
4/27/2016 |
|
17,368,421 |
|
17,115,609 |
|
16,695,606 |
|
|
|
|
|
|
Subordinated (2) |
|
15.00% PIK* |
|
6/30/2016 |
|
3,273,004 |
|
3,089,870 |
|
2,971,990 |
|
|
|
|
|
|
|
|
|
|
|
|
20,641,425 |
|
20,205,479 |
|
19,667,596 |
|
4.68 |
% |
|
|
|
|
|
|
|
|
|
|
|
|
|
|
|
|
|
|
Transplace Texas, L.P. |
|
|
|
|
|
|
|
|
|
|
|
|
|
|
|
|
Logistics |
|
Second lien (2) |
|
11.00% (Base Rate + 9.00%) |
|
4/12/2017 |
|
20,000,000 |
|
19,514,617 |
|
19,500,000 |
|
4.64 |
% |
|
|
|
|
|
|
|
|
|
|
|
|
|
|
|
|
|
|
U.S. Healthworks Holding Company, Inc. |
|
|
|
|
|
|
|
|
|
|
|
|
|
|
|
|
Healthcare Services |
|
Second lien (2) |
|
10.50% (Base Rate + 9.00%) |
|
6/15/2017 |
|
20,000,000 |
|
19,719,547 |
|
19,500,000 |
|
4.64 |
% |
|
|
|
|
|
|
|
|
|
|
|
|
|
|
|
|
|
|
Unitek Global Services, Inc. |
|
|
|
|
|
|
|
|
|
|
|
|
|
|
|
|
Business Services |
|
First lien (2) |
|
9.00% (Base Rate + 7.50%) |
|
4/15/2018 |
|
19,850,000 |
|
19,312,984 |
|
19,440,594 |
|
4.62 |
% |
|
|
|
|
|
|
|
|
|
|
|
|
|
|
|
|
|
|
Ipreo Holdings LLC |
|
|
|
|
|
|
|
|
|
|
|
|
|
|
|
|
Information Services |
|
First lien (3) |
|
8.00% (Base Rate + 6.50%) |
|
8/5/2017 |
|
18,703,125 |
|
18,308,298 |
|
18,282,305 |
|
4.35 |
% |
|
|
|
|
|
|
|
|
|
|
|
|
|
|
|
|
|
|
KeyPoint Government Solutions, Inc. |
|
|
|
|
|
|
|
|
|
|
|
|
|
|
|
|
Federal Services |
|
First lien (2) |
|
10.00% (Base Rate + 8.00%) |
|
12/31/2015 |
|
17,820,000 |
|
17,521,860 |
|
17,909,100 |
|
4.26 |
% |
|
|
|
|
|
|
|
|
|
|
|
|
|
|
|
|
|
|
Sotera Defense Solutions, Inc. (Global Defense Technology & Systems, Inc.) |
|
|
|
|
|
|
|
|
|
|
|
|
|
|
|
|
Federal Services |
|
First lien (3) |
|
7.00% (Base Rate + 5.50%) |
|
4/21/2017 |
|
16,915,000 |
|
16,764,489 |
|
16,872,713 |
|
4.01 |
% |
|
|
|
|
|
|
|
|
|
|
|
|
|
|
|
|
|
|
|
The accompanying notes are an integral part of these consolidated financial statements.
12
Table of Contents
New Mountain Finance Holdings, L.L.C.
Consolidated Schedule of Investments (continued)
December 31, 2011
|
Portfolio Company, Location and
Industry |
|
Type of
Investment |
|
Interest Rate |
|
Maturity
Date |
|
Principal
Amount,
Par Value
or Shares |
|
Cost |
|
Fair
Value |
|
Percent of
Members’
Capital |
|
|
SRA International, Inc. |
|
|
|
|
|
|
|
|
|
|
|
|
|
|
|
|
Federal Services |
|
First lien (3) |
|
6.50% (Base Rate + 5.25%) |
|
7/20/2018 |
|
$ |
17,433,389 |
|
$ |
16,624,324 |
|
$ |
16,416,447 |
|
3.90 |
% |
|
|
|
|
|
|
|
|
|
|
|
|
|
|
|
|
|
|
OpenLink International, Inc. |
|
|
|
|
|
|
|
|
|
|
|
|
|
|
|
|
Software |
|
First lien (2) |
|
7.75% (Base Rate + 6.25%) |
|
10/30/2017 |
|
15,000,000 |
|
14,706,514 |
|
15,056,250 |
|
3.58 |
% |
|
|
|
|
|
|
|
|
|
|
|
|
|
|
|
|
|
|
Volume Services America, Inc. (Centerplate) |
|
|
|
|
|
|
|
|
|
|
|
|
|
|
|
|
Consumer Services |
|
First lien (2) |
|
10.50% (Base Rate + 8.50%) |
|
9/16/2016 |
|
14,850,000 |
|
14,512,417 |
|
14,924,250 |
|
3.55 |
% |
|
|
|
|
|
|
|
|
|
|
|
|
|
|
|
|
|
|
SonicWALL, Inc. |
|
|
|
|
|
|
|
|
|
|
|
|
|
|
|
|
Software |
|
First lien (3) |
|
8.27% (Base Rate + 6.19%) |
|
1/23/2016 |
|
4,822,985 |
|
4,831,869 |
|
4,847,099 |
|
|
|
|
|
|
Second lien (2) |
|
12.00% (Base Rate + 10.00%) |
|
1/23/2017 |
|
10,000,000 |
|
9,746,209 |
|
9,950,000 |
|
|
|
|
|
|
|
|
|
|
|
|
14,822,985 |
|
14,578,078 |
|
14,797,099 |
|
3.52 |
% |
|
|
|
|
|
|
|
|
|
|
|
|
|
|
|
|
|
|
PODS, Inc.(6) |
|
|
|
|
|
|
|
|
|
|
|
|
|
|
|
|
Consumer Services |
|
|
|
|
|
|
|
|
|
|
|
|
|
|
|
|
PODS Funding Corp. II |
|
First lien (2) |
|
8.50% (Base Rate + 7.00%) |
|
11/29/2016 |
|
11,561,538 |
|
11,218,525 |
|
11,214,692 |
|
|
|
|
Storapod Holding Company, Inc. |
|
Subordinated (2) |
|
21.00% PIK* |
|
11/29/2017 |
|
3,728,642 |
|
3,600,214 |
|
3,599,461 |
|
|
|
|
|
|
|
|
|
|
|
|
15,290,180 |
|
14,818,739 |
|
14,814,153 |
|
3.52 |
% |
|
|
|
|
|
|
|
|
|
|
|
|
|
|
|
|
|
|
Triple Point Technology, Inc. |
|
|
|
|
|
|
|
|
|
|
|
|
|
|
|
|
Software |
|
First lien (3) |
|
8.00% (Base Rate + 6.50%) |
|
10/27/2017 |
|
14,500,000 |
|
13,932,051 |
|
14,536,250 |
|
3.46 |
% |
|
|
|
|
|
|
|
|
|
|
|
|
|
|
|
|
|
|
Virtual Radiologic Corporation |
|
|
|
|
|
|
|
|
|
|
|
|
|
|
|
|
Healthcare Information Technology |
|
First lien (3) |
|
7.75% (Base Rate + 4.50%) |
|
12/22/2016 |
|
14,889,987 |
|
14,704,271 |
|
14,108,263 |
|
3.36 |
% |
|
|
|
|
|
|
|
|
|
|
|
|
|
|
|
|
|
|
Brock Holdings III, Inc. |
|
|
|
|
|
|
|
|
|
|
|
|
|
|
|
|
Industrial Services |
|
Second lien (2) |
|
10.00% (Base Rate + 8.25%) |
|
3/16/2018 |
|
15,000,000 |
|
14,746,132 |
|
13,818,750 |
|
3.29 |
% |
|
|
|
|
|
|
|
|
|
|
|
|
|
|
|
|
|
|
LANDesk Group, Inc. |
|
|
|
|
|
|
|
|
|
|
|
|
|
|
|
|
Software |
|
First lien (3) |
|
7.00% (Base Rate + 5.25%) |
|
3/28/2016 |
|
14,062,500 |
|
13,828,336 |
|
13,798,828 |
|
3.28 |
% |
|
|
|
|
|
|
|
|
|
|
|
|
|
|
|
|
|
|
Pacific Architects and Engineers Incorporated |
|
|
|
|
|
|
|
|
|
|
|
|
|
|
|
|
Federal Services |
|
First lien (3) |
|
7.50% (Base Rate + 6.00%) |
|
4/4/2017 |
|
14,100,000 |
|
13,848,322 |
|
13,677,000 |
|
3.25 |
% |
|
|
|
|
|
|
|
|
|
|
|
|
|
|
|
|
|
|
Smile Brands Group Inc. |
|
|
|
|
|
|
|
|
|
|
|
|
|
|
|
|
Healthcare Services |
|
First lien (3) |
|
7.00% (Base Rate + 5.25%) |
|
12/21/2017 |
|
12,337,594 |
|
12,173,547 |
|
12,329,883 |
|
2.93 |
% |
|
|
|
|
|
|
|
|
|
|
|
|
|
|
|
|
|
|
Mailsouth, Inc. |
|
|
|
|
|
|
|
|
|
|
|
|
|
|
|
|
Media |
|
First lien (3) |
|
6.75% (Base Rate + 4.99%) |
|
12/14/2016 |
|
11,910,000 |
|
11,756,172 |
|
11,731,350 |
|
2.79 |
% |
|
|
|
|
|
|
|
|
|
|
|
|
|
|
|
|
|
|
Vision Solutions, Inc. |
|
|
|
|
|
|
|
|
|
|
|
|
|
|
|
|
Software |
|
Second lien (2) |
|
9.50% (Base Rate + 8.00%) |
|
7/23/2017 |
|
12,000,000 |
|
11,893,985 |
|
11,640,000 |
|
2.77 |
% |
|
|
|
|
|
|
|
|
|
|
|
|
|
|
|
|
|
|
TravelCLICK, Inc. (fka TravelCLICK Acquisition Co.) |
|
|
|
|
|
|
|
|
|
|
|
|
|
|
|
|
Information Services |
|
First lien (3) |
|
6.50% (Base Rate + 5.00%) |
|
3/16/2016 |
|
11,401,313 |
|
11,208,577 |
|
11,344,306 |
|
2.70 |
% |
|
|
|
|
|
|
|
|
|
|
|
|
|
|
|
|
|
|
Merrill Communications LLC |
|
|
|
|
|
|
|
|
|
|
|
|
|
|
|
|
Business Services |
|
First lien (2) |
|
7.50% (Base Rate + 5.50%) |
|
12/24/2012 |
|
11,421,788 |
|
10,284,637 |
|
11,002,985 |
|
2.62 |
% |
|
|
|
|
|
|
|
|
|
|
|
|
|
|
|
|
|
|
Brickman Group Holdings, Inc. |
|
|
|
|
|
|
|
|
|
|
|
|
|
|
|
|
Business Services |
|
First lien (3) |
|
7.25% (Base Rate + 5.50%) |
|
10/14/2016 |
|
7,957,406 |
|
8,005,917 |
|
7,982,272 |
|
|
|
|
|
|
Subordinated (2)(7) |
|
9.13% |
|
11/1/2018 |
|
3,000,000 |
|
2,716,216 |
|
2,715,000 |
|
|
|
|
|
|
|
|
|
|
|
|
10,957,406 |
|
10,722,133 |
|
10,697,272 |
|
2.54 |
% |
|
|
|
|
|
|
|
|
|
|
|
|
|
|
|
|
|
|
Immucor, Inc. |
|
|
|
|
|
|
|
|
|
|
|
|
|
|
|
|
Healthcare Services |
|
First lien (3) |
|
7.25% (Base Rate + 5.75%) |
|
8/19/2018 |
|
4,987,500 |
|
4,795,791 |
|
5,022,826 |
|
|
|
|
|
|
Subordinated (2) |
|
11.13% |
|
8/15/2019 |
|
5,000,000 |
|
4,937,575 |
|
5,200,000 |
|
|
|
|
|
|
|
|
|
|
|
|
9,987,500 |
|
9,733,366 |
|
10,222,826 |
|
2.43 |
% |
|
|
|
|
|
|
|
|
|
|
|
|
|
|
|
|
|
|
CHG Companies, Inc. |
|
|
|
|
|
|
|
|
|
|
|
|
|
|
|
|
Healthcare Services |
|
Second lien (2) |
|
11.25% (Base Rate + 9.50%) |
|
4/7/2017 |
|
10,000,000 |
|
9,826,548 |
|
10,025,000 |
|
2.38 |
% |
|
|
|
|
|
|
|
|
|
|
|
|
|
|
|
|
|
|
Vertafore, Inc. |
|
|
|
|
|
|
|
|
|
|
|
|
|
|
|
|
Software |
|
Second lien (2) |
|
9.75% (Base Rate + 8.25%) |
|
10/29/2017 |
|
10,000,000 |
|
9,912,104 |
|
9,725,000 |
|
2.31 |
% |
|
|
|
|
|
|
|
|
|
|
|
|
|
|
|
|
|
|
|
The accompanying notes are an integral part of these consolidated financial statements.
13
Table of Contents
New Mountain Finance Holdings, L.L.C.
Consolidated Schedule of Investments (continued)
December 31, 2011
|
Portfolio Company, Location and
Industry |
|
Type of
Investment |
|
Interest Rate |
|
Maturity
Date |
|
Principal
Amount,
Par Value
or Shares |
|
Cost |
|
Fair
Value |
|
Percent of
Members’
Capital |
|
|
Merge Healthcare Inc.** |
|
|
|
|
|
|
|
|
|
|
|
|
|
|
|
|
Healthcare Services |
|
First lien (2) |
|
11.75% |
|
5/1/2015 |
|
$ |
9,000,000 |
|
$ |
8,879,303 |
|
$ |
9,585,000 |
|
2.28 |
% |
|
|
|
|
|
|
|
|
|
|
|
|
|
|
|
|
|
|
Porex Corporation |
|
|
|
|
|
|
|
|
|
|
|
|
|
|
|
|
Specialty Chemicals and Materials |
|
First lien (3) |
|
6.75% (Base Rate + 5.25%) |
|
3/31/2015 |
|
9,573,968 |
|
9,449,821 |
|
9,430,359 |
|
2.24 |
% |
|
|
|
|
|
|
|
|
|
|
|
|
|
|
|
|
|
|
Sunquest Information Systems, Inc. (Misys Hospital Systems, Inc.) |
|
|
|
|
|
|
|
|
|
|
|
|
|
|
|
|
Healthcare Services |
|
Second lien (2) |
|
9.75% (Base Rate + 8.50%) |
|
6/16/2017 |
|
9,000,000 |
|
8,840,688 |
|
8,910,000 |
|
2.12 |
% |
|
|
|
|
|
|
|
|
|
|
|
|
|
|
|
|
|
|
Mach Gen, LLC |
|
|
|
|
|
|
|
|
|
|
|
|
|
|
|
|
Power Generation |
|
Second lien (2) |
|
8.03% PIK (Base Rate + 7.50%)* |
|
2/22/2015 |
|
12,063,894 |
|
9,966,951 |
|
8,609,943 |
|
2.05 |
% |
|
|
|
|
|
|
|
|
|
|
|
|
|
|
|
|
|
|
Research Pharmaceutical Services, Inc. |
|
|
|
|
|
|
|
|
|
|
|
|
|
|
|
|
Healthcare Services |
|
First lien (3) |
|
6.75% (Base Rate + 5.24%) |
|
2/18/2017 |
|
7,453,125 |
|
7,354,306 |
|
7,192,266 |
|
1.71 |
% |
|
|
|
|
|
|
|
|
|
|
|
|
|
|
|
|
|
|
Airvana Network Solutions Inc. |
|
|
|
|
|
|
|
|
|
|
|
|
|
|
|
|
Software |
|
First lien (2) |
|
10.00% (Base Rate + 8.00%) |
|
3/25/2015 |
|
7,009,524 |
|
6,895,616 |
|
7,044,571 |
|
1.68 |
% |
|
|
|
|
|
|
|
|
|
|
|
|
|
|
|
|
|
|
Surgery Center Holdings, Inc. |
|
|
|
|
|
|
|
|
|
|
|
|
|
|
|
|
Healthcare Services |
|
First lien (3) |
|
6.50% (Base Rate + 5.00%) |
|
2/6/2017 |
|
6,947,500 |
|
6,916,695 |
|
6,478,544 |
|
1.54 |
% |
|
|
|
|
|
|
|
|
|
|
|
|
|
|
|
|
|
|
Stratus Technologies, Inc. |
|
|
|
|
|
|
|
|
|
|
|
|
|
|
|
|
Information Technology |
|
First lien (2) |
|
12.00% |
|
3/29/2015 |
|
6,827,000 |
|
6,490,139 |
|
6,212,570 |
|
1.48 |
% |
|
|
|
|
|
|
|
|
|
|
|
|
|
|
|
|
|
|
Alion Science and Technology Corporation |
|
|
|
|
|
|
|
|
|
|
|
|
|
|
|
|
Federal Services |
|
First lien (2) |
|
10.00% + 2.00% PIK* |
|
11/1/2014 |
|
6,195,238 |
|
5,613,308 |
|
5,555,066 |
|
1.32 |
% |
|
|
|
|
|
|
|
|
|
|
|
|
|
|
|
|
|
|
Datatel, Inc. |
|
|
|
|
|
|
|
|
|
|
|
|
|
|
|
|
Software |
|
Second lien (2) |
|
8.75% (Base Rate + 7.25%) |
|
2/19/2018 |
|
5,000,000 |
|
4,977,238 |
|
5,150,000 |
|
1.22 |
% |
|
|
|
|
|
|
|
|
|
|
|
|
|
|
|
|
|
|
Ozburn-Hessey Holding Company LLC |
|
|
|
|
|
|
|
|
|
|
|
|
|
|
|
|
Logistics |
|
Second lien (2) |
|
11.50% (Base Rate + 9.50%) |
|
10/8/2016 |
|
6,000,000 |
|
5,892,802 |
|
5,110,002 |
|
1.22 |
% |
|
|
|
|
|
|
|
|
|
|
|
|
|
|
|
|
|
|
Asurion, LLC (fka Asurion Corporation) |
|
|
|
|
|
|
|
|
|
|
|
|
|
|
|
|
Business Services |
|
Second lien (2) |
|
9.00% (Base Rate + 7.50%) |
|
5/24/2019 |
|
5,000,000 |
|
4,976,820 |
|
4,950,000 |
|
1.18 |
% |
|
|
|
|
|
|
|
|
|
|
|
|
|
|
|
|
|
|
Pharmaceutical Product Development, Inc. (Jaguar Holdings, LLC) |
|
|
|
|
|
|
|
|
|
|
|
|
|
|
|
|
Healthcare Services |
|
First lien (3) |
|
6.25% (Base Rate + 5.00%) |
|
12/5/2018 |
|
4,894,921 |
|
4,864,327 |
|
4,888,802 |
|
1.16 |
% |
|
|
|
|
|
|
|
|
|
|
|
|
|
|
|
|
|
|
Fibertech Networks, LLC (fka Firefox Merger Sub, LLC) |
|
|
|
|
|
|
|
|
|
|
|
|
|
|
|
|
Telecommunication |
|
First lien (3) |
|
6.75% (Base Rate + 5.00%) |
|
11/30/2016 |
|
4,897,632 |
|
4,835,069 |
|
4,873,144 |
|
1.16 |
% |
|
|
|
|
|
|
|
|
|
|
|
|
|
|
|
|
|
|
LVI Services Inc. |
|
|
|
|
|
|
|
|
|
|
|
|
|
|
|
|
Industrial Services |
|
First lien (2) |
|
9.25% (Base Rate + 7.50%) |
|
3/31/2014 |
|
5,120,334 |
|
4,474,056 |
|
3,725,043 |
|
0.89 |
% |
|
|
|
|
|
|
|
|
|
|
|
|
|
|
|
|
|
|
ATI Acquisition Company (fka Ability Acquisition, Inc.) |
|
|
|
|
|
|
|
|
|
|
|
|
|
|
|
|
Education |
|
First lien (2) |
|
12.25% (Base Rate + 5.00% + 4.00% PIK)(5)* |
|
12/30/2014 |
|
4,477,810 |
|
4,351,747 |
|
783,617 |
|
|
|
|
|
|
First lien (2) |
|
17.25% (Base Rate + 10.00% + 4.00% PIK)* |
|
6/30/2012 |
|
91,696 |
|
91,696 |
|
91,696 |
|
|
|
|
|
|
First lien (2) |
|
17.25% (Base Rate + 10.00% + 4.00% PIK)* |
|
6/30/2012 |
|
1,484,370 |
|
1,484,370 |
|
1,484,370 |
|
|
|
|
|
|
|
|
|
|
|
|
6,053,876 |
|
5,927,813 |
|
2,359,683 |
|
0.56 |
% |
|
|
|
|
|
|
|
|
|
|
|
|
|
|
|
|
|
|
Total Funded Debt Investments |
|
|
|
|
|
|
|
$ |
727,364,649 |
|
$ |
702,801,889 |
|
$ |
702,587,965 |
|
167.08 |
% |
The accompanying notes are an integral part of these consolidated financial statements.
14
Table of Contents
New Mountain Finance Holdings, L.L.C.
Consolidated Schedule of Investments (continued)
December 31, 2011
|
Portfolio Company, Location and
Industry |
|
Type of
Investment |
|
Interest Rate |
|
Maturity
Date |
|
Principal
Amount,
Par Value
or Shares |
|
Cost |
|
Fair
Value |
|
Percent of
Members’
Capital |
|
|
Equity—United States |
|
|
|
|
|
|
|
|
|
|
|
|
|
|
|
|
Stratus Technologies, Inc. |
|
|
|
|
|
|
|
|
|
|
|
|
|
|
|
|
Information Technology |
|
Ordinary shares (2) |
|
— |
|
— |
|
144,270 |
|
$ |
65,123 |
|
$ |
29,881 |
|
|
|
|
|
|
Preferred shares (2) |
|
— |
|
— |
|
32,830 |
|
14,819 |
|
6,800 |
|
|
|
|
|
|
|
|
|
|
|
|
|
|
79,942 |
|
36,681 |
|
0.01 |
% |
|
|
|
|
|
|
|
|
|
|
|
|
|
|
|
|
|
|
Global Knowledge Training LLC |
|
|
|
|
|
|
|
|
|
|
|
|
|
|
|
|
Education |
|
Ordinary shares (2) |
|
— |
|
— |
|
2 |
|
2,109 |
|
2,109 |
|
|
|
|
|
|
Preferred shares (2) |
|
— |
|
— |
|
2,423 |
|
2,422,891 |
|
2,422,891 |
|
|
|
|
|
|
|
|
|
|
|
|
|
|
2,425,000 |
|
2,425,000 |
|
0.58 |
% |
|
|
|
|
|
|
|
|
|
|
|
|
|
|
|
|
|
|
Total Shares |
|
|
|
|
|
|
|
|
|
$ |
2,504,942 |
|
$ |
2,461,681 |
|
0.59 |
% |
|
|
|
|
|
|
|
|
|
|
|
|
|
|
|
|
|
|
Warrants—United States |
|
|
|
|
|
|
|
|
|
|
|
|
|
|
|
|
Alion Science and Technology Corporation |
|
|
|
|
|
|
|
|
|
|
|
|
|
|
|
|
Federal Services |
|
Warrants (2) |
|
— |
|
— |
|
6,000 |
|
$ |
292,851 |
|
$ |
244,237 |
|
0.06 |
% |
|
|
|
|
|
|
|
|
|
|
|
|
|
|
|
|
|
|
PODS, Inc.(6) |
|
|
|
|
|
|
|
|
|
|
|
|
|
|
|
|
Storapod Holding Company, Inc. |
|
|
|
|
|
|
|
|
|
|
|
|
|
|
|
|
Consumer Services |
|
Warrants (2) |
|
— |
|
— |
|
298,398 |
|
129,181 |
|
129,181 |
|
0.03 |
% |
|
|
|
|
|
|
|
|
|
|
|
|
|
|
|
|
|
|
Learning Care Group (US), Inc. |
|
|
|
|
|
|
|
|
|
|
|
|
|
|
|
|
Education |
|
Warrants (2) |
|
— |
|
— |
|
844 |
|
193,850 |
|
14,372 |
|
0.00 |
% |
|
|
|
|
|
|
|
|
|
|
|
|
|
|
|
|
|
|
Total Warrants |
|
|
|
|
|
|
|
|
|
$ |
615,882 |
|
$ |
387,790 |
|
0.09 |
% |
|
|
|
|
|
|
|
|
|
|
|
|
|
|
|
|
|
|
Total Funded Investments |
|
|
|
|
|
|
|
|
|
$ |
705,922,713 |
|
$ |
705,437,436 |
|
167.76 |
% |
|
|
|
|
|
|
|
|
|
|
|
|
|
|
|
|
|
|
Unfunded Debt Investments—United States |
|
|
|
|
|
|
|
|
|
|
|
|
|
|
|
|
Datatel, Inc. |
|
|
|
|
|
|
|
|
|
|
|
|
|
|
|
|
Software |
|
Subordinated—Bridge (1)(2) |
|
— |
|
12/13/2012 |
|
$ |
20,000,000 |
|
$ |
— |
|
$ |
— |
|
0.00 |
% |
|
|
|
|
|
|
|
|
|
|
|
|
|
|
|
|
|
|
Physio-Control International, Inc. |
|
|
|
|
|
|
|
|
|
|
|
|
|
|
|
|
Healthcare Products |
|
First lien—Bridge (1)(2) |
|
— |
|
— |
|
15,000,000 |
|
— |
|
— |
|
0.00 |
% |
|
|
|
|
|
|
|
|
|
|
|
|
|
|
|
|
|
|
ATI Acquisition Company (fka Ability Acquisition, Inc.) |
|
|
|
|
|
|
|
|
|
|
|
|
|
|
|
|
Education |
|
First lien (1)(2)—Undrawn |
|
— |
|
1/1/2012 |
|
39,947 |
|
— |
|
— |
|
|
|
|
|
|
First lien (1)(2)—Undrawn |
|
— |
|
1/1/2012 |
|
865 |
|
— |
|
— |
|
|
|
|
|
|
|
|
|
|
|
|
40,812 |
|
— |
|
— |
|
0.00 |
% |
|
|
|
|
|
|
|
|
|
|
|
|
|
|
|
|
|
|
PODS, Inc.(6) |
|
|
|
|
|
|
|
|
|
|
|
|
|
|
|
|
Consumer Services |
|
|
|
|
|
|
|
|
|
|
|
|
|
|
|
|
PODS Funding Corp. II |
|
First lien (1)(2)—Undrawn |
|
— |
|
11/29/2016 |
|
3,438,462 |
|
(103,154 |
) |
(103,154 |
) |
|
|
|
Storapod Holding Company, Inc. |
|
Subordinated (1)(2)—Undrawn |
|
— |
|
11/29/2017 |
|
771,358 |
|
— |
|
— |
|
|
|
|
|
|
|
|
|
|
|
|
4,209,820 |
|
(103,154 |
) |
(103,154 |
) |
(0.03 |
)% |
|
|
|
|
|
|
|
|
|
|
|
|
|
|
|
|
|
|
RGIS Services, LLC |
|
|
|
|
|
|
|
|
|
|
|
|
|
|
|
|
Business Services |
|
First lien (2)(4)—Undrawn |
|
— |
|
4/30/2013 |
|
5,000,000 |
|
(2,850,000 |
) |
(293,850 |
) |
(0.07 |
)% |
|
|
|
|
|
|
|
|
|
|
|
|
|
|
|
|
|
|
Education Management LLC** |
|
|
|
|
|
|
|
|
|
|
|
|
|
|
|
|
Education |
|
First lien (2)(4)—Undrawn |
|
— |
|
6/1/2012 |
|
3,000,000 |
|
(1,215,000 |
) |
(330,000 |
) |
(0.08 |
)% |
|
|
|
|
|
|
|
|
|
|
|
|
|
|
|
|
|
|
Kronos Incorporated |
|
|
|
|
|
|
|
|
|
|
|
|
|
|
|
|
Software |
|
First lien (2)(4)—Undrawn |
|
— |
|
6/11/2013 |
|
4,198,500 |
|
(629,775 |
) |
(356,872 |
) |
(0.08 |
)% |
|
|
|
|
|
|
|
|
|
|
|
|
|
|
|
|
|
|
|
The accompanying notes are an integral part of these consolidated financial statements.
15
Table of Contents
New Mountain Finance Holdings, L.L.C.
Consolidated Schedule of Investments (continued)
December 31, 2011
|
Portfolio Company, Location and
Industry |
|
Type of
Investment |
|
Interest Rate |
|
Maturity
Date |
|
Principal
Amount,
Par Value
or Shares |
|
Cost |
|
Fair
Value |
|
Percent of
Members’
Capital |
|
|
Advantage Sales & Marketing Inc. |
|
|
|
|
|
|
|
|
|
|
|
|
|
|
|
|
Business Services |
|
First lien (2)(4)—Undrawn |
|
— |
|
12/17/2015 |
|
$ |
10,500,000 |
|
$ |
(1,260,000 |
) |
$ |
(840,000 |
) |
(0.20 |
)% |
|
|
|
|
|
|
|
|
|
|
|
|
|
|
|
|
|
|
Total Unfunded Debt Investments |
|
|
|
|
|
|
|
$ |
61,949,132 |
|
$ |
(6,057,929 |
) |
$ |
(1,923,876 |
) |
(0.46 |
)% |
|
|
|
|
|
|
|
|
|
|
|
|
|
|
|
|
|
|
Total Investments |
|
|
|
|
|
|
|
|
|
$ |
699,864,784 |
|
$ |
703,513,560 |
|
167.30 |
% |
|
(1) |
Par Value amounts represent the drawn or undrawn (as indicated in type of investment) portion of the bridge facility, delayed draw or other future funding commitments. |
|
|
|
|
(2) |
The Holdings Credit Facility is collateralized by the indicated investments. |
|
|
|
|
(3) |
The SLF Credit Facility is collateralized by the indicated investments. |
|
|
|
|
(4) |
Par Value amounts represent the drawn or undrawn (as indicated in type of investment) portion of revolving credit facilities. Cost amounts represent the cash received at settlement date net the impact of paydowns and cash paid for drawn revolvers. |
|
|
|
|
(5) |
Investment is on non-accrual status. |
|
|
|
|
(6) |
New Mountain Finance Holdings, L.L.C. (“NMF Holdings”) holds investments in two related entities of PODS, Inc. NMF Holdings directly holds warrants in Storapod Holding Company, Inc. (“Storapod”) and has a credit investment in Storapod through Storapod WCF II Limited (“Storapod WCF II”). Storapod WCF II is a special purpose entity used to enter into a Shari’ah- compliant financing arrangement with Storapod. Additionally, NMF Holdings has a credit investment in PODS Funding Corp. II (“PODS II”). PODS, Inc. is a wholly-owned subsidiary of PODS Holding, Inc., which in turn is a majority- owned subsidiary of Storapod. PODS II is a special purpose entity used to enter into a Shari’ah-compliant financing arrangement with PODS, Inc. and its subsidiary, PODS Enterprises, Inc. |
|
|
|
|
(7) |
Securities are exempt from registration under Rule 144A of the Securities Act of 1933. These securities are considered liquid and may be resold in transactions exempt from registration to qualified institutional buyers. At December 31, 2011, the aggregate market value of these securities amounted to $15,877,500 or 3.78% of members’ capital. |
|
|
|
|
* |
All or a portion of interest contains payments-in-kind (“PIK”). |
|
|
|
|
** |
Indicates assets that NMF Holdings deems to be “non-qualifying assets” under Section 55(a) of the Investment Company Act of 1940, as amended. Qualifying assets must represent at least 70.00% of NMF Holdings’ total assets at the time of acquisition of any additional non-qualifying assets. |
The accompanying notes are an integral part of these consolidated financial statements.
16
Table of Contents
New Mountain Finance Holdings, L.L.C.
Consolidated Schedule of Investments (continued)
December 31, 2011
|
|
|
December 31, 2011 |
|
|
Investment Type |
|
Percent of Total
Investments at Fair Value |
|
|
First lien |
|
58.32 |
% |
|
Second lien |
|
37.34 |
% |
|
Subordinated |
|
3.93 |
% |
|
Equity and other |
|
0.41 |
% |
|
Total investments |
|
100.00 |
% |
|
|
|
December 31, 2011 |
|
|
Industry Type |
|
Percent of Total
Investments at Fair Value |
|
|
Software |
|
22.12 |
% |
|
Healthcare Services |
|
16.71 |
% |
|
Education |
|
14.47 |
% |
|
Business Services |
|
10.86 |
% |
|
Federal Services |
|
10.05 |
% |
|
Consumer Services |
|
4.23 |
% |
|
Information Services |
|
4.21 |
% |
|
Healthcare Products |
|
3.54 |
% |
|
Logistics |
|
3.50 |
% |
|
Industrial Services |
|
2.49 |
% |
|
Healthcare Information Technology |
|
2.01 |
% |
|
Media |
|
1.67 |
% |
|
Specialty Chemicals and Materials |
|
1.34 |
% |
|
Power Generation |
|
1.22 |
% |
|
Information Technology |
|
0.89 |
% |
|
Telecommunication |
|
0.69 |
% |
|
Total investments |
|
100.00 |
% |
The accompanying notes are an integral part of these consolidated financial statements.
17
Table of Contents
New Mountain Finance Corporation
Statement of Assets and Liabilities
|
|
|
June 30, 2012 |
|
December 31, 2011 |
|
|
|
|
(unaudited) |
|
|
|
|
Assets |
|
|
|
|
|
|
Investment in New Mountain Finance Holdings, L.L.C., at fair value (cost of $144,355,856 and $144,355,856, respectively) |
|
$ |
147,989,318 |
|
$ |
145,486,821 |
|
|
Total assets |
|
$ |
147,989,318 |
|
$ |
145,486,821 |
|
|
Net assets |
|
|
|
|
|
|
Common stock, par value $0.01 per share 10,697,691 shares issued and outstanding |
|
106,977 |
|
106,977 |
|
|
Paid in capital in excess of par |
|
144,248,879 |
|
144,248,879 |
|
|
Undistributed net investment income |
|
398,657 |
|
— |
|
|
Accumulated undistributed net realized gains |
|
2,315,250 |
|
286,307 |
|
|
Net unrealized appreciation (depreciation) |
|
919,555 |
|
844,658 |
|
|
Total net assets |
|
$ |
147,989,318 |
|
$ |
145,486,821 |
|
|
Number of shares outstanding |
|
10,697,691 |
|
10,697,691 |
|
|
Net asset value per share |
|
$ |
13.83 |
|
$ |
13.60 |
|
The accompanying notes are an integral part of these financial statements.
18
Table of Contents
New Mountain Finance Corporation
Statement of Operations
(unaudited)
|
|
|
Three months
ended |
|
From May 19, 2011
(commencement of
operations) to |
|
Six months
ended |
|
From May 19, 2011
(commencement of
operations) to |
|
|
|
|
June 30, 2012 |
|
June 30, 2011 |
|
June 30, 2012 |
|
June 30, 2011 |
|
|
Net investment income allocated from New Mountain Finance Holdings, L.L.C. |
|
|
|
|
|
|
|
|
|
|
Interest income |
|
$ |
6,962,593 |
|
$ |
2,423,593 |
|
$ |
13,398,301 |
|
$ |
2,423,593 |
|
|
Other income |
|
60,540 |
|
105,921 |
|
206,136 |
|
105,921 |
|
|
Total expenses |
|
(2,993,721 |
) |
(945,385 |
) |
(6,145,304 |
) |
(945,385 |
) |
|
Net investment income allocated from New Mountain Finance Holdings, L.L.C. |
|
4,029,412 |
|
1,584,129 |
|
7,459,133 |
|
1,584,129 |
|
|
Net realized and unrealized gain (loss) allocated from New Mountain Finance Holdings, L.L.C. |
|
|
|
|
|
|
|
|
|
|
Net realized gains (losses) on investments |
|
4,140,892 |
|
(139,087 |
) |
4,489,412 |
|
(139,087 |
) |
|
Net change in unrealized (depreciation) appreciation of investments |
|
(4,335,157 |
) |
380,661 |
|
74,897 |
|
380,661 |
|
|
Net realized and unrealized (loss) gain allocated from New Mountain Finance Holdings, L.L.C. |
|
(194,265 |
) |
241,574 |
|
4,564,309 |
|
241,574 |
|
|
Total net increase in net assets resulting from operations allocated from New Mountain Finance Holdings, L.L.C. |
|
3,835,147 |
|
1,825,703 |
|
12,023,442 |
|
1,825,703 |
|
|
Unrealized appreciation in New Mountain Finance Holdings, L.L.C. resulting from public offering price |
|
— |
|
6,220,520 |
|
— |
|
6,220,520 |
|
|
Net increase in net assets resulting from operations |
|
$ |
3,835,147 |
|
$ |
8,046,223 |
|
$ |
12,023,442 |
|
$ |
8,046,223 |
|
|
Basic earnings per share |
|
$ |
0.36 |
|
$ |
0.75 |
|
$ |
1.12 |
|
$ |
0.75 |
|
|
Weighted average shares of common stock outstanding—basic (See Note 11) |
|
10,697,691 |
|
10,697,691 |
|
10,697,691 |
|
10,697,691 |
|
|
Diluted earnings per share |
|
$ |
0.36 |
|
$ |
0.17 |
|
$ |
1.12 |
|
$ |
0.17 |
|
|
Weighted average shares of common stock outstanding—diluted (See Note 11) |
|
30,919,629 |
|
30,919,629 |
|
30,919,629 |
|
30,919,629 |
|
The accompanying notes are an integral part of these financial statements.
19
Table of Contents
New Mountain Finance Corporation
Statement of Changes in Net Assets
(unaudited)
|
|
|
Six months ended |
|
From May 19, 2011
(commencement of
operations) to |
|
|
|
|
June 30, 2012 |
|
June 30, 2011 |
|
|
Increase (decrease) in net assets resulting from operations allocated from New Mountain Finance Holdings, L.L.C.: |
|
|
|
|
|
|
Net investment income |
|
$ |
7,459,133 |
|
$ |
1,584,129 |
|
|
Net realized gains (losses) on investments |
|
4,489,412 |
|
(139,087 |
) |
|
Net change in unrealized appreciation of investments |
|
74,897 |
|
380,661 |
|
|
Total net increase in net assets resulting from operations allocated from New Mountain Finance Holdings, L.L.C. |
|
12,023,442 |
|
1,825,703 |
|
|
Unrealized appreciation in New Mountain Finance Holdings, L.L.C. resulting from public offering price |
|
— |
|
6,220,520 |
|
|
Total net increase in net assets resulting from operations |
|
12,023,442 |
|
8,046,223 |
|
|
Capital transactions |
|
|
|
|
|
|
Proceeds from shares sold |
|
— |
|
129,864,996 |
|
|
Deferred offering costs allocated from New Mountain Finance Holdings, L.L.C. |
|
— |
|
(3,958,378 |
) |
|
Contributions from exchanged shares |
|
— |
|
18,489,457 |
|
|
Dividends declared |
|
(9,520,945 |
) |
— |
|
|
Total net (decrease) increase in net assets resulting from capital transactions |
|
(9,520,945 |
) |
144,396,075 |
|
|
Net increase in net assets |
|
2,502,497 |
|
152,442,298 |
|
|
Net assets at beginning of period |
|
145,486,821 |
|
— |
|
|
Net assets at end of period |
|
$ |
147,989,318 |
|
$ |
152,442,298 |
|
The accompanying notes are an integral part of these financial statements.
20
Table of Contents
New Mountain Finance Corporation
Statement of Cash Flows
(unaudited)
|
|
|
Six months ended |
|
From May 19, 2011
(commencement of
operations) to |
|
|
|
|
June 30, 2012 |
|
June 30, 2011 |
|
|
Cash flows from operating activities |
|
|
|
|
|
|
Net increase in net assets resulting from operations |
|
$ |
12,023,442 |
|
$ |
8,046,223 |
|
|
Adjustments to reconcile net (increase) decrease in net assets resulting from operations to net cash (used in) provided by operating activities: |
|
|
|
|
|
|
Net investment income allocated from New Mountain Finance Holdings, L.L.C. |
|
(7,459,133 |
) |
(1,584,129 |
) |
|
Net realized and unrealized gains allocated from New Mountain Finance Holdings, L.L.C. |
|
(4,564,309 |
) |
(241,574 |
) |
|
Unrealized appreciation in New Mountain Finance Holdings, L.L.C. resulting from public offering price |
|
— |
|
(6,220,520 |
) |
|
(Increase) decrease in operating assets: |
|
|
|
|
|
|
Purchase of investment |
|
— |
|
(129,864,996 |
) |
|
Distribution from New Mountain Finance Holdings, L.L.C. |
|
9,520,945 |
|
— |
|
|
Net cash flows provided (used in) by operating activities |
|
9,520,945 |
|
(129,864,996 |
) |
|
Cash flows from financing activities |
|
|
|
|
|
|
Proceeds from shares sold |
|
— |
|
129,864,996 |
|
|
Dividends paid |
|
(9,520,945 |
) |
— |
|
|
Net cash flows (used in) provided by financing activities |
|
(9,520,945 |
) |
129,864,996 |
|
|
Net increase (decrease) in cash and cash equivalents |
|
— |
|
— |
|
|
Cash and cash equivalents at the beginning of the period |
|
— |
|
— |
|
|
Cash and cash equivalents at the end of the period |
|
$ |
— |
|
$ |
— |
|
|
Non-cash financing activities: |
|
|
|
|
|
|
New Mountain Guardian Partners, L.P. exchange of New Mountain Finance Holdings, L.L.C. units for shares |
|
$ |
— |
|
$ |
18,489,457 |
|
|
Deferred offering costs allocated from New Mountain Finance Holdings, L.L.C. |
|
— |
|
(3,958,378 |
) |
The accompanying notes are an integral part of these financial statements.
21
Table of Contents
New Mountain Finance AIV Holdings Corporation
Statement of Assets and Liabilities
|
|
|
June 30, 2012 |
|
December 31, 2011 |
|
|
|
|
(unaudited) |
|
|
|
|
Assets |
|
|
|
|
|
|
Investment in New Mountain Finance Holdings, L.L.C., at fair value (cost of $290,847,952 and $290,847,952, respectively) |
|
$ |
279,745,491 |
|
$ |
275,014,997 |
|
|
Distribution receivable from New Mountain Finance Holdings, L.L.C. |
|
6,875,459 |
|
— |
|
|
Total assets |
|
$ |
286,620,950 |
|
$ |
275,014,997 |
|
|
Liabilities |
|
|
|
|
|
|
Dividends payable |
|
6,875,459 |
|
— |
|
|
Total liabilities |
|
6,875,459 |
|
— |
|
|
Net assets |
|
|
|
|
|
|
Common stock, par value $0.01 per share 100 shares issued and outstanding |
|
1 |
|
1 |
|
|
Paid in capital in excess of par |
|
292,383,201 |
|
292,383,201 |
|
|
Undistributed net investment income |
|
753,586 |
|
— |
|
|
Accumulated undistributed net realized gains / distributions in excess of net realized gains |
|
2,841,295 |
|
(994,034 |
) |
|
Net unrealized (depreciation) appreciation |
|
(16,232,592 |
) |
(16,374,171 |
) |
|
Total net assets |
|
279,745,491 |
|
275,014,997 |
|
|
Total liabilities and net assets |
|
$ |
286,620,950 |
|
$ |
275,014,997 |
|
The accompanying notes are an integral part of these financial statements.
22
Table of Contents
New Mountain Finance AIV Holdings Corporation
Statement of Operations
(unaudited)
|
|
|
Three months
ended |
|
From May 19, 2011
(commencement of
operations) to |
|
Six months
ended |
|
From May 19, 2011
(commencement of
operations) to |
|
|
|
|
June 30, 2012 |
|
June 30, 2011 |
|
June 30, 2012 |
|
June 30, 2011 |
|
|
Net investment income allocated from New Mountain Finance Holdings, L.L.C. |
|
|
|
|
|
|
|
|
|
|
Interest income |
|
$ |
13,161,450 |
|
$ |
4,581,339 |
|
$ |
25,326,925 |
|
$ |
4,581,339 |
|
|
Other income |
|
114,440 |
|
200,223 |
|
389,662 |
|
200,223 |
|
|
Total expenses |
|
(5,659,057 |
) |
(1,787,065 |
) |
(11,616,522 |
) |
(1,787,065 |
) |
|
Net investment income allocated from New Mountain Finance Holdings, L.L.C. |
|
7,616,833 |
|
2,994,497 |
|
14,100,065 |
|
2,994,497 |
|
|
Net realized and unrealized gain (loss) allocated from New Mountain Finance Holdings, L.L.C. |
|
|
|
|
|
|
|
|
|
|
Net realized gains (losses) on investments |
|
7,827,562 |
|
(262,916 |
) |
8,486,375 |
|
(262,916 |
) |
|
Net change in unrealized (depreciation) appreciation of investments |
|
(8,194,782 |
) |
719,567 |
|
141,579 |
|
719,567 |
|
|
Net realized and unrealized (loss) gain allocated from New Mountain Finance Holdings, L.L.C. |
|
(367,220 |
) |
456,651 |
|
8,627,954 |
|
456,651 |
|
|
Total net increase in net assets resulting from operations allocated from New Mountain Finance Holdings, L.L.C. |
|
7,249,613 |
|
3,451,148 |
|
22,728,019 |
|
3,451,148 |
|
|
Unrealized depreciation in New Mountain Finance Holdings, L.L.C. resulting from public offering price |
|
— |
|
(6,212,133 |
) |
— |
|
(6,212,133 |
) |
|
Net increase (decrease) in net assets resulting from operations |
|
$ |
7,249,613 |
|
$ |
(2,760,985 |
) |
$ |
22,728,019 |
|
$ |
(2,760,985 |
) |
The accompanying notes are an integral part of these financial statements.
23
Table of Contents
New Mountain Finance AIV Holdings Corporation
Statement of Changes in Net Assets
(unaudited)
|
|
|
Six months ended |
|
From May 19, 2011
(commencement of
operations) to |
|
|
|
|
June 30, 2012 |
|
June 30, 2011 |
|
|
Increase (decrease) in net assets resulting from operations allocated from New Mountain Finance Holdings, L.L.C.: |
|
|
|
|
|
|
Net investment income |
|
$ |
14,100,065 |
|
$ |
2,994,497 |
|
|
Net realized gains (losses) on investments |
|
8,486,375 |
|
(262,916 |
) |
|
Net change in unrealized appreciation of investments |
|
141,579 |
|
719,567 |
|
|
Total net increase in net assets resulting from operations allocated from New Mountain Finance Holdings, L.L.C. |
|
22,728,019 |
|
3,451,148 |
|
|
Unrealized depreciation in New Mountain Finance Holdings, L.L.C. resulting from public offering price |
|
— |
|
(6,212,133 |
) |
|
Total net increase (decrease) in net assets resulting from operations |
|
22,728,019 |
|
(2,760,985 |
) |
|
Capital transactions |
|
|
|
|
|
|
Deferred offering costs allocated from New Mountain Finance Holdings, L.L.C. |
|
— |
|
(7,482,550 |
) |
|
Contributions from exchanged shares |
|
— |
|
298,406,533 |
|
|
Dividends declared |
|
(17,997,525 |
) |
— |
|
|
Total net (decrease) increase in net assets resulting from capital transactions |
|
(17,997,525 |
) |
290,923,983 |
|
|
Net increase in net assets |
|
4,730,494 |
|
288,162,998 |
|
|
Net assets at beginning of period |
|
275,014,997 |
|
— |
|
|
Net assets at end of period |
|
$ |
279,745,491 |
|
$ |
288,162,998 |
|
The accompanying notes are an integral part of these financial statements.
24
Table of Contents
New Mountain Finance AIV Holdings Corporation
Statement of Cash Flows
(unaudited)
|
|
|
Six months ended |
|
From May 19, 2011
(commencement of
operations) to |
|
|
|
|
June 30, 2012 |
|
June 30, 2011 |
|
|
Cash flows from operating activities |
|
|
|
|
|
|
Net increase (decrease) in net assets resulting from operations |
|
$ |
22,728,019 |
|
$ |
(2,760,985 |
) |
|
Adjustments to reconcile net (increase) decrease in net assets resulting from operations to net cash (used in) provided by operating activities: |
|
|
|
|
|
|
Net investment income allocated from New Mountain Finance Holdings, L.L.C. |
|
(14,100,065 |
) |
(2,994,497 |
) |
|
Net realized and unrealized gains allocated from New Mountain Finance Holdings, L.L.C. |
|
(8,627,954 |
) |
(456,651 |
) |
|
Unrealized depreciation in New Mountain Finance Holdings, L.L.C. resulting from public offering price |
|
— |
|
6,212,133 |
|
|
(Increase) decrease in operating assets: |
|
|
|
|
|
|
Distribution from New Mountain Finance Holdings, L.L.C. |
|
11,122,066 |
|
— |
|
|
Net cash flows provided (used in) by operating activities |
|
11,122,066 |
|
— |
|
|
Cash flows from financing activities |
|
|
|
|
|
|
Dividends paid |
|
(11,122,066 |
) |
— |
|
|
Net cash flows (used in) provided by financing activities |
|
(11,122,066 |
) |
— |
|
|
Net increase (decrease) in cash and cash equivalents |
|
— |
|
— |
|
|
Cash and cash equivalents at the beginning of the period |
|
— |
|
— |
|
|
Cash and cash equivalents at the end of the period |
|
$ |
— |
|
$ |
— |
|
|
Non-cash operating activities: |
|
|
|
|
|
|
Distribution receivable from New Mountain Finance Holdings, L.L.C. |
|
$ |
6,875,459 |
|
$ |
— |
|
|
Non-cash financing activities: |
|
|
|
|
|
|
Dividends declared and payable |
|
$ |
(6,875,459 |
) |
$ |
— |
|
|
New Mountain Guardian AIV, L.P. contribution of New Mountain Finance Holdings, L.L.C. units for shares of New Mountain Finance AIV Holdings, L.L.C. |
|
— |
|
298,406,533 |
|
|
Deferred offering costs allocated from New Mountain Finance Holdings, L.L.C. |
|
— |
|
(7,482,550 |
) |
The accompanying notes are an integral part of these financial statements.
25
Table of Contents
Combined Notes to the Consolidated Financial Statements of New Mountain Finance Holdings, L.L.C.,
the Financial Statements of New Mountain Finance Corporation, and the Financial Statements
of New Mountain Finance AIV Holdings Corporation
June 30, 2012
(unaudited)
The information in these combined notes to the financial statements relates to each of the three separate registrants: New Mountain Finance Holdings, L.L.C., New Mountain Finance Corporation and New Mountain Finance AIV Holdings Corporation (collectively, the “Companies”). Information that relates to an individual registrant will be specifically referenced by the respective company. None of the Companies makes any representation as to the information related solely to the other registrants other than itself.
Note 1. Formation and Business Purpose
New Mountain Finance Holdings, L.L.C. (“NMF Holdings”, the “Operating Company” or the “Master Fund”) is a Delaware limited liability company. NMF Holdings is externally managed and has elected to be treated as a business development company (“BDC”) under the Investment Company Act of 1940, as amended (the “1940 Act”). As such, NMF Holdings is obligated to comply with certain regulatory requirements. NMF Holdings intends to be treated as a partnership for federal income tax purposes for so long as it has at least two members.
NMF Holdings is externally managed by New Mountain Finance Advisers BDC, L.L.C. (the “Investment Adviser”). New Mountain Finance Administration, L.L.C. (the “Administrator”) provides the administrative services necessary for operations. The Investment Adviser and Administrator are wholly-owned subsidiaries of New Mountain Capital (defined as New Mountain Capital Group, L.L.C. and its affiliates). New Mountain Capital is a firm with a track record of investing in the middle market and with assets under management (which includes amounts committed, not all of which have been drawn down and invested to date) totaling approximately $9.0 billion as of June 30, 2012. New Mountain Capital focuses on investing in defensive growth companies across its private equity, public equity, and credit investment vehicles. NMF Holdings, formerly known as New Mountain Guardian (Leveraged), L.L.C., was originally formed as a subsidiary of New Mountain Guardian AIV, L.P. (“Guardian AIV”) by New Mountain Capital in October 2008. Guardian AIV was formed through an allocation of approximately $300.0 million of the $5.1 billion of commitments supporting New Mountain Partners III, L.P., a private equity fund managed by New Mountain Capital. In February 2009, New Mountain Capital formed a co-investment vehicle, New Mountain Guardian Partners, L.P., comprising $20.4 million of commitments. New Mountain Guardian (Leveraged), L.L.C. and New Mountain Guardian Partners, L.P., together with their respective direct and indirect wholly-owned subsidiaries, are defined as the “Predecessor Entities”.
New Mountain Finance Corporation (“NMFC”) is a Delaware corporation that was originally incorporated on June 29, 2010. NMFC is a closed-end, non-diversified management investment company that has elected to be treated as a BDC under the 1940 Act. As such, NMFC is obligated to comply with certain regulatory requirements. NMFC intends to be treated, and intends to comply with the requirements to qualify annually, as a regulated investment company (“RIC”) under Subchapter M of the Internal Revenue Code of 1986, as amended, (the “Code”) commencing with its taxable year ending on December 31, 2011.
New Mountain Finance AIV Holdings Corporation (“AIV Holdings”) is a Delaware corporation that was originally incorporated on March 11, 2011. Guardian AIV, a Delaware limited partnership, is AIV Holdings’ sole stockholder. AIV Holdings is a closed-end, non-diversified management investment company that has elected to be treated as a BDC under the 1940 Act. As such, AIV Holdings is obligated to comply with certain regulatory requirements. AIV Holdings intends to be treated, and intends to comply with the requirements to qualify annually, as a RIC under the Code commencing with its taxable year ending on December 31, 2011.
On May 19, 2011, NMFC priced its initial public offering (the “IPO”) of 7,272,727 shares of common stock at a public offering price of $13.75 per share. Concurrently with the closing of the IPO and at the public offering price of $13.75 per share, NMFC sold an additional 2,172,000 shares of its common stock to certain executives and employees of, and other individuals affiliated with, New Mountain Capital in a concurrent private placement (the “Concurrent Private Placement”). Additionally, 1,252,964 shares were issued to the limited partners of New Mountain Guardian Partners, L.P. at that time for their ownership interest in the Predecessor Entities. In connection with NMFC’s IPO and through a series of transactions, NMF Holdings owns all of the operations of the Predecessor Entities, including all of the assets and liabilities related to such operations.
NMFC and AIV Holdings are holding companies with no direct operations of their own, and their sole asset is their ownership in NMF Holdings. NMFC and AIV Holdings each entered into a joinder agreement with respect to the Limited Liability Company Agreement, as amended and restated, of NMF Holdings, pursuant to which NMFC and AIV Holdings were admitted as members of NMF Holdings. NMFC acquired from NMF Holdings, with the gross proceeds of the IPO and the Concurrent Private
26
Table of Contents
Placement, common membership units (“units”) of NMF Holdings (the number of units are equal to the number of shares of NMFC’s common stock sold in the IPO and the Concurrent Private Placement). Additionally, NMFC received units of NMF Holdings equal to the number of shares of common stock of NMFC issued to the limited partners of New Mountain Guardian Partners, L.P. Guardian AIV was the parent of NMF Holdings prior to the IPO and, as a result of the transactions completed in connection with the IPO, obtained units in NMF Holdings. Guardian AIV contributed its units in NMF Holdings to its newly formed subsidiary, AIV Holdings, in exchange for common stock of AIV Holdings. AIV Holdings has the right to exchange all or any portion of its units in NMF Holdings for shares of NMFC’s common stock on a one-for-one basis.
As of June 30, 2012, NMFC and AIV Holdings own approximately 34.6% and 65.4%, respectively, of the units of NMF Holdings.
The current structure was designed to generally prevent NMFC from being allocated taxable income with respect to unrecognized gains that existed at the time of the IPO in the Predecessor Entities’ assets, and rather such amounts would be allocated generally to AIV Holdings. The result is that any distributions made to NMFC’s stockholders that are attributable to such gains generally will not be treated as taxable dividends but rather as return of capital.
The diagram below depicts the Companies’ current organizational structure.
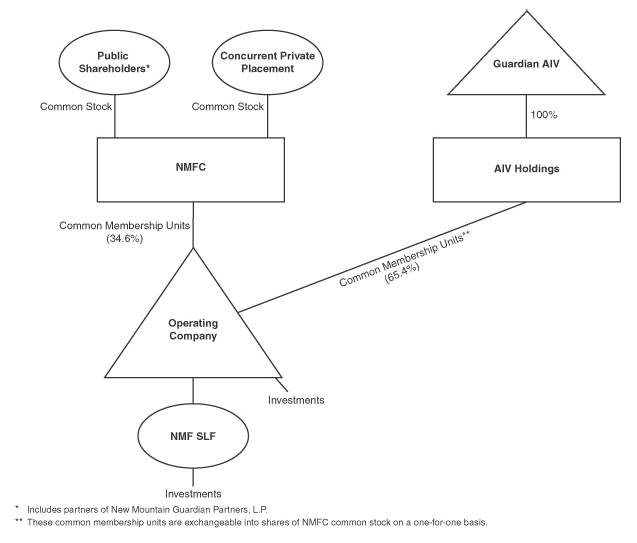
NMF Holdings’ investment objective is to generate current income and capital appreciation through the sourcing and origination of debt securities at all levels of the capital structure, including first and second lien debt, notes, bonds and mezzanine securities. In some cases, NMF Holdings’ investments may also include equity interests. The primary focus is in the debt of defensive growth companies, which are defined as generally exhibiting the following characteristics: (i) sustainable secular growth drivers,
27
Table of Contents
(ii) high barriers to competitive entry, (iii) high free cash flow after capital expenditure and working capital needs, (iv) high returns on assets and (v) opportunities for niche market dominance.
Note 2. Summary of Significant Accounting Policies
Basis of accounting—The Companies’ financial statements have been prepared in conformity with accounting principles generally accepted in the United States of America (“GAAP”). NMF Holdings consolidates its wholly-owned subsidiary, New Mountain Finance SPV Funding, L.L.C. (“NMF SLF”). NMFC and AIV Holdings do not consolidate the Operating Company. NMFC and AIV Holdings apply investment company master-feeder financial statement presentation, as described in Accounting Standards Codification 946, Financial Services—Investment Companies, (“ASC 946”) to their interest in the Operating Company. NMFC and AIV Holdings observe that it is industry practice to follow the presentation prescribed for a Master Fund-Feeder fund structure in ASC 946 in instances in which a Master Fund is owned by more than one feeder fund and that such presentation provides stockholders of NMFC and AIV Holdings with a clearer depiction of their investment in the Master Fund.
The Companies’ financial statements reflect all adjustments and reclassifications which, in the opinion of management, are necessary for the fair presentation of the results of operations and financial condition for all periods presented. All intercompany transactions have been eliminated. Revenues are recognized when earned and expenses when incurred. The financial results of the Operating Company’s portfolio investments are not consolidated in the financial statements. Prior to the IPO, an affiliate of the Predecessor Entities paid a majority of the management and incentive fees. Historical operating expenses do not reflect the allocation of certain professional fees, administrative and other expenses that have been incurred following the completion of the IPO. Accordingly, the Operating Company’s historical operating expenses are not comparable to its operating expenses after the completion of the IPO.
The Companies’ interim financial statements are prepared in accordance with GAAP for interim financial information and pursuant to the requirements for reporting on Form 10-Q and Articles 6 or 10 of Regulation S-X. Accordingly, the Companies’ interim financial statements do not include all of the information and notes required by GAAP for annual financial statements. In the opinion of management, all adjustments, consisting solely of normal recurring accruals considered necessary for the fair presentation of financial statements for the interim period, have been included. The current period’s results of operations will not necessarily be indicative of results that ultimately may be achieved for the fiscal year ending December 31, 2012.
Investments—The Operating Company applies fair value accounting in accordance with GAAP. Fair value is the amount that would be received to sell an asset or paid to transfer a liability in an orderly transaction between market participants at the measurement date. Investments are reflected on the Operating Company’s Consolidated Statements of Assets, Liabilities and Members’ Capital at fair value, with changes in unrealized gains and losses resulting from changes in fair value reflected in the Operating Company’s Consolidated Statements of Operations as “Net change in unrealized appreciation (depreciation) of investments” and realizations on portfolio investments reflected in the Operating Company’s Consolidated Statements of Operations as “Net realized gains (losses) on investments”.
The Operating Company values its assets on a quarterly basis, or more frequently if required under the 1940 Act. In all cases, the Operating Company’s board of directors is ultimately and solely responsible for determining the fair value of the portfolio investments on a quarterly basis in good faith, including investments that are not publicly traded, those whose market prices are not readily available and any other situation where its portfolio investments require a fair value determination. Security transactions are accounted for on a trade date basis. The Operating Company’s quarterly valuation procedures are set forth in more detail below:
(1) Investments for which market quotations are readily available on an exchange are valued at such market quotations based on the closing price indicated from independent pricing services.
(2) Investments for which indicative prices are obtained from various pricing services and/or brokers or dealers are valued through a multi-step valuation process, as described below, to determine whether the quote(s) obtained is representative of fair value in accordance with GAAP.
a. Bond quotes are obtained through independent pricing services. Internal reviews are performed by the investment professionals of the Investment Adviser to ensure that the quote obtained is representative of fair value in accordance with GAAP and if so, the quote is used. If the Investment Adviser is unable to sufficiently validate the quote(s) internally and if the investment’s par value exceeds the materiality threshold, the investment is valued similarly to those assets with no readily available quotes (see (3) below); and
28
Table of Contents
b. For investments other than bonds, the Operating Company looks at the number of quotes readily available and performs the following:
i. Investments for which two or more quotes are received from a pricing service are valued using the mean of the mean of the bid and ask of the quotes obtained;
ii. Investments for which one quote is received from a pricing service are validated internally. The investment professionals of the Investment Adviser analyze the market quotes obtained using an array of valuation methods (further described below) to validate the fair value. If the Investment Adviser is unable to sufficiently validate the quote internally and if the investment’s par value exceeds the materiality threshold, the investment is valued similarly to those assets with no readily available quotes (see (3) below).
(3) Investments for which quotations are not readily available through exchanges, pricing services, brokers, or dealers are valued through a multi-step valuation process:
a. Each portfolio company or investment is initially valued by the investment professionals of the Investment Adviser responsible for the credit monitoring;
b. Preliminary valuation conclusions will then be documented and discussed with the Operating Company’s senior management;
c. If an investment falls into (3) above for four consecutive quarters and if the investment’s par value exceeds the materiality threshold, then at least once each fiscal year, the valuation for each portfolio investment for which the Operating Company does not have a readily available market quotation will be reviewed by an independent valuation firm engaged by our board of directors; and
d. Also, when deemed appropriate by the Operating Company’s management, an independent valuation firm may be engaged to review and value investment(s) of a portfolio company, without any preliminary valuation being performed by the Investment Adviser. The investment professionals of the Investment Adviser will review and validate the value provided.
Valuation methods may include comparisons of financial ratios of the portfolio companies that issued such private securities to peer companies that are public, the nature of and the realizable value of any collateral, the portfolio company’s earnings, discounted cash flows, the ability to make payments, the markets in which the portfolio company conducts business, and other relevant factors, including available market data such as relevant and applicable market trading and transaction comparables; applicable market yields and multiples; security covenants; call protection provisions; information rights; comparable merger and acquisition transactions; and the principal market and enterprise values. When an external event such as a purchase transaction, public offering or subsequent sale occurs, the Operating Company will consider the pricing indicated by the external event to corroborate the private valuation.
The values assigned to investments are based upon available information and do not necessarily represent amounts which might ultimately be realized, since such amounts depend on future circumstances and cannot be reasonably determined until the individual positions are liquidated. Due to the inherent uncertainty of determining the fair value of investments that do not have a readily available market value, the fair value of NMF Holdings’ investments may fluctuate from period to period.
NMFC and AIV Holdings are holding companies with no direct operations of their own, and their sole asset is their ownership in the Operating Company. NMFC’s and AIV Holdings’ investments in the Operating Company are carried at fair value and represent the respective pro-rata interest in the net assets of the Operating Company as of the applicable reporting date. NMFC and AIV Holdings value their ownership interest on a quarterly basis, or more frequently if required under the 1940 Act.
See Note 3, Investments, for further discussion relating to investments.
Cash and cash equivalents—Cash and cash equivalents include cash and short-term, highly liquid investments. The Companies define cash equivalents as securities that are readily convertible into known amounts of cash and so near maturity that there is insignificant risk of changes in value. Generally, these securities have original maturities of three months or less.
29
Table of Contents
Revenue recognition
The Operating Company’s revenue recognition policies are as follows:
Sales and paydowns of investments: Realized gains and losses on investments are determined on the specific identification method.
Interest income: Interest income, including amortization of premium and discount using the effective interest method, is recorded on the accrual basis and periodically assessed for collectability. Interest income also includes interest earned from cash on hand. Upon the prepayment of a loan or debt security, any prepayment penalties are recorded as part of interest income. The Operating Company has loans in the portfolio that contain a payment-in-kind (“PIK”) provision. PIK represents interest that is accrued and recorded as interest income at the contractual rates, added to the loan principal on the respective capitalization dates, and generally due at maturity.
Non-accrual income: Loans are placed on non-accrual status when principal or interest payments are past due 30 days or more and when there is reasonable doubt that principal or interest will be collected. Accrued cash and un-capitalized PIK interest is generally reversed when a loan is placed on non-accrual status. Previously capitalized PIK interest is not reversed when an investment is placed on non-accrual status. Interest payments received on non-accrual loans may be recognized as income or applied to principal depending upon management’s judgment of the ultimate outcome. Non-accrual loans are restored to accrual status when past due principal and interest is paid and, in management’s judgment, are likely to remain current.
Other income: Other income represents delayed compensation, consent or amendment fees, revolver fees and other miscellaneous fees received. Delayed compensation is income earned from counterparties on trades that do not settle within a set number of business days after trade date. Other income may also include fees from bridge loans. NMF Holdings may from time to time enter into bridge financing commitments, an obligation to provide interim financing to a counterparty until permanent credit can be obtained. These commitments are short-term in nature and may expire unfunded. A fee is received by NMF Holdings for providing such financing.
NMFC’s and AIV Holdings’ revenue recognition policies are as follows:
Revenue, expenses, and capital gains (losses): At each quarterly valuation date, the Operating Company’s investment income, expenses, net realized gains (losses), and net increase (decrease) in unrealized appreciation (depreciation) are allocated to NMFC and AIV Holdings based on their pro-rata interest in the net assets of the Operating Company. This is recorded on NMFC’s and AIV Holdings’ Statements of Operations. NMFC used the proceeds from its IPO and Concurrent Private Placement to purchase units in the Operating Company at $13.75 per unit (its IPO price per share). At the IPO date, $13.75 per unit represented a discount to the actual net asset value per unit of the Operating Company. As a result, NMFC experienced immediate unrealized appreciation on its investment. Concurrently, AIV Holdings experienced immediate unrealized depreciation on its investment in the Operating Company equal to the difference between NMFC’s IPO price of $13.75 per unit and the actual net asset value per unit.
All expenses, including those of NMFC and AIV Holdings, are paid and recorded by the Operating Company. Expenses are allocated to NMFC and AIV Holdings based on pro-rata ownership interest. In addition, the Operating Company paid all of the offering costs related to the IPO. NMFC and AIV Holdings have recorded their portion of the offering costs as a direct reduction to net assets and the cost of their investment in the Operating Company.
With respect to the expenses incident to any registration of shares of NMFC’s common stock issued in exchange for AIV Holdings’ units of the Operating Company, AIV Holdings is directly responsible for the expenses of any demand registration (including underwriters’ discounts or commissions) and their pro-rata share of any “piggyback” registration expenses. No shares have been exchanged since formation.
Interest and other credit facility expenses—Interest and other credit facility fees are recorded on an accrual basis by the Operating Company. See Note 7, Borrowing Facilities, for details.
Deferred credit facility costs—The deferred credit facility costs of the Operating Company consist of capitalized expenses related to the origination and amending of the Operating Company’s existing credit facilities. The Operating Company amortizes these costs into expense using the straight-line method over the stated life of the related credit facility. See Note 7, Borrowing Facilities, for details.
30
Table of Contents
Income taxes—NMF Holdings is treated as a partnership for federal income tax purposes. Accordingly, no provision for income taxes has been made in the accompanying financial statements, as the partners are individually responsible for reporting income or loss based on their respective share of the revenues and expenses. NMF Holdings files United States (“U.S.”) federal, state, and local income tax returns.
NMFC and AIV Holdings intend to elect to be treated, and intend to comply with the requirements to qualify annually, as RICs under subchapter M of the Code, commencing with their taxable years ending on December 31, 2011. As RICs, NMFC and AIV Holdings are not subject to federal income tax on the portion of taxable income and gains timely distributed to stockholders; therefore, no provision for income taxes has been recorded.
To qualify as RICs, NMFC and AIV Holdings are required to meet certain income and asset diversification tests in addition to distributing at least 90.0% of their respective investment company taxable income, as defined by the Code. Since federal income tax regulations differ from GAAP, distributions in accordance with tax regulations may differ from net investment income and realized gains recognized for financial reporting purposes.
Differences between taxable income and the results of operations for financial reporting purposes may be permanent or temporary in nature. Permanent differences are reclassified among capital accounts in the financial statements to reflect their tax character. Differences in classification may also result from the treatment of short-term gains as ordinary income for tax purposes.
For federal income tax purposes, distributions paid to stockholders of NMFC and AIV Holdings are reported as ordinary income, return of capital, long term capital gains or a combination thereof.
NMFC and AIV Holdings will be subject to a 4.0% nondeductible federal excise tax on certain undistributed income unless NMFC and AIV Holdings distribute, in a timely manner as required by the Code, an amount at least equal to the sum of (1) 98.0% of their respective net ordinary income earned for the calendar year and (2) 98.2% of their respective capital gain net income for the one-year period ending October 31 in the calendar year.
The Companies have adopted the Income Taxes topic of the Codification (“ASC 740”). ASC 740 provides guidance for how uncertain income tax positions should be recognized, measured, and disclosed in the financial statements. Based on their analyses, the Companies have determined that the adoption of ASC 740 did not have a material impact to the Companies’ financial statements.
Dividends—Distributions to common unit holders of NMF Holdings and common stockholders of NMFC and AIV Holdings are recorded on the record date as set by the respective board of directors. In order for NMFC and AIV Holdings to pay a dividend or other distribution to holders of their common stock, it must be accompanied by a prior distribution by NMF Holdings to all of its unit holders. NMF Holdings intends to make distributions to its unit holders that will be sufficient to enable NMFC and AIV Holdings to pay quarterly distributions to their stockholders and to obtain and maintain their status as RICs. NMFC and AIV Holdings intend to distribute approximately all of their portion of NMF Holdings’ adjusted net investment income (see Note 5, Agreements) on a quarterly basis and substantially all of their portion of NMF Holdings’ taxable income on an annual basis, except that NMFC may retain certain net capital gains for reinvestment.
Under certain circumstances, the distributions that NMF Holdings makes to its members may not be sufficient for AIV Holdings to satisfy the annual distribution requirement necessary for AIV Holdings to qualify as a RIC. In that case, it is expected that Guardian AIV would consent to be treated as if it received distributions from AIV Holdings sufficient to satisfy the annual distribution requirement. Guardian AIV would be required to include the consent dividend in its taxable income as a dividend from AIV Holdings, which would result in phantom (i.e., non-cash) taxable income to Guardian AIV. AIV Holdings intends to make quarterly distributions to Guardian AIV, its sole stockholder, out of assets legally available for distribution each quarter.
NMF Holdings and NMFC are required to take certain actions in order to maintain, at all times, a one-to-one ratio between the number of units held by NMFC and the number of shares of NMFC’s common stock outstanding. NMFC has adopted a dividend reinvestment plan that provides on behalf of its stockholders for reinvestment of any distributions declared, unless a stockholder elects to receive cash. Cash distributions reinvested in additional shares of NMFC’s common stock will be automatically reinvested by NMFC into additional units of NMF Holdings. In addition, AIV Holdings does not intend to reinvest any distributions received from NMF Holdings in additional units of NMF Holdings.
31
Table of Contents
NMFC applies the following in implementing the dividend reinvestment plan. If the price at which newly issued shares are to be credited to stockholders’ accounts is greater than 110.0% of the last determined net asset value of the shares, NMFC will use only newly issued shares to implement its dividend reinvestment plan. Under such circumstances, the number of shares to be issued to a stockholder is determined by dividing the total dollar amount of the distribution payable to such stockholder by the market price per share of NMFC’s common stock on the New York Stock Exchange (“NYSE”) on the distribution payment date. Market price per share on that date will be the closing price for such shares on the NYSE or, if no sale is reported for such day, the average of their electronically reported bid and asked prices. If NMFC uses newly issued shares to implement the plan, NMFC will receive, on a one-for-one basis, additional units of NMF Holdings in exchange for cash distributions that are reinvested in shares of NMFC’s common stock under the dividend reinvestment plan.
If the price at which newly issued shares are to be credited to stockholders’ accounts is less than 110.0% of the last determined net asset value of the shares, NMFC will either issue new shares or instruct the plan administrator to purchase shares in the open market to satisfy the additional shares required. Shares purchased in open market transactions by the plan administrator will be allocated to a stockholder based on the average purchase price, excluding any brokerage charges or other charges, of all shares of common stock purchased in the open market. The number of shares of NMFC’s common stock to be outstanding after giving effect to payment of the distribution cannot be established until the value per share at which additional shares will be issued has been determined and elections of NMFC’s stockholders have been tabulated.
Foreign securities—The accounting records of the Operating Company are maintained in U.S. dollars. Investment securities denominated in foreign currencies are translated into U.S. dollars based on the rate of exchange of such currencies on the date of valuation. Purchases and sales of investment securities and income and expense items denominated in foreign currencies are translated into U.S. dollars based on the rate of exchange of such currencies on the respective dates of the transactions. The Operating Company does not isolate that portion of the results of operations resulting from changes in foreign exchange rates on investments from the fluctuations arising from changes in market prices of securities held. Such fluctuations are included with “Net change in unrealized (depreciation) appreciation of investments” and “Net realized gains (losses) on investments” in the Operating Company’s Consolidated Statements of Operations.
Investments denominated in foreign currencies may be negatively affected by movements in the rate of exchange between the U.S. dollar and such foreign currencies. This movement is beyond the control of the Operating Company and cannot be predicted.
Use of estimates—The preparation of the Companies’ financial statements in conformity with GAAP requires management to make estimates and assumptions that affect the reported amounts of assets and liabilities at the date of the Companies’ financial statements and the reported amounts of revenues and expenses during the reporting periods. Changes in the economic environment, financial markets, and other metrics used in determining these estimates could cause actual results to differ from the estimates used, and the differences could be material.
Note 3. Investments
At June 30, 2012 the Operating Company’s investments consisted of the following:
Investment Cost and Fair Value by Type
|
|
|
Cost |
|
Fair Value |
|
|
First lien |
|
$ |
436,086,866 |
|
$ |
435,800,447 |
|
|
Second lien |
|
280,358,643 |
|
283,508,153 |
|
|
Subordinated |
|
27,620,585 |
|
28,957,984 |
|
|
Equity and other |
|
3,147,548 |
|
2,812,310 |
|
|
Total investments |
|
$ |
747,213,642 |
|
$ |
751,078,894 |
|
32
Table of Contents
Investment Cost and Fair Value by Industry
|
|
|
Cost |
|
Fair Value |
|
|
Healthcare Services |
|
$ |
149,687,696 |
|
$ |
154,342,825 |
|
|
Education |
|
145,334,036 |
|
142,280,457 |
|
|
Software |
|
134,620,045 |
|
136,500,686 |
|
|
Federal Services |
|
67,543,784 |
|
68,036,007 |
|
|
Business Services |
|
55,001,398 |
|
56,631,660 |
|
|
Healthcare Products |
|
31,095,068 |
|
32,115,000 |
|
|
Consumer Services |
|
31,363,815 |
|
31,991,580 |
|
|
Information Services |
|
29,419,185 |
|
29,920,907 |
|
|
Logistics |
|
25,452,009 |
|
24,720,000 |
|
|
Media |
|
21,087,457 |
|
21,045,097 |
|
|
Industrial Services |
|
19,301,274 |
|
19,204,394 |
|
|
Healthcare Information Technology |
|
14,645,542 |
|
13,222,365 |
|
|
Energy |
|
11,546,638 |
|
11,533,108 |
|
|
Information Technology |
|
6,444,889 |
|
5,838,205 |
|
|
Power Generation |
|
4,670,806 |
|
3,696,603 |
|
|
Total investments |
|
$ |
747,213,642 |
|
$ |
751,078,894 |
|
At December 31, 2011 the Operating Company’s investments consisted of the following:
Investment Cost and Fair Value by Type
|
|
|
Cost |
|
Fair Value |
|
|
First lien |
|
$ |
407,538,564 |
|
$ |
410,313,643 |
|
|
Second lien |
|
262,532,416 |
|
262,701,495 |
|
|
Subordinated |
|
26,672,980 |
|
27,648,951 |
|
|
Equity and other |
|
3,120,824 |
|
2,849,471 |
|
|
Total investments |
|
$ |
699,864,784 |
|
$ |
703,513,560 |
|
Investment Cost and Fair Value by Industry
|
|
|
Cost |
|
Fair Value |
|
|
Software |
|
$ |
153,797,485 |
|
$ |
155,642,372 |
|
|
Healthcare Services |
|
113,200,121 |
|
117,544,595 |
|
|
Education |
|
104,237,094 |
|
101,794,083 |
|
|
Business Services |
|
73,143,286 |
|
76,435,801 |
|
|
Federal Services |
|
70,665,154 |
|
70,674,563 |
|
|
Consumer Services |
|
29,357,183 |
|
29,764,430 |
|
|
Information Services |
|
29,516,875 |
|
29,626,611 |
|
|
Healthcare Products |
|
24,037,614 |
|
24,875,000 |
|
|
Logistics |
|
25,407,419 |
|
24,610,002 |
|
|
Industrial Services |
|
19,220,188 |
|
17,543,793 |
|
|
Healthcare Information Technology |
|
14,704,271 |
|
14,108,263 |
|
|
Media |
|
11,756,172 |
|
11,731,350 |
|
|
Specialty Chemicals and Materials |
|
9,449,821 |
|
9,430,359 |
|
|
Power Generation |
|
9,966,951 |
|
8,609,943 |
|
|
Information Technology |
|
6,570,081 |
|
6,249,251 |
|
|
Telecommunication |
|
4,835,069 |
|
4,873,144 |
|
|
Total investments |
|
$ |
699,864,784 |
|
$ |
703,513,560 |
|
As of June 30, 2012, the Operating Company’s original first lien position in ATI Acquisition Company remained on non-accrual status due to the inability of the portfolio company to service its interest payment for the quarter then ended and uncertainty about its ability to pay such amounts in the future. As of June 30, 2012, this first lien debt investment had a cost basis of $4,306,437, a fair value of $332,438 and total unearned interest income of $151,478 and $297,234, respectively, for the three and six months then ended. Additionally, the Operating Company has two super priority first lien debt investments in ATI Acquisition Company with a combined cost basis of $1,610,357 and a combined fair value of $1,414,371 as of June 30, 2012. Unrealized gains include a fee that the Operating Company would receive upon maturity of the two super priority first lien debt investments. Neither super priority first
33
Table of Contents
lien positions are on non-accrual status. As of June 30, 2012, the Operating Company’s total investment in ATI Acquisition Company had an aggregate cost basis of $5,916,794 and an aggregate fair value of $1,746,809. As of December 31, 2011, the Operating Company’s original first lien position in ATI Acquisition Company was put on non-accrual status, with a cost basis of $4,351,747, a fair value of $783,617 and total unearned interest income of $139,793 for the quarter and year then ended. The Operating Company’s two super priority first lien debt investments in ATI Acquisition Company had a combined cost basis and fair value of $1,576,066 as of December 31, 2011. As of December 31, 2011, the Operating Company’s total investment in ATI Acquisition Company had an aggregate cost basis of $5,927,813 and an aggregate fair value of $2,359,683.
As of June 30, 2012, the Operating Company had unfunded commitments on revolving credit facilities and bridge facilities of $13,333,500 and $0, respectively. The Operating Company did not have any unfunded commitments in the form of a delayed draw or other future funding commitments as of June 30, 2012. These unfunded commitments are disclosed on the Operating Company’s Consolidated Schedule of Investments as of June 30, 2012.
As of December 31, 2011, the Operating Company had unfunded commitments on revolving credit facilities and bridge facilities of $22,698,500 and $35,000,000, respectively. Additionally, the Operating Company had unfunded commitments in the form of a delayed draw or other future funding commitments of $4,250,632 as of December 31, 2011. These unfunded commitments are disclosed on the Operating Company’s Consolidated Schedules of Investments as of December 31, 2011.
Investment Risk Factor—First and second lien debt that the Operating Company invests in is entirely, or almost entirely, rated below investment grade or may be unrated. These loans are considered speculative because of the credit risk of the issuers. Such issuers are considered more likely than investment grade issuers to default on their payments of interest and principal and such defaults could reduce the net asset value and income distributions of the Operating Company. First and second lien debt may also lose significant market value before a default occurs. Furthermore, an active trading market may not exist for these first and second lien loans. This illiquidity may make it more difficult to value the debt.
Subordinated debt is generally subject to similar risks as those associated with first and second lien debt, except that such debt is subordinated in payment and /or lower in lien priority. Subordinated debt is subject to the additional risk that the cash flow of the borrower and the property securing the debt, if any, may be insufficient to meet scheduled payments after giving effect to the senior secured and unsecured obligations of the borrower.
Note 4. Fair Value
Fair value is the amount that would be received to sell an asset or paid to transfer a liability in an orderly transaction between market participants at the measurement date. Accounting Standards Codification 820, Fair Value Measurements and Disclosures (“ASC 820”), establishes a fair value hierarchy that prioritizes and ranks the inputs to valuation techniques used in measuring investments at fair value. The hierarchy classifies the inputs used in measuring fair value into three levels as follows:
Level I—Quoted prices (unadjusted) are available in active markets for identical investments and the Operating Company has the ability to access such quotes as of the reporting date. The type of investments which would generally be included in Level I include active exchange-traded equity securities and exchange-traded derivatives. As required by ASC 820, the Operating Company, to the extent that it holds such investments, does not adjust the quoted price for these investments, even in situations where the Operating Company holds a large position and a sale could reasonably impact the quoted price.
Level II—Pricing inputs are observable for the investments, either directly or indirectly, as of the reporting date, but are not the same as those used in Level I. Level II inputs include the following:
· Quoted prices for similar assets or liabilities in active markets;
· Quoted prices for identical or similar assets or liabilities in non-active markets (examples include corporate and municipal bonds, which trade infrequently);
· Pricing models whose inputs are observable for substantially the full term of the asset or liability (examples include most over-the-counter derivatives, including foreign exchange forward contracts); and
· Pricing models whose inputs are derived principally from or corroborated by observable market data through correlation or other means for substantially the full term of the asset or liability.
Level III—Pricing inputs are unobservable for the investment and include situations where there is little, if any, market activity for the investment.
34
Table of Contents
The inputs used to measure fair value may fall into different levels. In all instances when the inputs fall within different levels of the hierarchy, the level within which the fair value measurement is categorized is based on the lowest level of input that is significant to the fair value measurement in its entirety. As such, a Level III fair value measurement may include inputs that are both observable (Levels I and II) and unobservable (Level III). Gains and losses for such assets categorized within the Level III table below may include changes in fair value that are attributable to both observable inputs (Levels II and III) and unobservable inputs (Level III).
The inputs into the determination of fair value require significant judgment or estimation by management and consider factors specific to each investment. A review of the fair value hierarchy classifications is conducted on a quarterly basis. Changes in the observability of valuation inputs may result in the reclassification of certain investments within the fair value hierarchy from period to period. Reclassifications impacting the fair value hierarchy are reported as transfers in/out of the respective leveling categories as of the beginning of the quarter in which the reclassifications occur.
The following table summarizes the levels in the fair value hierarchy that the Operating Company’s portfolio investments fall into as of June 30, 2012:
|
|
|
Total |
|
Level I |
|
Level II |
|
Level III |
|
|
First lien |
|
$ |
435,800,447 |
|
$ |
— |
|
$ |
393,052,961 |
|
$ |
42,747,486 |
|
|
Second lien |
|
283,508,153 |
|
— |
|
230,232,853 |
|
53,275,300 |
|
|
Subordinated |
|
28,957,984 |
|
— |
|
21,419,000 |
|
7,538,984 |
|
|
Equity and other |
|
2,812,310 |
|
— |
|
— |
|
2,812,310 |
|
|
Total investments |
|
$ |
751,078,894 |
|
$ |
— |
|
$ |
644,704,814 |
|
$ |
106,374,080 |
|
The following table summarizes the levels in the fair value hierarchy that the Operating Company’s portfolio investments fall into as of December 31, 2011:
|
|
|
Total |
|
Level I |
|
Level II |
|
Level III |
|
|
First lien |
|
$ |
410,313,643 |
|
$ |
— |
|
$ |
377,172,906 |
|
$ |
33,140,737 |
|
|
Second lien |
|
262,701,495 |
|
— |
|
214,296,195 |
|
48,405,300 |
|
|
Subordinated |
|
27,648,951 |
|
— |
|
21,077,500 |
|
6,571,451 |
|
|
Equity and other |
|
2,849,471 |
|
— |
|
— |
|
2,849,471 |
|
|
Total investments |
|
$ |
703,513,560 |
|
$ |
— |
|
$ |
612,546,601 |
|
$ |
90,966,959 |
|
The following table summarizes the changes in fair value of Level III portfolio investments for the three months ended June 30, 2012, as well as the portion of appreciation (depreciation) included in income attributable to unrealized appreciation (depreciation) related to those assets and liabilities still held by the Operating Company at June 30, 2012:
|
|
|
Total |
|
First Lien |
|
Second Lien |
|
Subordinated |
|
Equity and
other |
|
|
Fair value, March 31, 2012 |
|
$ |
103,244,861 |
|
$ |
50,568,639 |
|
$ |
43,255,300 |
|
$ |
6,571,451 |
|
$ |
2,849,471 |
|
|
Total gains or losses included in earnings: |
|
|
|
|
|
|
|
|
|
|
|
|
Net realized gains (losses) on investments |
|
4,146,467 |
|
4,146,467 |
|
— |
|
— |
|
— |
|
|
Net change in unrealized (depreciation) appreciation |
|
(4,355,516 |
) |
(4,268,436 |
) |
(619 |
) |
(22,576 |
) |
(63,885 |
) |
|
Purchases, including capitalized PIK, revolver fundings and delayed draws |
|
11,054,862 |
|
17,410 |
|
10,020,619 |
|
990,109 |
|
26,724 |
|
|
Proceeds from sales and paydowns of investments |
|
(7,716,594 |
) |
(7,716,594 |
) |
— |
|
— |
|
— |
|
|
Fair value, June 30, 2012 |
|
$ |
106,374,080 |
|
$ |
42,747,486 |
|
$ |
53,275,300 |
|
$ |
7,538,984 |
|
$ |
2,812,310 |
|
|
Unrealized (depreciation) appreciation for the period relating to those Level III assets that were still held by the Operating Company at the end of the period: |
|
$ |
(548,016 |
) |
$ |
(460,936 |
) |
$ |
(619 |
) |
$ |
(22,576 |
) |
$ |
(63,885 |
) |
35
Table of Contents
The following table summarizes the changes in fair value of Level III portfolio investments for the three months ended June 30, 2011, as well as the portion of appreciation (depreciation) included in income attributable to unrealized appreciation (depreciation) related to those assets and liabilities still held by the Operating Company at June 30, 2011:
|
|
|
Total |
|
First Lien |
|
Subordinated |
|
Equity and
other |
|
|
Fair value, March 31, 2011 |
|
$ |
29,440,577 |
|
$ |
15,944,572 |
|
$ |
13,010,878 |
|
$ |
485,127 |
|
|
Total gains or losses included in earnings: |
|
|
|
|
|
|
|
|
|
|
Net change in unrealized appreciation (depreciation) |
|
34,078 |
|
34,999 |
|
7,842 |
|
(8,763 |
) |
|
Purchases, including capitalized PIK and revolver fundings |
|
15,488,011 |
|
15,235,593 |
|
212,418 |
|
— |
|
|
Transfers into Level III(1) |
|
(420,669 |
) |
(420,669 |
) |
— |
|
— |
|
|
Fair value, June 30, 2011 |
|
$ |
44,501,997 |
|
$ |
30,794,495 |
|
$ |
13,231,138 |
|
$ |
476,364 |
|
|
Unrealized appreciation (depreciation) for the period relating to those Level III assets that were still held by the Operating Company at the end of the period: |
|
$ |
34,078 |
|
$ |
34,999 |
|
$ |
7,842 |
|
$ |
(8,763 |
) |
(1) As of June 30, 2011, the portfolio investments were transferred into Level III from Level II at fair value as of the beginning of the quarter in which the reclassifications occurred.
The following table summarizes the changes in fair value of Level III portfolio investments for the six months ended June 30, 2012, as well as the portion of appreciation (depreciation) included in income attributable to unrealized appreciation (depreciation) related to those assets and liabilities still held by the Operating Company at June 30, 2012:
|
|
|
Total |
|
First Lien |
|
Second Lien |
|
Subordinated |
|
Equity and
other |
|
|
Fair value, December 31, 2011 |
|
$ |
90,966,959 |
|
$ |
33,140,737 |
|
$ |
48,405,300 |
|
$ |
6,571,451 |
|
$ |
2,849,471 |
|
|
Total gains or losses included in earnings: |
|
|
|
|
|
|
|
|
|
|
|
|
Net realized gains (losses) on investments |
|
4,168,819 |
|
4,146,203 |
|
22,616 |
|
— |
|
— |
|
|
Net change in unrealized (depreciation) appreciation |
|
(4,162,499 |
) |
(3,902,803 |
) |
(173,235 |
) |
(22,576 |
) |
(63,885 |
) |
|
Purchases, including capitalized PIK, revolver fundings and delayed draws |
|
45,628,933 |
|
34,591,481 |
|
10,020,619 |
|
990,109 |
|
26,724 |
|
|
Proceeds from sales and paydowns of investments |
|
(19,116,594 |
) |
(14,116,594 |
) |
(5,000,000 |
) |
— |
|
— |
|
|
Transfers out of Level III(1) |
|
(11,111,538 |
) |
(11,111,538 |
) |
— |
|
— |
|
— |
|
|
Fair value, June 30, 2012 |
|
$ |
106,374,080 |
|
$ |
42,747,486 |
|
$ |
53,275,300 |
|
$ |
7,538,984 |
|
$ |
2,812,310 |
|
|
Unrealized (depreciation) appreciation for the period relating to those Level III assets that were still held by the Operating Company at the end of the period: |
|
$ |
(548,733 |
) |
$ |
(461,653 |
) |
$ |
(619) |
|
$ |
(22,576 |
) |
$ |
(63,885 |
) |
(1) As of June 30, 2012, the portfolio investments were transferred out of Level III into Level II at fair value as of the beginning of the quarter in which the reclassifications occurred.
The following table summarizes the changes in fair value of Level III portfolio investments for the six months ended June 30, 2011, as well as the portion of appreciation (depreciation) included in income attributable to unrealized appreciation (depreciation) related to those assets and liabilities still held by the Operating Company at June 30, 2011:
36
Table of Contents
|
|
|
Total |
|
First Lien |
|
Subordinated |
|
Equity and
other |
|
|
Fair value, December 31, 2010 |
|
$ |
30,255,961 |
|
$ |
16,975,334 |
|
$ |
12,747,764 |
|
$ |
532,863 |
|
|
Total gains or losses included in earnings: |
|
|
|
|
|
|
|
|
|
|
Net change in unrealized appreciation (depreciation) |
|
788,581 |
|
596,294 |
|
270,956 |
|
(78,669 |
) |
|
Purchases, including capitalized PIK and revolver fundings |
|
14,210,181 |
|
13,975,593 |
|
212,418 |
|
22,170 |
|
|
Transfers into Level III(1) |
|
(752,726 |
) |
(752,726 |
) |
— |
|
— |
|
|
Fair value, June 30, 2011 |
|
$ |
44,501,997 |
|
$ |
30,794,495 |
|
$ |
13,231,138 |
|
$ |
476,364 |
|
|
Unrealized appreciation (depreciation) for the period relating to those Level III assets that were still held by the Operating Company at the end of the period: |
|
$ |
788,581 |
|
$ |
596,294 |
|
$ |
270,956 |
|
$ |
(78,669 |
) |
(1) As of June 30, 2011, the portfolio investments were transferred into Level III from Level II at fair value as of the beginning of the quarter in which the reclassifications occurred.
Except as noted in the tables above, there were no other transfers in or out of Level I, II, or III during the three and six months ended June 30, 2012 and June 30, 2011. Transfers into Level III occurred as quotations obtained through pricing services were not deemed representative of fair value as of the balance sheet date and such assets were internally valued. As quotations obtained through pricing services were substantiated through additional market sources, investments were transferred out of Level III. The Operating Company invests in revolving credit facilities. These investments are categorized as Level III investments as these assets are not actively traded and their fair values are often implied by the term loans of the respective portfolio companies.
NMF Holdings generally uses the following framework when determining the fair value of investments where there are little, if any, market activity or observable pricing inputs.
Company Performance, Financial Review, and Analysis: Prior to investment, as part of its due diligence process, NMF Holdings evaluates the overall performance and financial stability of the portfolio company. Post investment, NMF Holdings analyzes each portfolio company’s current operating performance and relevant financial trends versus prior year and budgeted results, including, but not limited to, factors affecting its revenue and earnings before interest, taxes, depreciation, and amortization (“EBITDA”) growth, margin trends, liquidity position, covenant compliance and changes to its capital structure. NMF Holdings also attempts to identify and subsequently track any developments at the portfolio company, within its customer or vendor base or within the industry or the macroeconomic environment, generally, that may alter any material element of its original investment thesis. This analysis is specific to each portfolio company. NMF Holdings leverages the knowledge gained from its original due diligence process, augmented by this subsequent monitoring, to continually refine its outlook for each of its portfolio companies and ultimately form the valuation of its investment in each portfolio company.
Market Based Approach: NMF Holdings typically estimates the total enterprise value of each portfolio company by utilizing market value cash flow (EBITDA) multiples of publicly traded comparable companies. NMF Holdings carefully considers numerous factors when selecting the appropriate companies whose trading multiples are used to value its portfolio companies. These factors include, but are not limited to, the type of organization, similarity to the business being valued, relevant risk factors, as well as size, profitability and growth expectations. NMF Holdings generally applies an average of various relevant comparable company EBITDA multiples to the portfolio company’s latest twelve month (“LTM”) EBITDA or projected EBITDA to calculate portfolio company enterprise value. This is done in order to ensure that there is an appropriate level of value coverage for each investment. In applying the market based approach as of June 30, 2012, NMF Holdings used a range of 1.0x to 11.5x relevant EBITDA to determine the enterprise value of its investments. NMF Holdings believes this was a reasonable range in light of current comparable company trading levels and the specific companies involved.
Income Based Approach: NMF Holdings also typically uses a discounted cash flow analysis to estimate the fair value of the investment. Projected cash flows represent the relevant security’s contractual interest, fee and principal payments plus the assumption of full principal recovery at the investment’s expected maturity date. These cash flows are discounted at a rate established utilizing a yield calibration approach, which incorporates changes in the credit quality (as measured by relevant statistics) of the portfolio company, as compared to changes in the yield associated with comparable credit quality market indices, between the date of
37
Table of Contents
origination and the valuation date. In applying the income based approach as of June 30, 2012, NMF Holdings used a discount range of 6.4% to 23.3% to value its investments.
Based on a comparison to similar BDC credit facilities, the terms and conditions of the Holdings Credit Facility and the SLF Credit Facility are representative of market. Both facilities were amended and restated on May 8, 2012 to lower the applicable interest rate spread by 0.25%. The carrying values of the Holdings Credit Facility and SLF Credit Facility approximate fair value as of June 30, 2012, as both facilities are continually monitored and examined by both the borrower and the lender. The fair value of other financial assets and liabilities approximates their carrying value based on the short term nature of these items. The fair value disclosures discussed in this paragraph are considered Level III.
Fair value risk factors—The Operating Company seeks investment opportunities that offer the possibility of attaining substantial capital appreciation. Certain events particular to each industry in which the Operating Company’s portfolio companies conduct their operations, as well as general economic and political conditions, may have a significant negative impact on the operations and profitability of the Operating Company’s investments and/or on the fair value of the Operating Company’s investments. The Operating Company’s investments are subject to the risk of non-payment of scheduled interest or principal, resulting in a reduction in income to the Operating Company and thus the income of NMFC and AIV Holdings, and their corresponding fair valuations. Also, there may be risk associated with the concentration of investments in one geographic region or in certain industries. These events are beyond the control of the Operating Company and cannot be predicted. Furthermore, the ability to liquidate investments and realize value is subject to uncertainties.
Note 5. Agreements
On May 19, 2011, NMFC entered into a joinder agreement with respect to the Limited Liability Company Agreement, as amended and restated, of the Operating Company pursuant to which NMFC was admitted as a member of the Operating Company and agreed to acquire from the Operating Company a number of units of the Operating Company equal to the number of shares of common stock outstanding of NMFC. Additionally on May 19, 2011, in connection with the contribution by Guardian AIV of its units to AIV Holdings, AIV Holdings entered into a joinder agreement with respect to the Limited Liability Company Agreement, as amended and restated, of the Operating Company pursuant to which AIV Holdings was also admitted as a member of the Operating Company.
The Operating Company entered into an investment advisory and management agreement, as amended and restated (the “Investment Management Agreement”) with the Investment Adviser. Under the Investment Management Agreement, the Investment Adviser manages the day-to-day operations of, and provides investment advisory services to, the Operating Company. For providing these services, the Investment Adviser receives a fee from the Operating Company, consisting of two components—a base management fee and an incentive fee.
The base management fee is calculated at an annual rate of 1.75% of the Operating Company’s gross assets less (i) the borrowings under the SLF Credit Facility (as defined in Note 7, Borrowing Facilities) and (ii) cash and cash equivalents. The base management fee is payable quarterly in arrears, and is calculated based on the average value of the Operating Company’s gross assets, borrowings under the SLF Credit Facility, and cash and cash equivalents at the end of each of the two most recently completed calendar quarters, and appropriately adjusted on a pro rata basis for any equity capital raises or repurchases during the current calendar quarter.
The incentive fee consists of two parts. The first part is calculated and payable quarterly in arrears and equals 20.0% of the Operating Company’s “Pre-Incentive Fee Adjusted Net Investment Income” for the immediately preceding quarter, subject to a “preferred return”, or “hurdle”, and a “catch-up” feature. “Pre-Incentive Fee Net Investment Income” means interest income, dividend income and any other income (including any other fees (other than fees for providing managerial assistance), such as commitment, origination, structuring, diligence and consulting fees or other fees that the Operating Company receives from portfolio companies) accrued during the calendar quarter, minus the Operating Company’s operating expenses for the quarter (including the base management fee, expenses payable under the Administration Agreement, as amended and restated, with the Administrator, and any interest expense and distributions paid on any issued and outstanding preferred membership units (of which there are none as of June 30, 2012), but excluding the incentive fee). Pre-Incentive Fee Net Investment Income includes, in the case of investments with a deferred interest feature (such as original issue discount, debt instruments with PIK interest and zero coupon securities), accrued income that the Operating Company has not yet received in cash. Pre-Incentive Fee Net Investment Income does not include any realized capital gains, realized capital losses or unrealized capital appreciation or depreciation.
Under GAAP, NMFC’s IPO did not step-up the cost basis of the Operating Company’s existing investments to fair market value at the IPO date. Since the total value of the Operating Company’s investments at the time of the IPO was greater than the investments’ cost basis, a larger amount of amortization of purchase or original issue discount, as well as different amounts in realized gain and unrealized appreciation, may be recognized under GAAP in each period than if the step-up had occurred. This will remain
38
Table of Contents
until such predecessor investments are sold or mature in the future. The Operating Company tracks the transferred (or fair market) value of each of its investments as of the time of the IPO and, for purposes of the incentive fee calculation, adjusts Pre-Incentive Fee Net Investment Income to reflect the amortization of purchase or original issue discount on the Operating Company’s investments as if each investment was purchased at the date of the IPO, or stepped up to fair market value. This is defined as “Pre-Incentive Fee Adjusted Net Investment Income”. The Operating Company also uses the transferred (or fair market) value of each of its investments as of the time of the IPO to adjust capital gains (“Adjusted Realized Capital Gains”) or losses (“Adjusted Realized Capital Losses”) and unrealized capital appreciation (“Adjusted Unrealized Capital Appreciation”) and unrealized capital depreciation (“Adjusted Unrealized Capital Depreciation”).
Pre-Incentive Fee Adjusted Net Investment Income, expressed as a rate of return on the value of the Operating Company’s net assets at the end of the immediately preceding calendar quarter, will be compared to a “hurdle rate” of 2.0% per quarter (8.0% annualized), subject to a “catch-up” provision measured as of the end of each calendar quarter. The hurdle rate is appropriately pro-rated for any partial periods. The calculation of the Operating Company’s incentive fee with respect to the Pre-Incentive Fee Adjusted Net Investment Income for each quarter is as follows:
· No incentive fee is payable to the Investment Adviser in any calendar quarter in which the Operating Company’s Pre-Incentive Fee Adjusted Net Investment Income does not exceed the hurdle rate of 2.0% (the “preferred return” or “hurdle”).
· 100.0% of the Operating Company’s Pre-Incentive Fee Adjusted Net Investment Income with respect to that portion of such Pre-Incentive Fee Adjusted Net Investment Income, if any, that exceeds the hurdle rate but is less than or equal to 2.5% in any calendar quarter (10.0% annualized) is payable to the Investment Adviser. This portion of the Operating Company’s Pre-Incentive Fee Adjusted Net Investment Income (which exceeds the hurdle rate but is less than or equal to 2.5%) is referred to as the “catch-up”. The catch-up provision is intended to provide the Investment Adviser with an incentive fee of 20.0% on all of the Operating Company’s Pre-Incentive Fee Adjusted Net Investment Income as if a hurdle rate did not apply when the Operating Company’s Pre-Incentive Fee Adjusted Net Investment Income exceeds 2.5% in any calendar quarter.
· 20.0% of the amount of the Operating Company’s Pre-Incentive Fee Adjusted Net Investment Income, if any, that exceeds 2.5% in any calendar quarter (10.0% annualized) is payable to the Investment Adviser once the hurdle is reached and the catch-up is achieved.
The second part will be determined and payable in arrears as of the end of each calendar year (or upon termination of the Investment Management Agreement) and will equal 20.0% of the Operating Company’s Adjusted Realized Capital Gains, if any, on a cumulative basis from inception through the end of each calendar year, computed net of all Adjusted Realized Capital Losses and Adjusted Unrealized Capital Depreciation on a cumulative basis, less the aggregate amount of any previously paid capital gain incentive fee.
In accordance with GAAP, NMF Holdings accrues a hypothetical capital gains incentive fee based upon the cumulative net Adjusted Realized Capital Gains and Adjusted Realized Capital Losses and the cumulative net Adjusted Unrealized Capital Appreciation and Adjusted Unrealized Capital Depreciation on investments held at the end of each period. Actual amounts paid to the Investment Adviser are consistent with the Investment Management Agreement and are based only on actual Adjusted Realized Capital Gains computed net of all Adjusted Realized Capital Losses and Adjusted Unrealized Capital Depreciation on a cumulative basis from inception through the end of each calendar year as if the entire portfolio was sold at fair value.
The management fee and incentive fee incurred by the Operating Company were $2,605,561 and $2,771,189 for the three months ended June 30, 2012, which includes an accrual of $52,712 of capital gains incentive fees for the quarter then ended. The management fee and incentive fee incurred by the Operating Company were $5,119,857 and $6,132,652 for the six months ended June 30, 2012, which includes an accrual of $963,890 of capital gains incentive fees for the six months then ended. These accrued capital gains incentive fees would be paid by the Operating Company if the Operating Company ceased operations on June 30, 2012 and liquidated its investments at the current valuation. No accrual was required for the six months ended June 30, 2011. The management fee and incentive fees incurred by the Operating Company were $807,509 and $504,393 for the period from May 19, 2011 (effective date of the Investment Management Agreement) to June 30, 2011. For the period ended May 19, 2011, the Operating Company incurred $34,000 in management fees under the investment advisory and management agreements of the Predecessor Entities. The Operating Company’s Consolidated Statement of Operations below is adjusted as if step-up in cost basis to fair market value had occurred at the IPO date, May 19, 2011.
39
Table of Contents
The following Statement of Operations for the three and six months ended June 30, 2012 is adjusted to reflect this step-up to fair market value.
|
|
|
Three months ended
June 30, 2012 |
|
Adjustments |
|
Adjusted
three months ended
June 30, 2012 |
|
|
Investment income |
|
|
|
|
|
|
|
|
Interest income |
|
$ |
20,124,043 |
|
$ |
(825,043 |
) |
$ |
19,299,000 |
|
|
Other income |
|
174,980 |
|
— |
|
174,980 |
|
|
Total investment income |
|
20,299,023 |
|
(825,043 |
) |
19,473,980 |
|
|
Total expenses pre-incentive fee |
|
5,881,589 |
|
— |
|
5,881,589 |
|
|
Pre-Incentive Fee Net Investment Income |
|
14,417,434 |
|
(825,043 |
) |
13,592,391 |
|
|
Incentive fee (1) |
|
2,771,189 |
|
— |
|
2,771,189 |
|
|
Post-Incentive Fee Net Investment Income |
|
11,646,245 |
|
(825,043 |
) |
10,821,202 |
|
|
Net realized gains on investments |
|
11,968,454 |
|
(4,504,826 |
) |
7,463,628 |
|
|
Net change in unrealized (depreciation) appreciation of investments |
|
(12,529,939 |
) |
5,329,869 |
|
(7,200,070 |
) |
|
Net increase in capital resulting from operations |
|
$ |
11,084,760 |
|
|
|
$ |
11,084,760 |
|
|
|
|
|
|
|
|
|
|
|
|
(1) For the three months ended June 30, 2012, the Operating Company incurred total incentive fees of $2,771,189, of which $52,712 related to capital gains incentive fees on a hypothetical liquidation basis.
|
|
|
Six months ended
June 30, 2012 |
|
Adjustments |
|
Adjusted
six months ended
June 30, 2012 |
|
|
Investment income |
|
|
|
|
|
|
|
|
Interest income |
|
$ |
38,725,226 |
|
$ |
(1,848,038 |
) |
$ |
36,877,188 |
|
|
Other income |
|
595,798 |
|
— |
|
595,798 |
|
|
Total investment income |
|
39,321,024 |
|
(1,848,038 |
) |
37,472,986 |
|
|
Total expenses pre-incentive fee |
|
11,629,174 |
|
— |
|
11,629,174 |
|
|
Pre-Incentive Fee Net Investment Income |
|
27,691,850 |
|
(1,848,038 |
) |
25,843,812 |
|
|
Incentive fee (1) |
|
6,132,652 |
|
— |
|
6,132,652 |
|
|
Post-Incentive Fee Net Investment Income |
|
21,559,198 |
|
(1,848,038 |
) |
19,711,160 |
|
|
Net realized gains on investments |
|
12,975,787 |
|
(5,217,550 |
) |
7,758,237 |
|
|
Net change in unrealized appreciation of investments |
|
216,476 |
|
7,065,588 |
|
7,282,064 |
|
|
Net increase in capital resulting from operations |
|
$ |
34,751,461 |
|
|
|
$ |
34,751,461 |
|
|
|
|
|
|
|
|
|
|
|
|
(1) For the six months ended June 30, 2012, the Operating Company incurred total incentive fees of $6,132,652, of which $963,890 related to capital gains incentive fees on a hypothetical liquidation basis.
The following Statement of Operations begins on May 19, 2011, the effective date of the Investment Management Agreement, for the period ended June 30, 2011, as adjusted to reflect the step-up to fair market value.
|
|
|
Period from May 19, 2011
to June 30, 2011 |
|
Adjustments |
|
Adjusted
period from May 19, 2011
to June 30, 2011 |
|
|
Investment income |
|
|
|
|
|
|
|
|
Interest income |
|
$ |
7,004,932 |
|
$ |
(558,689 |
) |
$ |
6,446,243 |
|
|
Other income |
|
306,144 |
|
— |
|
306,144 |
|
|
Total investment income |
|
7,311,076 |
|
(558,689 |
) |
6,752,387 |
|
|
Total expenses pre-incentive fee |
|
2,228,057 |
|
— |
|
2,228,057 |
|
|
Pre-Incentive Fee Net Investment Income |
|
5,083,019 |
|
(558,689 |
) |
4,524,330 |
|
|
Incentive fee |
|
504,393 |
|
— |
|
504,393 |
|
|
Post-Incentive Fee Net Investment Income |
|
4,578,626 |
|
(558,689 |
) |
4,019,937 |
|
|
Net realized losses on investments |
|
(402,003 |
) |
215,321 |
|
(186,682 |
) |
|
Net change in unrealized appreciation (depreciation) of investments |
|
1,100,228 |
|
343,368 |
|
1,443,596 |
|
|
Net increase in capital resulting from operations |
|
$ |
5,276,851 |
|
|
|
$ |
5,276,851 |
|
|
|
|
|
|
|
|
|
|
|
|
40
Table of Contents
The Companies have entered into an Administration Agreement, as amended and restated, with the Administrator under which the Administrator provides administrative services. The Administrator performs, or oversees the performance of, the Companies’ financial records, prepares reports filed with the Securities and Exchange Commission, generally monitors the payment of the Companies’ expenses, and watches the performance of administrative and professional services rendered by others. NMF Holdings will reimburse the Administrator for the Companies’ allocable portion of overhead and other expenses incurred by the Administrator in performing its obligations to the Companies under the Administration Agreement, as amended and restated. Pursuant to the Administration Agreement, as amended and restated, and further restricted by the Operating Company, expenses payable to the Administrator by the Operating Company as well as other direct and indirect expenses (excluding interest and other credit facility expenses and management and incentive fees) have been capped at $3,500,000 for the time period from April 1, 2012 to March 31, 2013.
The Operating Company incurred $397,901 and $947,705 in expenses in excess of the expense cap for the three months and six months ended June 30, 2012, of which $118,853 was receivable from an affiliate as of June 30, 2012. The Operating Company incurred $310,441 in expenses in excess of the expense cap for the three months and six months ended June 30, 2011, of which $130,186 was receivable from an affiliate as of June 30, 2011.
The Companies, the Investment Adviser and the Administrator have also entered into a Trademark License Agreement, as amended, with New Mountain Capital, L.L.C., pursuant to which New Mountain Capital, L.L.C. has agreed to grant the Companies, the Investment Adviser and the Administrator, a non-exclusive, royalty-free license to use the “New Mountain” and the “New Mountain Finance” names. Under the Trademark License Agreement, as amended, subject to certain conditions, the Companies, the Investment Adviser and the Administrator will have a right to use the “New Mountain” and “New Mountain Finance” names, for so long as the Investment Adviser or one of its affiliates remains the investment adviser of the Operating Company. Other than with respect to this limited license, the Companies, the Investment Adviser and the Administrator will have no legal right to the “New Mountain” or the “New Mountain Finance” names.
AIV Holdings entered into a Registration Rights Agreement with NMFC, Steven B. Klinsky (the Chairman of our board of directors), an entity related to Steven B. Klinsky and the Investment Adviser. Subject to several exceptions, AIV Holdings and the Investment Adviser have the right to require NMFC to register for public resale under the Securities Act of 1933, as amended (the “Securities Act of 1933”), all registerable securities that are held by any of them and that they request to be registered. Registerable securities subject to the Registration Rights Agreement are shares of NMFC’s common stock issued or issuable in exchange for units and any other shares of NMFC’s common stock held by AIV Holdings, the Investment Adviser and any of their transferees. The rights under the Registration Rights Agreement can be conditionally exercised by AIV Holdings or the Investment Adviser, meaning that prior to the effectiveness of the registration statement related to the shares, AIV Holdings or the Investment Adviser can withdraw their request to have the shares registered. AIV Holdings and the Investment Adviser may each assign their rights to any person that acquires registerable securities subject to the Registration Rights Agreement and who agrees to be bound by the terms of the Registration Rights Agreement. Steven B. Klinsky and a related entity will have the right to “piggyback”, or include their own registerable securities in such a registration.
AIV Holdings and the Investment Adviser may require NMFC to use its reasonable best efforts to register under the Securities Act of 1933 all or any portion of these registerable securities upon a “demand request”. The demand registration rights are subject to certain limitations.
The Registration Rights Agreement includes limited blackout and suspension periods. In addition, AIV Holdings and the Investment Adviser may also require NMFC to file a shelf registration statement on Form N-2 for the resale of their registerable securities if NMFC is eligible to use Form N-2 at that time.
Holders of registerable securities have “piggyback” registration rights, including AIV Holdings, which means that these holders may include their respective shares in any future registrations of NMFC’s equity securities, whether or not that registration relates to a primary offering by NMFC or a secondary offering by or on behalf of any of NMFC’s stockholders. AIV Holdings, the Investment Adviser and Steven B. Klinsky (and a related entity) have priority over NMFC in any registration that is an underwritten offering.
AIV Holdings, the Investment Adviser and Steven B. Klinsky (and a related entity) will be responsible for the expenses of any demand registration (including underwriters’ discounts or commissions) and their pro-rata share of any “piggyback” registration. NMFC has agreed to indemnify AIV Holdings, the Investment Adviser and Steven B. Klinsky (and a related entity) with respect to liabilities resulting from untrue statements or omissions in any registration statement filed pursuant to the Registration Rights Agreement, other than untrue statements or omissions resulting from information furnished to NMFC by such parties. AIV Holdings,
41
Table of Contents
the Investment Adviser and Steven B. Klinsky (and a related entity) have also agreed to indemnify NMFC with respect to liabilities resulting from untrue statements or omissions furnished by them to NMFC relating to them in any registration statement.
Note 6. Related Parties
The Companies have entered into a number of business relationships with affiliated or related parties. NMFC and AIV Holdings own all the outstanding units of the Operating Company. As of June 30, 2012, NMFC and AIV Holdings own approximately 34.6% and 65.4%, respectively, of the units of NMF Holdings.
NMF Holdings has entered into the Investment Management Agreement with the Investment Adviser, a wholly-owned subsidiary of New Mountain Capital. Therefore, New Mountain Capital is entitled to any profits earned by the Investment Adviser, which includes any fees payable to the Investment Adviser under the terms of the Investment Management Agreement, less expenses incurred by the Investment Adviser in performing its services under the Investment Management Agreement.
The Companies have entered into an Administration Agreement, as amended and restated, with the Administrator, a wholly-owned subsidiary of New Mountain Capital. The Administrator arranges office space for the Companies and provides office equipment and administrative services necessary to conduct their respective day-to-day operations pursuant to the Administration Agreement, as amended and restated. NMF Holdings reimburses the Administrator for the allocable portion of overhead and other expenses incurred by it in performing its obligations to the Companies under the Administration Agreement, as amended and restated, including rent, the fees and expenses associated with performing administrative, finance and compliance functions, and the compensation of the Companies’ chief financial officer and chief compliance officer and their respective staffs. Pursuant to the Administration Agreement, as amended and restated, and further restricted by the Operating Company, expenses payable to the Administrator by the Operating Company as well as other direct and indirect expenses (excluding interest and other credit facility expenses and management and incentive fees) have been capped at $3,500,000 for the time period from April 1, 2012 to March 31, 2013.
The Companies, the Investment Adviser and the Administrator have entered into a royalty-free Trademark License Agreement, as amended, with New Mountain Capital, L.L.C., pursuant to which New Mountain Capital, L.L.C. has agreed to grant the Companies, the Investment Adviser and the Administrator, a non-exclusive, royalty-free license to use the name “New Mountain” and “New Mountain Finance”.
The Companies have adopted a formal code of ethics that governs the conduct of their respective officers and directors. These officers and directors also remain subject to the duties imposed by the 1940 Act, the Delaware General Corporation Law and the Delaware Limited Liability Company Act.
The Investment Adviser and its affiliates may also manage other funds in the future that may have investment mandates that are similar, in whole and in part, with NMF Holdings’ investment mandates. The Investment Adviser and its affiliates may determine that an investment is appropriate for NMF Holdings and for one or more of those other funds. In such event, depending on the availability of such investment and other appropriate factors, the Investment Adviser or its affiliates may determine that the Operating Company should invest side-by-side with one or more other funds. Any such investments will be made only to the extent permitted by applicable law and interpretive positions of the Securities and Exchange Commission and its staff, and consistent with the Investment Adviser’s allocation procedures.
Concurrently with the IPO, NMFC sold an additional 2,172,000 shares of its common stock to certain executives and employees of, and other individuals affiliated with, New Mountain Capital in the Concurrent Private Placement.
Note 7. Borrowing Facilities
Holdings Credit Facility—The Loan and Security Agreement, as amended and restated, dated May 19, 2011 (the “Holdings Credit Facility”) among NMF Holdings as the Borrower and Collateral Administrator, Wells Fargo Securities, L.L.C. as the Administrative Agent, and Wells Fargo Bank, National Association, as the Collateral Custodian, is structured as a revolving credit facility and matures on October 27, 2016, as amended on May 8, 2012. The maximum amount of revolving borrowings available under the Holdings Credit Facility is $160,000,000. The Operating Company is permitted to borrow up to 45.0% or 25.0% of the purchase price of pledged first lien or non-first lien debt securities, and up to 67.0% and 45.0% of the purchase price of specified first lien debt securities and specified non-first lien debt securities, respectively, subject to approval by Wells Fargo Bank, National Association. The credit facility is collateralized by all of the investments of the Operating Company on an investment by investment basis. All fees associated with the origination or upsizing of the Holdings Credit Facility are capitalized on the Operating Company’s Consolidated Statement of Assets, Liabilities, and Members’ Capital and charged against income as other credit facility expenses over the life of the Holdings Credit Facility. The Holdings Credit Facility contains certain customary affirmative and negative covenants and events of default, including the occurrence of a change in control. In addition, the Holdings Credit Facility requires the Operating
42
Table of Contents
Company to maintain a minimum asset coverage ratio. However, the covenants are generally not tied to mark to market fluctuations in the prices of the Operating Company’s investments, but rather to the performance of the underlying portfolio companies.
The Operating Company became a party to the Holdings Credit Facility upon the IPO of NMFC. The Holdings Credit Facility amends and restates the credit facility of the Predecessor Entities (the “Predecessor Credit Facility”). The Predecessor Credit Facility consisted of two separate facilities. First, the Loan and Security Agreement dated October 21, 2009 among New Mountain Guardian (Leveraged), L.L.C. as the Collateral Manager, New Mountain Guardian Debt Funding, L.L.C. as the Borrower, Wells Fargo Securities, L.L.C. as the Administrative Agent, and Wells Fargo Bank, National Association, as the Collateral Custodian, was structured as a revolving credit facility that matured on October 21, 2014. The maximum amount of revolving borrowings available under this credit facility was $112,500,000. Second, the Loan and Security Agreement dated November 19, 2009 among New Mountain Guardian Partners (Leveraged), L.L.C as the Collateral Manager, New Mountain Guardian Partners Debt Funding, L.L.C. as the Borrower, Wells Fargo Securities, L.L.C. as the Administrative Agent, and Wells Fargo Bank, National Association, as the Collateral Custodian, is structured as a revolving credit facility that matures on October 21, 2014. The maximum amount of revolving borrowings available under this credit facility was $7,500,000.
The Holdings Credit Facility (as well as the Predecessor Credit Facility) bears interest at a rate of the London Interbank Offered Rate (“LIBOR”) plus 2.75% per annum, as amended on May 8, 2012, and charges a non-usage fee, based on the unused facility amount multiplied by the Non-Usage Fee Rate (as defined in the credit agreement). Interest expense and non-usage fees were $1,050,885 and $33,622, respectively, for the three months ended June 30, 2012. Interest expense and non-usage fees were $2,112,794 and $72,858, respectively, for the six months ended June 30, 2012. Interest expense and non-usage fees were $366,558 and $176,225, respectively, for the three months ended June 30, 2011. Interest expense and non-usage fees were $893,905 and $374,900, respectively, for the six months ended June 30, 2011. The weighted average interest rate for the six months ended June 30, 2012 and June 30, 2011 was 3.2% and 3.2%, respectively. The average debt outstanding for the six months ended June 30, 2012 and June 30, 2011 was $131,527,287 and $53,853,228, respectively. The outstanding balance as of June 30, 2012 and December 31, 2011 was $138,756,913 and $129,037,813, respectively. As of June 30, 2012 and December 31, 2011, the Operating Company was in compliance with all financial and operational covenants required by the credit facilities existing on such dates.
SLF Credit Facility—The Operating Company’s senior loan fund’s Loan and Security Agreement, as amended and restated, dated October 27, 2010 (the “SLF Credit Facility”) among NMF SLF as the Borrower, NMF Holdings as the Collateral Administrator, Wells Fargo Securities, L.L.C. as the Administrative Agent, and Wells Fargo Bank, National Association, as the Collateral Custodian, is structured as a revolving credit facility and matures on October 27, 2016, as amended on May 8, 2012. The maximum amount of revolving borrowings available under the SLF Credit Facility is $175,000,000. The SLF Credit Facility is non-recourse to NMF Holdings and is secured by all assets owned by NMF SLF on an investment by investment basis. All fees associated with the origination or upsizing of the SLF Credit Facility are capitalized on the Consolidated Statement of Assets, Liabilities, and Members’ Capital and charged against income as other credit facility expenses over the life of the SLF Credit Facility. The SLF Credit Facility contains certain customary affirmative and negative covenants and events of default, including the occurrence of a change in control. The covenants are generally not tied to mark to market fluctuations in the prices of our investments, but rather to the performance of the underlying portfolio companies.
The SLF Credit Facility permits borrowings of up to 67.0% of the purchase price of pledged debt securities subject to approval by Wells Fargo Bank, National Association. Due to a fifth amendment to the SLF Credit Facility on October 27, 2011, NMF SLF is no longer restricted from the purchase or sale of loans with an affiliate. Therefore, specified first lien loans can be moved as collateral between the Holdings Credit Facility and the SLF Credit Facility.
The SLF Credit Facility bears interest at a rate of LIBOR plus 2.00% per annum, as amended on May 8, 2012. A non-usage fee is paid, based on the unused facility amount multiplied by the Non-Usage Fee Rate (as defined in the credit agreement). Interest expense and non-usage fees were $995,874 and $8,692, respectively, for the three months ended June 30, 2012. Interest expense and non-usage fees were $2,086,996 and $12,370, respectively, for the six months ended June 30, 2012. Interest expense and non-usage fees were $731,637 and $40,318, respectively, for the three months ended June 30, 2011. Interest expense and non-usage fees were $1,349,394 and $58,168, respectively, for the six months ended June 30, 2011. The weighted average interest rate for the six months ended June 30, 2012 and June 30, 2011 for the facility was 2.4% and 2.5%, respectively. The average debt outstanding for the six months ended June 30, 2012 and June 30, 2011 was $170,106,639 and $108,352,940, respectively. The outstanding balance as of June 30, 2012 and December 31, 2011 was $173,112,281 and $165,928,000, respectively. As of June 30, 2012 and December 31, 2011, NMF SLF was in compliance with all financial and operational covenants required by the SLF Credit Facility.
Leverage risk factors—The Operating Company utilizes and may utilize leverage to the maximum extent permitted by the law for investment and other general business purposes. The Operating Company’s lenders will have fixed dollar claims on certain assets that are superior to the claims of the Operating Company’s unit holders, and therefore NMFC’s common stockholders, and the Operating Company would expect such lenders to seek recovery against these assets in the event of a default. The use of leverage also magnifies the potential for gain or loss on amounts invested. Leverage may magnify interest rate risk (particularly on the Operating
43
Table of Contents
Company’s fixed-rate investments), which is the risk that the prices of portfolio investments will fall or rise if market interest rates for those types of securities rise or fall. As a result, leverage may cause greater changes in the Operating Company’s net asset value. Similarly, leverage may cause a sharper decline in the Operating Company’s income than if the Operating Company had not borrowed. Such a decline could negatively affect the Operating Company’s ability to make dividend payments to its unit holders. Leverage is generally considered a speculative investment technique. The Operating Company’s ability to service any debt incurred will depend largely on financial performance and will be subject to prevailing economic conditions and competitive pressures.
Note 8. Regulation
NMFC and AIV Holdings intend to elect to be treated, and intend to comply with the requirements to qualify annually, as RICs under Subchapter M of the Code, commencing with their taxable years ending on December 31, 2011. In order to qualify as RICs, among other things, NMFC and AIV Holdings are required to timely distribute to their stockholders at least 90.0% of investment company taxable income, as defined by the Code, for each year. NMFC and AIV Holdings, among other things, intend to make and continue to make the requisite distributions to their stockholders, which will generally relieve NMFC and AIV Holdings from U.S. federal, state, and local income taxes (excluding excise taxes which may be imposed under the Code). However, under certain circumstances, the distributions that the Operating Company makes to its members may not be sufficient for AIV Holdings to satisfy the annual distribution requirement necessary for AIV Holdings to qualify as a RIC. In that case, it is expected that Guardian AIV would consent to be treated as if it received distributions from AIV Holdings sufficient to satisfy the annual distribution requirement. Guardian AIV would be required to include the consent dividend in its taxable income as dividend from AIV Holdings, which would result in phantom (i.e., non-cash) taxable income to Guardian AIV.
Additionally as BDCs, the Companies must not acquire any assets other than “qualifying assets” specified in the 1940 Act unless, at the time the acquisition is made, at least 70.0% of its total assets are qualifying assets (with certain limited exceptions).
Note 9. Commitments and Contingencies
In the normal course of business, the Companies may enter into contracts that contain a variety of representations and warranties and which provide general indemnifications. The Operating Company may also enter into future funding commitments such as revolving credit facilities, bridge financing commitments, or delayed draw commitments. As of June 30, 2012, NMF Holdings had unfunded commitments on revolving credit facilities of $13,333,500 and no outstanding bridge financing commitments or other future funding commitments, all of which are disclosed on NMF Holdings’ Consolidated Schedule of Investments. As of December 31, 2011, NMF Holdings had unfunded commitments on revolving credit facilities of $22,698,500, outstanding bridge financing commitments of $35,000,000 and other future funding commitments of $4,250,632, all of which are disclosed on NMF Holdings’ Consolidated Schedule of Investments.
The Operating Company also has revolving borrowings available under the Holdings Credit Facility and the SLF Credit Facility as of June 30, 2012. See Note 7, Borrowing Facilities, for details.
The Operating Company may from time to time enter into financing commitment letters. As of June 30, 2012 and December 31, 2011, the Operating Company did not enter into any commitment letters to purchase debt investments, which could require funding in the future.
Note 10. Stockholders’ Equity
The table below illustrates the effect of certain transactions on the capital accounts of NMFC:
|
|
|
Common Stock |
|
Paid in Capital
in Excess |
|
Undistributed
Net Investment |
|
Accumulated
Undistributed Net |
|
Net Unrealized
Appreciation |
|
Total
Stockholders’ |
|
|
|
|
Shares |
|
Par Amount |
|
of Par |
|
Income |
|
Realized Gains |
|
(Depreciation) |
|
Equity |
|
|
Balance at December 31, 2011 |
|
10,697,691 |
|
$ |
106,977 |
|
$ |
144,248,879 |
|
$ |
— |
|
$ |
286,307 |
|
$ |
844,658 |
|
$ |
145,486,821 |
|
|
Dividends declared |
|
— |
|
— |
|
— |
|
(7,060,476 |
) |
(2,460,469 |
) |
— |
|
(9,520,945 |
) |
|
Net increase in stockholders’ equity resulting from operations |
|
— |
|
— |
|
— |
|
7,459,133 |
|
4,489,412 |
|
74,897 |
|
12,023,442 |
|
|
Balance at June 30, 2012 |
|
10,697,691 |
|
$ |
106,977 |
|
$ |
144,248,879 |
|
$ |
398,657 |
|
$ |
2,315,250 |
|
$ |
919,555 |
|
$ |
147,989,318 |
|
The table below illustrates the effect of certain transactions on the capital accounts of AIV Holdings:
|
|
|
Common Stock |
|
Paid in Capital
in Excess |
|
Undistributed
Net Investment |
|
Accumulated
Undistributed Net |
|
Net Unrealized
(Depreciation) |
|
Total
Stockholders’ |
|
|
|
|
Shares |
|
Par Amount |
|
of Par |
|
Income |
|
Realized Gains |
|
Appreciation |
|
Equity |
|
|
Balance at December 31, 2011 |
|
100 |
|
$ |
1 |
|
$ |
292,383,201 |
|
$ |
— |
|
$ |
(994,034 |
) |
$ |
(16,374,171 |
) |
$ |
275,014,997 |
|
|
Dividends declared |
|
— |
|
— |
|
— |
|
(13,346,479 |
) |
(4,651,046 |
) |
— |
|
(17,997,525 |
) |
|
Net increase in stockholders’ equity resulting from operations |
|
— |
|
— |
|
— |
|
14,100,065 |
|
8,486,375 |
|
141,579 |
|
22,728,019 |
|
|
Balance at June 30, 2012 |
|
100 |
|
$ |
1 |
|
$ |
292,383,201 |
|
$ |
753,586 |
|
$ |
2,841,295 |
|
$ |
(16,232,592 |
) |
$ |
279,745,491 |
|
44
Table of Contents
Note 11. Earnings Per Share
The following information sets forth the computation of basic and diluted net increase in NMFC’s net assets per share resulting from operations for the six months ended June 30, 2012:
|
|
|
Three months ended June 30, 2012 |
|
Six months ended June 30, 2012 |
|
|
Numerator for basic earnings per share: |
|
$ |
3,835,147 |
|
$ |
12,023,442 |
|
|
Denominator for basic weighted average share: |
|
10,697,691 |
|
10,697,691 |
|
|
Basic earnings per share: |
|
$ |
0.36 |
|
$ |
1.12 |
|
|
Numerator for diluted earnings per share(a): |
|
$ |
11,084,760 |
|
$ |
34,751,461 |
|
|
Denominator for diluted weighted average share(b): |
|
30,919,629 |
|
30,919,629 |
|
|
Diluted earnings per share: |
|
$ |
0.36 |
|
$ |
1.12 |
|
(a) Includes full income at the Operating Company for the period.
(b) Assumes AIV Holdings exchanges its units in the Operating Company for public shares of NMFC as of December 31, 2011 (see Note 1, Formation and Business Purpose).
The following information sets forth the computation of basic and diluted net increase in NMFC’s net assets per share resulting from operations for the period May 19, 2011 to June 30, 2011:
|
|
|
May 19, 2011 (commencement
of operations) to June 30, 2011 |
|
|
Numerator for basic earnings per share: |
|
$ |
8,046,223 |
|
|
Denominator for basic weighted average share: |
|
10,697,691 |
|
|
Basic earnings per share: |
|
$ |
0.75 |
|
|
Numerator for diluted earnings per share(a): |
|
$ |
5,276,851 |
|
|
Denominator for diluted weighted average share(b): |
|
30,919,629 |
|
|
Diluted earnings per share: |
|
$ |
0.17 |
|
(a) Includes full income at the Operating Company for the period. Does not include unrealized appreciation in the Operating Company resulting from the IPO.
(b) Assumes AIV Holdings exchanges its units in the Operating Company for public shares of NMFC on May 19, 2011 (see Note 1, Formation and Business Purpose).
Note 12. Financial Highlights
The following information sets forth the financial highlights for the Operating Company for the respective six months ended June 30, 2012 and June 30, 2011.
|
|
|
Six months ended |
|
|
|
|
June 30, 2012 |
|
June 30, 2011 |
|
|
Total return based on net asset value (a) |
|
8.34 |
% |
8.52 |
% |
|
Average net assets for the period |
|
$ |
427,503,622 |
|
$ |
324,243,396 |
|
|
Ratio to average net assets (b): |
|
|
|
|
|
|
Net investment income |
|
10.14 |
% |
11.81 |
% |
|
Total expenses (gross) |
|
8.80 |
% |
3.52 |
% |
|
Total expenses (net of reimbursable expenses) |
|
8.36 |
% |
3.32 |
% |
|
Net assets, end of period |
|
$ |
427,734,809 |
|
$ |
440,605,296 |
|
|
Average debt outstanding—Holdings Credit Facility |
|
$ |
131,527,287 |
|
$ |
53,853,228 |
|
|
Average debt outstanding—SLF Credit Facility |
|
$ |
170,106,639 |
|
$ |
108,352,940 |
|
|
Weighted average shares outstanding |
|
30,919,629 |
|
30,919,629 |
(c) |
|
Asset coverage ratio |
|
237.15 |
% |
373.30 |
% |
|
Portfolio turnover |
|
27.45 |
% |
31.59 |
% |
(a) For the six months ended June 30, 2012, total return is calculated assuming a purchase at net asset value on the opening of the first day of the year and a sale at net asset value on the last day of the period. Dividends and distributions, if any, are assumed for purposes of this calculation, to be reinvested at the net asset value on the last day of the respective quarter. For the six months ended June 30, 2011, total return is calculated in two parts: (1) from the opening of the first day of the year to NMFC’s IPO date, total return is calculated based on net income over weighted average net assets and (2) from NMFC’s IPO date to June 30, 2011, total return is calculated assuming a purchase at net asset value on NMFC’s IPO date and a sale at net asset value on the last day of the period. Dividends and distributions, if any, are assumed for purposes of this calculation, to be reinvested at the net asset value on the last day of the respective quarter.
(b) Ratio to average net assets has been annualized.
(c) Weighted average shares outstanding presented from May 19, 2011 forward as the fund became unitized on that date, the IPO date.
|
|
|
Six months ended
June 30, 2012 |
|
May 19, 2011 (commencement of
operations) to June 30, 2011 |
|
|
Per unit data for the Operating Company: |
|
|
|
|
|
|
Net asset value, January 1, 2012 and May 19, 2011(a), respectively |
|
$ |
13.60 |
|
$ |
14.08 |
|
|
Net investment income |
|
0.70 |
|
0.15 |
|
|
Net realized and unrealized gains |
|
0.42 |
|
0.02 |
|
|
Dividends from net investment income |
|
(0.89 |
) |
— |
|
|
Net increase in net assets resulting from operations |
|
0.23 |
|
0.17 |
|
|
Net asset value, June 30, 2012 and June 30, 2011, respectively |
|
$ |
13.83 |
|
$ |
14.25 |
|
(a) Data presented from May 19, 2011 forward as the fund became unitized on that date, the IPO date.
The following information sets forth the financial highlights for NMFC for the six months ended June 30, 2012 and the period May 19, 2011 to June 30, 2011. The ratios to average net assets have been annualized.
|
|
|
Six months ended
June 30, 2012 |
|
May 19, 2011 (commencement of
operations) to June 30, 2011 |
|
|
Per share data: |
|
|
|
|
|
|
Net asset value, January 1, 2012 and May 19, 2011(a), respectively |
|
$ |
13.60 |
|
$ |
13.50 |
|
|
Net increase in net assets resulting from operations allocated from New Mountain Finance Holdings, L.L.C.: |
|
|
|
|
|
|
Net investment income |
|
0.70 |
|
0.15 |
|
|
Net realized and unrealized gains |
|
0.42 |
|
0.02 |
|
|
Total net increase |
|
1.12 |
|
0.17 |
|
|
Unrealized appreciation in New Mountain Finance Holdings, L.L.C. resulting from public offering price |
|
— |
|
0.58 |
|
|
Dividends declared |
|
(0.89 |
) |
— |
|
|
Net asset value, June 30, 2012 |
|
$ |
13.83 |
|
$ |
14.25 |
|
|
Per share market value, June 30, 2012 |
|
$ |
14.19 |
|
$ |
12.70 |
|
|
Total return based on market value(b) |
|
12.57 |
% |
(7.64 |
)% |
|
Total return based on net asset value(c) |
|
8.34 |
% |
1.24 |
% |
|
Average net assets for the period |
|
$ |
147,909,331 |
|
$ |
151,529,446 |
|
|
Ratio to average net assets: |
|
|
|
|
|
|
Total expenses allocated from New Mountain Finance Holdings, L.L.C. |
|
8.36 |
% |
5.42 |
% |
|
Net investment income allocated from New Mountain Finance Holdings, L.L.C. |
|
10.14 |
% |
9.09 |
% |
(a) Data presented from May 19, 2011 forward as the fund became unitized on that date, the IPO date.
(b) For the six months ended June 30, 2012, total return is calculated assuming a purchase of common stock at the opening of the first day of the year and a sale on the closing of the last business day of the period. Dividends and distributions, if any, are assumed for purposes of this calculation, to be reinvested at prices obtained under NMFC’s dividend reinvestment plan. For the period May 19, 2011 to June 30, 2011, total return is calculated
46
Table of Contents
assuming a purchase of common stock at IPO and a sale on the closing of the last business day of the period. Dividends and distributions, if any, are assumed for purposes of this calculation, to be reinvested at prices obtained under NMFC’s dividend reinvestment plan.
(c) For the six months ended June 30, 2012, total return is calculated assuming a purchase at net asset value on the opening of the first day of the period and a sale at net asset value on the last day of the period. Dividends and distributions, if any, are assumed for purposes of this calculation, to be reinvested at the net asset value on the last day of the respective quarter. For the period May 19, 2011 to June 30, 2011, total return is calculated assuming a purchase at net asset value on the opening of the first day of the period and a sale at net asset value on the last business day of the period. Dividends and distributions, if any, are assumed for purposes of this calculation, to be reinvested at the net asset value on the last day of the respective quarter.
The following information sets forth the financial highlights for AIV Holdings for the six months ended June 30, 2012 and the period May 19, 2011 to June 30, 2011. The ratios to average net assets have been annualized.
|
|
|
Six months ended
June 30, 2012 |
|
May 19, 2011 (commencement of
operations) to June 30, 2011 |
|
|
Total return based on net asset value(a) |
|
8.34 |
% |
(0.92 |
)% |
|
Average net assets for the period |
|
$ |
279,594,290 |
|
$ |
286,437,425 |
|
|
Ratio to average net assets: |
|
|
|
|
|
|
Total expenses |
|
8.36 |
% |
5.42 |
% |
|
Net investment income |
|
10.14 |
% |
9.09 |
% |
|
|
|
|
|
|
|
|
(a) For the six months ended June 30, 2012, total return is calculated assuming a purchase at net asset value on the opening of the first day of the period and a sale at net asset value on the last day of the period. Dividends and distributions, if any, are assumed for purposes of this calculation, to be reinvested at net asset value on the last day of the respective quarter. For the period May 19, 2011 to June 30, 2011, total return is calculated assuming a purchase at net asset value on the opening of the first day of the period and a sale at net asset value on the last business day of the period. Dividends and distributions, if any, are assumed for purposes of this calculation, to be reinvested at the net asset value on the last day of the respective quarter.
Note 13. Recent Accounting Standards Updates
In May 2011, the Financial Accounting Standards Board (“FASB”) issued Accounting Standards Update No. 2011-04, Amendments to Achieve Common Fair Value Measurement and Disclosure Requirements in U.S. GAAP and IFRSs (“ASU 2011-04”), which provides clarification about how to measure fair value and improves comparability of fair value measurements presented and disclosed in accordance with GAAP and International Financial Reporting Standards. The amendments included in ASU 2011-04 clarify the FASB’s intent about the application of existing fair value measurement and disclosure requirements outlined in ASC 820, as well as include some instances of changes to particular principles or requirements. ASU 2011-04 clarifies that (i) the concept of the highest and best use valuation premise applies only to nonfinancial assets, (ii) instruments classified in stockholders’ equity should be valued from the perspective of a market participant that holds that instrument as an asset, and (iii) quantitative information should be disclosed about unobservable inputs used in a fair value measurement that is categorized within Level III of the fair value hierarchy. ASU 2011-04 changes the guidance in (i) permitting an exception to ASC 820 by allowing an entity to measure the fair value of a group of financial assets and financial liabilities exposed to market and credit risks to be consistent with the entity’s net risk exposures, instead of gross risk, (ii) applying premiums and discounts in a fair value measurement lacking a Level I inputs to be consistent with the ASC 820 requirements of fair value measurement but that applying premiums and discounts in a fair value measurement related to size as a characteristic of the holding rather than as a characteristic of the asset or liability is not permitted, and (iii) requiring additional disclosures about fair value measurements categorized within Level III of the fair value hierarchy, including the valuation processes used and the sensitivity of the fair value measurement to changes in unobservable inputs and the interrelationships between those unobservable inputs. ASU 2011-04 is effective for the interim and annual periods beginning after December 15, 2011. The adoption of ASU 2011-04 did not have a significant impact on the Companies’ financial statements. Additional disclosure was added where applicable.
Note 14. Subsequent Events
On July 10, 2012, NMFC’s shelf registration statement became effective. On July 17, 2012, NMFC completed a public offering of 5,250,000 shares of its common stock at a public offering price of $14.35 per share for total gross proceeds of approximately $75,337,500. In connection with the offering, NMFC granted the underwriters for the offering an option to purchase up to an additional 787,500 shares of common stock. Such option remains exercisable until August 11, 2012.
47
Table of Contents
On July 31, 2012, the boards of directors of the Companies each appointed David Malpass as a Class III Director and Adam B. Weinstein as a Class I Director. Additionally Mr. Malpass was appointed to the audit committees, valuation committees and nominating and corporate governance committees of each of the Companies. Mr. Malpass was further appointed to NMFC’s and AIV Holdings’ compensation committees. Mr. Malpass is not an “interested person” of any of the Companies as such term is defined under Section 2(a)(19) of the 1940 Act. Mr. Weinstein is the Chief Financial Officer and Treasurer of each of the Companies and thus, Mr. Weinstein is an “interested person” of each of the Companies as such term is defined under Section 2(a)(19) of the 1940 Act.
On August 7, 2012, the Operating Company entered into a seventh amendment to the Holdings Credit Facility. This amendment increased the maximum amount of revolving borrowings available under the Holdings Credit Facility from $160,000,000 to $185,000,000.
On August 7, 2012, NMF SLF entered into a tenth amendment to the SLF Credit Facility. This amendment increased the maximum amount of revolving borrowings available under the SLF Credit Facility from $175,000,000 to $200,000,000.
On August 8, 2012, the Operating Company’s board of directors, and subsequently NMFC’s board of directors, declared a third quarter 2012 distribution of $0.34 per unit/share payable on September 28, 2012 to holders of record as of September 14, 2012. Subsequently, AIV Holdings’ board of directors declared a dividend payable on September 28, 2012 to holders of record as of September 14, 2012 in an amount equal to $0.34 per unit multiplied by the total number of units owned by AIV Holdings of the Operating Company as of the record date.
48
Table of Contents
REPORT OF INDEPENDENT REGISTERED PUBLIC ACCOUNTING FIRM
To the Boards of Directors of
New Mountain Finance Holdings, L.L.C.,
New Mountain Finance Corporation and
New Mountain Finance AIV Holdings Corporation
New York, New York
We have reviewed the accompanying Consolidated Statement of Assets, Liabilities and Members’ Capital of New Mountain Finance Holdings, L.L.C., including the Consolidated Schedule of Investments as of June 30, 2012, and the related Consolidated Statements of Operations for the three and six month periods ended June 30, 2012 and 2011, and the Consolidated Statements of Changes in Members’ Capital, and Cash Flows for the six month periods ended June 30, 2012 and 2011. Also, we have reviewed the Statements of Assets and Liabilities of New Mountain Finance Corporation and New Mountain Finance AIV Holdings Corporation as of June 30, 2012, and the related Statements of Operations for the three and six month periods ended June 30, 2012 and for the period May 19, 2011 (commencement of operations) to June 30, 2011, and the Statements of Changes in Net Assets and Cash Flows for the six month period ended June 30, 2012 and for the period May 19, 2011 to June 30, 2011. These interim financial statements are the responsibility of the management of New Mountain Finance Holdings, L.L.C., New Mountain Finance Corporation and New Mountain Finance AIV Holdings Corporation.
We conducted our reviews in accordance with the standards of the Public Company Accounting Oversight Board (United States). A review of interim financial information consists principally of applying analytical procedures and making inquiries of persons responsible for financial and accounting matters. It is substantially less in scope than an audit conducted in accordance with the standards of the Public Company Accounting Oversight Board (United States), the objective of which is the expression of an opinion regarding the financial statements taken as a whole. Accordingly, we do not express such an opinion.
Based on our reviews, we are not aware of any material modifications that should be made to such interim financial statements for them to be in conformity with accounting principles generally accepted in the United States of America.
We have previously audited, in accordance with the standards of the Public Company Accounting Oversight Board (United States), the Consolidated Statement of Assets, Liabilities and Members’ Capital of New Mountain Finance Holdings, L.L.C., including the Consolidated Schedule of Investments as of December 31, 2011, the related Consolidated Statements of Operations, Changes in Members’ Capital, and Cash Flows for the year then ended (not presented herein), and the Statements of Assets and Liabilities of New Mountain Finance Corporation and New Mountain Finance AIV Holdings Corporation as of December 31, 2011, the related Statements of Operations, Changes in Net Assets, and Cash Flows for the period May 19, 2011 (commencement of operations) to December 31, 2011 (not presented herein); and in our reports dated March 7, 2012, we expressed unqualified opinions on those financial statements. In our opinion, the information set forth in the accompanying Consolidated Statement of Assets, Liabilities and Members’ Capital of New Mountain Finance Holdings, L.L.C., including the Consolidated Schedule of Investments, and the Statements of Assets and Liabilities of New Mountain Finance Corporation and New Mountain Finance AIV Holdings Corporation as of December 31, 2011, is fairly stated, in all material respects, in relation to the Consolidated Statement of Assets, Liabilities, and Members’ Capital of New Mountain Finance Holdings, L.L.C., including the Consolidated Schedules of Investments, and the Statements of Assets and Liabilities of New Mountain Finance Corporation and New Mountain Finance AIV Holdings Corporation from which they have been derived.
DELOITTE & TOUCHE LLP
New York, New York
August 8, 2012
49
Table of Contents
Item 2. Management’s Discussion and Analysis of Financial Condition and Results of Operations
The information in management’s discussion and analysis of financial condition and results of operations relates to each of the three separate registrants: New Mountain Finance Holdings, L.L.C., New Mountain Finance Corporation and New Mountain Finance AIV Holdings Corporation (collectively, “we”, “us”, “our” or the “Companies”). Information that relates to an individual registrant will be specifically referenced by the respective company. None of the Companies makes any representation as to the information related solely to the other registrants other than itself.
The following analysis of our financial condition and results of operations should be read in conjunction with our financial statements and the combined notes thereto contained elsewhere in this report.
Forward-Looking Statements
The information contained in this section should be read in conjunction with the financial data and financial statements and combined notes thereto appearing elsewhere in this report. Some of the statements in this report (including in the following discussion) constitute forward-looking statements, which relate to future events or the future performance or financial condition of New Mountain Finance Holdings, L.L.C. (“NMF Holdings”, the “Operating Company” or the “Master Fund”), New Mountain Finance Corporation (“NMFC”) or New Mountain Finance AIV Holdings Corporation (“AIV Holdings”). The forward-looking statements contained in this section involve a number of risks and uncertainties, including:
· statements concerning the impact of a protracted decline in the liquidity of credit markets;
· the general economy, including interest and inflation rates, and its impact on the industries in which the Operating Company invests;
· the ability of the Operating Company’s portfolio companies to achieve their objectives;
· the Operating Company’s ability to make investments consistent with its investment objectives, including with respect to the size, nature and terms of its investments;
· the ability of New Mountain Finance Advisers BDC, L.L.C. (the “Investment Adviser”) or its affiliates to attract and retain highly talented professionals;
· actual and potential conflicts of interest with the Investment Adviser and other affiliates of New Mountain Capital Group, L.L.C.; and
· the risk factors set forth in Item 1A.—Risk Factors contained in our annual report on Form 10-K for the year ended December 31, 2011.
Forward-looking statements are identified by their use of such terms and phrases such as “anticipate”, “believe”, “could”, “estimate”, “expect”, “intend”, “may”, “plan”, “potential”, “should”, “will”, “would” or similar expressions. Actual results could differ materially from those projected in the forward-looking statements for any reason, including the factors set forth in Item 1A.—Risk Factors contained in our annual report on Form 10-K for the year ended December 31, 2011.
We have based the forward-looking statements included in this report on information available to us on the date of this report. We assume no obligation to update or revise publicly any forward-looking statements, whether as a result of new information, future events or otherwise, except as required by law. Although we undertake no obligation to revise or update any forward-looking statements, you are advised to consult any additional disclosures that we may make directly to you or through reports that we have filed or in the future may file with the Securities and Exchange Commission, including annual reports on Form 10-K, registration statements on Form N-2 or Form 10, quarterly reports on Form 10-Q and current reports on Form 8-K.
Overview
NMF Holdings is a Delaware limited liability company. NMF Holdings is externally managed and has elected to be treated as a business development company (“BDC”) under the Investment Company Act of 1940, as amended (the “1940 Act”). As such, NMF Holdings is obligated to comply with certain regulatory requirements. NMF Holdings intends to be treated as a partnership for federal income tax purposes for so long as it has at least two members.
50
Table of Contents
NMF Holdings is externally managed by the Investment Adviser. New Mountain Finance Administration, L.L.C. (the “Administrator”) provides the administrative services necessary for operations. The Investment Adviser and Administrator are wholly-owned subsidiaries of New Mountain Capital (defined as New Mountain Capital Group, L.L.C. and its affiliates). New Mountain Capital is a firm with a track record of investing in the middle market and with assets under management (which includes amounts committed, not all of which have been drawn down and invested to date) totaling approximately $9.0 billion as of June 30, 2012. New Mountain Capital focuses on investing in defensive growth companies across its private equity, public equity, and credit investment vehicles. NMF Holdings, formerly known as New Mountain Guardian (Leveraged), L.L.C., was originally formed as a subsidiary of New Mountain Guardian AIV, L.P. (“Guardian AIV”) by New Mountain Capital in October 2008. Guardian AIV was formed through an allocation of approximately $300.0 million of the $5.1 billion of commitments supporting New Mountain Partners III, L.P., a private equity fund managed by New Mountain Capital. In February 2009, New Mountain Capital formed a co-investment vehicle, New Mountain Guardian Partners, L.P., comprising $20.4 million of commitments. New Mountain Guardian (Leveraged), L.L.C. and New Mountain Guardian Partners, L.P., together with their respective direct and indirect wholly- owned subsidiaries, are defined as the “Predecessor Entities”.
NMFC is a Delaware corporation that was originally incorporated on June 29, 2010. NMFC is a closed-end, non-diversified management investment company that has elected to be treated as a BDC under the 1940 Act. As such, NMFC is obligated to comply with certain regulatory requirements. NMFC intends to be treated, and intends to comply with the requirements to qualify annually, as a regulated investment company (“RIC”) under Subchapter M of the Internal Revenue Code of 1986, as amended, (the “Code”) commencing with its taxable year ending on December 31, 2011.
AIV Holdings is a Delaware corporation that was originally incorporated on March 11, 2011. Guardian AIV, a Delaware limited partnership, is AIV Holdings’ sole stockholder. AIV Holdings is a closed-end, non-diversified management investment company that has elected to be treated as a BDC under the 1940 Act. As such, AIV Holdings is obligated to comply with certain regulatory requirements. AIV Holdings intends to be treated, and intends to comply with the requirements to qualify annually, as a RIC under the Code commencing with its taxable year ending on December 31, 2011.
On May 19, 2011, NMFC priced its initial public offering (the “IPO”) of 7,272,727 shares of common stock at a public offering price of $13.75 per share. Concurrently with the closing of the IPO and at the public offering price of $13.75 per share, NMFC sold an additional 2,172,000 shares of its common stock to certain executives and employees of, and other individuals affiliated with, New Mountain Capital in a concurrent private placement (the “Concurrent Private Placement”). Additionally, 1,252,964 shares were issued to the limited partners of New Mountain Guardian Partners, L.P. at that time for their ownership interest in the Predecessor Entities. In connection with NMFC’s IPO and through a series of transactions, NMF Holdings owns all of the operations of the Predecessor Entities, including all of the assets and liabilities related to such operations.
NMFC and AIV Holdings are holding companies with no direct operations of their own, and their sole asset is their ownership in NMF Holdings. NMFC and AIV Holdings each entered into a joinder agreement with respect to the Limited Liability Company Agreement, as amended and restated, of NMF Holdings, pursuant to which NMFC and AIV Holdings were admitted as members of NMF Holdings. NMFC acquired from NMF Holdings, with the gross proceeds of the IPO and the Concurrent Private Placement, common membership units (“units”) of NMF Holdings (the number of units are equal to the number of shares of NMFC’s common stock sold in the IPO and the Concurrent Private Placement). Additionally, NMFC received units of NMF Holdings equal to the number of shares of common stock of NMFC issued to the limited partners of New Mountain Guardian Partners, L.P. Guardian AIV was the parent of NMF Holdings prior to the IPO and, as a result of the transactions completed in connection with the IPO, obtained units in NMF Holdings. Guardian AIV contributed its units in NMF Holdings to its newly formed subsidiary, AIV Holdings, in exchange for common stock of AIV Holdings. AIV Holdings has the right to exchange all or any portion of its units in NMF Holdings for shares of NMFC’s common stock on a one-for-one basis.
As of June 30, 2012, NMFC and AIV Holdings own approximately 34.6% and 65.4%, respectively, of the units of NMF Holdings.
The current structure was designed to generally prevent NMFC from being allocated taxable income with respect to unrecognized gains that existed at the time of the IPO in the Predecessor Entities’ assets, and rather such amounts would be allocated generally to AIV Holdings. The result is that any distributions made to NMFC’s stockholders that are attributable to such gains generally will not be treated as taxable dividends but rather as return of capital.
51
Table of Contents
The diagram below depicts our current organizational structure.
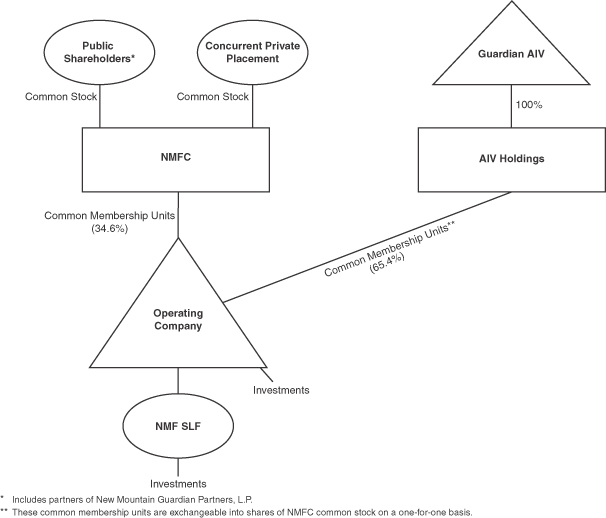
NMF Holdings’ investment objective is to generate current income and capital appreciation through the sourcing and origination of debt securities at all levels of the capital structure, including first and second lien debt, notes, bonds and mezzanine securities. In some cases, NMF Holdings’ investments may also include equity interests. The primary focus is in the debt of defensive growth companies, which are defined as generally exhibiting the following characteristics: (i) sustainable secular growth drivers, (ii) high barriers to competitive entry, (iii) high free cash flow after capital expenditure and working capital needs, (iv) high returns on assets and (v) opportunities for niche market dominance.
As of June 30, 2012, the Operating Company’s net asset value was $427.7 million and its portfolio had a fair value of approximately $751.1 million in 56 portfolio companies, with a weighted average Unadjusted and Adjusted Yield to Maturity of approximately 10.7% and 13.0%, respectively. “Adjusted Yield to Maturity” assumes that the investments in the Operating Company’s portfolio are purchased at fair value on June 30, 2012 and held until their respective maturities with no prepayments or losses and exited at par at maturity. This calculation excludes the impact of existing leverage, except for the non-recourse debt of New Mountain Finance SPV Funding, L.L.C (“NMF SLF”). NMF SLF is treated as a fully levered asset of the Operating Company, with NMF SLF’s net asset value being included for yield calculation purposes. The actual yield to maturity may be higher or lower due to the future selection of the London Interbank Offered Rate (“LIBOR”) contracts by the individual companies in the Operating Company’s portfolio or other factors. References to “Unadjusted Yield to Maturity” have the same assumptions as Adjusted Yield to Maturity except that NMF SLF is not treated as a fully levered asset of the Operating Company, but rather the assets themselves are consolidated into the Operating Company.
52
Table of Contents
Recent Developments
On July 10, 2012, NMFC’s shelf registration statement became effective. On July 17, 2012, NMFC completed a public offering of 5,250,000 shares of its common stock at a public offering price of $14.35 per share for total gross proceeds of approximately $75.3 million. In connection with the offering, NMFC granted the underwriters for the offering an option to purchase up to an additional 787,500 shares of common stock. Such option remains exercisable until August 11, 2012.
On July 31, 2012, the boards of directors of the Companies each appointed David Malpass as a Class III Director and Adam B. Weinstein as a Class I Director. Additionally Mr. Malpass was appointed to the audit committees, valuation committees and nominating and corporate governance committees of each of the Companies. Mr. Malpass was further appointed to NMFC’s and AIV Holdings’ compensation committees. Mr. Malpass is not an “interested person” of any of the Companies as such term is defined under Section 2(a)(19) of the 1940 Act. Mr. Weinstein is the Chief Financial Officer and Treasurer of each of the Companies and thus, Mr. Weinstein is an “interested person” of each of the Companies as such term is defined under Section 2(a)(19) of the 1940 Act.
On August 7, 2012, the Operating Company entered into a seventh amendment to the Holdings Credit Facility. This amendment increased the maximum amount of revolving borrowings available under the Holdings Credit Facility from $160,000,000 to $185,000,000.
On August 7, 2012, NMF SLF entered into a tenth amendment to the SLF Credit Facility. This amendment increased the maximum amount of revolving borrowings available under the SLF Credit Facility from $175,000,000 to $200,000,000.
On August 8, 2012, the Operating Company’s board of directors, and subsequently NMFC’s board of directors, declared a third quarter 2012 distribution of $0.34 per unit/share payable on September 28, 2012 to holders of record as of September 14, 2012. Subsequently, AIV Holdings’ board of directors declared a dividend payable on September 28, 2012 to holders of record as of September 14, 2012 in an amount equal to $0.34 per unit multiplied by the total number of units owned by AIV Holdings of the Operating Company as of the record date.
Critical Accounting Policies
The preparation of financial statements and related disclosures in conformity with generally accepted accounting principles in the United States (“GAAP”) requires management to make estimates and assumptions that affect the reported amounts of assets and liabilities, disclosure of contingent assets and liabilities at the date of the financial statements, and revenues and expenses during the periods reported. Actual results could materially differ from those estimates. We have identified the following items as critical accounting policies.
Basis of Accounting
NMF Holdings consolidates its wholly-owned subsidiary, NMF SLF. NMFC and AIV Holdings do not consolidate the Operating Company. NMFC and AIV Holdings apply investment company master-feeder financial statement presentation, as described in Accounting Standards Codification 946, Financial Services—Investment Companies, (“ASC 946”) to their interest in the Operating Company. NMFC and AIV Holdings observe that it is industry practice to follow the presentation prescribed for a Master Fund-Feeder fund structure in ASC 946 in instances in which a Master Fund is owned by more than one feeder fund and that such presentation provides stockholders of NMFC and AIV Holdings with a clearer depiction of their investment in the Master Fund.
Valuation and Leveling of Portfolio Investments
The Operating Company conducts the valuation of assets, pursuant to which its net asset value, and, consequently, NMFC’s and AIV Holdings’ net asset values are determined, at all times consistent with GAAP and the 1940 Act.
The Operating Company values its assets on a quarterly basis, or more frequently if required under the 1940 Act. In all cases, the Operating Company’s board of directors is ultimately and solely responsible for determining the fair value of its portfolio investments on a quarterly basis in good faith, including investments that are not publicly traded, those whose market prices are not readily available, and any other situation where its portfolio investments require a fair value determination. Security transactions are accounted for on a trade date basis. The Operating Company’s quarterly valuation procedures are set forth in more detail below:
(1) Investments for which market quotations are readily available on an exchange are valued at such market quotations based on the closing price indicated from independent pricing services.
53
Table of Contents
(2) Investments for which indicative prices are obtained from various pricing services and/or brokers or dealers are valued through a multi-step valuation process, as described below, to determine whether the quote(s) obtained is representative of fair value in accordance with GAAP.
a. Bond quotes are obtained through independent pricing services. Internal reviews are performed by the investment professionals of the Investment Adviser to ensure that the quote obtained is representative of fair value in accordance with GAAP and if so, the quote is used. If the Investment Adviser is unable to sufficiently validate the quote(s) internally and if the investment’s par value exceeds the materiality threshold, the investment is valued similarly to those assets with no readily available quotes (see (3) below);
b. For investments other than bonds, the investment professionals of the Investment Adviser look at the number of quotes readily available and perform the following:
i. Investments for which two or more quotes are received from a pricing service are valued using the mean of the mean of the bid and ask of the quotes obtained;
ii. Investments for which one quote is received from a pricing service are validated internally. The investment professionals of the Investment Adviser analyze the market quotes obtained using an array of valuation methods (further described below) to validate the fair value. If the Investment Adviser is unable to sufficiently validate the quote internally and if the investment’s par value exceeds the materiality threshold, the investment is valued similarly to those assets with no readily available quotes (see (3) below).
(3) Investments for which quotations are not readily available through exchanges, pricing services, brokers, or dealers are valued through a multi-step valuation process:
a. Each portfolio company or investment is initially valued by the investment professionals of the Investment Adviser responsible for the credit monitoring;
b. Preliminary valuation conclusions will then be documented and discussed with the Operating Company’s senior management;
c. If an investment falls into (3) above for four consecutive quarters and if the investment’s par value exceeds the materiality threshold, then at least once each fiscal year, the valuation for each portfolio investment for which the investment professionals of the Investment Adviser do not have a readily available market quotation will be reviewed by an independent valuation firm engaged by the Operating Company’s board of directors.
d. Also, when deemed appropriate by the Operating Company’s management, an independent valuation firm may be engaged to review and value investment(s) of a portfolio company, without any preliminary valuation being performed by the Investment Adviser. The investment professionals of the Investment Adviser will review and validate the value provided.
Valuation methods may include comparisons of financial ratios of the portfolio companies that issued such private securities to peer companies that are public, the nature of and the realizable value of any collateral, the portfolio company’s earnings, discounted cash flows, the ability to make payments, the markets in which the portfolio company conducts business, and other relevant factors, including available market data such as relevant and applicable market trading and transaction comparables; applicable market yields and multiples; security covenants; call protection provisions; information rights; comparable merger and acquisition transactions; and the principal market and enterprise values. When an external event such as a purchase transaction, public offering or subsequent sale occurs, we will consider the pricing indicated by the external event to corroborate the private valuation.
The values assigned to investments are based upon available information and do not necessarily represent amounts which might ultimately be realized, since such amounts depend on future circumstances and cannot be reasonably determined until the individual positions are liquidated. Due to the inherent uncertainty of determining the fair value of investments that do not have a readily available market value, the fair value of certain investments may fluctuate from period to period.
GAAP fair value measurement guidance classifies the inputs used in measuring fair value into three levels as follows:
54
Table of Contents
Level I—Quoted prices (unadjusted) are available in active markets for identical investments and NMF Holdings has the ability to access such quotes as of the reporting date. The type of investments which would generally be included in Level I include active exchange-traded equity securities and exchange-traded derivatives. As required by Accounting Standards Codification 820, Fair Value Measurements and Disclosures (“ASC 820”), NMF Holdings, to the extent that we hold such investments, does not adjust the quoted price for these investments, even in situations where NMF Holdings holds a large position and a sale could reasonably impact the quoted price.
Level II—Pricing inputs are observable for the investments, either directly or indirectly, as of the reporting date, but are not the same as those used in Level I. Level II inputs include the following:
· Quoted prices for similar assets or liabilities in active markets;
· Quoted prices for identical or similar assets or liabilities in non-active markets (examples include corporate and municipal bonds, which trade infrequently);
· Pricing models whose inputs are observable for substantially the full term of the asset or liability (examples include most over-the-counter derivatives, including foreign exchange forward contracts); and
· Pricing models whose inputs are derived principally from or corroborated by observable market data through correlation or other means for substantially the full term of the asset or liability.
Level III—Pricing inputs are unobservable for the investment and include situations where there is little, if any, market activity for the investment.
The inputs into the determination of fair value require significant judgment or estimation by management. A review of the fair value hierarchy classifications is conducted on a quarterly basis. Changes in the observability of valuation inputs may result in the reclassification of certain investments within the fair value hierarchy from period to period.
The following table summarizes the levels in the fair value hierarchy that the Operating Company’s portfolio investments fall into as of June 30, 2012:
|
(in thousands) |
|
Total |
|
Level I |
|
Level II |
|
Level III |
|
|
First lien |
|
$ |
435,801 |
|
$ |
— |
|
$ |
393,053 |
|
$ |
42,748 |
|
|
Second lien |
|
283,508 |
|
— |
|
230,233 |
|
53,275 |
|
|
Subordinated |
|
28,958 |
|
— |
|
21,419 |
|
7,539 |
|
|
Equity and other |
|
2,812 |
|
— |
|
— |
|
2,812 |
|
|
Total investments |
|
$ |
751,079 |
|
$ |
— |
|
$ |
644,705 |
|
$ |
106,374 |
|
NMFC and AIV Holdings are holding companies with no direct operations of their own, and their sole asset is their ownership in the Operating Company. NMFC’s and AIV Holdings’ investments in the Operating Company are carried at fair value and represent the pro-rata interest in the net assets of the Operating Company as of the applicable reporting date. NMFC and AIV Holdings value their ownership interest on a quarterly basis, or more frequently if required under the 1940 Act.
NMF Holdings generally uses the following framework when determining the fair value of investments where there are little, if any, market activity or observable pricing inputs.
Company Performance, Financial Review, and Analysis: Prior to investment, as part of its due diligence process, NMF Holdings evaluates the overall performance and financial stability of the portfolio company. Post investment, NMF Holdings analyzes each portfolio company’s current operating performance and relevant financial trends versus prior year and budgeted results, including, but not limited to, factors affecting its revenue and earnings before interest, taxes, depreciation, and amortization (“EBITDA”) growth, margin trends, liquidity position, covenant compliance and changes to its capital structure. NMF Holdings also attempts to identify and subsequently track any developments at the portfolio company, within its customer or vendor base or within the industry or the macroeconomic environment, generally, that may alter any material element of its original investment thesis. This analysis is specific to each portfolio company. NMF Holdings leverages the knowledge gained from its original due diligence process, augmented by this subsequent monitoring, to continually refine its outlook for each of its portfolio companies and ultimately form the valuation of its investment in each portfolio company.
Market Based Approach: NMF Holdings typically estimates the total enterprise value of each portfolio company by utilizing market value cash flow (EBITDA) multiples of publicly traded comparable companies. NMF Holdings carefully considers numerous
55
Table of Contents
factors when selecting the appropriate companies whose trading multiples are used to value its portfolio companies. These factors include, but are not limited to, the type of organization, similarity to the business being valued, relevant risk factors, as well as size, profitability and growth expectations. NMF Holdings generally applies an average of various relevant comparable company EBITDA multiples to the portfolio company’s latest twelve month (“LTM”) EBITDA or projected EBITDA to calculate portfolio company enterprise value. This is done in order to ensure that there is an appropriate level of value coverage for each investment. In applying the market based approach as of June 30, 2012, NMF Holdings used a range of 1.0x to 11.5x relevant EBITDA to determine the enterprise value of its investments. NMF Holdings believes this was a reasonable range in light of current comparable company trading levels and the specific companies involved.
Income Based Approach: NMF Holdings also typically uses a discounted cash flow analysis to estimate the fair value of the investment. Projected cash flows represent the relevant security’s contractual interest, fee and principal payments plus the assumption of full principal recovery at the investment’s expected maturity date. These cash flows are discounted at a rate established utilizing a yield calibration approach, which incorporates changes in the credit quality (as measured by relevant statistics) of the portfolio company, as compared to changes in the yield associated with comparable credit quality market indices, between the date of origination and the valuation date. In applying the income based approach as of June 30, 2012, NMF Holdings used a discount range of 6.4% to 23.3% to value its investments.
Revenue Recognition
The Operating Company’s revenue recognition policies are as follows:
Sales and paydowns of investments: Realized gains and losses on investments are determined on the specific identification method.
Interest income: Interest income, including amortization of premium and discount using the effective interest method, is recorded on the accrual basis and periodically assessed for collectability. Interest income also includes interest earned from cash on hand. Upon the prepayment of a loan or debt security, any prepayment penalties are recorded as part of interest income. The Operating Company has loans in the portfolio that contain a payment-in-kind (“PIK”) provision. PIK represents interest that is accrued and recorded as interest income at the contractual rates, added to the loan principal on the respective capitalization dates, and generally due at maturity.
Non-accrual income: Loans are placed on non-accrual status when principal or interest payments are past due 30 days or more and when there is reasonable doubt that principal or interest will be collected. Accrued cash and un-capitalized PIK interest is generally reversed when a loan is placed on non-accrual status. Previously capitalized PIK interest is not reversed when an investment is placed on non-accrual status. Interest payments received on non-accrual loans may be recognized as income or applied to principal depending upon management’s judgment of the ultimate outcome. Non-accrual loans are restored to accrual status when past due principal and interest is paid and, in management’s judgment, are likely to remain current.
Other income: Other income represents delayed compensation, consent or amendment fees, revolver fees and other miscellaneous fees received. Delayed compensation is income earned from counterparties on trades that do not settle within a set number of business days after trade date.
NMFC’s and AIV Holdings’ revenue recognition policies are as follows:
Revenue, expenses, and capital gains (losses): At each quarterly valuation date, the Operating Company’s investment income, expenses, net realized gains (losses), and net increase (decrease) in unrealized appreciation (depreciation) are allocated to NMFC and AIV Holdings based on their pro-rata interest in the net assets of the Operating Company. This is recorded on NMFC’s and AIV Holdings’ Statements of Operations. NMFC used the proceeds from its IPO and Concurrent Private Placement to purchase units in the Operating Company at $13.75 per unit (its IPO price per share). At the IPO date, $13.75 per unit represented a discount to the actual net asset value per unit of the Operating Company. As a result, NMFC experienced immediate unrealized appreciation on its investment. Concurrently, AIV Holdings experienced immediate unrealized depreciation on its investment in the Operating Company equal to the difference between NMFC’s IPO price of $13.75 per unit and the actual net asset value per unit.
All expenses, including those of NMFC and AIV Holdings, are paid and recorded by the Operating Company. Expenses are allocated to NMFC and AIV Holdings based on pro-rata ownership interest. In addition, the Operating Company paid all of the offering costs related to the IPO. NMFC and AIV Holdings have recorded their portion of the offering costs as a direct reduction to net assets and the cost of their investment in the Operating Company.
56
Table of Contents
With respect to the expenses incident to any registration of shares of NMFC’s common stock issued in exchange for units of the Operating Company, AIV Holdings is responsible for the expenses of any demand registration (including underwriters’ discounts or commissions) and their pro-rata share of any “piggyback” registration expenses. No shares have been exchanged since formation.
57
Table of Contents
Monitoring of Portfolio Investments
The Operating Company monitors the performance and financial trends of its portfolio companies on at least a quarterly basis. The Operating Company attempts to identify any developments at the portfolio company or within the industry or the macroeconomic environment that may alter any material element of its original investment strategy.
The Operating Company uses an investment rating system to characterize and monitor the credit profile and expected level of returns on each investment in the portfolio. The Operating Company uses a four-level numeric rating scale as follows:
· Investment Rating 1—Investment is performing materially above expectations;
· Investment Rating 2—Investment is performing materially in-line with expectations. All new loans are rated 2 at initial purchase;
· Investment Rating 3—Investment is performing materially below expectations and risk has increased materially since the original investment; and
· Investment Rating 4—Investment is performing substantially below expectations and risks have increased substantially since the original investment. Payments may be delinquent. There is meaningful possibility that the Operating Company will not recoup its original cost basis in the investment and may realize a substantial loss upon exit.
As of June 30, 2012, all investments in the Operating Company’s portfolio had an Investment Rating of 1 or 2 with the exception of one investment. As of June 30, 2012, the Operating Company’s original first lien position in ATI Acquisition Company had an Investment Rating of 4 due to the underlying business encountering significant regulatory headwinds which have led to the portfolio company’s underperformance. As of June 30, 2012, the Operating Company’s original first lien position in ATI Acquisition Company remained on non-accrual status due to the inability of the portfolio company to service its interest payments for the quarter then ended and uncertainty about its ability to pay such amounts in the future. As of June 30, 2012, this first lien debt investment had a cost basis of $4.3 million, a fair value of $0.3 million and total unearned interest income of $0.2 million and $0.3 million, respectively, for the three and six months then ended. Additionally, the Operating Company has two super priority first lien debt investments in ATI Acquisition Company with a combined cost basis of $1.6 million and a combined fair value of $1.4 million as of June 30, 2012. Unrealized gains include a fee that the Operating Company would receive upon maturity of the two super priority first lien debt investments. Neither super priority first lien positions are on non-accrual status. As of June 30, 2012, the Operating Company’s total investment in ATI Acquisition Company had an aggregate cost basis of $5.9 million and an aggregate fair value of $1.7 million.
Portfolio and Investment Activity
The fair value of the Operating Company’s investments was approximately $751.1 million in 56 portfolio companies at June 30, 2012 and approximately $703.5 million in 55 portfolio companies at December 31, 2011. For the six months ended June 30, 2012, NMF Holdings made approximately $233.1 million of new investments in 19 portfolio companies. For the six months ended June 30, 2011, NMF Holdings made approximately $244.7 million of new investments in 22 portfolio companies.
For the six months ended June 30, 2012, NMF Holdings had approximately $128.6 million in debt repayments in existing portfolio companies and sales of securities in 12 portfolio companies aggregating approximately $75.2 million. In addition, during the six months ended June 30, 2012, NMF Holdings had a change in unrealized appreciation on 34 portfolio companies totaling approximately $10.0 million, which was offset by a change in unrealized depreciation on 29 portfolio companies totaling approximately $9.8 million. For the six months ended June 30, 2011, NMF Holdings had approximately $102.1 million in debt repayments in existing portfolio companies and sales of securities in nine portfolio companies aggregating approximately $50.1 million. During the six months ended June 30, 2011, NMF Holdings had a change in unrealized appreciation on 33 portfolio companies totaling approximately $6.3 million, which was offset by a change in unrealized depreciation on 22 portfolio companies totaling approximately $12.8 million.
At June 30, 2012, the Operating Company’s weighted average Unadjusted and Adjusted Yield to Maturity was approximately 10.7% and 13.0%, respectively.
Recent Accounting Standards Updates
In May 2011, the Financial Accounting Standards Board (“FASB”) issued Accounting Standards Update No. 2011-04, Amendments to Achieve Common Fair Value Measurement and Disclosure Requirements in U.S. GAAP and IFRSs (“ASU 2011-04”), which provides clarification about how to measure fair value and improves comparability of fair value measurements presented and disclosed in accordance with GAAP and International Financial Reporting Standards. The amendments included in ASU 2011-04 clarify the FASB’s intent about the application of existing fair value measurement and disclosure requirements outlined in ASC 820, as well as include some instances of changes to particular principles or requirements. ASU 2011-04 clarifies that (i) the concept of the
58
Table of Contents
highest and best use valuation premise applies only to nonfinancial assets, (ii) instruments classified in stockholders’ equity should be valued from the perspective of a market participant that holds that instrument as an asset, and (iii) quantitative information should be disclosed about unobservable inputs used in a fair value measurement that is categorized within Level III of the fair value hierarchy. ASU 2011-04 changes the guidance in (i) permitting an exception to ASC 820 by allowing an entity to measure the fair value of a group of financial assets and financial liabilities exposed to market and credit risks to be consistent with the entity’s net risk exposures, instead of gross risk, (ii) applying premiums and discounts in a fair value measurement lacking a Level I inputs to be consistent with the ASC 820 requirements of fair value measurement but that applying premiums and discounts in a fair value measurement related to size as a characteristic of the holding rather than as a characteristic of the asset or liability is not permitted, and (iii) requiring additional disclosures about fair value measurements categorized within Level III of the fair value hierarchy, including the valuation processes used and the sensitivity of the fair value measurement to changes in unobservable inputs and the interrelationships between those unobservable inputs. ASU 2011-04 is effective for the interim and annual periods beginning after December 15, 2011. The adoption of ASU 2011-04 did not have a significant impact on the Companies’ financial statements. Additional disclosure was added where applicable.
Results of Operations
Since NMFC and AIV Holdings are holding companies with no direct operations of their own, and their only business and sole asset are their ownership of common membership units of the Operating Company, NMFC’s and AIV Holdings’ results of operations are based on the Operating Company’s results of operations.
Under GAAP, NMFC’s IPO did not step-up the cost basis of the Operating Company’s existing investments to fair market value at the IPO date. Since the total value of the Operating Company’s investments at the time of the IPO was greater than the investments’ cost basis, a larger amount of amortization of purchase or original issue discount, and different amounts in realized gain and unrealized appreciation, may be recognized under GAAP in each period than if the step-up had occurred. This will remain until such predecessor investments are sold or mature in the future. The Operating Company tracks the transferred (or fair market) value of each of its investment as of the time of the IPO and, for purposes of the incentive fee calculation, adjusts income as if each investment was purchased at the date of the IPO (or stepped up to fair market value). The respective “Adjusted Net Investment Income” (defined as net investment income adjusted to reflect income as if the cost basis of investments held at the IPO date had stepped-up to fair market value as of the IPO date) is used in calculating both the incentive fee and dividend payments. The Operating Company also uses the transferred (or fair market) value of each of its investments as of the time of the IPO to adjust capital gains (“Adjusted Realized Capital Gains”) or losses (“Adjusted Realized Capital Losses”) and unrealized capital appreciation (“Adjusted Unrealized Capital Appreciation”) and unrealized capital depreciation (“Adjusted Unrealized Capital Depreciation”). See Item 1.—Financial Statements—Note 5, Agreements for additional details.
The following table for the Operating Company for the three months ended June 30, 2012 is adjusted to reflect the step-up to fair market value and the allocation of the incentive fees related to hypothetical capital gains out of the adjusted post-incentive fee net investment income.
|
(in thousands) |
|
Three months ended
June 30, 2012 |
|
Stepped-up Cost
Basis Adjustments |
|
Incentive Fee
Adjustments (1) |
|
Adjusted three
months ended
June 30, 2012 |
|
|
Investment income |
|
|
|
|
|
|
|
|
|
|
Interest income |
|
$ |
20,124 |
|
$ |
(825 |
) |
$ |
— |
|
$ |
19,299 |
|
|
Other income |
|
175 |
|
— |
|
— |
|
175 |
|
|
Total investment income |
|
20,299 |
|
(825 |
) |
— |
|
19,474 |
|
|
Total expenses pre-incentive fee |
|
5,882 |
|
— |
|
— |
|
5,882 |
|
|
Pre-Incentive Fee Net Investment Income |
|
14,417 |
|
(825 |
) |
— |
|
13,592 |
|
|
Incentive fee |
|
2,771 |
|
— |
|
(53 |
) |
2,718 |
|
|
Post-Incentive Fee Net Investment Income |
|
11,646 |
|
(825 |
) |
53 |
|
10,874 |
|
|
Net realized gains on investments |
|
11,968 |
|
(4,504 |
) |
— |
|
7,464 |
|
|
Net change in unrealized (depreciation) appreciation of investments |
|
(12,529 |
) |
5,329 |
|
— |
|
(7,200 |
) |
|
Capital gains incentive fees |
|
— |
|
— |
|
(53 |
) |
(53 |
) |
|
Net increase in capital resulting from operations |
|
$ |
11,085 |
|
|
|
|
|
$ |
11,085 |
|
|
|
|
|
|
|
|
|
|
|
|
|
|
|
59
Table of Contents
(1) For the three months ended June 30, 2012, the Operating Company incurred total incentive fees of $2.8 million, of which $0.1 million related to capital gains incentive fees on a hypothetical liquidation basis.
For the three months ended June 30, 2012, the Operating Company had a $0.8 million adjustment to interest income for amortization, a decrease of $4.5 million to net realized gains and an increase of $5.3 million to net change in unrealized (depreciation) appreciation to adjust for the stepped-up cost basis of the transferred investments as discussed above. For the three months ended June 30, 2012, total adjusted interest income of $19.3 million consisted of approximately $17.0 million in cash interest from investments, approximately $0.6 million in payment-in-kind interest from investments, approximately $1.1 million in prepayment fees and net amortization of purchase premiums/discounts and origination fees of approximately $0.6 million. The Operating Company’s Adjusted Net Investment Income was $10.9 million for the three months ended June 30, 2012.
The following table for the Operating Company for the six months ended June 30, 2012 is adjusted to reflect the step-up to fair market value and the allocation of the incentive fees related to hypothetical capital gains out of the adjusted post-incentive fee net investment income.
|
(in thousands) |
|
Six months ended
June 30, 2012 |
|
Stepped-up Cost
Basis Adjustments |
|
Incentive Fee
Adjustments (1) |
|
Adjusted six months
ended
June 30, 2012 |
|
|
Investment income |
|
|
|
|
|
|
|
|
|
|
Interest income |
|
$ |
38,725 |
|
$ |
(1,848 |
) |
$ |
— |
|
$ |
36,877 |
|
|
Other income |
|
596 |
|
— |
|
— |
|
596 |
|
|
Total investment income |
|
39,321 |
|
(1,848 |
) |
— |
|
37,473 |
|
|
Total expenses pre-incentive fee |
|
11,629 |
|
— |
|
— |
|
11,629 |
|
|
Pre-Incentive Fee Net Investment Income |
|
27,692 |
|
(1,848 |
) |
— |
|
25,844 |
|
|
Incentive fee |
|
6,133 |
|
— |
|
(964 |
) |
5,169 |
|
|
Post-Incentive Fee Net Investment Income |
|
21,559 |
|
(1,848 |
) |
964 |
|
20,675 |
|
|
Net realized gains on investments |
|
12,976 |
|
(5,218 |
) |
— |
|
7,758 |
|
|
Net change in unrealized appreciation of investments |
|
216 |
|
7,066 |
|
— |
|
7,282 |
|
|
Capital gains incentive fees |
|
— |
|
— |
|
(964 |
) |
(964 |
) |
|
Net increase in capital resulting from operations |
|
$ |
34,751 |
|
|
|
|
|
$ |
34,751 |
|
|
|
|
|
|
|
|
|
|
|
|
|
|
|
(1) For the six months ended June 30, 2012, the Operating Company incurred total incentive fees of $6.1 million, of which $1.0 million related to capital gains incentive fees on a hypothetical liquidation basis.
For the six months ended June 30, 2012, the Operating Company had a $1.8 million adjustment to interest income for amortization, a decrease of $5.2 million to net realized gains and an increase of $7.0 million to net change in unrealized appreciation (depreciation) to adjust for the stepped-up cost basis of the transferred investments as discussed above. For the six months ended June 30, 2012, total adjusted interest income of $36.9 million consisted of approximately $33.3 million in cash interest from investments, approximately $1.1 million in payment-in-kind interest from investments, approximately $1.3 million in prepayment fees and net amortization of purchase premiums/discounts and origination fees of approximately $1.2 million. The Operating Company’s Adjusted Net Investment Income was $20.7 million for the six months ended June 30, 2012.
In accordance with GAAP, for the six months ended June 30, 2012, the Operating Company accrued $1.0 million of hypothetical capital gains incentive fee based upon the cumulative net Adjusted Realized Capital Gains and Adjusted Realized Capital Losses and the cumulative net Adjusted Unrealized Capital Appreciation and Adjusted Unrealized Capital Depreciation on investments held at the end of each period. Actual amounts paid to the Investment Adviser are consistent with the Investment Management Agreement and are based only on actual Adjusted Realized Capital Gains computed net of all Adjusted Realized Capital Losses and Adjusted Unrealized Capital Depreciation on a cumulative basis from inception through the end of each calendar year as if the entire portfolio was sold at fair value. As of June 30, 2012, no actual capital gains incentive fee was owed under the Investment Management Agreement, as cumulative net Adjusted Realized Gains did not exceed cumulative Adjusted Unrealized Depreciation.
60
Table of Contents
Results of Operations for the Operating Company for the Three Months Ended June 30, 2012 and June 30, 2011
Revenue
|
|
|
Three months ended |
|
Percent |
|
|
(in thousands) |
|
June 30, 2012 |
|
June 30, 2011 |
|
Change |
|
|
Interest income |
|
$ |
20,124 |
|
$ |
12,810 |
|
57 |
% |
|
Other income |
|
175 |
|
306 |
|
(43 |
)% |
|
Total investment income |
|
$ |
20,299 |
|
$ |
13,116 |
|
|
|
The Operating Company’s total investment income increased by $7.2 million for the three months ended June 30, 2012 as compared to the three months ended June 30, 2011. The increase in investment income from the three months ended June 30, 2011 to the three months ended June 30, 2012 was primarily attributable to larger invested balances, driven by the proceeds of the IPO on May 19, 2011 and the Operating Company’s use of leverage from its revolving credit facilities to originate new investments.
Operating Expenses
|
|
|
Three months ended |
|
Percent |
|
|
(in thousands) |
|
June 30, 2012 |
|
June 30, 2011 |
|
Change |
|
|
Incentive fee (1) |
|
$ |
2,771 |
|
$ |
504 |
|
NM |
* |
|
Management fee |
|
2,606 |
|
774 |
|
NM |
* |
|
Interest and other credit facility expenses |
|
2,401 |
|
1,534 |
|
57 |
% |
|
Professional fees |
|
308 |
|
517 |
|
(40 |
)% |
|
Other expenses |
|
567 |
|
233 |
|
143 |
% |
|
Total operating expenses |
|
$ |
8,653 |
|
$ |
3,562 |
|
|
|
* Not meaningful.
(1) For the three months ended June 30, 2012, the total incentive fees incurred of $2.8 million included $0.1 million related to capital gains incentive fees on a hypothetical liquidation basis.
The Operating Company’s total operating expenses increased by $5.1 million for the three months ended June 30, 2012 as compared to the three months ended June 30, 2011. Interest and other credit facility expenses increased by $0.9 million during the three months ended June 30, 2012, because the average debt outstanding increased from $45.2 million to $134.1 million for the Holdings Credit Facility and from $118.1 million to $168.1 million for the SLF Credit Facility for the three months ended June 30, 2011 compared to June 30, 2012.
Additionally, the Operating Company’s management fees and incentive fees increased by $1.8 million and $2.3 million, respectively, for the three months ended June 30, 2012 as compared to the three months ended June 30, 2011. The increase in management and incentive fees from the three months ended June 30, 2011 to the three months ended June 30, 2012 was attributable to larger invested balances, driven by the proceeds of the IPO on May 19, 2011 and the Operating Company’s use of leverage from its revolving credit facilities to originate new investments. In addition, as a result of the IPO on May 19, 2011, the Operating Company pays management fees and incentive fees under its Investment Management Agreement, which provides a different basis for the calculation of these fees as compared to amounts previously paid prior to the completion of the IPO. Prior to the IPO, an affiliate of the Predecessor Entities paid a majority of the management and incentive fees. In addition, historical operating expenses do not reflect the allocation of certain professional fees, administrative and other expenses that have been incurred following the completion of the IPO. Accordingly, the Operating Company’s historical operating expenses are not comparable to its operating expenses after the completion of the IPO.
Net Realized Gains and Net Change in Unrealized (Depreciation) Appreciation
|
|
|
Three months ended |
|
Percent |
|
|
(in thousands) |
|
June 30, 2012 |
|
June 30, 2011 |
|
Change |
|
|
Net realized gains on investments |
|
$ |
11,968 |
|
$ |
6,660 |
|
80 |
% |
|
Net change in unrealized (depreciation) appreciation of investments |
|
(12,529 |
) |
(7,559 |
) |
66 |
% |
|
Total net realized gains and net change in unrealized (depreciation) appreciation of investments |
|
$ |
(561 |
) |
$ |
(899 |
) |
|
|
61
Table of Contents
The Operating Company’s net realized and unrealized gains or losses resulted in a net loss of $0.6 million for the three months ended June 30, 2012 compared to a net loss of $0.9 million for the same period in 2011. We look at net realized and unrealized gains or losses together as movement in unrealized appreciation or depreciation can be the result of realizations. The net loss for the three months ended June 30, 2012 and the three months ended June 30, 2011 were primarily driven by an increase in the cost basis of the Operating Company’s portfolio due to the amortization of purchase discounts and market prices remaining relatively constant during the period.
Results of Operations for the Operating Company for the Six months Ended June 30, 2012 and June 30, 2011
Revenue
|
|
|
Six months ended |
|
Percent |
|
|
(in thousands) |
|
June 30, 2012 |
|
June 30, 2011 |
|
Change |
|
|
Interest income |
|
$ |
38,725 |
|
$ |
23,978 |
|
62 |
% |
|
Other income |
|
596 |
|
350 |
|
70 |
% |
|
Total investment income |
|
$ |
39,321 |
|
$ |
24,328 |
|
|
|
The Operating Company’s total investment income increased by $15.0 million for the six months ended June 30, 2012 as compared to the six months ended June 30, 2011. The increase in investment income from the six months ended June 30, 2011 to the six months ended June 30, 2012 was primarily attributable to larger invested balances, driven by the proceeds of the IPO on May 19, 2011 and the Operating Company’s use of leverage from its revolving credit facilities to originate new investments. Additionally in 2012, the Operating Company’s other income increased due to commitment fees received associated with the closing of its two bridge facilities held as of December 31, 2011 and fees received associated with the early repayments or partial repayments of seven different portfolio companies held by the Operating Company as of December 31, 2011.
Operating Expenses
|
|
|
Six months ended |
|
Percent |
|
|
(in thousands) |
|
June 30, 2012 |
|
June 30, 2011 |
|
Change |
|
|
Incentive fee (1) |
|
$ |
6,133 |
|
$ |
504 |
|
NM |
* |
|
Management fee |
|
5,120 |
|
808 |
|
NM |
* |
|
Interest and other credit facility expenses |
|
4,884 |
|
3,081 |
|
59 |
% |
|
Professional fees |
|
509 |
|
570 |
|
(11 |
)% |
|
Other expenses |
|
1,116 |
|
382 |
|
192 |
% |
|
Total operating expenses |
|
$ |
17,762 |
|
$ |
5,345 |
|
|
|
* Not meaningful.
(1) For the six months ended June 30, 2012, the total incentive fees incurred of $6.1 million included $1.0 million related to capital gains incentive fees on a hypothetical liquidation basis.
The Operating Company’s total operating expenses increased by $12.4 million for the six months ended June 30, 2012 as compared to the six months ended June 30, 2011. Interest and other credit facility expenses increased by $1.8 million during the six months ended June 30, 2012, because the average debt outstanding increased from $53.9 million to $131.5 million for the Holdings Credit Facility and from $108.4 million to $170.1 million for the SLF Credit Facility for the six months ended June 30, 2011 compared to June 30, 2012.
Additionally, the Operating Company’s management fees and incentive fees increased by $4.3 million and $5.6 million, respectively, for the six months ended June 30, 2012 as compared to the six months ended June 30, 2011. As a result of the IPO on May 19, 2011, the Operating Company pays management fees and incentive fees under its Investment Management Agreement, which provides a different basis for the calculation of these fees as compared to amounts previously paid prior to the completion of the IPO. Prior to the IPO, an affiliate of the Predecessor Entities paid a majority of the management and incentive fees. In addition, historical operating expenses do not reflect the allocation of certain professional fees, administrative and other expenses that have been incurred following the completion of the IPO. Accordingly, the Operating Company’s historical operating expenses are not comparable to its operating expenses after the completion of the IPO.
62
Table of Contents
Net Realized Gains and Net Change in Unrealized (Depreciation) Appreciation
|
|
|
Six months ended |
|
Percent |
|
|
(in thousands) |
|
June 30, 2012 |
|
June 30, 2011 |
|
Change |
|
|
Net realized gains on investments |
|
$ |
12,976 |
|
$ |
12,552 |
|
3 |
% |
|
Net change in unrealized appreciation (depreciation) of investments |
|
216 |
|
(6,462 |
) |
(103 |
)% |
|
Total net realized gains and net change in unrealized (depreciation) appreciation of investments |
|
$ |
13,192 |
|
$ |
6,090 |
|
|
|
The Operating Company’s net realized and unrealized gains or losses resulted in a net gain of $13.2 million for the six months ended June 30, 2012 compared to a net gain of $6.1 million for the same period in 2011. We look at net realized and unrealized gains or losses together as movement in unrealized appreciation or depreciation can be the result of realizations. The net gain for the six months ended June 30, 2012 was primarily related to the overall increase in the market and the quality of the Operating Company’s portfolio, directly impacting the prices of the Operating Company’s portfolio. The net gain for the six months ended June 30, 2011 was primarily driven by the appreciation of the Operating Company’s portfolio and the sale or repayment of investments with fair values in excess of December 31, 2010 valuations, resulting in net realized gains being greater than the reversal of the cumulative net unrealized gains for those investments.
Liquidity and Capital Resources
The primary use of existing funds and any funds raised in the future is expected to be for the Operating Company’s repayment of indebtedness, the Operating Company’s investments in portfolio companies, cash distributions to the Operating Company’s unit holders or for other general corporate purposes.
Guardian AIV and New Mountain Guardian Partners, L.P. contributed a portfolio to the Operating Company in connection with the IPO of NMFC, receiving 20,221,938 units of NMF Holdings and 1,252,964 shares of NMFC, respectively. On May 19, 2011, NMFC priced its initial offering of 7,272,727 shares of common stock at a public offering price of $13.75 per share. Concurrently with the closing of the IPO and at the public offering price of $13.75 per share, NMFC sold an additional 2,172,000 shares of its common stock to certain executives and employees of, and other individuals affiliated with, New Mountain Capital in the Concurrent Private Placement. NMFC used the gross proceeds from the IPO and Concurrent Private Placement to acquire units in NMF Holdings.
The Operating Company’s liquidity is generated and generally available through advances from the revolving credit facilities, from cash flows from operations, and, we expect, through periodic follow-on equity offerings of NMFC.
At June 30, 2012 and December 31, 2011, the Operating Company had cash and cash equivalents of approximately $9.5 million and $15.3 million, respectively. Cash (used in) operating activities for the six months ended June 30, 2012 and June 30, 2011 was approximately $(0.1) million and $(150.2) million, respectively. We expect that all current liquidity needs by the Operating Company will be met with cash flows from operations and other activities.
Credit Facilities
Holdings Credit Facility—The Loan and Security Agreement, as amended and restated, dated May 19, 2011 (the “Holdings Credit Facility”) among NMF Holdings as the Borrower and Collateral Administrator, Wells Fargo Securities, L.L.C. as the Administrative Agent, and Wells Fargo Bank, National Association, as the Collateral Custodian, is structured as a revolving credit facility and matures on October 27, 2016, as amended on May 8, 2012. The maximum amount of revolving borrowings available under the Holdings Credit Facility is $160.0 million. The Operating Company is permitted to borrow up to 45.0% or 25.0% of the purchase price of pledged first lien or non-first lien debt securities, and up to 67.0% and 45.0% of the purchase price of specified first lien debt securities and specified non-first lien debt securities, respectively, subject to approval by Wells Fargo Bank, National Association. The credit facility is collateralized by all of the investments of the Operating Company on an investment by investment basis. All fees associated with the origination or upsizing of the Holdings Credit Facility are capitalized on the Operating Company’s Consolidated Statement of Assets, Liabilities, and Members’ Capital and charged against income as other credit facility expenses over the life of the Holdings Credit Facility. The Holdings Credit Facility contains certain customary affirmative and negative covenants and events of default, including the occurrence of a change in control. In addition, the Holdings Credit Facility requires the Operating Company to maintain a minimum asset coverage ratio. However, the covenants are generally not tied to mark to market fluctuations in the prices of the Operating Company’s investments, but rather to the performance of the underlying portfolio companies.
The Holdings Credit Facility (as well as the Predecessor Credit Facility) bears interest at a rate of LIBOR plus 2.75% per annum, as amended on May 8, 2012, and charges a non-usage fee, based on the unused facility amount multiplied by the Non-Usage
63
Table of Contents
Fee Rate (as defined in the credit agreement). Interest expense and non-usage fees were $1.0 million and $33.6 thousand, respectively, for the three months ended June 30, 2012. Interest expense and non-usage fees were $2.1 million and $72.8 thousand, respectively, for the six months ended June 30, 2012. Interest expense and non-usage fees were $0.4 million and $0.2 million, respectively, for the three months ended June 30, 2011. Interest expense and non-usage fees were $0.9 million and $0.4 million, respectively, for the six months ended June 30, 2011. The weighted average interest rate for the six months ended June 30, 2012 and June 30, 2011 was 3.2% and 3.2%, respectively. The average debt outstanding for the six months ended June 30, 2012 and June 30, 2011 was $131.5 million and $53.9 million, respectively. The outstanding balance as of June 30, 2012 and December 31, 2011 was $138.8 million and $129.0 million, respectively. As of June 30, 2012 and December 31, 2011, the Operating Company was in compliance with all financial and operational covenants required by the credit facilities existing on such dates.
SLF Credit Facility—The Operating Company’s senior loan fund’s Loan and Security Agreement, as amended and restated, dated October 27, 2010 (the “SLF Credit Facility”) among NMF SLF as the Borrower, NMF Holdings as the Collateral Administrator, Wells Fargo Securities, L.L.C. as the Administrative Agent, and Wells Fargo Bank, National Association, as the Collateral Custodian, is structured as a revolving credit facility and matures on October 27, 2016, as amended on May 8, 2012. The maximum amount of revolving borrowings available under the SLF Credit Facility is $175.0 million. The loan is non-recourse to the Operating Company and secured by all assets owned by the borrower on an investment by investment basis. All fees associated with the origination or upsizing of the SLF Credit Facility are capitalized on the Consolidated Statement of Assets, Liabilities, and Members’ Capital and charged against income as other credit facility expenses over the life of the SLF Credit Facility. The SLF Credit Facility contains certain customary affirmative and negative covenants and events of default, including the occurrence of a change in control. The covenants are generally not tied to mark to market fluctuations in the prices of our investments, but rather to the performance of the underlying portfolio companies.
The SLF Credit Facility permits borrowings of up to 67.0% of the purchase price of pledged debt securities subject to approval by Wells Fargo Bank, National Association. Due to a fifth amendment to the SLF Credit Facility on October 27, 2011, NMF SLF is no longer restricted from the purchase or sale of loans with an affiliate. Therefore, specified first lien loans can be moved as collateral between the Holdings Credit Facility and the SLF Credit Facility.
The SLF Credit Facility bears interest at a rate of LIBOR plus 2.00% per annum, as amended on May 8, 2012. A non-usage fee is paid, based on the unused facility amount multiplied by the Non-Usage Fee Rate (as defined in the credit agreement). Interest expense and non-usage fees were $1.0 million and $8.7 thousand, respectively, for the three months ended June 30, 2012. Interest expense and non-usage fees were $2.1 million and $12.4 thousand, respectively, for the six months ended June 30, 2012. Interest expense and non-usage fees were $0.7 million and $40.3 thousand, respectively, for the three months ended June 30, 2011. Interest expense and non-usage fees were $1.3 million and $58.2 thousand, respectively, for the six months ended June 30, 2011. The weighted average interest rate for the six months ended June 30, 2012 and June 30, 2011 for the facility was 2.4% and 2.5%, respectively. The average debt outstanding for the six months ended June 30, 2012 and June 30, 2011 was $170.1 million and $108.4 million, respectively. The outstanding balance as of June 30, 2012 and December 31, 2011 was $173.1 million and $165.9 million, respectively. As of June 30, 2012 and December 31, 2011, NMF SLF was in compliance with all financial and operational covenants required by the SLF Credit Facility.
Off-Balance Sheet Arrangements
NMF Holdings may become a party to financial instruments with off-balance sheet risk in the normal course of business to meet the financial needs of its portfolio companies. These instruments may include commitments to extend credit and involve, to varying degrees, elements of liquidity and credit risk in excess of the amount recognized in the balance sheet. As of June 30, 2012 and December 31, 2011, the Operating Company had outstanding commitments to third parties to fund investments totaling $13.3 million and $27.0 million, respectively, under various undrawn revolving credit facilities, delayed draw commitments or other future funding commitments.
NMF Holdings may from time to time enter into financing commitment letters or bridge financing commitments. As of June 30, 2012 and December 31, 2011, the Operating Company did not have any commitment letters to purchase debt investments. As of June 30, 2012 and December 31, 2011, the Operating Company had bridge financing commitments in an aggregate par amount of $0 million and $35.0 million, respectively, which could require funding in the future.
Borrowings
The Operating Company had borrowings of $138.8 million and $129.0 million outstanding as of June 30, 2012 and December 31, 2011, respectively, under the Holdings Credit Facility. The Operating Company had borrowings of $173.1 million and $165.9 million outstanding as of June 30, 2012 and December 31, 2011, respectively, under the SLF Credit Facility.
Contractual Obligations
A summary of the Operating Company’s significant contractual payment obligations as of June 30, 2012 is as follows:
64
Table of Contents
|
|
|
|
|
Contractual Obligations
Payments Due by Period
(in thousands) |
|
|
|
|
|
|
Total |
|
Less than
1 Year |
|
1 - 3
Years |
|
3 - 5
Years |
|
More than
5 Years |
|
|
Holdings Credit Facility(1) |
|
$ |
138,757 |
|
$ |
— |
|
$ |
— |
|
$ |
138,757 |
|
$ |
— |
|
|
SLF Credit Facility(2) |
|
173,112 |
|
— |
|
— |
|
173,112 |
|
— |
|
|
Total Contractual Obligations |
|
$ |
311,869 |
|
$ |
— |
|
$ |
— |
|
$ |
311,869 |
|
$ |
— |
|
(1) Under the terms of the $160.0 million Holdings Credit Facility, all outstanding borrowings under that facility ($138.8 million as of June 30, 2012) must be repaid on or before October 27, 2016. As of June 30, 2012, there was approximately $21.2 million of possible capacity remaining under the Holdings Credit Facility.
(2) Under the terms of the $175.0 million SLF Credit Facility, all outstanding borrowings under that facility ($173.1 million as of June 30, 2012) must be repaid on or before October 27, 2016. As of June 30, 2012, there was $1.9 million of possible capacity remaining under the SLF Credit Facility.
NMF Holdings has certain contracts under which it has material future commitments. The Operating Company has $13.3 million of undrawn funding commitments as of June 30, 2012 related to its participation as a lender in revolving credit facilities, delayed draw commitments or other future funding commitments of the Operating Company’s portfolio companies. As of June 30, 2012, the Operating Company did not enter into any bridge financing commitments, which could require funding in the future.
We have entered into the Investment Management Agreement with the Investment Adviser in accordance with the 1940 Act. Under the Investment Management Agreement, the Investment Adviser has agreed to provide the Operating Company with investment advisory and management services. We have agreed to pay for these services (1) a management fee and (2) an incentive fee based on its performance.
We have also entered into an administration agreement, as amended and restated (the “Administration Agreement”), with the Administrator. Under the Administration Agreement, the Administrator has agreed to arrange office space for us and provide office equipment and clerical, bookkeeping and record keeping services and other administrative services necessary to conduct our respective day-to-day operations. The Administrator has also agreed to perform, or oversee the performance of, our financial records, our reports to stockholders / unit holders and reports filed with the Securities and Exchange Commission.
If any of the contractual obligations discussed above are terminated, our costs under any new agreements that are entered into may increase. In addition, we would likely incur significant time and expense in locating alternative parties to provide the services we expect to receive under the Investment Management Agreement and the Administration Agreement.
Distributions and Dividends
Dividends declared to stockholders / unit holders of the Companies for the six months ended June 30, 2012 totaled $27.5 million, of which $6.9 million remained as an outstanding payable as of June 30, 2012 to AIV Holdings only and its stockholders. Tax characteristics of all dividends paid by NMFC and AIV Holdings are reported to stockholders on Form 1099 after the end of the calendar year. Future quarterly dividends, if any, for the Companies will be determined by their respective board of directors.
The following table summarizes the Operating Company’s and NMFC’s quarterly cash distributions, including dividends and returns of capital, if any, per unit/share that have been declared by the Operating Company’s board of directors, and subsequently NMFC’s board of directors, since NMFC’s IPO:
|
Fiscal Year Ended |
|
Date Declared |
|
Record Date |
|
Payment Date |
|
Per
Share/Unit
Amount |
|
|
December 31, 2012 |
|
|
|
|
|
|
|
|
|
|
Second Quarter |
|
May 8, 2012 |
|
June 15, 2012 |
|
June 29, 2012 |
|
$ |
0.34 |
|
|
Second Quarter (1) |
|
May 8, 2012 |
|
May 21, 2012 |
|
May 31, 2012 |
|
0.23 |
|
|
First Quarter |
|
March 7, 2012 |
|
March 15, 2012 |
|
March 30, 2012 |
|
0.32 |
|
|
|
|
|
|
|
|
|
|
|
|
|
December 31, 2011 |
|
|
|
|
|
|
|
|
|
|
Fourth Quarter |
|
November 8, 2011 |
|
December 15, 2011 |
|
December 30, 2011 |
|
$ |
0.30 |
|
|
Third Quarter |
|
August 10, 2011 |
|
September 15, 2011 |
|
September 30, 2011 |
|
0.29 |
|
|
Second Quarter |
|
August 10, 2011 |
|
August 22, 2011 |
|
August 31, 2011 |
|
0.27 |
|
|
|
|
|
|
|
|
|
|
|
|
|
Total |
|
|
|
|
|
|
|
$ |
1.75 |
|
(1) Special dividend related to estimated realized capital gains attributable to the Operating Company’s investments in Lawson Software, Inc. and Infor Lux Bond Company.
The following table summarizes AIV Holdings’ quarterly cash distributions, including dividends and returns of capital, if any, that have been declared by the Operating Company’s board of directors on a per share/unit basis, and subsequently AIV Holdings’ board of directors, since NMFC’s IPO:
|
Fiscal Year Ended |
|
Date Declared |
|
Record Date |
|
Payment Date |
|
Amount (in
millions) (1) |
|
|
December 31, 2012 |
|
|
|
|
|
|
|
|
|
|
Second Quarter |
|
May 8, 2012 |
|
June 15, 2012 |
|
June 29, 2012 (2) |
|
$ |
6.9 |
|
|
Second Quarter (3) |
|
May 8, 2012 |
|
May 21, 2012 |
|
May 31, 2012 |
|
4.6 |
|
|
First Quarter |
|
March 7, 2012 |
|
March 15, 2012 |
|
March 30, 2012 (4) |
|
6.5 |
|
|
|
|
|
|
|
|
|
|
|
|
|
December 31, 2011 |
|
|
|
|
|
|
|
|
|
|
Fourth Quarter |
|
November 8, 2011 |
|
December 15, 2011 |
|
December 30, 2011 |
|
$ |
6.1 |
|
|
Third Quarter |
|
August 10, 2011 |
|
September 15, 2011 |
|
September 30, 2011 |
|
5.9 |
|
|
Second Quarter |
|
August 10, 2011 |
|
August 22, 2011 |
|
August 31, 2011 |
|
5.4 |
|
|
|
|
|
|
|
|
|
|
|
|
|
Total |
|
|
|
|
|
|
|
$ |
35.4 |
|
(1) As of the respective record dates, AIV Holdings owned 20,221,938 units of the Operating Company. AIV Holdings received a total dividend for the respective amounts and subsequently AIV Holdings’ board of directors declared total dividends in the same amounts payable to the holders of record as of the respective record dates.
(2) Actual cash payment was made on July 9, 2012.
(3) Special dividend related to estimated realized capital gains attributable to the Operating Company’s investments in Lawson Software, Inc. and Infor Lux Bond Company.
(3) Actual cash payment was made on April 4, 2012.
Since NMFC and AIV Holdings are holding companies, all distributions on their common stock will be paid from distributions received from the Operating Company. The Operating Company intends to make distributions to its unit holders that will be sufficient to enable NMFC and AIV Holdings to pay quarterly distributions to their stockholders and to obtain and maintain their status as RICs. Under certain circumstances, the distributions that the Operating Company makes to its members may not be sufficient for AIV Holdings to satisfy the annual distribution requirement necessary for AIV Holdings to qualify as a RIC. In that case, it is expected that Guardian AIV would consent to be treated as if it received distributions from AIV Holdings sufficient to satisfy the annual distribution requirement. Guardian AIV would be required to include the consent dividend in its taxable income as a dividend from AIV Holdings, which would result in phantom (i.e., non-cash) taxable income to Guardian AIV. AIV Holdings intends to make quarterly distributions to Guardian AIV out of assets legally available for distribution each quarter. NMFC intends to distribute approximately its entire portion of the Operating Company’s Adjusted Net Investment Income on a quarterly basis and substantially its entire portion of the Operating Company’s taxable income on an annual basis, except that it may retain certain net capital gains for reinvestment.
NMFC maintains an “opt out” dividend reinvestment plan for its common stockholders. As a result, if the Operating Company declares a dividend, then NMFC stockholders’ cash dividends will be automatically reinvested in additional shares of NMFC’s common stock, unless they specifically “opt out” of the dividend reinvestment plan so as to receive cash dividends. Cash dividends reinvested in additional shares of NMFC’s common stock will be automatically reinvested by NMFC in NMF Holdings in exchange for additional units of the Operating Company. See Item 1—Financial Statements—Note 2, Summary of Significant Accounting Policies for additional details regarding NMFC’s dividend reinvestment plan.
AIV Holdings does not intend to reinvest any distributions received in additional units of the Operating Company.
Related Parties
The Companies have entered into a number of business relationships with affiliated or related parties, including the following:
66
Table of Contents
· Together, NMFC and AIV Holdings own all the outstanding units of the Operating Company. As of June 30, 2012, NMFC and AIV Holdings own approximately 34.6% and 65.4%, respectively, of the units of the Operating Company.
· NMF Holdings has entered into the Investment Management Agreement with the Investment Adviser, a wholly-owned subsidiary of New Mountain Capital. Therefore, New Mountain Capital is entitled to any profits earned by the Investment Adviser, which includes any fees payable to the Investment Adviser under the terms of the Investment Management Agreement, less expenses incurred by the Investment Adviser in performing its services under the Investment Management Agreement.
· The Companies have entered into an Administration Agreement, with the Administrator, a wholly-owned subsidiary of New Mountain Capital. The Administrator arranges office space for the Companies and provides office equipment and administrative services necessary to conduct their respective day-to-day operations pursuant to the Administration Agreement. The Operating Company reimburses the Administrator for the allocable portion of overhead and other expenses incurred by it in performing its obligations to the Companies under the Administration Agreement, including rent, the fees and expenses associated with performing administrative, finance, and compliance functions, and the compensation of the Operating Company’s chief financial officer and chief compliance officer and their respective staffs. Pursuant to the Administration Agreement, as amended and restated, and further restricted by the Operating Company, expenses payable to the Administrator by the Operating Company as well as other direct and indirect expenses (excluding interest and other credit facility expense and management and incentive fees) has been capped at $3.5 million for the time period from April 1, 2012 to March 31, 2013.
· The Companies, the Investment Adviser and the Administrator have entered into a royalty-free Trademark License Agreement, as amended, with New Mountain Capital, pursuant to which New Mountain Capital has agreed to grant the Companies, the Investment Adviser and the Administrator, a non-exclusive, royalty-free license to use the name “New Mountain” and “New Mountain Finance”.
In addition, NMFC and the Operating Company have adopted a formal code of ethics that governs the conduct of their respective officers and directors. These officers and directors also remain subject to the duties imposed by the 1940 Act, the Delaware General Corporation Law and the Delaware Limited Liability Company Act.
The Investment Adviser and its affiliates may also manage other funds in the future that may have investment mandates that are similar, in whole and in part, with the Operating Company’s investment mandates. The Investment Adviser and its affiliates may determine that an investment is appropriate for the Operating Company and for one or more of those other funds. In such event, depending on the availability of such investment and other appropriate factors, the Investment Adviser or its affiliates may determine that we should invest side-by-side with one or more other funds. Any such investments will be made only to the extent permitted by applicable law and interpretive positions of the Securities and Exchange Commission and its staff, and consistent with the Investment Adviser’s allocation procedures.
Concurrently with the IPO, NMFC sold an additional 2,172,000 shares of its common stock to certain executives and employees of, and other individuals affiliated with, New Mountain Capital in the Concurrent Private Placement.
Item 3. Quantitative and Qualitative Disclosures About Market Risk
NMF Holdings is subject to certain financial market risks, such as interest rate fluctuations. During the six months ended June 30, 2012, certain of the loans held in the Operating Company’s portfolio had floating interest rates. Interest rates on the loans held within the Operating Company’s portfolio of investments are typically based on floating LIBOR, with many of these assets also having a LIBOR floor. Additionally, the Operating Company’s senior secured revolving credit facilities are also subject to floating interest rates and are currently paid based on one-month floating LIBOR rates.
The following table estimates the potential changes in net cash flow generated from interest income and expenses, should interest rates increase by 100, 200 or 300 basis points, or decrease by 25 basis points. Interest income is calculated as revenue from interest generated from the Operating Company’s portfolio of investments held on June 30, 2012. Interest expense is calculated based on the terms of the Operating Company’s two outstanding revolving credit facilities. For the Operating Company’s floating rate credit facilities, NMF Holdings uses the outstanding balance as of June 30, 2012. Interest expense on the Operating Company’s floating rate credit facilities are calculated using the interest rate as of June 30, 2012, adjusted for the hypothetical changes in rates, as shown below. The base interest rate case assumes the rates on the Operating Company’s portfolio investments remain unchanged from the actual effective interest rates as of June 30, 2012. These hypothetical calculations are based on a model of the investments in our portfolio, held as of June 30, 2012, and are only adjusted for assumed changes in the underlying base interest rates.
67
Table of Contents
Actual results could differ significantly from those estimated in the table.
|
Change in Interest Rates |
|
Estimated
Percentage
Change in Interest
Income Net of
Interest Expense (unaudited) |
|
|
–25 Basis Points |
|
0.90 |
% |
|
Base Interest Rate |
|
— |
% |
|
+100 Basis Points |
|
(3.47 |
)% |
|
+200 Basis Points |
|
0.95 |
% |
|
+300 Basis Points |
|
6.98 |
% |
The Operating Company was not exposed to any foreign currency exchange risks as of June 30, 2012.
Item 4. Controls and Procedures
(a) Evaluation of Disclosure Controls and Procedures
As of June 30, 2012 (the end of the period covered by this report), we, including our Chief Executive Officer and Chief Financial Officer, evaluated the effectiveness of the design and operation of our disclosure controls and procedures (as defined in Rule 13a-15(e) of the Securities Act of 1934, as amended). Based on that evaluation, our management, including the Chief Executive Officer and Chief Financial Officer, concluded that our disclosure controls and procedures were effective and provided reasonable assurance that information required to be disclosed in our periodic Securities and Exchange Commission filings is recorded, processed, summarized and reported within the time periods specified in the Securities and Exchange Commission’s rules and forms, and that such information is accumulated and communicated to our management, including our Chief Executive Officer and Chief Financial Officer, as appropriate, to allow timely decisions regarding required disclosure. However, in evaluating the disclosure controls and procedures, management recognized that any controls and procedures, no matter how well designed and operated can provide only reasonable assurance of achieving the desired control objectives, and management necessarily was required to apply its judgment in evaluating the cost-benefit relationship of such possible controls and procedures.
(b) Changes in Internal Controls Over Financial Reporting
Management has not identified any change in the Companies’ internal control over financial reporting that occurred during the second quarter of 2012 that has materially affected, or is reasonably likely to materially affect, the Companies’ internal control over financial reporting.
68
Table of Contents
PART II. OTHER INFORMATION
The terms “we”, “us”, “our” and the “Companies” refers to the collective: New Mountain Finance Holdings, L.L.C., New Mountain Finance Corporation and New Mountain Finance AIV Holdings Corporation.
Item 1. Legal Proceedings
We, New Mountain Finance Advisers BDC, L.L.C. and New Mountain Finance Administration, L.L.C., are not currently subject to any material pending legal proceedings threatened against us. From time to time, we may be a party to certain legal proceedings incidental to the normal course of our business including the enforcement of our rights under contracts with our portfolio companies. While the outcome of these legal proceedings cannot be predicted with certainty, we do not expect that these proceedings will have a material effect upon our business, financial condition or results of operations.
Item 1A. Risk Factors
In addition to the other information set forth in this report, you should carefully consider the factors discussed in Item 1A. Risk Factors in our Annual Report on Form 10-K for the fiscal year ended December 31, 2011, which could materially affect our business, financial condition and/or operating results. The risks described in our Annual Report on Form 10-K are not the only risks facing the Companies. Additional risks and uncertainties not currently known to us or that we currently deem to be immaterial also may materially and adversely affect our business, financial condition and/or operating results. There have been no material changes during the six months ended June 30, 2012 to the risk factors discussed in Item 1A. Risk Factors in our Annual Report on Form 10-K for the year ended December 31, 2011.
Item 2. Unregistered Sales of Equity Securities and Use of Proceeds
We did not engage in unregistered sales of securities during the quarter ended June 30, 2012.
Issuer Purchases of Equity Securities
For the quarter ended June 30, 2012, as a part of NMFC’s dividend reinvestment plan for its common stockholders, NMFC’s transfer agent purchased 56,338 shares of its common stock for $0.8 million in the open market in order to satisfy the reinvestment portion of its dividends. The following chart outlines repurchases of NMFC’s common stock during the quarter ended June 30, 2012.
|
Month of Dividend Payment |
|
Total
Number of
Shares
Purchased |
|
Weighted
Average
Price Paid
per Share |
|
Total Number
of Shares
Purchased as
Part of Publicly
Announced
Plans or
Programs |
|
Maximum
Number (or
Approximate
Dollar Value) of
Shares that May
Yet Be Purchased
Under the Plans
or Programs |
|
|
April 2012 |
|
— |
|
$ |
— |
|
— |
|
$ |
— |
|
|
May 2012 |
|
43,826 |
|
13.97 |
|
— |
|
— |
|
|
June 2012 |
|
12,512 |
|
14.67 |
|
— |
|
— |
|
|
Total |
|
56,338 |
|
$ |
14.13 |
|
— |
|
$ |
— |
|
Item 3. Defaults Upon Senior Securities
None.
Item 4. Mine Safety Disclosures
Not applicable.
Item 5. Other Information
None.
69
Table of Contents
Item 6. Exhibits
(a) Exhibits
The following exhibits are filed as part of this report or hereby incorporated by reference to exhibits previously filed with the Securities and Exchange Commission:
|
Exhibit
Number |
|
Description |
|
2.1 |
|
Merger Agreement, dated May 19, 2011 by and between New Mountain Finance Holdings, L.L.C. and New Mountain Guardian Debt Funding, L.L.C.(5) |
|
|
|
|
|
2.2 |
|
Merger Agreement, dated May 19, 2011 by and between New Mountain Guardian Partners Debt Funding, L.L.C. and New Mountain Guardian Partners (Leveraged), L.L.C.(5) |
|
|
|
|
|
2.3 |
|
Merger Agreement, dated May 19, 2011 by and between New Mountain Finance Holdings, L.L.C. and New Mountain Guardian Partners (Leveraged), L.L.C.(5) |
|
|
|
|
|
3.1(a) |
|
Certificate of Incorporation of New Mountain Guardian Corporation(3) |
|
|
|
|
|
3.1(b) |
|
Certificate of Amendment to Certificate of Incorporation of New Mountain Guardian Corporation changing its name to New Mountain Finance Corporation(1) |
|
|
|
|
|
3.1(c) |
|
Amended and Restated Certificate of Incorporation of New Mountain Finance Corporation(4) |
|
|
|
|
|
3.1(d) |
|
Certificate of Formation of New Mountain Guardian (Leveraged), L.L.C.(1) |
|
|
|
|
|
3.1(e) |
|
Certificate of Amendment to Certificate of Formation of New Mountain Guardian (Leveraged), L.L.C. changing its name to New Mountain Finance Holdings, L.L.C.(5) |
|
|
|
|
|
3.1(f) |
|
Certificate of Incorporation of New Mountain Finance AIV Holdings Corporation(6) |
|
|
|
|
|
3.1(g) |
|
Amended and Restated Certificate of Incorporation of New Mountain Finance AIV Holdings Corporation(9) |
|
|
|
|
|
3.1(h) |
|
Certificate of Change of Registered Agent and/or Registered Office of New Mountain Finance Corporation(7) |
|
|
|
|
|
3.1(i) |
|
Certificate of Change of Registered Agent and/or Registered Office of New Mountain Finance AIV Holdings Corporation(7) |
|
|
|
|
|
3.2(a) |
|
Bylaws of New Mountain Finance Corporation(3) |
|
|
|
|
|
3.2(b) |
|
Amended and Restated Bylaws of New Mountain Finance Corporation(4) |
|
|
|
|
|
3.3 |
|
Bylaws of New Mountain Finance AIV Holdings Corporation(6) |
|
|
|
|
|
4.1 |
|
Form of Stock Certificate of New Mountain Finance Corporation(1) |
|
|
|
|
|
4.2 |
|
Form of Stock Certificate of New Mountain Finance AIV Holdings Corporation(2) |
|
|
|
|
|
10.1 |
|
Amended and Restated Limited Liability Company Agreement of New Mountain Finance Holdings, L.L.C.(5) |
|
|
|
|
|
10.2 |
|
First Joinder Agreement with Respect to the Amended and Restated Limited Liability Company Agreement of New Mountain Finance Holdings, L.L.C.(5) |
70
Table of Contents
|
10.3 |
|
Second Joinder Agreement with Respect to the Amended and Restated Limited Liability Company Agreement of New Mountain Finance Holdings, L.L.C.(5) |
|
|
|
|
|
10.4 |
|
Amendment No. 1 to the Amended and Restated Limited Liability Company Agreement of New Mountain Finance Holdings, L.L.C.(8) |
|
|
|
|
|
10.5 |
|
Letter Agreement relating to entry into Amended and Restated Loan and Security Agreement by and among New Mountain Finance Holdings, L.L.C., as Borrower and Collateral Administrator, each of the lenders thereto, Wells Fargo Securities, LLC, as Administrative Agent and Wells Fargo Bank, National Association, as Collateral Custodian.(1) |
|
|
|
|
|
10.6 |
|
Form of Variable Funding Note of New Mountain Finance Holdings, L.L.C., as the Borrower(1) |
|
|
|
|
|
10.7 |
|
Form of Amended and Restated Account Control Agreement among New Mountain Finance Holdings, L.L.C., Wells Fargo Securities, LLC as the Administrative Agent and Wells Fargo Bank, National Association, as Securities Intermediary(1) |
|
|
|
|
|
10.8 |
|
First Amendment to Amended and Restated Loan and Security Agreement between New Mountain Finance Holdings, L.L.C., as Borrower, Wells Fargo Securities, LLC, as Administrative Agent and Wells Fargo Bank, National Association, as Lender(8) |
|
|
|
|
|
10.9 |
|
Second Amendment to Amended and Restated Loan and Security Agreement between New Mountain Finance Holdings, L.L.C., as Borrower, Wells Fargo Securities, LLC, as Administrative Agent and Wells Fargo Bank, National Association, as Lender(8) |
|
|
|
|
|
10.10 |
|
Third Amendment to Amended and Restated Loan and Security Agreement between New Mountain Finance Holdings, L.L.C., as Borrower, Wells Fargo Securities LLC, as Administrative Agent and Wells Fargo Bank, National Association, as Lender(8) |
|
|
|
|
|
10.11 |
|
Sixth Amendment to Amended and Restated Loan and Security Agreement between New Mountain Finance Holdings, L.L.C., as Borrower, Wells Fargo Securities LLC, as Administrative Agent and Wells Fargo Bank, National Association, as Lender (11) |
|
|
|
|
|
10.12 |
|
Seventh Amendment to Amended and Restated Loan and Security Agreement between New Mountain Finance Holdings, L.L.C., as Borrower, Wells Fargo Securities, LLC, as Administrative Agent, and Wells Fargo Bank, National Association, as Collateral Custodian |
|
|
|
|
|
10.13 |
|
Loan and Security Agreement by and among New Mountain Guardian (Leveraged), L.L.C., as Collateral Administrator, New Mountain Guardian SPV Funding, L.L.C., as Borrower, each of the lenders party thereto, Wells Fargo Securities, LLC, as Administrative Agent, and Wells Fargo Bank, National Association, as Collateral Custodian(1) |
|
|
|
|
|
10.14 |
|
First Amendment to Loan and Security Agreement between New Mountain Guardian SPV Funding, L.L.C., as Borrower, Wells Fargo Securities, LLC, as Administrative Agent, and Wells Fargo Bank, National Association, as Lender(1) |
|
|
|
|
|
10.15 |
|
Second Amendment to Loan and Security Agreement between New Mountain Guardian SPV Funding, L.L.C., as Borrower, Wells Fargo Securities, LLC, as Administrative Agent, and Wells Fargo Bank, National Association, as Lender(1) |
|
|
|
|
|
10.16 |
|
Third Amendment to Loan and Security Agreement between New Mountain Guardian SPV Funding, L.L.C., as Borrower, Wells Fargo Securities, LLC, as Administrative Agent, and Wells Fargo Bank, National Association, as Lender(8) |
|
|
|
|
|
10.17 |
|
Fourth Amendment to Loan and Security Agreement between New Mountain Finance SPV Funding, L.L.C., as Borrower, Wells Fargo Securities, LLC, as Administrative Agent, and Wells Fargo Bank, National Association, as Lender(8) |
|
|
|
|
|
10.18 |
|
Fifth Amendment to Loan and Security Agreement between New Mountain SPV Funding, L.L.C., as Borrower, Wells Fargo Securities, LLC, as Administrative Agent, and Wells Fargo Bank, National Association, as Lender(8) |
|
|
|
|
|
10.19 |
|
Ninth Amendment to Loan and Security Agreement between New Mountain Finance SPV Funding, L.L.C., as Borrower, Wells Fargo Securities, LLC, as Administrative Agent and Wells Fargo Bank, National Association, as Lender (11) |
|
|
|
|
|
10.20 |
|
Tenth Amendment to Amended and Restated Loan and Security Agreement between New Mountain Finance SPV Funding, L.L.C. , as Borrower, Wells Fargo Securities, LLC, as Administrative Agent, and Wells Fargo Bank, National Association, as Lender |
71
Table of Contents
|
10.21 |
|
Account Control Agreement by and between New Mountain Guardian SPV Funding, L.L.C., as Pledgor, Wells Fargo Securities, LLC, as Administrative Agent on behalf of the Secured Parties, and Wells Fargo Bank, N.A., as Securities Intermediary(1) |
|
|
|
|
|
10.22 |
|
Variable Funding Note of New Mountain Guardian SPV Funding, L.L.C., as the Borrower(10) |
|
|
|
|
|
10.23 |
|
Form of Amended and Restated Investment Advisory and Management Agreement(10) |
|
|
|
|
|
10.24 |
|
Form of Safekeeping Agreement among New Mountain Finance Holdings, L.L.C., Wells Fargo Securities, LLC as the Administrative Agent and Wells Fargo Bank, National Association, as Safekeeping Agent(1) |
|
|
|
|
|
10.25 |
|
Amended and Restated Administration Agreement(8) |
|
|
|
|
|
10.26 |
|
Form of Trademark License Agreement(1) |
|
|
|
|
|
10.27 |
|
Amendment No. 1 to Trademark License Agreement(8) |
|
|
|
|
|
10.28 |
|
Form of Registration Rights Agreement(1) |
|
|
|
|
|
10.29 |
|
Form of Indemnification Agreement by and between New Mountain Finance Corporation and each director(1) |
|
|
|
|
|
10.30 |
|
Form of Indemnification Agreement by and between New Mountain Finance Holdings, L.L.C. and each director(1) |
|
|
|
|
|
10.31 |
|
Dividend Reinvestment Plan(4) |
|
|
|
|
|
11.1 |
|
Computation of Per Share Earnings for New Mountain Finance Corporation (included in the notes to the financial statements contained in this report) |
|
|
|
|
|
31.1 |
|
Certification of Chief Executive Officer pursuant to Rule 13a-14(a) of the Securities Exchange Act of 1934, as amended |
|
|
|
|
|
31.2 |
|
Certification of Chief Financial Officer pursuant to Rule 13a-14(a) of the Securities Exchange Act of 1934, as amended |
|
|
|
|
|
32.1 |
|
Certification of Chief Executive Officer pursuant to Section 906 of The Sarbanes-Oxley Act of 2002 (18 U.S.C. 1350) |
|
|
|
|
|
32.2 |
|
Certification of Chief Financial Officer pursuant to Section 906 of The Sarbanes-Oxley Act of 2002 (18 U.S.C. 1350) |
(1) Previously filed in connection with New Mountain Finance Holdings, L.L.C.’s registration statement on Form N-2 Pre-Effective Amendment No. 3 (File Nos. 333-168280 and 333-172503) filed on May 9, 2011.
(2) Previously filed in connection with New Mountain Finance AIV Holdings Corporation’s registration statement on Form 10 (File No. 000-54412), filed May 19, 2011.
(3) Previously filed in connection with New Mountain Finance Corporation’s registration statement on Form N-2 (File No. 333-168280) filed on July 22, 2010.
(4) Previously filed in connection with New Mountain Finance Corporation’s quarterly report on Form 10-Q filed on August 11, 2011.
(5) Previously filed in connection with New Mountain Finance Holdings, L.L.C.’s quarterly report on Form 10-Q filed on August 11, 2011.
(6) Previously filed in connection with New Mountain Finance AIV Holdings Corporation’s quarterly report on Form 10-Q filed on August 23, 2011.
(7) Previously filed in connection with New Mountain Finance Corporation and New Mountain Finance AIV Holdings Corporation report on Form 8-K filed on August 25, 2011.
(8) Previously filed in connection with New Mountain Finance Corporation’s quarterly report on Form 10-Q filed on November 14, 2011.
72
Table of Contents
(9) Previously filed in connection with New Mountain Finance AIV Holdings Corporation’s report on Form 8-K filed on February 29, 2012.
(10) Previously filed as Annex A to New Mountain Finance Corporation’s, New Mountain Finance Holdings, L.L.C.’s and New Mountain Finance AIV Holdings Corporations’ Joint Proxy Materials on Schedule 14A filed on March 28, 2012.
(11) Previously filed in connection with New Mountain Finance Corporation’s quarterly report on Form 10-Q filed May 8, 2012.
73
Table of Contents
SIGNATURES
Pursuant to the requirements of Section 13 or 15(d) of the Securities Exchange Act of 1934, the Registrants have duly caused this report to be signed on its behalf by the undersigned, thereunto duly authorized on August 8, 2012.
|
|
NEW MOUNTAIN FINANCE HOLDINGS, L.L.C.
NEW MOUNTAIN FINANCE CORPORATION
NEW MOUNTAIN FINANCE AIV HOLDINGS CORPORATION |
|
|
|
|
|
|
|
|
|
|
By: |
/s/ ROBERT A. HAMWEE |
|
|
|
Robert A. Hamwee |
|
|
|
Chief Executive Officer |
|
|
|
(Principal Executive Officer) |
|
|
|
|
|
|
By: |
/s/ ADAM B. WEINSTEIN |
|
|
|
Adam B. Weinstein |
|
|
|
Chief Financial Officer |
|
|
|
(Principal Financial and Accounting Officer) |
74